and food composition database regarding trans-fatty acids …
TRANSCRIPT
DEVELOPMENT OF A KNOWLEDGE SURVEY AND FOOD COMPOSITION DATABASE
REGARDING TRANS-FATTY ACIDS
by
JENNY D’LAINE STROVAS, B.S.
A Thesis
In
NUTRITIONAL SCIENCES
Submitted to the Graduate Faculty of Texas Tech University in
Partial Fulfillment of the Requirements for
the Degree of
MASTER OF SCIENCE
Approved
Brent Shriver, Ph.D. Committee Chair
Carmen Roman-Shriver, Ph.D.
Committee Member
Mallory Boylan, Ph.D. Committee Member
John Borrelli
Dean of the Graduate School
August, 2007
Texas Tech University, Jenny Strovas, August 2007
ii
ACKNOWLEDGEMENTS
I would like to thank my mentor, Dr. Brent Shriver, for his constant support and
encouragement throughout this research project and the completion of my master’s
degree. His counsel, both professionally and personally, has made this degree an
unforgettable experience during which I have learned so much. I would also like to thank
Dr. Carmen Roman-Shriver for her scholarly advice and expertise. Without her, the
survey would not have been the success it became. I would like to thank Dr. Mallory
Boylan for her time and support during this project. Her exceptional research advice was
invaluable. Special thanks go to Dr. James Surles and Dr. Du Feng for their statistical
expertise and assistance.
I would also like to thank my family and friends. My husband, Shawn Strovas,
continuously expressed his love, encouragement, and patience during the last couple of
years and I could not have made it through this degree without his support. My parents,
Gregg and Debbie Lloyd, taught me the importance of having a diligent work ethic,
which they have displayed continuously throughout their lives. I want to thank my dad
for understanding the frustrations involved in completing a master’s degree and my mom
for her constant willingness to help. My brother, Chad Lloyd, taught me the importance
of being content in the life you’re given, even when things are not going the way you had
planned. Finally, I want to thank my two best friends, Nova Coker and Haley McCall.
Nova always found the right words to say when I needed encouragement and Haley’s
undying smile could always put me in good spirits.
Texas Tech University, Jenny Strovas, August 2007
iii
TABLE OF CONTENTS
ACKNOWLEDGEMENTS………………………………………………………………ii
ABSTRACT……………………………………………………………………………...vi
LIST OF TABLES………………………………………………………………….…..viii
CHAPTER
I. INTRODUCTION…………………………………………………………...1
Thesis Components………………………………………………..2
Conclusion………………………………………………………...3
II. REVIEW OF LITERATURE…………………………………………...…..5
Background………………………………………………………..5
Hydrogenation…………………………………………….5
Ruminant Trans-Fatty Acids……………………………....6
FDA Regulation…………………………………………...7
Estimated Intake of Americans…………………………....8
Trans-Fatty Acid Knowledge……………………………...9
Trans-Fatty Acids around the World……………………...9
Trans-Fatty Acids in the News…………………………...11
Associated Health Risk…………………………………………..13
Trans-Fatty Acids and Coronary Heart Disease………...13
Trans-Fatty Acids and Cancer…………………………...14
Trans-Fatty Acids and Obesity/Type II Diabetes………...15
Trans-Fatty Acids and Allergies…………………………17
Texas Tech University, Jenny Strovas, August 2007
iv
Trans-Fatty Acids and Breastfeeding…………………....17
Conclusion……………………………………………………….18
III. METHODS…………………………………………………………...........19
Food Composition Database of Trans-Fat Content……………...19
Trans-Fat Data Collection……………………………….19
Trans-Fat Data Analysis………………………………....20
Trans-Fat Survey………………………………………………....21
Survey Development……………………………………...21
Validity Pilot Test………………………………………..24
Reliability Pilot Test……………………………………..26
Participant Incentives……………………………………27
Statistical Analysis……………………………………….28
Human Subjects Approval………………………………..28
IV. RESULTS AND DISCUSSION……………………………………...........30
Trans-Fat Database………………………………………………30
Trans-Fat Values………………………………………...30
Trans-Fat Labeling……………………………………....31
Trans-Fat Survey………………………………………………....33
Sample Size……………………………………………....33
Incentives………………………………………………...35
Demographics……………………………………………36
Calculating Knowledge Score…………………………....36
Item Difficulty…………………………………………....37
Texas Tech University, Jenny Strovas, August 2007
v
Item Discrimination……………………………………...38
Chronbach’s Alpha………………………………………38
Test-Retest Reliability………………………………...….39
Factor Analysis…………………………………………..41
ANOVA Comparisons of Factor Scores……………….....42
Conclusion……………………………………………………….43
Tables 1-10……………………………………………………….45
V. CONCLUSION…………………………………………………………….59
Trans-Fat Database………………………………………………59
Trans-Fat Survey…………………………………………………60
LITERATURE CITED…………………………………………………………………..63
APPENDICES…………………………………………………………………………...67
A. TABLES………………………………...………………………………….67
1. Pearson Correlations for the Two Reliability Groups………......67
2. ANOVA Comparisons of Categories ………………...…....…...70
3. Comparison of Food Data on Products that Contain Trans-Fats…………………………..………………..…………71
B. PRELIMINARY TRANS-FATTY ACID SURVEY…………………...…90
C. PILOT TEST TRANS-FATTY ACID SURVEY………………………...108
D. FINAL TRANS-FATTY ACID SURVEY……………………………….129
Texas Tech University, Jenny Strovas, August 2007
vi
ABSTRACT
Food Composition Database of Trans-Fat Content
A food composition database was compiled in order to determine foods which
still had a significant amount of trans-fats post January 2006. Approximately 3,188
national brand name foods were included in the database, and 17% were found to contain
trans-fatty acids after the implementation of the labeling law. However, the ingredients
section of the food label was not checked for the presence of partially hydrogenated oil.
Trans-fat values were calculated according to grams per 100 grams of food product
which allowed for comparison of all foods regardless of varying serving sizes. This
information will aid consumers across the United States in buying food products with the
lowest amount of trans-fat possible.
Trans-Fat Survey
A trans-fat survey was developed and pilot tested post January 2006 to determine what
the public knew about trans-fats after changes in the food labeling laws were
implemented. The project was designed to create a valid and reliable instrument for
measuring a variety of parameters related to trans-fat, such as knowledge, attitude, belief,
behavior, and self efficacy in faculty members, students, and staff of Texas Tech
University. This population, although not directly representative of the nation as a whole,
would provide insight to the country’s current trans-fat knowledge levels. The survey
Texas Tech University, Jenny Strovas, August 2007
vii
was initially developed with 54 items, but the final measure only had 41 items. The
results from this pilot test justify the use of this tool to measure knowledge because it has
the ability to discriminate between groups of varying knowledge levels. Knowing the
current knowledge level of a population is vital as the enforcement of new regulations
regarding trans-fats take effect. If the public is uneducated in regards to trans-fat, then
they will not have the tools required to make smart food choices.
Texas Tech University, Jenny Strovas, August 2007
viii
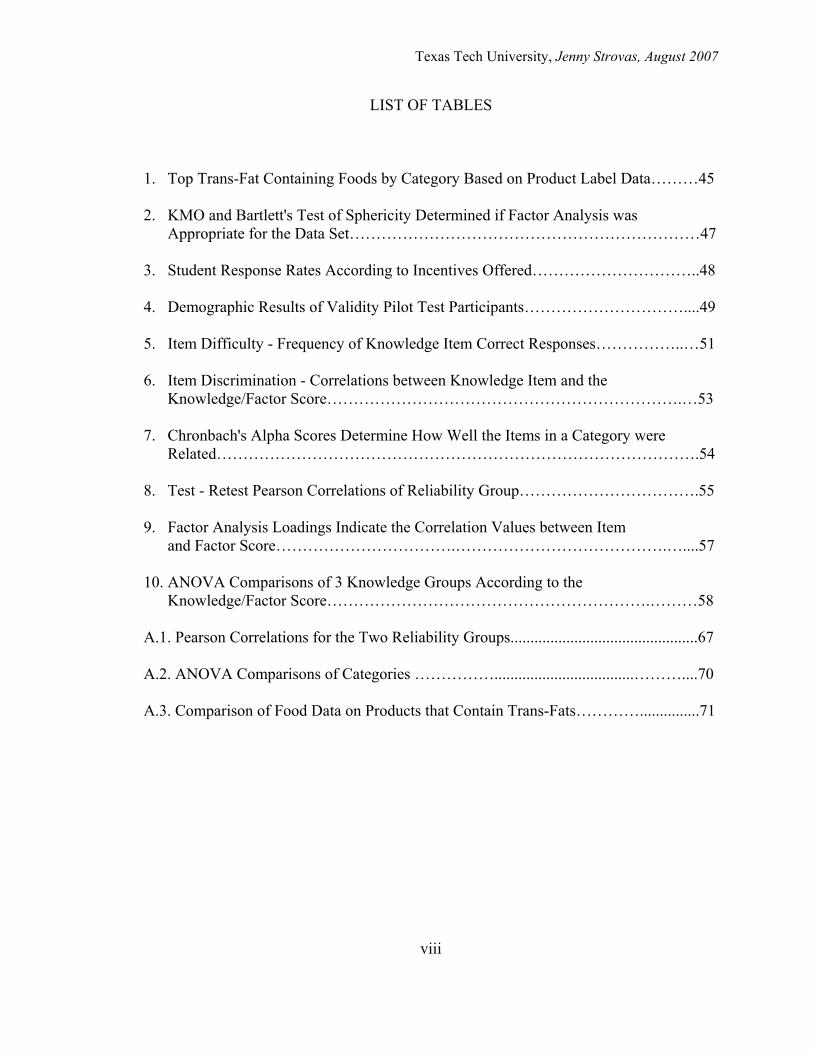
LIST OF TABLES
1. Top Trans-Fat Containing Foods by Category Based on Product Label Data………45 2. KMO and Bartlett's Test of Sphericity Determined if Factor Analysis was
Appropriate for the Data Set…………………………………………………………47 3. Student Response Rates According to Incentives Offered…………………………..48 4. Demographic Results of Validity Pilot Test Participants…………………………....49 5. Item Difficulty - Frequency of Knowledge Item Correct Responses……………..…51 6. Item Discrimination - Correlations between Knowledge Item and the
Knowledge/Factor Score………………………………………………………….…53 7. Chronbach's Alpha Scores Determine How Well the Items in a Category were
Related……………………………………………………………………………….54 8. Test - Retest Pearson Correlations of Reliability Group…………………………….55 9. Factor Analysis Loadings Indicate the Correlation Values between Item
and Factor Score…………………………….………………………………….…....57 10. ANOVA Comparisons of 3 Knowledge Groups According to the
Knowledge/Factor Score…………………………………………………….………58 A.1. Pearson Correlations for the Two Reliability Groups...............................................67
A.2. ANOVA Comparisons of Categories ……………...................................………....70
A.3. Comparison of Food Data on Products that Contain Trans-Fats…………...............71
Texas Tech University, Jenny Strovas, August 2007
1
CHAPTER I
INTRODUCTION
Trans-fatty acids are unsaturated fats with at least one double bond in the trans-
configuration, resulting in a more rigid molecule that is similar to a saturated fatty acid
(Larque et al., 2001). These fats are normally formed during industrial hydrogenation of
vegetable oils for food manufacturing and are typically found in fast foods, bakery
products, packaged snacks, and margarines (Mozaffarian et al., 2004). Approximately
80-90% of trans-fats consumed by Americans are from hydrogenated products (Harnack
et al., 2003); however, the other 10-20% are naturally occurring from ruminant products
such as beef, goat meat, mutton, and dairy (Bensadoun, 2003; Lock et al., 2003).
Trans-fats, produced during hydrogenation, provide no known benefit to human
health (Harnack et al., 2003), but are suspected to increase the chances of developing
certain diseases such as coronary heart disease, cancer, and diabetes. Studies suggest that
estimates of trans-fatty acid intake among Americans range from a low of 2.6 grams/day
to a high of 12.8 grams/day (Allison et al., 1999). The Food and Drug Administration
(FDA) estimates that the average daily intake is 5.8 grams, or 2.6% of calories (Lock et
al., 2003).
The FDA issued a ruling in July of 2003 which declared that effective January 1,
2006, all food and dietary supplement makers were required to disclose trans-fat content
on their product labels (Ault, 2003). This ruling did not require a percent daily value
since there was no scientific basis to determine a daily value (Moss, 2006). The labeling
threshold for trans-fatty acids is set at 0.5 grams per serving (Lock et al., 2003);
Texas Tech University, Jenny Strovas, August 2007
2
therefore, a food company can lower their product’s trans-fat content by simply lowering
the serving size.
This ruling has the potential to confuse consumers who wish to purchase foods
with little or no trans-fat content. Because of these labeling issues it is important to
develop a database with standardized trans-fat values which can be easily compared by
any consumer. Also, it is important to understand what the consumers currently know
about trans-fats so education programs can be developed.
Thesis Components
The first component of this project involved compiling a food composition
database in which only fat containing foods were included. This information was
collected at a United Supermarket located in Lubbock, TX. Food composition values
were recorded after January 2006 to ensure the most complete database of trans-fat
content. After data collection, food items were compared to assess what kinds of foods
still contain trans-fats and in what amounts.
The purpose of the food composition database was to determine foods which still
had a significant amount of trans-fats post January 2006. Serving size and trans-fat
amounts were evaluated to determine if products which seem to have a small amount of
trans-fat actually had a large amount. This information will aid consumers across the
United States in buying food products with the lowest amount of trans-fat possible.
The second component involved developing and pilot testing a trans-fat knowledge
survey. The survey was conducted post January 2006 to determine what the public knew
Texas Tech University, Jenny Strovas, August 2007
3
about trans-fats after changes in the food labeling laws were implemented. The survey
was also designed to determine behavior, belief, attitude, and self efficacy towards trans-
fats. The testing of this measurement tool focused on the following issues:
• Test-retest reliability (Pearson’s correlation tests the reproducibility of a set of items by administering the survey twice over a period of time when no change in knowledge is expected);
• Internal consistency (Chronbach’s alpha tests how well a group of items measure
the same issue);
• Face and content validity (tests how appropriate a set of items are according to untrained judges and experts);
• Construct validity (tests how meaningful an instrument is by discriminating
between people with different knowledge levels).
The purpose of the trans-fat survey was to determine knowledge, attitude, belief,
behavior, and self efficacy in faculty members, students, and staff of Texas Tech
University. This population, although not directly representative of the nation as a whole,
would provide insight to the country’s current trans-fat knowledge levels. Knowing the
current knowledge level of a population is vital as the enforcement of new regulations
regarding trans-fats take effect. If the public is uneducated in regards to trans-fat then
they will not have the tools required to make smart food choices.
Conclusion
It is imperative that we, as a nation, are educated in regards to trans-fats.
Education will give us the tools to make healthy choices and therefore reduce the risk of
heart disease and possibly other life threatening diseases in our population. The first step

Texas Tech University, Jenny Strovas, August 2007
4
in educating the public is to determine what they already know and which foods contain
trans-fats in commercially available food products. Without this information, our efforts
to make trans-fat content available on food products will be futile.
Texas Tech University, Jenny Strovas, August 2007
5
CHAPTER II
REVIEW OF LITERATURE
Background
Trans-fatty acids are unsaturated fats with at least one double bond in the trans-
configuration (Larque et al., 2001), and are normally formed during industrial
hydrogenation of vegetable oils (Mozaffarian et al., 2004). Trans-fats provide no known
benefit to human health (Harnack et al., 2003), but are suspected to increase the chances
of developing certain diseases such as coronary heart disease, cancer, and diabetes. The
Food and Drug Administration (FDA) estimates that the average daily intake is 5.8 grams
(Lock et al., 2003); however, the National Academy of Sciences’ Institute of Medicine
reports that any amount is harmful and consumption should be avoided (Ault, 2003).
Hydrogenation
Hydrogenation involves applying high temperatures with metal catalysts and
pressurized hydrogen gas to convert liquid oils to a semi-solid form (National
Cattleman’s Beef Association [NCBA], 2003). At the chemical level, hydrogenation is
simply adding hydrogens to a carbon, carbon double bond to create a carbon, carbon
single bond. However, during this process, some carbons retain their double bond but
switch from a cis to a trans configuration, thus resulting in industrially produced trans-
fats.
Texas Tech University, Jenny Strovas, August 2007
6
Hydrogenation of oils adds shelf life, flavor maintenance, and favorable textural
properties (NCBA, 2003). The purpose of using hydrogenated oils for preparation of
fried foods is to decrease the tendency of polyunsaturated oils to be peroxidized at high
temperatures and to increase the time that the oils can be stored without becoming rancid
(Bensadoun, 2003).
Ruminant Trans-Fatty Acids
The major sources of dietary trans-fatty acids before the turn of the century were
foods containing lipids from ruminant animals such as cows, sheep, and goats
(Lichtenstein et al., 1995). However, currently these foods are only responsible for 10-
20% of our total trans-fat intake (Lock et al., 2003). When ruminant animals ingest
unsaturated fatty acids, the fatty acids are partially hydrogenated as a result of bacterial
fermentation in the rumen (Bensadoun, 2003). The trans-fats created are structurally
different (specifically the chain length and location of the carbon-carbon double bond)
than man-made trans-fats and therefore act differently in terms of health effects.
The two naturally occurring trans-fats from animal sources are conjugated linoleic
acid (CLA) and vaccenic acid (VA). Conjugated linoleic acid research with animal
models has demonstrated beneficial effects such as protection against cancer, heart
disease, and obesity. Vaccenic acid is a precursor to CLA and thus potentially offers
health benefits as well. Due to the unique and possibly beneficial properties of CLA and
VA, the FDA excludes them from being listed on nutritional fact labels (NCBA, 2003).
Trans-fats can also be present in pork and poultry at low levels as a result of the animals
consuming feeds that contain trans-fats (Bensadoun, 2003).
Texas Tech University, Jenny Strovas, August 2007
7
FDA Regulations
After compelling evidence suggested that trans-fatty acid intakes were associated
with Coronary Heart Disease (CHD) risk, the U.S. Food and Drug Administration (FDA)
proposed a ruling in 1999 to include trans-fat content in foods on the nutrition fact
section of food labels. The FDA stated that trans-fat labeling would allow consumers to
make purchase decisions that take dietary recommendations into account (Moss, 2006).
In July of 2003, the FDA issued the final ruling on trans-fat labeling which
declared that effective January 1, 2006, all food and dietary supplement makers were
required to disclose trans-fat content on their product labels (Ault, 2003). The final
ruling did not require a percent daily value since there was no scientific basis to
determine a daily value (Moss, 2006). Prior to this ruling, FDA regulations did not
require trans-fatty acid information on food labels; which provided an incentive for
manufacturers to “hide” the trans-fat content of their (Ascherio et al., 1999).
The labeling threshold for trans-fatty acids is set at 0.5 grams per serving (Lock et
al., 2003), which does not do much to inform the American public about trans-fats since
the serving size can be manipulated to disclose little or no trans fat content. According to
the 2005 Dietary Guidelines Advisory Committee, the FDA Food Advisory committee,
and the American Heart Association, less than 1% of energy should come from trans-fats
(Lichtenstein et al., 2006). The National Academy of Sciences’ Institute of Medicine
reports that any amount is harmful and consumption should be avoided (Ault, 2003).
The FDA estimated that adding trans-fat information to labels will lead to the
prevention of 600-1200 cases of CHD and 240-480 deaths annually, saving between $900
million to $1.8 billion annually due to reduced medical costs, pain and suffering, and
Texas Tech University, Jenny Strovas, August 2007
8
greater productivity (Moss, 2006). The American Dietetic Association (ADA) reported
that the new trans-fat information will help consumers make wiser choices (Hess et al.,
2005). However, if the public does not have adequate knowledge of the effects of trans-
fats on their health, why would they be willing to make wise food choices? Major
consumer advocacy groups note that this ruling creates a big loophole by failing to
include restaurants (Ault, 2003). Even in 1999, when the first trans-fat ruling was made,
the comments that were generated raised concerns about the absence of consumer studies
to determine how the proposed ruling would be perceived (Moss, 2006).
Estimated Intake of Americans
Estimates of trans-fat intake by Americans range from a low of 2.6g/day to a high
of 12.8g/day. The results from a study done by Allison et al. 1999 show that, on average,
the US population consumes 5.3g/day of trans-fats which equal about 2.6% of their total
energy and 7.4% of their fat energy. Similarly, the FDA estimates that the average daily
intake is 5.8 grams, or 2.6% of calories (Lock et al., 2003).
Most studies used a food frequency questionnaire or a food record to determine
individual trans-fat intake. These forms of data collection are limited due to food
generalizations or the inaccuracy of a participant’s personal food record. Individual
trans-fat intake was then estimated using a food composition table, which can result in
large errors. These tables average the trans-fat content for many different brands of a
certain food, even though the amount of trans-fat in these brands could vary greatly. This
averaging technique skews the results and causes any prediction of individual dietary
Texas Tech University, Jenny Strovas, August 2007
9
TFA content to be highly questionable (Brent Shriver, personal communication, January
25, 2006).
Trans-Fatty Acid Knowledge
According to a 2005 study by Hess et al., trans-fat knowledge is related to
multiple factors, which include marital status, education level, and use of food labels.
Participants who were married had significantly higher scores than those who were
single. Results showed that those with a bachelor’s degree or higher had more trans-fat
knowledge than those without a bachelor’s degree. Results also showed that people who
regularly looked at the nutrition facts section of food labels scored higher in trans-fat
knowledge.
Since this study was conducted before 2006, the participants were asked if they
would change their eating behaviors after trans-fat labeling was required. The
participants who reported that label changes would not affect their food choices said it
was because they did not feel that they had enough information to make an educated
decision (Hess et al., 2005). This study showed that without proper education, trans-fat
labeling will not lead to the extensive benefits that the FDA proposed. If the public does
not know what a trans-fat is and how it can affect their health, then they are likely to
make unhealthy food choices, even when the proper information is given to them.
Trans-Fatty Acids around the World
Denmark is an exceptional country with regards to protecting its population from
consumption of the potentially harmful trans-fatty acids. The government introduced
Texas Tech University, Jenny Strovas, August 2007
10
legislation effective in January of 2004 that limited trans-fats to a minimum of 2% of the
total fat in any food product. This legislation has had no noticeable effect on price,
quality, or availability of food products that previously contained high amounts of trans-
fats. In 2001, eating a high trans-fat meal in Denmark could equate to 30g of trans-fat
per day. However, after creating legislation to restrict trans-fat amounts, the same meal
in 2005 resulted in consumption of less than 1g of trans-fat. These results prove that
similar food items can be produced with or without trans-fatty acids (Stender et al.,
2006).
A study conducted by Stender et al. (2006) gathered trans-fat data on 542 food
products in 26 different countries between 2004 and 2006. Results showed that the trans-
fat content of frying oils from specific fast food restaurant chains differed substantially
among countries. One serving of a McDonald’s food product in Copenhagen had only 1g
of trans-fat; however, the same food product in New York City had 10g of trans-fat.
Portugal, USA, France and Spain all had popcorn products that used fats containing 40-
50% trans-fats.
A review, by Craig-Schmidt 2006, stated that North American average daily
intake of trans-fat was 3-4g per person per day according to food frequency
questionnaires, and 10g per person per day according to biological tests conducted by
extrapolation of human milk. Northern European diets typically had higher trans-fat
intakes than those from the Mediterranean where olive oil is used when cooking, or in
France where ruminant fats are typically used. Australian diets ranged from 3-8g per
person per day, which is somewhat lower than Western diets. Traditional diets in Japan
Texas Tech University, Jenny Strovas, August 2007
11
and Korea contain much smaller amounts of trans-fats. Japan estimates an intake of 0.1-
0.3g per person per day, while Korea estimates an intake of 0.6g per person per day.
Trans-Fatty Acids in the News
On June 8, 2006, Wendy’s Corporation announced that it would be switching to
an oil that provides 0 grams of trans-fat per serving. The restaurant’s fried chicken
products will have no trans-fat, while their french fries will have 0.5 grams of trans-fat.
This is a vast improvement from Wendy’s large portion of french fries which used to
contain 7 grams of these harmful fats. This restaurant is going beyond simply switching
to a healthier oil by working directly with its french fry suppliers to reduce the amount of
trans-fats that are introduced during the par frying process. Wendy’s Corporation was the
first national hamburger chain to use a non-hydrogenated oil in the U.S. (”Wendy’s
significantly cuts trans fats,” 2006).
On October 30, 2006, KFC Corporation announced that it would stop frying
chicken products in partially hydrogenated oils. The chain stated that by April of 2007,
all 5,500 U.S. restaurants would switch to this new oil; however, it would not be used
when preparing all of its menu items. The KFC biscuit, although not fried, is prepared
using a trans-fat shortening, and ingredient that has proven difficult for them to replace.
The Center for Science in the Public Interest dropped its lawsuit over the trans-fat content
of KFC’s foods after hearing about their intentions to cook with a new oil that is less
likely to cause heart disease (Caruso, 2006).
On December 5, 2006, the New York City Department of Health and Mental
Hygiene officially banned restaurants from using oil that contained more than 0.5g of
Texas Tech University, Jenny Strovas, August 2007
12
trans-fat per serving. The restaurants were given a deadline which required that by July
1, 2008 every food item that is not in the manufacturer's original packaging has to have
less than 0.5 grams of trans-fat. Some restaurant owners were excited about the ruling
stating that they had no desire to offer harmful foods to their customers and were in favor
of eliminating partially hydrogenated oils. Others believe that the City’s Department of
Health went beyond its bounds because the members were appointed by the mayor and
not elected by the public. Many believe that the national implications of this ruling will
have a domino effect resulting in establishment of trans-fat free cities across the country
(Frumkin, 2006).
On June 19, 2006, Wake Forest University Baptist Medical Center released a
statement regarding research it had been conducting for the past 6 years. The research
involved male monkeys that were fed either a western-style diet with trans-fats or a diet
that contained monounsaturated fats, such as olive oil. Both groups were given the same
amount of calories with 35 percent of the calories from fat and 8 percent from either trans
or monounsaturated fat. The monkey’s caloric intake was intended to be enough to
maintain their weight, not increase it. The monkeys on the trans-fat diet had a 7.2 percent
increase in body weight, while the control group only had a 1.8 percent increase. The
monkeys receiving the western diet deposited 30 percent more fat in their abdomen,
which is a risk factor for diabetes and heart disease in humans. This 6 year study in
monkeys is assumed to be equal to a 20 year study in humans (Conn et al., 2006).
Texas Tech University, Jenny Strovas, August 2007
13
Associated Health Risks
Trans-Fatty Acids and Coronary Heart Disease
Concerns have been raised for many decades that the consumption of trans-fatty
acids may have contributed to the 20th century epidemic of coronary heart disease (CHD)
(Ascherio et al., 1999). This hypothesis is supported by the numerous and consistent
studies showing the positive relationship between high trans-fat intake and increased risk
for CHD. The association with CHD is related to the fact that trans-fats increase LDL
cholesterol levels (Low Density Lipoprotein or the so-called “bad” cholesterol) and
decrease HDL cholesterol levels (High Density Lipoprotein or the so-called “good”
cholesterol). This combined effect on the ratio of LDL to HDL cholesterol was
approximately double that of saturated fatty acids (Ascherio et al., 1999), and thus, was
considered a powerful gauge for the risk of CHD (Science News 1990). HDL is called
the “good” cholesterol because it retrieves “bad” cholesterol from peripheral cells and
returns it to the liver. This process, called reverse cholesterol transport, reduces fatty
plaque formation and therefore is correlated with a decreased risk of CHD (Gropper et
al., 2005).
In the 2006 study by Lichtenstein et al., HDL levels of subjects was highest after
they consumed a butter-enriched diet and lowest after they consumed a stick margarine
enriched diet. Therefore, those individuals who replaced butter with margarine with the
intentions of reducing their risk for CHD could actually be increasing their risk (Ascherio
et al., 1999).
Texas Tech University, Jenny Strovas, August 2007
14
In the 2003 study by Baylin et al., investigators used adipose tissue biomarkers to
examine the association between trans-fatty acids and the risk of myocardial infarction
(MI) in Puerto Rican adults. Eligible subjects were survivors of a first acute MI and
control subjects from the same population had not been diagnosed with heart disease.
Fatty acids were extracted from the adipose tissue and assessed by gas-liquid
chromatography. After adjusting for multiple variables, the result showed that total
adipose tissue trans-fat was associated with increased risk of MI.
A multi-country study (Aro & Kardinaal, 1995) was conducted in Europe and
identified as the Euramic Study. The subjects included men with either first acute
myocardial infarction (AMI), or without a history of AMI. Subjects were residents of
their particular countries who had not changed their diet for health reasons or gained 5kg
in the past year. Adipose tissue and serum samples were taken and analyzed in the same
location using gas chromatography. Differences in dietary intake of trans-fats were
considerable between countries; however, the results found no significant difference in
adipose tissue trans-fat between cases and controls.
Trans-Fatty Acids and Cancer
Results from numerous studies examining trans-fatty acids and their effect on
cancer development are conflicting. The EURAMIC study demonstrated a positive
association between trans-fat intake and the incidence of breast and colon cancer, but not
prostate cancer, while the Holmes study found no association between trans-fats and
breast cancer (Stender & Dyerberg, 2004). Although data from human studies is limited,
Texas Tech University, Jenny Strovas, August 2007
15
it is hypothesized that trans-fats could increase the risk of cancer through alteration of
immune response, cell wall integrity, and prostaglandin synthesis (Slattery et at., 2001).
Many shortcomings from studies are related to their use of food frequency
questionnaires to obtain information on the amount of trans-fat ingested by each
individual. One study suggested that adipose tissue represented a stable, long-term
reservoir that included exposure levels of trans-fats over time, and therefore, was a much
better method to assess trans-fat consumption than a dietary recall (Kohlmeier, 1997).
The Slattery et al. 2001 study concerning colon cancer reported no increased risk
from ingesting cis fatty acids, while there was an increased risk from ingesting trans-fatty
acids. Conjugated linoleic acid, a naturally occurring trans-fatty acid, is thought to have
anticarcinogenic properties in animal studies. This protective health claim could not be
confirmed by an epidemiological study conducted by Voorips et al. 2002. The evidence
supporting the hypothesis that trans-fats increase the risk of developing cancer remains
inconclusive.
Trans-Fatty Acids and Obesity/Type II Diabetes
Excess body fat resulting from an imbalance between energy intake and physical
activity is the primary risk for type II diabetes, but dietary fat is also thought to be a
factor. However, the long-term effects of specific types of dietary fat on diabetes and
insulin resistance remain unclear, partly because the number of epidemiological studies
on this subject is insufficient (Salmeron et al., 2001).
The 2001 study by Salmeron et al. concluded that total, saturated, and
monounsaturated fatty acid intakes were not associated with risk for type II diabetes in
Texas Tech University, Jenny Strovas, August 2007
16
women, but intake of trans-fat increased risk while intake of polyunsaturated fatty acids
decreased risk. Replacing 2% of energy from trans-fat with carbohydrate was associated
with a 28% lower risk of diabetes, while replacing trans-fat with polyunsaturated fatty
acids was associated with a 40% lower risk. Because the average American intake of
trans-fat from partially hydrogenated vegetable oil is about 3% of their energy, it is
assumed that the incidence of type II diabetes could be reduced by more than 40% by
substituting trans-fat with polyunsaturated fatty acids.
In the United States, obesity continues to rise while fat intake appears to be
declining, which Bray has termed “The American Paradox.” This suggests that total fat
and individual fatty acids have to be taken into account when reaching conclusions about
obesity and dietary fat (Bray et al., 2002). An animal study, reviewed by Bray et al.
2002, showed that a long-term (>30 weeks) high fat diet produced irreversible body
weight, but those who switched back to a low fat diet after 18 weeks were able to return
to their original weight. This study indicates that long term feeding of a high fat diet may
produce irreversible effects.
The 2002 study by Lovejoy et al. compared the effects of saturated, trans, and
monounsaturated fat diets on insulin action in 25 healthy, nonobese men and women. It
was a randomized, crossover, double-blind, controlled-feeding trial with a 2 week
washout period between diets. Results showed that dietary fatty acid composition did not
have an impact on insulin sensitivity or secretion in lean individuals; however, it did have
a significant effect on fat oxidation. Subjects on the monounsaturated diet oxidized the
least fat, while those on the trans-fat diet oxidized the most. These studies present a
strong argument that both consumption of total fat and individual fatty acids need to be
Texas Tech University, Jenny Strovas, August 2007
17
taken into account when reaching conclusions about risk for obesity and diabetes.
Additional studies are needed to elucidate these preliminary findings.
Trans-Fatty Acids and Allergies
The 1999 study by Welland et al. reported a positive association between the
intake of trans-fatty acids and the prevalence of symptoms of allergic rhino
conjunctivitis, which is an allergen-induced inflammatory response. This was due to the
influence of trans-fat on the desaturation and chain elongation of n-6 and n-3 fatty acids
into precursors of inflammatory mediators, such as prostaglandins and leukotrienes. It
appears that these effects may be stronger for industrially produced trans-fats than for
ruminant trans-fats.
Trans-Fatty Acids and Breastfeeding
The total amount of fatty acids in human breast milk is dependent upon maternal
diet, gestational age, and stage of lactation. Approximately 30% of all fatty acids in
breast milk comes from the maternal diet (Mojska et al., 2003). Since humans are unable
to synthesize trans isomers of fatty acids, maternal milk accurately reflects the daily
dietary intake of trans fatty acids (Mojska et al., 2003, Largue et al., 2001).
The 2003 study by Mojska et al. analyzed breast milk samples for trans-fat
content in 100 exclusively breastfeeding Polish women. At 9-10 weeks of lactation each
woman completed a 7 day dietary record to establish their food and nutrient intake.
Results showed that mothers who had high levels of trans-fats in their milk consumed
significantly greater amounts of trans-fat containing foods, such as bakery products and
Texas Tech University, Jenny Strovas, August 2007
18
snacks, than mothers who had medium or low levels of trans-fats in their milk. Results
also showed that trans-fat content of colostrum was significantly lower than trans-fat
content of mature milk. The study concluded that breastfeeding mothers should avoid
eating trans-fat containing food products, because trans-fat levels in breast milk appear to
reflect the current diet of the mother. The negative implications on breastfed infants from
trans-fats in human milk are not yet well investigated or documented (Mojska et al.,
2003).
Conclusion
The multiple health implications of trans-fats show a need to for further research
in this area. Not only is research needed to study trans-fat health effects, but behavioral
research must also be completed to determine how people react to these harmful fats.
This research project involves a trans-fat database and survey which will contribute to the
qualitative research being conducted in this area.
Texas Tech University, Jenny Strovas, August 2007
19
CHAPTER III
METHODS
This research project consisted of two major components: (1) a current trans-fat
database, (2) development and pilot test of a trans-fat survey. The trans-fat database was
compiled to determine foods which have a measurable content of trans-fats post 2006.
This data can be used to educate the public on specifically which foods contain a
significant quantity of trans-fats. The survey was designed to primarily test trans-fat
knowledge; however, it was also designed to test behavior, belief, attitude and self
efficacy towards trans-fats. The survey was developed and pilot tested to insure validity
and reliability of the instrument.
Food Composition Database of Trans-Fat Content
Trans-Fat Data Collection
Food composition data was collected from the United Supermarket located at
University and 82nd in Lubbock, TX. Only fat containing, national brand name foods
were included in the database. Food composition values were recorded after January
2006 to ensure the most complete database of trans-fat content. The food product
information that was recorded included distributor, brand, product name and flavor. The
nutrition facts information recorded included serving size (both gram and household
unit), kilocalories, total fat, saturated fat, trans-fat, polyunsaturated fat, and
Texas Tech University, Jenny Strovas, August 2007
20
monounsaturated fat. Food products that advertised “0 grams of trans-fat” on the
packaging were also recorded.
A grocery store inventory proved to be the most reliable method to collect trans-
fat data. Multiple food product companies were contacted in hopes of receiving food
composition data, which would require less time to be spent recording data on each
individual food. However, the companies were non-responsive.
Trans-Fat Data Analysis
After data collection, food items were compared to assess what kinds of
foods still contain trans-fats and in what amounts. In addition to these values, the serving
size and trans-fat quantity were correlated. This was an important calculation because
products which seem to have a small quantity of trans-fat per serving might actually have
a much larger quantity when adjusted to unit of measure.
Trans-fat values were calculated according to grams per 100 grams of food
product. The amount of trans-fat listed on the label (in grams) was divided by the serving
size (in grams) and then multiplied by 100. This calculation allowed for comparison of
all foods regardless of varying serving sizes. Appendix A Table C includes all recorded
food items that contained trans-fats along with the corresponding standardized values.
A trans-fat database is important because it simplifies a lot of otherwise
complicated information. It allows for a multitude of food products to be represented in
one place and for the trans-fat content to be standardized. Standardization is important
for consumers because it allows for easy comparison of similar food products. However,
if consumers do not have the basic knowledge to understand labeling laws then using a
Texas Tech University, Jenny Strovas, August 2007
21
database could be misleading (i.e. those products which claim to have 0 grams of trans-
fat). A survey has been developed to illuminate the extent of consumer’s knowledge so
these issues can be addressed.
Trans-Fat Survey
Survey Development
Only one known survey has been developed regarding trans-fat knowledge;
however, it was tested before the 2006 labeling laws were implemented. The survey was
designed by Hess et al. 2005 and assessed knowledge in health-conscious adults. The
researchers involved in the study were contacted to obtain a copy of their survey;
however, they stated that they no longer had that information. Because of this
unfortunate circumstance, a new measure had to be designed.
This survey was developed primarily to measure consumer knowledge of trans-
fat and began with a review of the literature and obtaining the advice of nutrition experts
with survey development experience. Trans-fat facts found in the literature were
translated into questions that dealt specifically with knowledge. Other questions were
designed to evaluate behavior, belief, attitude, and self efficacy to determine if
knowledge levels would correlate with these other variables.
Surveymonkey.com was the website used to design and distribute the survey. Its
user-friendly software allowed for easy survey design and provided many options for
different types of questions. Due to time and resource restrictions, the internet was the
best option for obtaining participant data.
Texas Tech University, Jenny Strovas, August 2007
22
Initially, survey questions, hereafter referred to as items, were reviewed by
Nutrition, Hospitality, and Retailing Department staff members to determine face
validity. Face validity is based on a brief review of items by untrained judges and
represents a casual assessment of item appropriateness. Next, the items were reviewed
by nutrition faculty, who were both experts in the subject matter and experienced in
survey development, to determine content validity. Content validity is a measure of how
appropriate the items seem to a set of expert reviewers who have knowledge of the
subject matter (Litwin, 1995).
The survey contained 6 categories and was represented by the following number
of items: 11 in knowledge, 9 in attitude, 1 in belief, 16 in behavior, 4 in self efficacy, and
12 in demographics. According to Parmenter and Wardle 2000, many items need to be
included so that the poor items can be eliminated before the final instrument is
implemented. Gorsuch, 1997 stated that only 3 items per category were needed to
perform a factor analysis, therefore each category, excluding belief, was adequately
represented from a statistical stand point.
Except for a few demographic items, all items were close-ended; the participants
could only select one of the options that were provided. Knowledge items were multiple
choice with relevant distracter options and the correct answer was indisputable. Face and
content validity were used to check for item ambiguity, unclear formating, poorly written
instructions, and loaded or negatively phrased questions. To further reduce item
ambiguity, certain food related questions were clarified by adding specific examples
(Parmenter & Wardle, 2000). One such item asked about participant’s fried meat
Texas Tech University, Jenny Strovas, August 2007
23
consumption and included examples such as chicken nuggets, steak fingers, and fried fish
to ensure item clarification.
Knowledge items were designed to have either a right or a wrong answer. “Not
sure” was not provided as an option because participants should either choose correctly
or incorrectly regarding knowledge facts. This keeps participants who actually know the
right answer from selecting “not sure” because they are not confident in their knowledge.
Others may choose “not sure” because it is the quicker option. This option was available
for the behavior, belief, attitude, and self efficacy because it may keep participants from
guessing. “Not sure” was used instead of “don’t know” because it appears to be less
negative which may also reduce guessing (Parmenter & Wardle, 2000).
As mentioned earlier, properly written instructions are vital to ensure validity.
Since instructions set the tone of the survey, it was important to make them simple, brief,
and clear. The instructions were designed not to intimidate participants, but to encourage
them to answer honestly by explaining that they would be contributing to trans-fat
research. Each category had a separate set of instructions to help orient the participant’s
attention (Parmenter & Wardle, 2000).
The survey was designed to provide a logical flow of categories and items. The
demographics category was placed at the end of the survey because participants may
view some items as being intrusive. By placing this category at the end, negative feelings
from intrusive items would not interfere with their responses and they would be more
likely to complete the survey. For each pilot test, validity and test-retest reliability, the
survey categories were kept in the same order, the color scheme remained the same, and
preceding items did not answer subsequent items (Parmenter & Wardle, 2000).
Texas Tech University, Jenny Strovas, August 2007
24
Readability levels were assessed by the Flesch-Kincaide Grade Level test
provided by Microsoft Word. According to Kirksey et al. 2004, materials should be
written at an 8th grade level or lower to ensure general comprehension. Assessment of
the trans-fat survey produced a 7th grade readability level.
Validity Pilot Test
Validity can be simply defined as the extent to which an instrument measures
what it is designed to measure (Parmenter & Wardle, 2000). Validity ensures that the
interpretation of this instrument’s results reflects trans-fat knowledge and how
participants act in regards to trans-fats. Results should not be distorted by irrelevant
factors such as poorly worded instructions, item ambiguity, and unclear format (Linn &
Miller, 2005).
The survey was validated by administering it to 3 different groups of people with
varying trans-fat knowledge levels. The first group was considered to have no
knowledge and consisted of students from the General Animal Science and Gender Role
classes. The second group was considered to have some knowledge and consisted of
students in the Principles of Nutrition and Nutrition in the Life Cycle classes. The third
group was considered to have an expert level of knowledge and consisted of Animal
Science Faculty and Lubbock Dietitians.
Each of the three groups were comprised of 2 subgroups to obtain a more
balanced ratio of male to female participants. Since a large number of students in the
College of Human Sciences are female, we sought participants from the Animal Science
Texas Tech University, Jenny Strovas, August 2007
25
Department because they are also educated on nutritional issues and considered to have a
higher male to female ratio.
In order to assess that the instrument was measuring what it was designed to
measure, a few statistical tests were completed. These tests included item difficulty, item
discrimination, and homogeneity. Completing these statistical analysis aids in
determining which items should be kept for the final instrument.
Item difficulty, the extent to which the participants answered an item in the same
way, was assessed based on correct answer frequency values of 20-80%. If 20% or less
of the participants scored the item wrong, then it was considered too difficult and
therefore excluded. Similarly, if 80% or more of the participants scored the item right,
then it was considered too easy and excluded. Frequency values were also used to
identify where data transfer problems might have occurred. Variables that were constant
(every participant either got the question right or wrong) were considered for exclusion
because that item cannot be statistically compared with another variable. However, some
items were retained regardless of difficulty level due to their theoretical importance
(Parmenter & Wardle, 2000).
The varying groups of trans-fat knowledge determined item discrimination and
therefore, varying knowledge levels among participants. Item discrimination measures
the ability of an item to discriminate between participants who do well on the survey and
those who do not. This was assessed by correlating each individual item with the total
knowledge score and the factor score. A correlation of 0.2-0.3 was the minimum value
that could be kept. Any item with a correlation value lower than this was discarded
(Parmenter & Wardle, 2000).
Texas Tech University, Jenny Strovas, August 2007
26
Homogeneity was used to assess if the items in a particular category were related.
This particular measure is referred to as internal consistency and was measured using
Chronbach’s coefficient alpha. Chronbach’s alpha is used for items that have more than
2 response options and is considered significant at 0.7 (Parmenter & Wardle, 2000). This
measurement was used in the validity pilot test even though it is actually a measure of
reliability.
Construct validity was assessed using item difficulty, item discrimination, and
homogeneity along with face and content validity. Construct validity is the most difficult
way of assessing an instrument because it attempts to measure unobservable constructs.
Simply, it measures how meaningful an instrument is. This form of validity usually takes
years to assess and is done by testing the instrument continually over time (Litwin, 1995).
Validation of an instrument is incredibly important; however, without reliability,
an instrument can not be truly valid. Reliability refers to the consistency of results
produced by an instrument. Test-retest reliability was used in the survey to test if the
items were worded in such a way which caused participants to answer consistently (Linn
& Miller, 2005).
Reliability Pilot Test
Test-retest reliability is a measure of how reproducible a set of items are. It
involves having the same set of participants complete a survey at two different points in
time and is the most common indicator of survey instrument reliability (Litwin 1995).
Reliability is needed to obtain valid results; however, an instrument can have reliability
without validity (Linn & Miller, 2005).
Texas Tech University, Jenny Strovas, August 2007
27
A different participant group was used to test reliability than was used to test
validity. Initially, 2 Restaurant, Hotel, and Institutional Management (RHIM) classes
were used; however, the correlation value of the demographic question related to marital
status was 0.48. Because of this incredibly low value on an item that should have had a
perfect correlation of 1, a second participant group was selected.
The second reliability group included students from 4 nutrition classes. The
survey was dispersed via email with the surveymonkey.com link. Participants were
asked to complete the survey once, and then complete it again 2 weeks later. This time
interval was thought to be long enough that participants would forget what they initially
answered, but short enough that they would not gain trans-fat knowledge over that time
period. Pearson’s correlation between the first and second survey were calculated and is
considered significant at 0.7 (Parmenter & Wardle, 2000).
Participant Incentives
Incentives greatly affected the number of people who chose to participate in the
trans-fat survey. Each of the respondents from the 3 validity groups was placed into a
drawing for a $15 gift certificate to the campus restaurant Cowamongus; however, this
did not seem to have much weight in influencing participant response rate. Extra credit
was the driving factor for student participation.
From the validity pilot test, the General Animal Science and Nutrition in the Life
Cycle classes were given extra credit points while the Gender Roles and Principles of
Nutrition classes were not given extra credit. The response rate in classes offered extra
credit was substantially higher than in those that were not given extra credit.
Texas Tech University, Jenny Strovas, August 2007
28
During the first reliability pilot test, the 2 RHIM classes were offered extra credit
to participate in the survey which created a large sample size. However, even with a
large sample size the correlation values were poor. So, another reliability pilot test was
performed on a group of 4 nutrition classes, but no incentive was offered. The sample
size from this group was considerably smaller; however, the correlation values were
much better. After these participants had taken the survey twice, a name was drawn for a
$15 gift certificate to Cowamongus to show our appreciation to those who participated.
Since the drawing for the gift certificate was not announced in advance then it is not
considered to be an incentive.
Statistical Analysis
Statistical Package for the Social Sciences (SPSS) was used for all statistical
calculations. The statistical tests used were frequencies, chronbach’s alpha, Pearson
correlations, factor analysis, and one-way ANOVA. The counsel of Dr. James Surles,
Associate Professor in the department of Mathematics and Statistics, and Dr. Du Feng,
Associate Professor in the department of Human Development and Family Studies, were
used to properly analyze the data.
Human Subjects Approval
The Texas Tech University Protection of Human Subjects Committee approved a
claim for exemption on April 11, 2006. Exemption implied that no consent form would
be required for survey participants since the risk was inconsequential. The exemption
letter dictated that our research was not subject to continuing review; however, any

Texas Tech University, Jenny Strovas, August 2007
29
modifications that changed the research in a substantial way would have to be reported to
the Institutional Review Board.
Texas Tech University, Jenny Strovas, August 2007
30
CHAPTER IV
RESULTS AND DISCUSSION
This two component thesis served to develop a trans-fat composition database and
a reliable and valid survey instrument which assessed knowledge, attitude, belief,
behavior, and self efficacy. The database was composed from foods shelved at a local
supermarket. The survey was pilot tested on Texas Tech University students, faculty, and
Lubbock dietitians.
Trans-Fat Database
The Purpose of the food composition database was to determine foods which still
have a significant quantity of trans-fats post January 2006. A total of 3,188 food
products were included in the database. Of these food products, 549 contained trans-fats
according to the label, which equaled 17.22% of all foods recorded. The majority of food
products claim to be trans-fat free; however, that can only be verified by looking under
ingredients for partially hydrogenated oil.
Trans-Fat Values
Trans-fat values were compared based on grams of trans-fat per 100 grams
of food product. To adjust grams of trans-fat per serving to grams of trans-fat per 100g
of food product, the amount of trans-fat listed on the label (in grams) was divided by the
serving size (in grams) and then multiplied by 100. This calculation allowed for
Texas Tech University, Jenny Strovas, August 2007
31
comparison of all foods regardless of variations in serving sizes. Appendix A Table C
includes all recorded food items that contained trans-fats along with the corresponding
standardized values.
Of all foods recorded, the food which contained the most trans-fat was an
Imperial Margarine Stick. It contained 2.5g of trans-fat in 1 serving (14g). This equaled
to an astonishing 17.86g of trans-fat per 100g of food. The second highest trans-fat
containing food recorded was the Pop Secret flavors: Movie Theatre Butter, Extra Butter,
and Cheddar. Each contained 6g of trans-fat per serving (36g) which equates to 16.67g
of trans-fat per 100g of food. The third highest trans-fat containing foods recorded were
Country Crock’s Spreadable Sticks and Fleishmann’s Original and Unsalted Margarine
Stick. Each contained 2g of trans-fat per serving (14g) and 14.29g of trans-fat per 100g
of food. The top 5 food products containing the highest amounts of trans-fats were either
margarine or popcorn.
The 3,188 food products were divided into 11 major food categories. These
categories included: Box Dinners; Breads; Breakfast (Cereal, Granola Bars, and Breads);
Candies and Baking; Canned Foods; Dressings, Spreads, and Desert Toppings; Energy
Bars; Margarine, Butter, and Oils; Dry Mixes (Cakes, Muffins, Cookies, Pancakes,
Frying); Refrigerated and Frozen Foods; and Snacks. The top trans-fat containing food
products from each category were recorded in Table 1.
Trans-Fat Labeling
Although food products are required to list trans-fat content, the labeling
threshold is set at 0.5 grams per serving (Lock et al., 2003). Therefore, food companies
Texas Tech University, Jenny Strovas, August 2007
32
are legally able to manipulate serving size in order to list their product as being trans-fat
free. This is misleading because many products have partially hydrogenated oil listed as
one of the ingredients; however, their product label claims to be trans-fat free. Similarly
misleading are products which have a small serving size and therefore a small trans-fat
content. These products may, in actuality, have the same amount of trans-fat as products
with both a larger serving size and trans-fat content. This can be very deceiving and
confusing for those who do not have the knowledge to make smart nutrition choices.
Refrigerated biscuits are an example of similar food products which seem to have
exceptionally different trans-fat content. The Grand’s Flakey Supreme Cinnamon Roll
made by Pillsbury has a serving size of 99g which equals one cinnamon roll. These rolls
contain 5g of trans-fat each. The Cinnamon Mini-Bites, also made by Pillsbury, have a
serving size of 49g which equals 3 pieces. These 3 mini-bites contain 2.5 grams of trans-
fats. If a consumer were to only look at the trans-fat content without noticing the serving
size they would assume that the mini-bites were the healthier option in regards to trans-
fats. However, after calculating trans-fat amounts per 100g, the trans-fat content of the
products was not much different. The cinnamon rolls contain 5.05g of trans-fat per 100g
of food and the mini-bites contain 5.10g per 100g.
Even though consumers are given the proper information, confusing labeling
regulations can potentially cause them to unknowingly make unhealthy food choices in
regards to trans-fats. Consumers need to be aware that although a food product claims to
be trans-fat free, they should look for “partially hydrogenated oil” under the ingredients
section of the food label to verify that claim. Also, the trans-fat amount should be
compared with the serving size to determine actual trans-fat consumption. Trans-fat
Texas Tech University, Jenny Strovas, August 2007
33
knowledge levels must be assessed in order to determine what consumers find confusing
about trans-fat labeling regulations.
Trans-Fat Survey
The purpose of the trans-fat pilot survey was to test knowledge, attitude, behavior,
and self efficacy items to establish a valid and reliable instrument. This was done by
using 2 separate groups, one specifically to examine item validity, and another to
examine item reliability. The validity sample consisted of 3 different groups with
varying knowledge levels and the reliability sample consisted of students in nutrition
classes at Texas Tech University.
Sample Size
The validity group consisted of 118 participants, 75 of which were considered to
have no trans-fat knowledge, 21 who were thought to have some knowledge, and 22 who
were considered experts in the field of nutrition. Each group was comprised of
subgroups to ensure a somewhat balanced ratio of male to female participants.
Due to incentives offered to the students, the “no knowledge” group is
exceptionally larger than the other two. However, Gorsuch 1997 stated that the sample
distribution should be similar to the population of which it will ultimately be used. The
assumption is that the general population has very little trans-fat knowledge and therefore
will comprise a larger section of the participants sampled. Also, Gorsuch suggested that
the participants who are expected to score high on the instrument and those who are
Texas Tech University, Jenny Strovas, August 2007
34
expected to score low should be well represented. Even though the “no knowledge”
group is better represented, there are still an adequate number of participants in the
“expert knowledge” group.
The sample size was found to be adequate for performing a factor analysis by the
Kaiswer-Meyer-Olkin (KMO) test and the Bartlett’s Test of Significance. Both of these
tests are an important initial step in factor analysis (George & Mallery, 2005)
Bartlett’s Test is based on eigen values of the correlation matrix and any factor of
interest should be highly significant by this test. Each category: knowledge, attitude,
behavior, and self efficacy scored highly significant for this test and are represented in
Table 2. The Bartlett’s Test ensures that factor analysis is appropriate for this sample
size (Gorsuch, 1997).
The reliability group consisted of students in 4 nutrition classes. Out of 139
possible participants, only 15 choose to answer the survey, which is equal to 10.8%. This
group was not offered any kind of incentive in an attempt to ensure that the results were
accurate and consistent. Because an instrument can not be valid without also being
reliable, nutrition students were specifically chosen because of their knowledge in this
field.
The reliability test was initially offered to Restaurant, Hotel, and Institutional
Management (RHIM) students who had little nutrition knowledge. When checking the
reliability of knowledge items, it is important that a knowledgeable group be sampled,
otherwise unknowledgeable participants are prone to continually guess and therefore
provide unreliable results (this is discussed more in “Incentives”).
Texas Tech University, Jenny Strovas, August 2007
35
Incentives
Incentives played an important part in determining the number of participants
who chose to answer the survey. In the validity test, classes that were offered extra credit
points for participating had an average response rate of 62.4%. However, those classes
that were not offered extra credit only had an average response rate of 9.7%. In the
reliability test, the RHIM classes who were offered extra credit had an average response
rate of 43.4%, while the nutrition classes that were not offered extra credit had an average
response rate of 10.8%. These results are displayed in Table 3.
Although a large sample size is preferred, it did not lead to good results in the
reliability test due to participation only by students who wanted or needed extra credit.
The RHIM student’s test-retest reliability scores were poor for most items; however, their
scores were exceptionally poor in the demographics section. Over a 2 week period,
personal characteristics, typically described in demographics sections of surveys, should
not change.
One item on the survey asked if participants were currently married with answer
choices of yes or no. The RHIM student’s correlation for this particular item was 0.479.
A perfect correlation is represented by the number 1, so this result shows that participants
were either unsure of their marital status or it changed in a two week period, which is
unlikely.
A poor result generated from such a simple question suggests that the students
were not paying attention to what they were being asked on the survey. This item, in
particular, caused the entire RHIM reliability results to be excluded from the study. The
correlation results for the RHIM students can be found in Appendix A Table A.
Texas Tech University, Jenny Strovas, August 2007
36
Demographics
Since this project is specifically looking at validity and reliability of a trans-fat
survey, demographic data is of less importance at this stage. Comparisons between
demographic items and knowledge scores (explained in the next section) were not
assessed. This is due to the fact that an item must be found valid and reliable before it
can be used to make comparisons; otherwise the information is useless. However, when
the final survey is implemented and assessed, these comparisons will be of the utmost
importance.
The validity survey was taken by 118 individuals, 81 (70.4%) of which were
females and 34 (29.6%) of which were males. The population chosen for this pilot study
attempted to sample in such a way where the ratio of male to female would be equal.
However, the participants who chose to answer the survey were mostly female. The
average participant age was 23.75 years old, with the minimum age being 17 and the
maximum age being 67. All demographic data is displayed in Table 4.
Race/Ethnic distribution of the validity survey was as follows: African American
0% (n=0); American Indian or Eskimo 0% (n=0); Asian or Pacific Islander 2.5% (n=3);
Hispanic 1.7% (n=2); White/Non-Hispanic 93.2% (n=110); and other 2.5% (n=3). Those
participants who chose “other” stated that their race/ethnicity was either African, biracial,
or German/Spanish/Indian/Irish.
Calculating Knowledge Score
There were 11 knowledge items included in the 2 pilot surveys; however, only
the validity survey was used to calculate knowledge scores. Nine items which had either
Texas Tech University, Jenny Strovas, August 2007
37
a right or a wrong answer were coded with a 1 or a 0. The participant got a 1 if they
chose correctly or a 0 if they chose incorrectly.
Two items were designed so that the participant could choose multiple answers.
Each answer choice was given a value of 1 or -1 and then the total score from that
particular item was divided by the number of answer choices. For example, if a
participant chose 1 correct and 2 incorrect answer choices on a “check all that apply”
item, their total score would be -1/3 or -0.33. The 2 multiple answer items, “know diet
source” and “know properties,” were given slightly more weight than the single answer
items due to the way in which they were coded. These items also represent important
trans-fat related facts.
Item Difficulty
Item difficulty is the extent to which the participants answered an item in
the same way and was assessed based on correct answer frequency values of 20-80%
(Parmenter & Wardle, 2000). Table 5 lists frequencies by the 3 separate knowledge
groups and by all groups together. To assess item difficultly, frequencies were used from
all the groups together.
The only item that was outside of the 20-80% range was the item regarding FDA
regulations; however, it was kept due to its theoretical importance. This item was
answered correctly by 116 (95.1%) out of 118 participants. Although this question may
not be a good discriminator among knowledge levels, it would be interesting to know
how many people in the general population do not know the basic government
regulations.
Texas Tech University, Jenny Strovas, August 2007
38
Item Discrimination
Item discrimination measures the ability of an item to discriminate
between participants who do well on the survey and those who do not. This was assessed
by correlating each individual item with the total knowledge score and the factor analysis
score. A correlation of 0.2-0.3 is the minimum value that should result in the retention of
an item (Parmenter & Wardle, 2000). No items were discarded due to item
discrimination analysis because the lowest correlation value was not below 0.2.
Both the knowledge and factor analysis scores were correlated with each item and
the two correlation values were compared. Knowledge scores are more easily calculated
than factor scores; therefore, both values were assessed to see if the knowledge score
gave similar results as the factor score. Overall, both scores had similar correlation
values. Discrimination correlations can be found in Table 6.
Chronbach’s Alpha
Chronbach’s coefficient alpha is a measure of internal consistency which
evaluates if the items in a particular category are related. Chronbach’s alpha (CA) is used
for items that have more than 2 response options and is considered significant at 0.7
(Parmenter & Wardle, 2000). Most items that were excluded from the final measure
were removed because of low Chronbach alpha scores. These values are displayed in
Table 7.
Knowledge items resulted in the lowest CA score due to the vast amount of
possible trans-fat knowledge related items. These items could relate to where trans-fats
occur, what properties they give to foods, government regulations, chemical structure
Texas Tech University, Jenny Strovas, August 2007
39
health effects, etc. Because CA measures how well a group of items are related, these
different kinds of knowledge items may seem poorly related and therefore lead to a low
CA score. This section of the survey began with 11 items; however, the final instrument
will only have 9 knowledge items. The specific items deleted were “know unsaturated”
and “know per serving,” which resulted in a final CA value of 0.601.
The attitude section of the survey resulted in a CA value of 0.728 after deleting 3
items. These items were “for me beneficial,” “for me healthy,” and “restaurant menu.”
This resulted in a total of 6 attitude items for the final measure. Careful consideration
should be given when evaluating these 2 specific items: “for me harmful,” and “for me
non-nutritious.” Although these items are measuring two different concepts, they are
both worded with a negative connotation and could be seen as a leading question.
The pilot survey began with 19 items measuring behavior; however, the final
measure will only contain 8. The CA value for these 8 remaining items was 0.750. None
of the items in this section were deleted due to low CA values, but instead were deleted
due to poor test-retest correlation values.
The self efficacy section of the survey resulted in the highest CA value of 0.868.
Initially, there were 4 items in the pilot survey, but the final measure will only contain 3.
The item was eliminated due to test-retest correlation values, not low CA values.
Test-Retest Reliability
Test-retest reliability involves having the same set of participants complete a
survey at two different points in time and is the most common indicator of survey
instrument reliability. Essentially, it is a measure of how reproducible a set of items are.
Texas Tech University, Jenny Strovas, August 2007
40
This statistical test is measured using correlation values between the 1st and 2nd pilot tests
(Litwin 1995). All test-retest correlation values are listed in Table 8.
In this study, a 2 week time period was used between the 1st and 2nd survey
administration. According to Parmenter and Wardle, 2000, the recommended interval
time is between 2-14 days and 3 months. The 2 week time period was used in hope that
the students would forget what they answered on the 1st survey, but would not have
gained any trans-fat knowledge by the time they took the 2nd survey.
The sample size for this test was only 15 people so interpretation of the results are
limited in that manner. As seen on the table, some items are marked with a “c” to
indicate that they are constant. This means that every participant answered the item the
same way on both tests. These items were not given the perfect correlation value of 1
because correlation values are calculated based on variance. If there is no variation in the
data then a correlation cannot be calculated.
Of the 4 main survey categories, 2 knowledge and 3 attitude items were deleted
due to low CA values while 11 behavior items and 1 self efficacy item were deleted due
to low test-retest correlation values. A few items were kept even though the reliability
correlations were somewhat low. This was due to the fact that deletion of those items
would have caused the CA value to plummet.
The behavior section, with its initial 19 items, had a commendable CA value of
0.849; however, many items had very low test-retest correlations. The following items
were deleted due to low correlations: “when available low fat;” “when available low trans
fat;” “when available low sat fat;” “home oil;” “zero grams notice;” “fried meat;” “cook
at home breakfast;” “cook at home lunch;” “cook at home dinner;” “eat out breakfast;”
Texas Tech University, Jenny Strovas, August 2007
41
and “eat out lunch.” The remaining items had a correlation of at least 0.67 or greater, and
the group as a whole had a CA value of 0.75.
The self efficacy section began with 4 items and ended with 3 – enough to
perform a factor analysis according to the literature (Gorsuch, 1997). Only one item was
deleted in the section and it was due to low test-retest reliability correlations. The item
was “regularly prepare dishes” and had a correlation of 0.579.
Factor Analysis
The primary goal of factor analysis is to identify the smallest amount of latent
constructs needed to reproduce the original data (Gorsuch, 1997). In other words, factor
analysis uses multiple observable items to measure an unobservable construct or
constructs (George & Mallery, 2005). A construct is defined as internal characteristics
that cannot be directly observed but are useful for explaining or describing behavior
(Gravetter & Wallnau, 2005). Factor analysis correlation values for each survey category
are provided in Table 9.
A single significant construct for each category was determined by looking at a
scree plot and comparing eigen values. Eigen values show the proportion of variance
accounted for by each factor or construct. In an ideal setting, each item would load with
a correlation of 0.5 or greater on the desired construct; however, this rarely happens. The
smaller the loading, the less likely that item is actually a good measure of the construct
(George & Mallery, 2005). Even though some items had low loading correlations, they
were kept in the final survey due to theoretical importance.
Texas Tech University, Jenny Strovas, August 2007
42
Each of the 4 categories proved to measure only 1 latent construct. The
knowledge item with the highest loading of 0.625 was “know properties,” while “know
more trans fat” had the lowest loading of 0.324. The attitude item “low trans fat” had the
highest loading of 0.771, while “for me non-nutritious” had the lowest loading of 0.517.
The behavior item with the highest loading of 0.886 was “grocery content, while
“cooking method” loaded at only 0.265. The self efficacy items were very similar in
correlation values. “Prepare tasty dishes” loaded the highest at 0.895, and “buy foods”
loaded the lowest at 0.882.
ANOVA Comparisons of Factor Scores
The survey was initially designed to discriminate between people with varying
knowledge levels. Other categories such as attitude, belief, behavior, and self efficacy
were added to provide insight into how each participant reacts towards trans-fats.
Although assessing knowledge was the primary goal, it is important to know details of
these other areas in order to design adequate education programs.
The knowledge section of this survey proved to discriminate between trans-fat
knowledge levels through ANOVA comparisons of the factor scores. Each group (no,
some, and very knowledgeable) was compared using their mean factor analysis score.
ANOVA only has the ability to show that a significant difference exists between
variables, not where the difference occurs. The R-E-G-W Q Post Hoc test was used to
determine exactly which means were significantly different (Gravetter & Wallnau, 2005).
Results showed that each knowledge group had a significantly different (p = 0.05)
knowledge level than the others. These results can be found in Table 10.
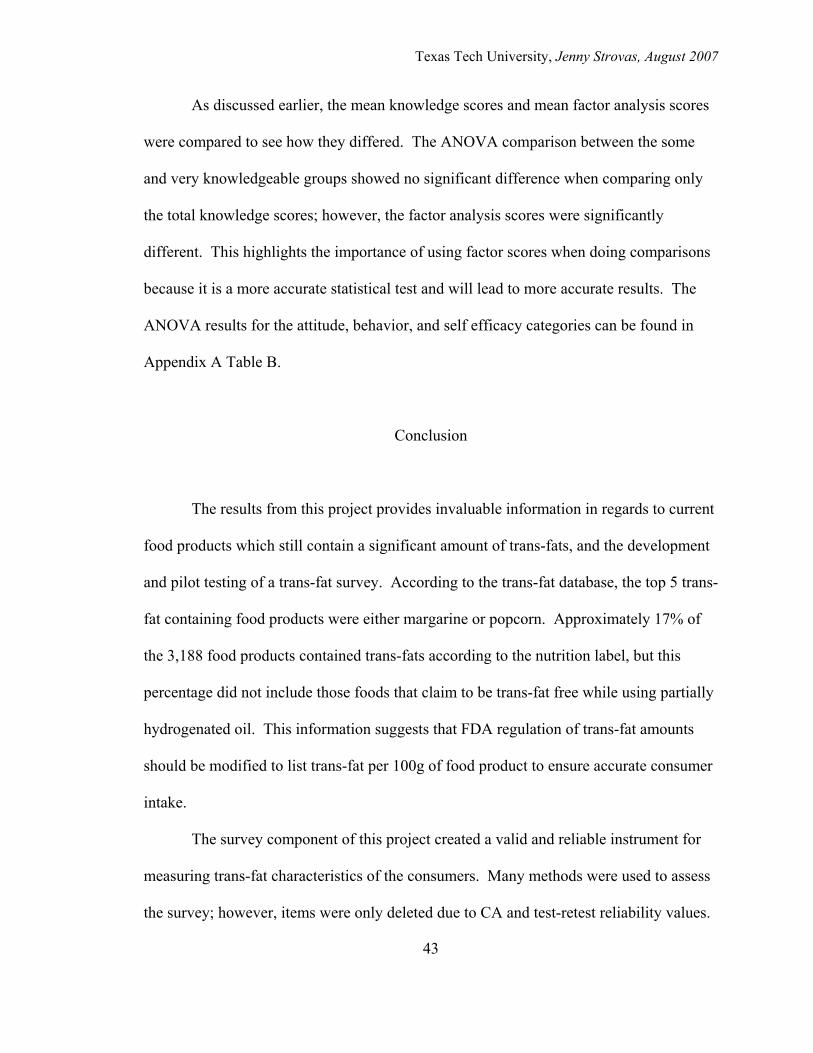
Texas Tech University, Jenny Strovas, August 2007
43
As discussed earlier, the mean knowledge scores and mean factor analysis scores
were compared to see how they differed. The ANOVA comparison between the some
and very knowledgeable groups showed no significant difference when comparing only
the total knowledge scores; however, the factor analysis scores were significantly
different. This highlights the importance of using factor scores when doing comparisons
because it is a more accurate statistical test and will lead to more accurate results. The
ANOVA results for the attitude, behavior, and self efficacy categories can be found in
Appendix A Table B.
Conclusion
The results from this project provides invaluable information in regards to current
food products which still contain a significant amount of trans-fats, and the development
and pilot testing of a trans-fat survey. According to the trans-fat database, the top 5 trans-
fat containing food products were either margarine or popcorn. Approximately 17% of
the 3,188 food products contained trans-fats according to the nutrition label, but this
percentage did not include those foods that claim to be trans-fat free while using partially
hydrogenated oil. This information suggests that FDA regulation of trans-fat amounts
should be modified to list trans-fat per 100g of food product to ensure accurate consumer
intake.
The survey component of this project created a valid and reliable instrument for
measuring trans-fat characteristics of the consumers. Many methods were used to assess
the survey; however, items were only deleted due to CA and test-retest reliability values.

Texas Tech University, Jenny Strovas, August 2007
44
The survey was initially developed with 54 items, but the final measure only had 41
items. The results from this pilot test justify the use of this tool to measure knowledge
because it has the ability to discriminate between groups of varying knowledge levels.
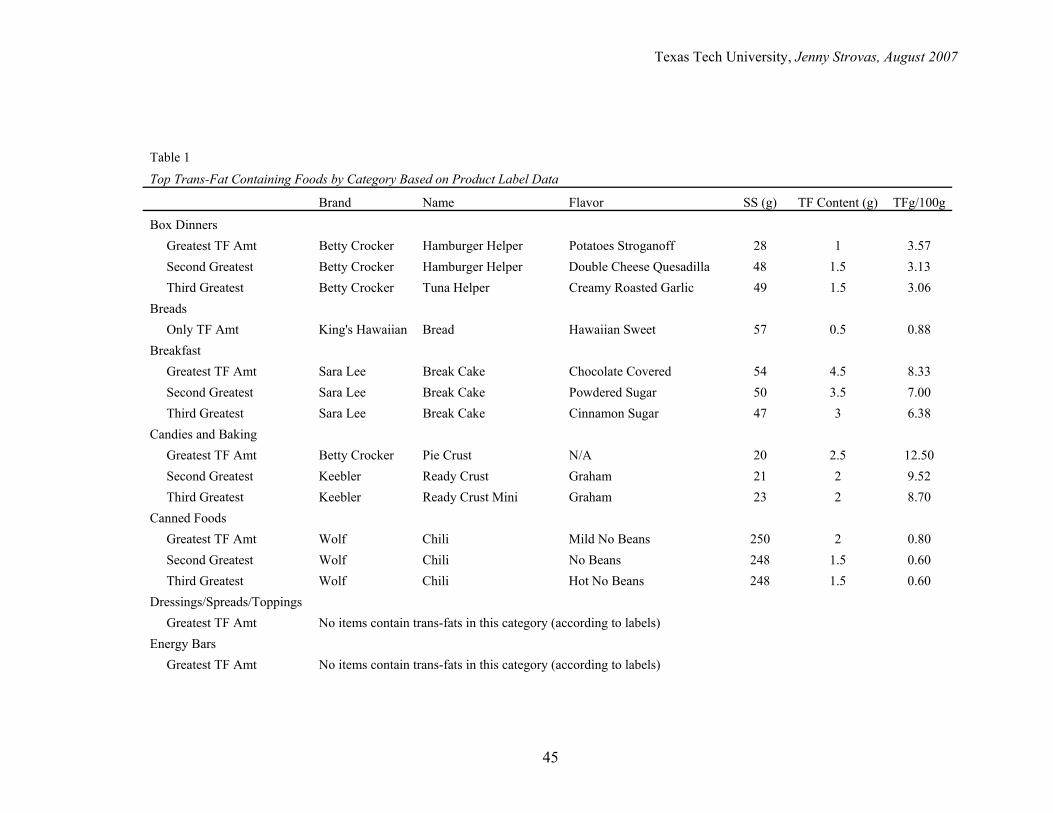
Texas Tech University, Jenny Strovas, August 2007
Table 1
Top Trans-Fat Containing Foods by Category Based on Product Label Data
Brand Name Flavor SS (g) TF Content (g) TFg/100g
Box Dinners Greatest TF Amt Betty Crocker Hamburger Helper Potatoes Stroganoff 28 1 3.57 Second Greatest Betty Crocker Hamburger Helper Double Cheese Quesadilla 48 1.5 3.13 Third Greatest Betty Crocker Tuna Helper Creamy Roasted Garlic 49 1.5 3.06 Breads Only TF Amt King's Hawaiian Bread Hawaiian Sweet 57 0.5 0.88 Breakfast Greatest TF Amt Sara Lee Break Cake Chocolate Covered 54 4.5 8.33 Second Greatest Sara Lee Break Cake Powdered Sugar 50 3.5 7.00 Third Greatest Sara Lee Break Cake Cinnamon Sugar 47 3 6.38 Candies and Baking Greatest TF Amt Betty Crocker Pie Crust N/A 20 2.5 12.50 Second Greatest Keebler Ready Crust Graham 21 2 9.52 Third Greatest Keebler Ready Crust Mini Graham 23 2 8.70 Canned Foods Greatest TF Amt Wolf Chili Mild No Beans 250 2 0.80 Second Greatest Wolf Chili No Beans 248 1.5 0.60 Third Greatest Wolf Chili Hot No Beans 248 1.5 0.60 Dressings/Spreads/Toppings Greatest TF Amt No items contain trans-fats in this category (according to labels) Energy Bars Greatest TF Amt No items contain trans-fats in this category (according to labels)
45
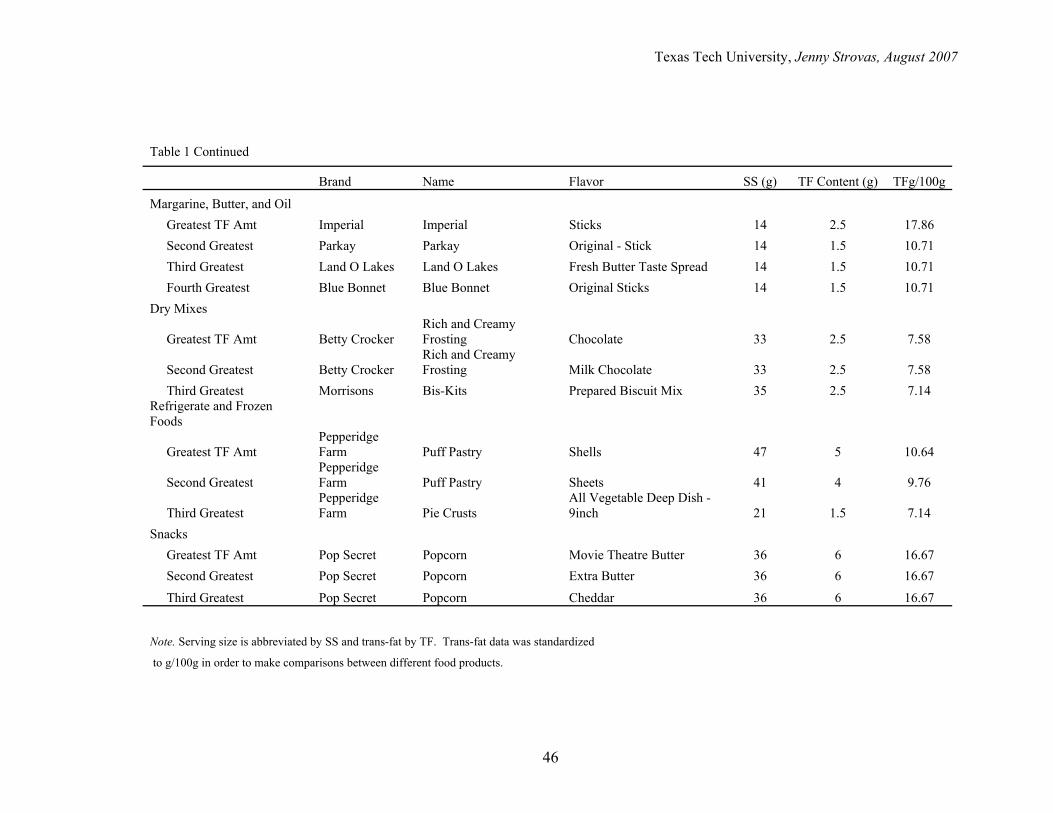
Texas Tech University, Jenny Strovas, August 2007
46
Table 1 Continued
Brand Name Flavor SS (g) TF Content (g) TFg/100g
Margarine, Butter, and Oil Greatest TF Amt Imperial Imperial Sticks 14 2.5 17.86 Second Greatest Parkay Parkay Original - Stick 14 1.5 10.71 Third Greatest Land O Lakes Land O Lakes Fresh Butter Taste Spread 14 1.5 10.71 Fourth Greatest Blue Bonnet Blue Bonnet Original Sticks 14 1.5 10.71 Dry Mixes
Greatest TF Amt Betty Crocker Rich and Creamy Frosting Chocolate 33 2.5 7.58
Second Greatest Betty Crocker Rich and Creamy Frosting Milk Chocolate 33 2.5 7.58
Third Greatest Morrisons Bis-Kits Prepared Biscuit Mix 35 2.5 7.14 Refrigerate and Frozen Foods
Greatest TF Amt Pepperidge Farm Puff Pastry Shells 47 5 10.64
Second Greatest Pepperidge Farm Puff Pastry Sheets 41 4 9.76
Third Greatest Pepperidge Farm Pie Crusts
All Vegetable Deep Dish - 9inch 21 1.5 7.14
Snacks Greatest TF Amt Pop Secret Popcorn Movie Theatre Butter 36 6 16.67 Second Greatest Pop Secret Popcorn Extra Butter 36 6 16.67
Third Greatest Pop Secret Popcorn Cheddar 36 6 16.67
Note. Serving size is abbreviated by SS and trans-fat by TF. Trans-fat data was standardized to g/100g in order to make comparisons between different food products.
Texas Tech University, Jenny Strovas, August 2007
47
Table 2 KMO and Bartlett's Test of Sphericity Determined if Factor Analysis was Appropriate for the Data Set
Knowledge Attitude Behavior Self
Efficacy Sig. Levels Sig. Levels Sig. Levels Sig. Levels KMO 0.668 0.751 0.795 0.739 Bartlet's Test Approx Chi-square 94.138 166.772 334.608 169.399 df 36 15 28 3 sig 0.00* 0.00* 0.00* 0.00* Note. Kaiser-Meyer-Olkin (KMO) is a measure of sampling adequacy while Bartlet's Test confirms that the data set is appropriate for factor analysis. Significance is noted by an *.
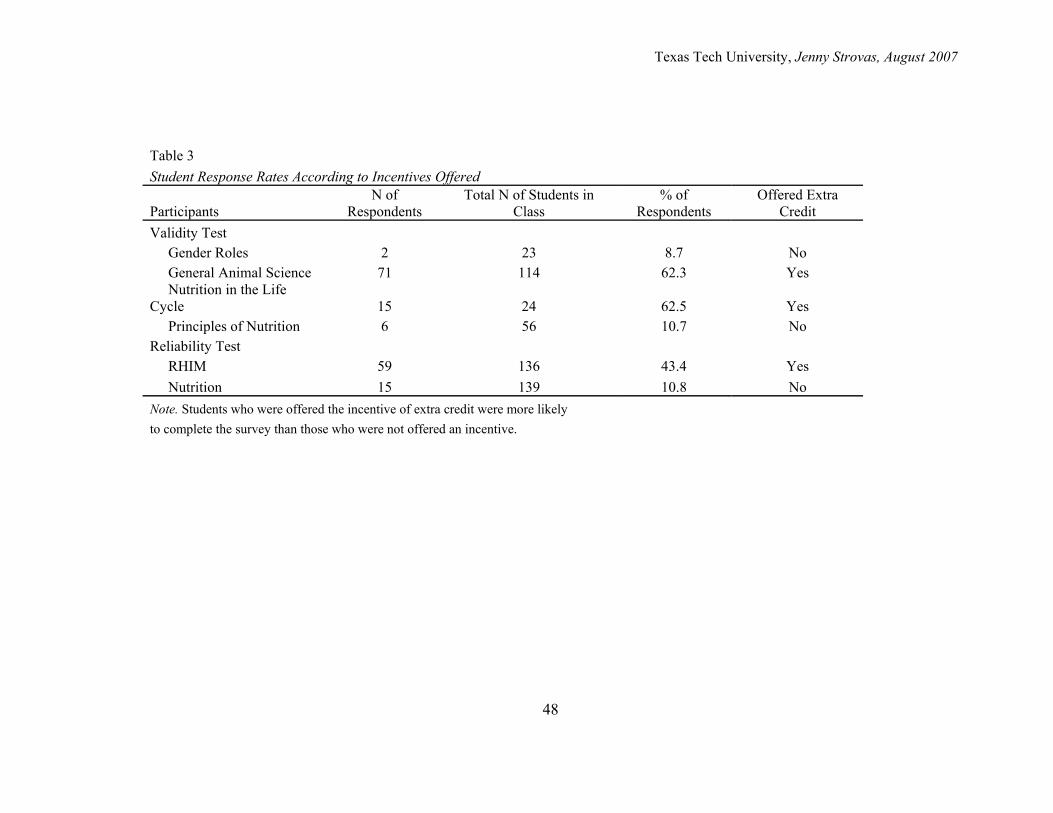
Texas Tech University, Jenny Strovas, August 2007
48
Table 3 Student Response Rates According to Incentives Offered
Participants N of
Respondents Total N of Students in
Class % of
Respondents Offered Extra
Credit Validity Test Gender Roles 2 23 8.7 No General Animal Science 71 114 62.3 Yes Nutrition in the Life Cycle 15 24 62.5 Yes Principles of Nutrition 6 56 10.7 No Reliability Test RHIM 59 136 43.4 Yes Nutrition 15 139 10.8 No Note. Students who were offered the incentive of extra credit were more likely to complete the survey than those who were not offered an incentive.
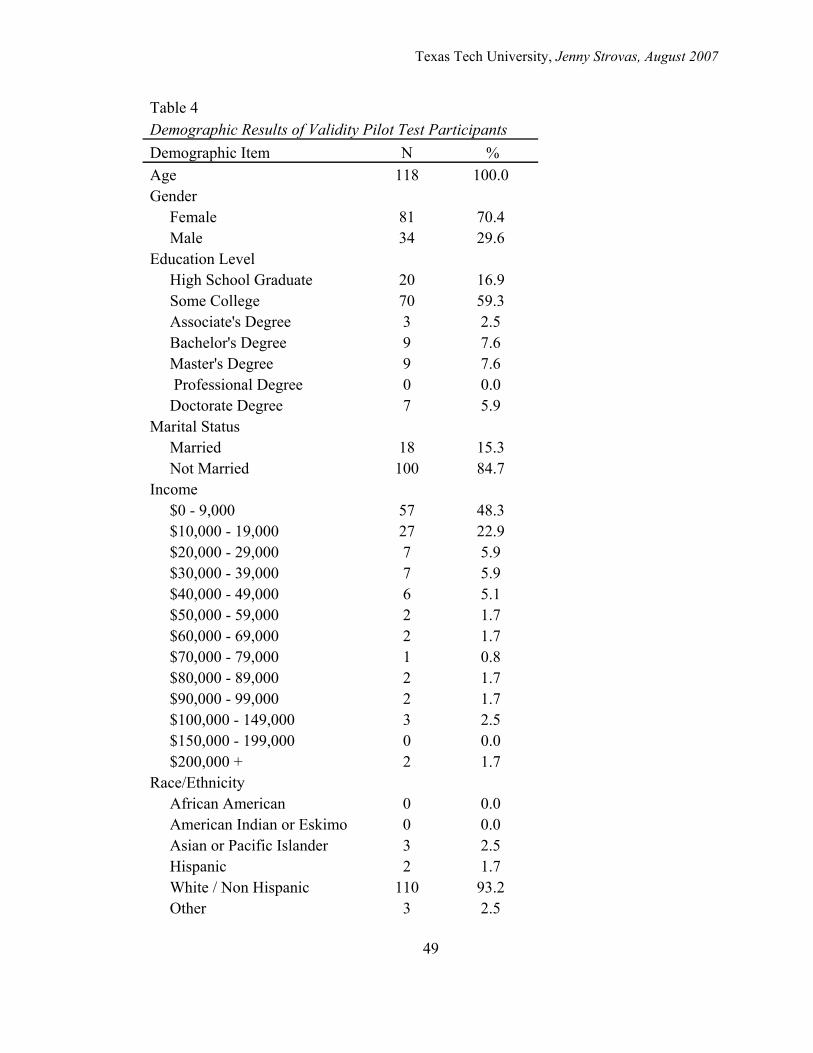
Texas Tech University, Jenny Strovas, August 2007
49
Table 4 Demographic Results of Validity Pilot Test Participants Demographic Item N % Age 118 100.0 Gender Female 81 70.4 Male 34 29.6 Education Level High School Graduate 20 16.9 Some College 70 59.3 Associate's Degree 3 2.5 Bachelor's Degree 9 7.6 Master's Degree 9 7.6 Professional Degree 0 0.0 Doctorate Degree 7 5.9 Marital Status Married 18 15.3 Not Married 100 84.7 Income $0 - 9,000 57 48.3 $10,000 - 19,000 27 22.9 $20,000 - 29,000 7 5.9 $30,000 - 39,000 7 5.9 $40,000 - 49,000 6 5.1 $50,000 - 59,000 2 1.7 $60,000 - 69,000 2 1.7 $70,000 - 79,000 1 0.8 $80,000 - 89,000 2 1.7 $90,000 - 99,000 2 1.7 $100,000 - 149,000 3 2.5 $150,000 - 199,000 0 0.0 $200,000 + 2 1.7 Race/Ethnicity African American 0 0.0 American Indian or Eskimo 0 0.0 Asian or Pacific Islander 3 2.5 Hispanic 2 1.7 White / Non Hispanic 110 93.2 Other 3 2.5
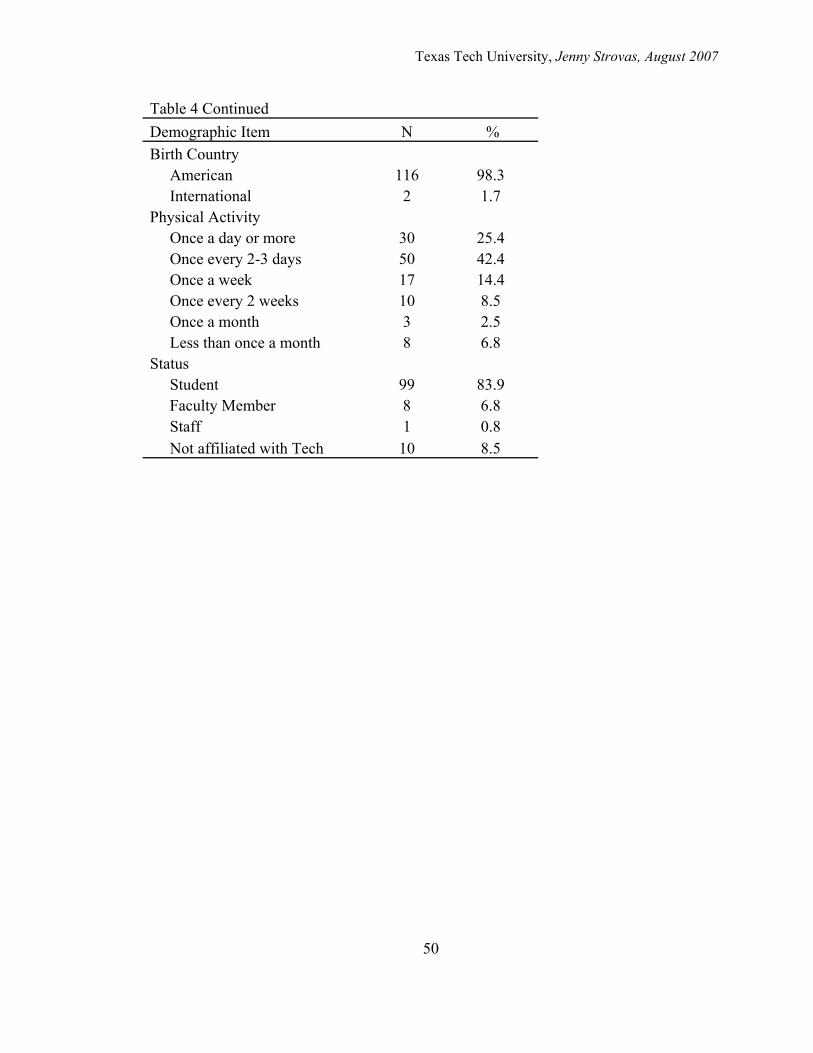
Texas Tech University, Jenny Strovas, August 2007
50
Table 4 Continued Demographic Item N % Birth Country American 116 98.3 International 2 1.7 Physical Activity Once a day or more 30 25.4 Once every 2-3 days 50 42.4 Once a week 17 14.4 Once every 2 weeks 10 8.5 Once a month 3 2.5 Less than once a month 8 6.8 Status Student 99 83.9 Faculty Member 8 6.8 Staff 1 0.8 Not affiliated with Tech 10 8.5
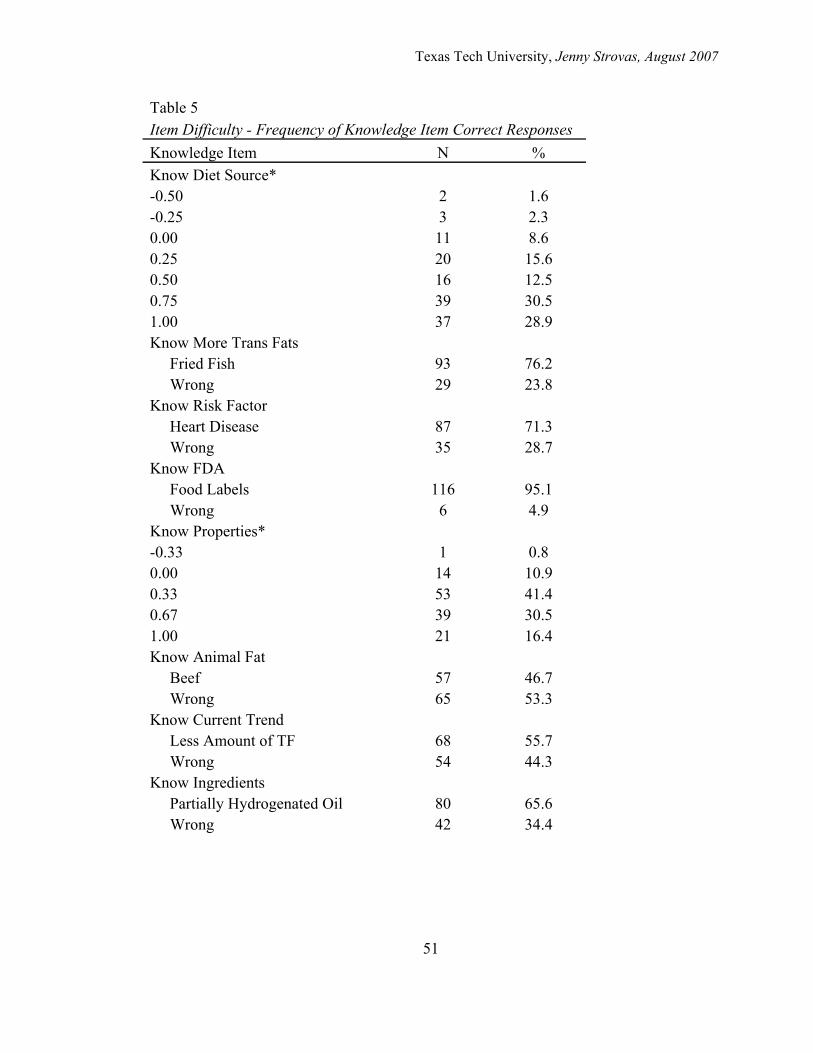
Texas Tech University, Jenny Strovas, August 2007
51
Table 5 Item Difficulty - Frequency of Knowledge Item Correct Responses Knowledge Item N % Know Diet Source* -0.50 2 1.6 -0.25 3 2.3 0.00 11 8.6 0.25 20 15.6 0.50 16 12.5 0.75 39 30.5 1.00 37 28.9 Know More Trans Fats Fried Fish 93 76.2 Wrong 29 23.8 Know Risk Factor Heart Disease 87 71.3 Wrong 35 28.7 Know FDA Food Labels 116 95.1 Wrong 6 4.9 Know Properties* -0.33 1 0.8 0.00 14 10.9 0.33 53 41.4 0.67 39 30.5 1.00 21 16.4 Know Animal Fat Beef 57 46.7 Wrong 65 53.3 Know Current Trend Less Amount of TF 68 55.7 Wrong 54 44.3 Know Ingredients Partially Hydrogenated Oil 80 65.6 Wrong 42 34.4
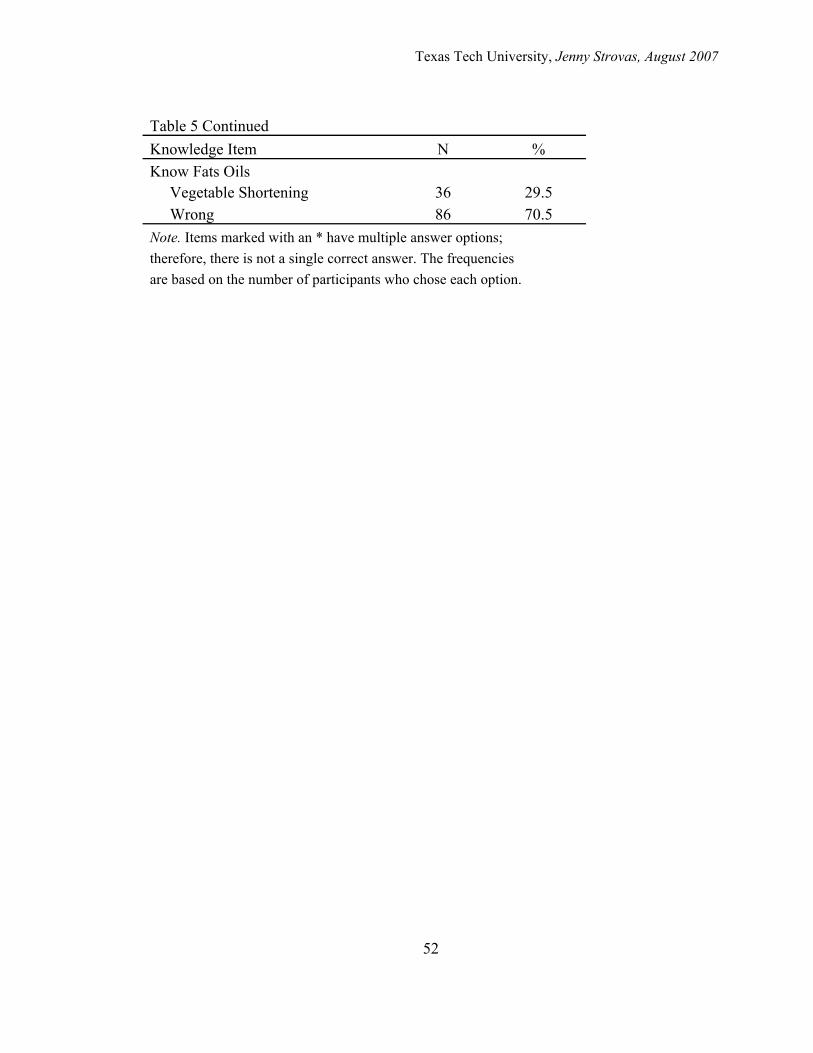
Texas Tech University, Jenny Strovas, August 2007
52
Table 5 Continued Knowledge Item N % Know Fats Oils Vegetable Shortening 36 29.5 Wrong 86 70.5 Note. Items marked with an * have multiple answer options; therefore, there is not a single correct answer. The frequencies are based on the number of participants who chose each option.
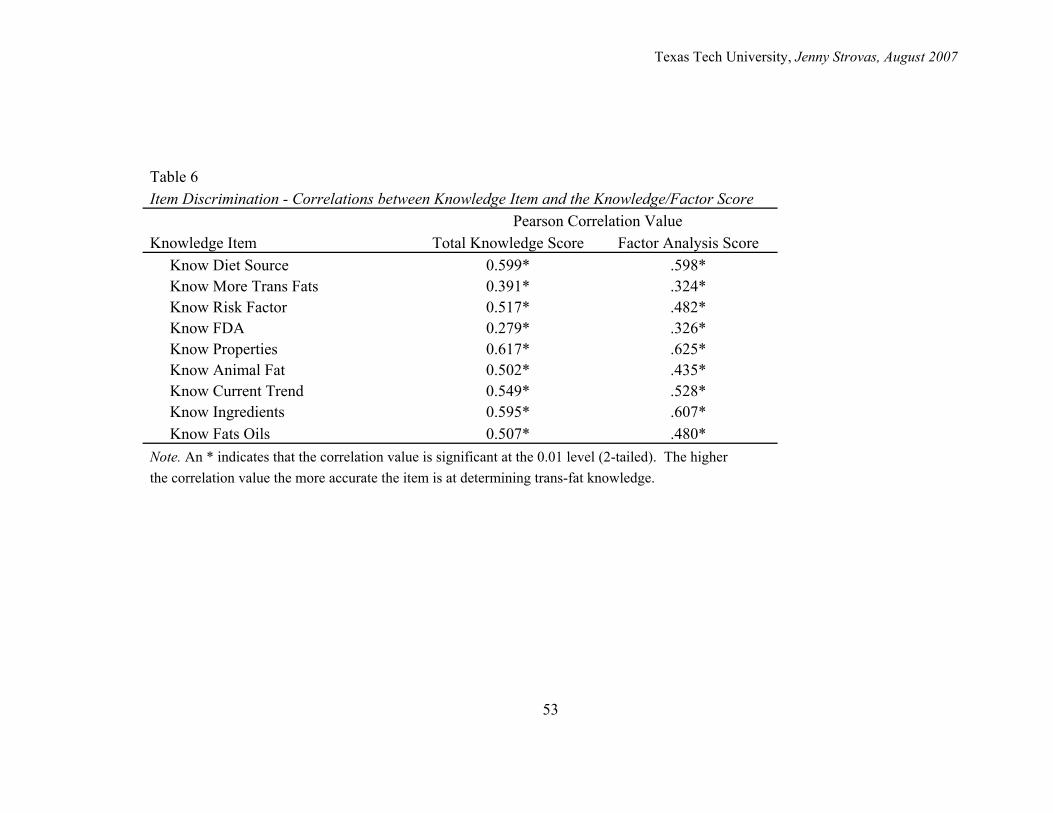
Texas Tech University, Jenny Strovas, August 2007
53
Table 6 Item Discrimination - Correlations between Knowledge Item and the Knowledge/Factor Score Pearson Correlation Value Knowledge Item Total Knowledge Score Factor Analysis Score Know Diet Source 0.599* .598* Know More Trans Fats 0.391* .324* Know Risk Factor 0.517* .482* Know FDA 0.279* .326* Know Properties 0.617* .625* Know Animal Fat 0.502* .435* Know Current Trend 0.549* .528* Know Ingredients 0.595* .607* Know Fats Oils 0.507* .480* Note. An * indicates that the correlation value is significant at the 0.01 level (2-tailed). The higher the correlation value the more accurate the item is at determining trans-fat knowledge.
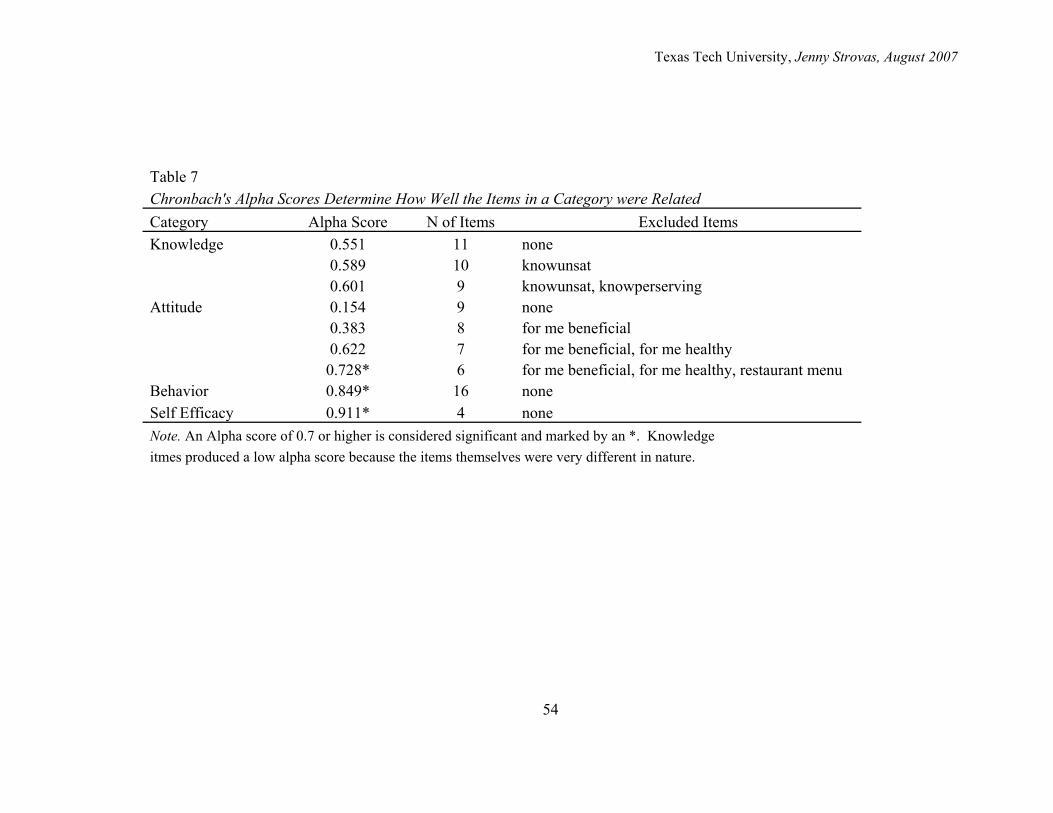
Texas Tech University, Jenny Strovas, August 2007
54
Table 7 Chronbach's Alpha Scores Determine How Well the Items in a Category were Related Category Alpha Score N of Items Excluded Items Knowledge 0.551 11 none 0.589 10 knowunsat 0.601 9 knowunsat, knowperserving Attitude 0.154 9 none 0.383 8 for me beneficial 0.622 7 for me beneficial, for me healthy 0.728* 6 for me beneficial, for me healthy, restaurant menu Behavior 0.849* 16 none Self Efficacy 0.911* 4 none Note. An Alpha score of 0.7 or higher is considered significant and marked by an *. Knowledge itmes produced a low alpha score because the items themselves were very different in nature.
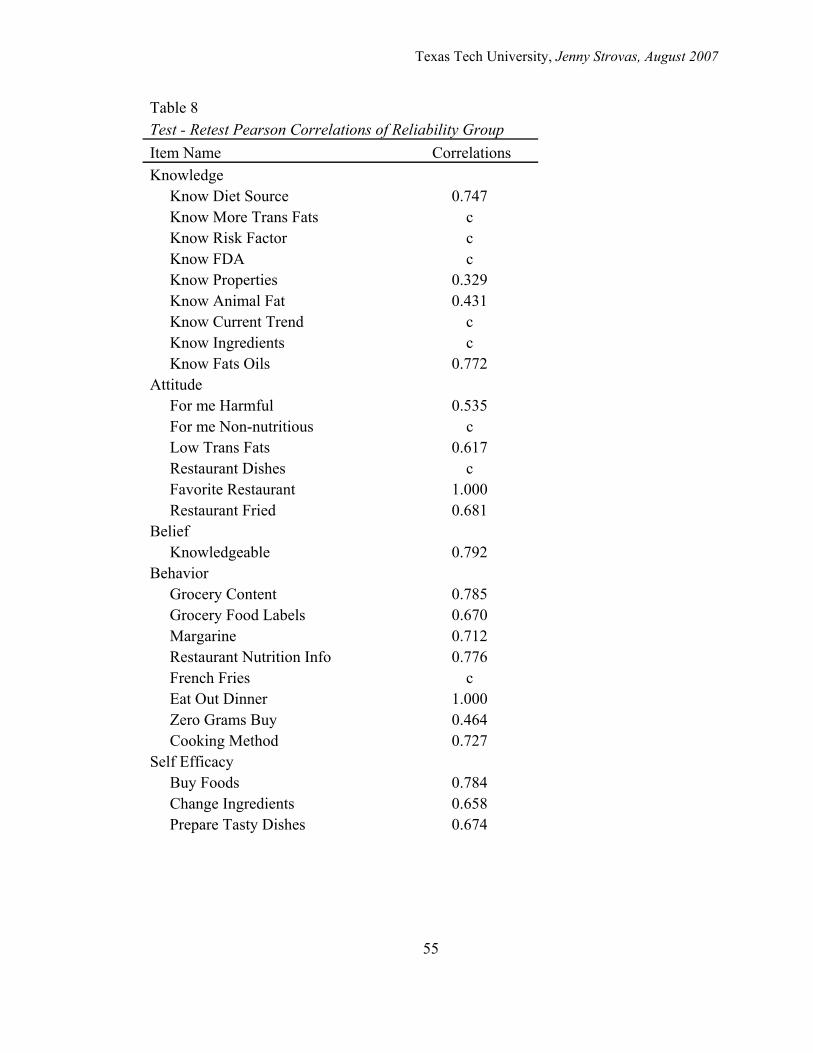
Texas Tech University, Jenny Strovas, August 2007
55
Table 8 Test - Retest Pearson Correlations of Reliability Group Item Name Correlations Knowledge Know Diet Source 0.747 Know More Trans Fats c Know Risk Factor c Know FDA c Know Properties 0.329 Know Animal Fat 0.431 Know Current Trend c Know Ingredients c Know Fats Oils 0.772 Attitude For me Harmful 0.535 For me Non-nutritious c Low Trans Fats 0.617 Restaurant Dishes c Favorite Restaurant 1.000 Restaurant Fried 0.681 Belief Knowledgeable 0.792 Behavior Grocery Content 0.785 Grocery Food Labels 0.670 Margarine 0.712 Restaurant Nutrition Info 0.776 French Fries c Eat Out Dinner 1.000 Zero Grams Buy 0.464 Cooking Method 0.727 Self Efficacy Buy Foods 0.784 Change Ingredients 0.658 Prepare Tasty Dishes 0.674
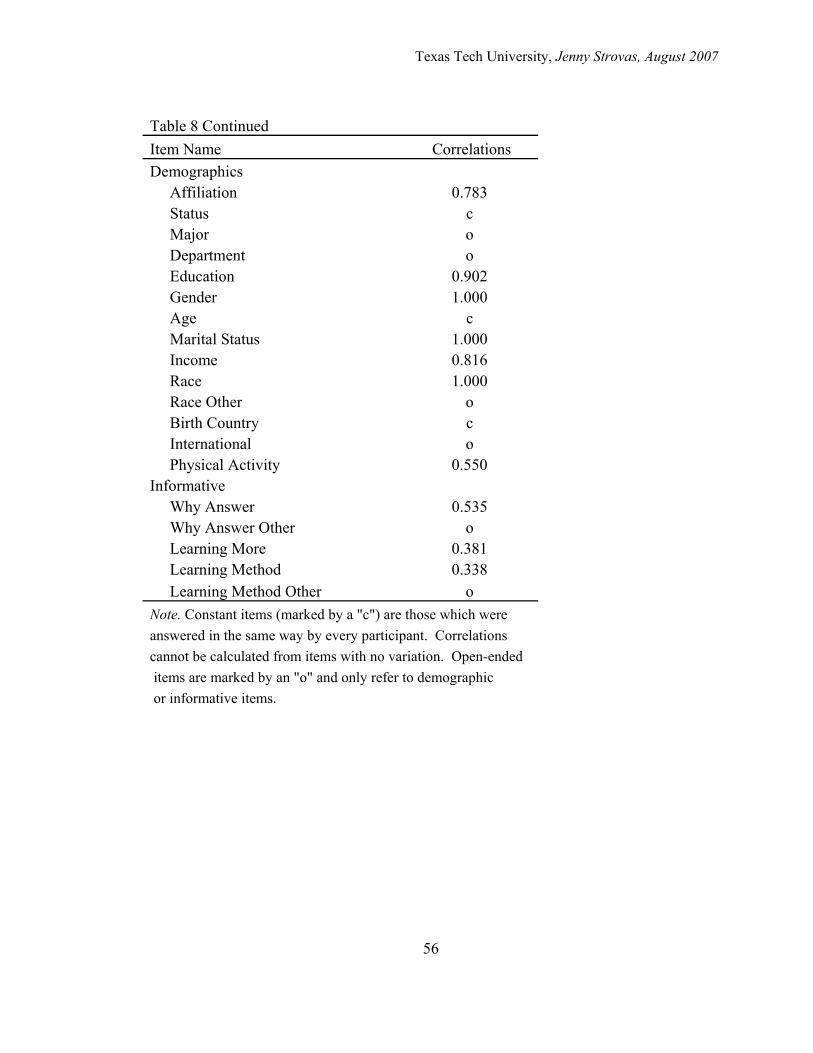
Texas Tech University, Jenny Strovas, August 2007
56
Table 8 Continued Item Name Correlations Demographics Affiliation 0.783 Status c Major o Department o Education 0.902 Gender 1.000 Age c Marital Status 1.000 Income 0.816 Race 1.000 Race Other o Birth Country c International o Physical Activity 0.550 Informative Why Answer 0.535 Why Answer Other o Learning More 0.381 Learning Method 0.338 Learning Method Other o Note. Constant items (marked by a "c") are those which were answered in the same way by every participant. Correlations cannot be calculated from items with no variation. Open-ended items are marked by an "o" and only refer to demographic or informative items.
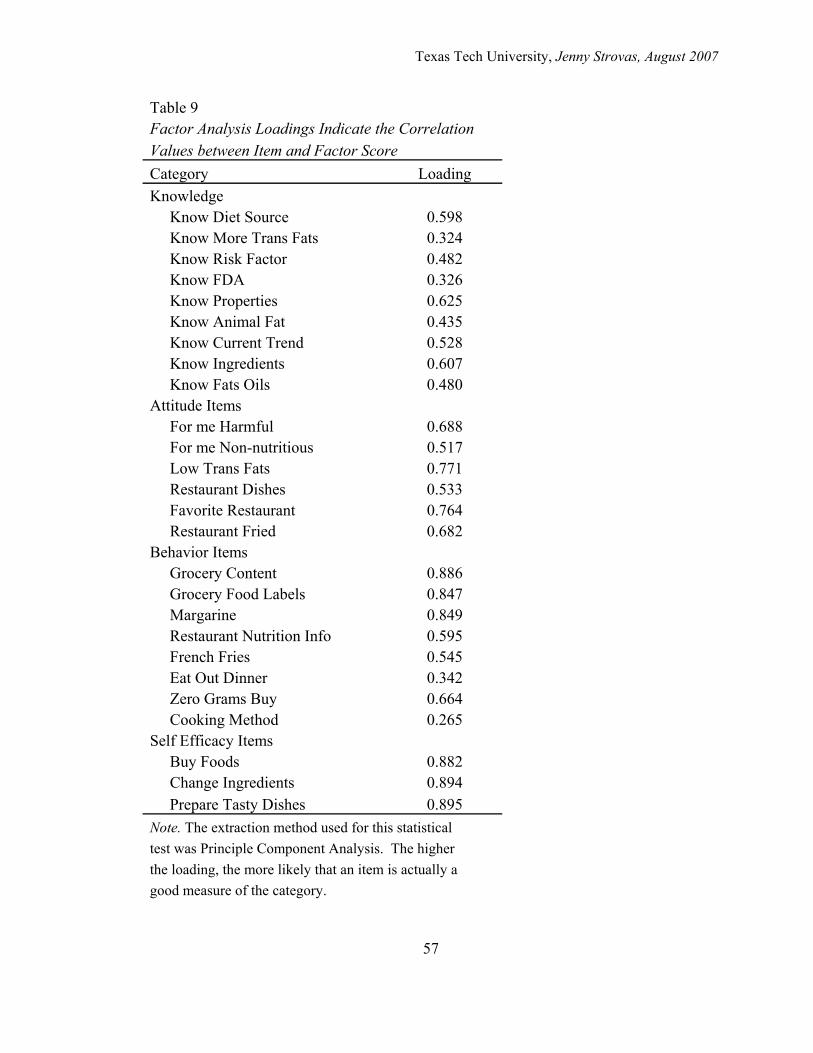
Texas Tech University, Jenny Strovas, August 2007
57
Table 9 Factor Analysis Loadings Indicate the Correlation Values between Item and Factor Score Category Loading Knowledge Know Diet Source 0.598 Know More Trans Fats 0.324 Know Risk Factor 0.482 Know FDA 0.326 Know Properties 0.625 Know Animal Fat 0.435 Know Current Trend 0.528 Know Ingredients 0.607 Know Fats Oils 0.480 Attitude Items For me Harmful 0.688 For me Non-nutritious 0.517 Low Trans Fats 0.771 Restaurant Dishes 0.533 Favorite Restaurant 0.764 Restaurant Fried 0.682 Behavior Items Grocery Content 0.886 Grocery Food Labels 0.847 Margarine 0.849 Restaurant Nutrition Info 0.595 French Fries 0.545 Eat Out Dinner 0.342 Zero Grams Buy 0.664 Cooking Method 0.265 Self Efficacy Items Buy Foods 0.882 Change Ingredients 0.894 Prepare Tasty Dishes 0.895 Note. The extraction method used for this statistical test was Principle Component Analysis. The higher the loading, the more likely that an item is actually a good measure of the category.
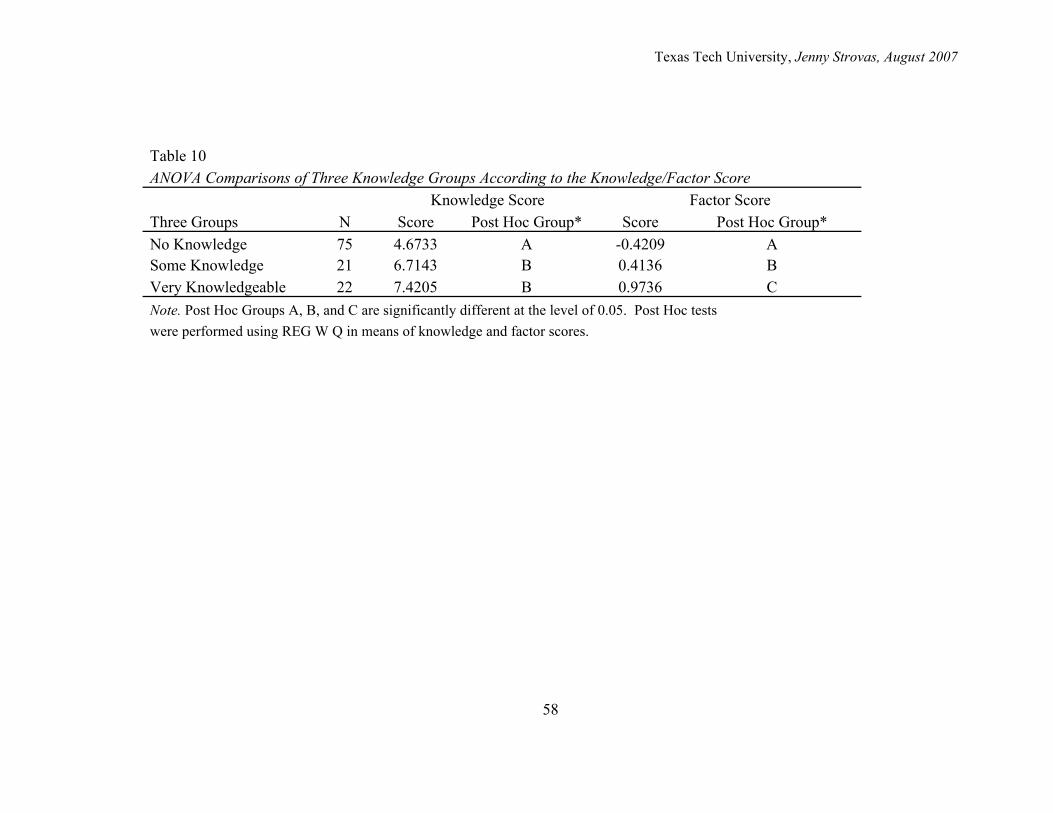
Texas Tech University, Jenny Strovas, August 2007
58
Table 10 ANOVA Comparisons of Three Knowledge Groups According to the Knowledge/Factor Score Knowledge Score Factor Score Three Groups N Score Post Hoc Group* Score Post Hoc Group* No Knowledge 75 4.6733 A -0.4209 A Some Knowledge 21 6.7143 B 0.4136 B Very Knowledgeable 22 7.4205 B 0.9736 C Note. Post Hoc Groups A, B, and C are significantly different at the level of 0.05. Post Hoc tests were performed using REG W Q in means of knowledge and factor scores.
Texas Tech University, Jenny Strovas, August 2007
59
CHAPTER V
CONCLUSION
The results from this project provides invaluable information in regards to current
food products that contain trans-fats, and the development and pilot testing of a trans-fat
survey. The database served to identify which food products still contain a significant
amount of trans-fat post 2006 labeling regulations. This information will be useful for
consumers who need more information in order to make healthy food choices. The
survey was developed to evaluate people’s understanding and behaviors toward trans-
fats, in hopes of designing education programs in the future to address these issues.
Trans-Fat Database
The trans-fat database provided invaluable information regarding food products
that, according to the label, still contain trans-fats. Of the 3,188 food products recorded
approximately 17% contained trans-fatty acids after the implementation of the labeling
law. However, the ingredients section of the food label was not checked for the presence
of partially hydrogenated oil. Although the information collected will be useful in future
research, it is limited by not knowing exactly which food products use partially
hydrogenated oil as an ingredient. This suggests that trans-fat amounts should be listed
per 100g of food product to ensure accurate information on trans-fat content that is no
bias by serving size.
Texas Tech University, Jenny Strovas, August 2007
60
Additional research utilizing this database exists that is beyond the scope of this
particular project. For example, the information collected could be used to compare
national brands to determine if certain food companies are more concerned with trans-fat
content than others. Another possible research idea would be to compare saturated fat
levels with trans-fat levels to determine if there is a relationship. It would be interesting
to know if levels of these types of fatty acids in foods are inversely correlated.
Trans-Fat Survey
The survey project was designed to create a valid and reliable instrument for
measuring a variety of parameters related to trans-fat, such as knowledge, attitude, belief,
behavior, and self efficacy. The survey was initially developed with 54 items, but the
final measure only had 41 items. The results from this pilot test justify the use of this
tool to measure knowledge because it has the ability to discriminate between groups of
varying knowledge levels.
The validity group was well represented with 118 participants; however, the
reliability group had a small sample size of 15. This difference in sample sizes was
largely due to incentives being offered. The pilot testing of this survey lead to important
findings such as: the importance of using a knowledgeable group to test reliability on
knowledge related items; and the fact that incentives are needed to obtain an adequate
sample size, but it may lead to unreliable results.
Both the validity and reliability pilot tests were used to distinguish which items
would be appropriate for the final instrument. Items were deleted due to a combination
Texas Tech University, Jenny Strovas, August 2007
61
of low CA and test-retest reliability values. No items were deleted due to item difficulty,
item discrimination, or factor analysis loading correlations. A one-way ANOVA was
performed on factor analysis scores to determine where significant differences occurred
in knowledge levels of the varying knowledge groups. This analysis determined that the
survey was a good measure for use in discriminating between people with dissimilar
trans-fat knowledge levels.
According to the pilot test results, many participants did not know what trans-fats
are or how they affect our health. In order for labeling laws and restaurant regulations to
be effective, education programs must be developed and implemented. One question on
the survey addressed this issue by asking participants if they would like to learn more
about trans-fats and in what form they would want to learn it. Of the validity pilot test
respondents, 41.5% answered that they would like to learn more about trans-fats and
44.1% said they might want to learn more. The learning method preferred by most
participants was online (76.8%).
The final instrument, designed from the pilot test, will be used during the summer
of 2007 to assess trans-fat knowledge levels of students, faculty, and staff of Texas Tech
University. The survey will be dispersed via Tech Announce, an email notification
system on campus, multiple times over the summer. The first 50 survey respondents will
receive a free Subway sandwich coupon. Drawings will be held throughout the summer
for other incentive prizes such as 2 iPod Shuffles and 1 -1GB Memorex Travel Drive.
The results from this final survey instrument will provide insight in to the kind of
education programs that need to be designed and implemented in order for the public to
know more about trans-fats. After initiating these education programs, it would be
Texas Tech University, Jenny Strovas, August 2007
62
interesting to determine if people feel deceived by the current Food and Drug
Administration’s labeling laws. According to these laws, food companies are legally
allowed to label their products with “0 grams of trans-fats,” even if the product contains
up to 0.49 grams of trans-fat per serving. This seems to be a direct effort by the FDA to
confuse consumers and would be an interesting follow up study to trans-fat education
programs.
Texas Tech University, Jenny Strovas, August 2007
63
LITERATURE CITED
Allison, D., Egan, K., & Barraj, L., Caughman, L., Infante, M., & Heimbach, J.T. (1999). Estimated intakes of trans fatty and other acids in the US population. J Am. Diet. Assoc., 99, 166-174.
Aro, A., & Kardinaal, A.F.M. (1995). Adipose tissue isomeric trans fatty acids and risk of myocardial infarction in nine countries: the Euramic Study. Lancet, 345, 273- 278. Ascherio, A., Stampfer, M.J., & Willett, W.C. (1999). Trans-fatty acids and coronary heart disease. Retrieved November 5, 2005, from Havard School of Public Health web site: www.hsph.harvard.edu/reviews/transfats.html Ault, A. (2003, July 19). FDA says it will require trans-fat amounts on food labels. The Lancet, 362. Baylin, A., Kabagambe, E.K., Ascherio, A., Spiegelman, D., & Campos, H. (2003). High 18:2 trans-fatty acids in adipose tissue are associated with increased risk of nonfatal acute myocardial infarction in Costa Rican adults. Journal of Nutrition, 133, 1186-1191. Bensadoun, A. (2003). Trans fatty acids – health and labeling issues. Retrieved October 22, 2005, from Cornell University Division of Nutritional Sciences web site: http://www.nutrition.cornell.edu/index.html. Bray, G.A., Lovejoy, J.C., Smith, S.R., DeLany, J.P., Lefevre, M., Hwang, D., Ryan, D.H., & York, D.A. (2002). The influence of different fats and fatty acids on obesity, insulin resistance and inflammation. J. Nutr., 132, 2488-2491. Caruso, D.B. (2006). KFC to use no-trans-fat oil in chicken. ABC News Health. Retrieved November 1, 2006, from ABC News Health web site: http://abcnews.go.com/Health/wireStory?id=2615574 Conn, R., Koontz, S., & Richardson, K. (2006, June 19). Trans fat leads to weight gain even on same total calories, animal study shows. Retrieved June 22, 2006, from Wake Forest University Baptist Medical Center web site: http://www1.wfubmc.edu/news/NewsArticle.htm?Articleid=1869 Craig-Schmidt, M.C. (2006). World-wide consumption of trans fatty acids. Artherosclerosis Supplements, 7, 1-4.
Texas Tech University, Jenny Strovas, August 2007
64
Frumkin, P. (2006, October 9). Proposed trans fat ban in NYC has industry fearful of “domino” effect. Restaurant News, 20(42), p.6. George, D., & Mallery, P. (2005). SPSS for windows step by step –a simple guide and reference 12.0 update. Boston, MA: Pearson Education Inc. Gorsuch, R.L. (1997). Exploratory factor analysis: its role in item analysis. Journal of Personality Assessment, 68(3), 532-560. Gravetter, F.J., & Wallnau, L.B. (2005). Essentials of statistics for the behavioral sciences. Belmont, CA: Thomson Wadsworth Publishing Co. Gropper, S.S., Smith, J.L., & Groff, J.L. (2005). Advanced nutrition and human metabolism. Belmont, CA: Thomson Wadsworth Publishing Co. Harnack, L., Lee, S., Schakel, S.F., Duval, S., Luepker, R.V., & Arnett, D.K. (2003). Trends in the trans-fatty acid composition of the diet in a metropolitan area: the Minnesota Heart Survey. J. Am. Dietetic Assoc., 103(9), 1160-1166. Hess, S., Yanes, M., Jourdan, P., Edelstein, S. (2005). Trans fat knowledge is related to education level and nutrition facts label use in health-conscious adults. Top. Clin. Nutr., 20(2), 109-117. Kirksey, O., Harper, K., Thompson, S., & Pringle, M. (2004). Assessment of selected patient educational materials of various chain pharmacies. Journal of Health Communication, 9(2), 91-93. Kohlmeier, L. (1997). High consumption of trans fatty acids raises the risk of breast cancer. Modern Medicine, 65(11). Larque, E., Zamora, S., & Gil, A. (2001). Dietary trans fatty acids in early life: a review. Early Human Dev, 65; 31-41. Lichtenstein, A.H., Appel, L.J., Brands, M., Carnethon, M., Daniels, S., Franch, H., Franklin, B., Kris-Etherton, P., Harris, W., Howard, B., Karanja, N., Lefevre, M., Rudel, L.,Sacks, F., Van Horn, L., Winston, M., & Wylie-Rosett, J. (2006). Diet and lifestyle recommendations revision 2006: A scientific statement from the American Heart Association Nutrition Committee. Circulation, 114:82-96. Linn, R.L., Miller, M.D. (2005). Measurement and assessment in teaching. Upper Saddle River, New Jersey: Pearson Merrill Prentice Hall. p. 69. Litwin, M.S. (1995), How to measure survey reliability and validity. Thousand Oaks, CA: Sage Publications, Inc.
Texas Tech University, Jenny Strovas, August 2007
65
Lock, A.L., Perfield II, J.W., & Bauman, D.E. (2003, December). Connecting trans fatty acids and human health. Pro-Dairy. Lovejoy, J.C., Smith, S.R., Champagne, C.M., Most, M.M., Lefevre, M., Delany, J.P., Denkins, Y.M., Rood, J.C., Veldhuis, J., & Bray, G.A. (2002). Effects of diets enriched in saturated (palmitic), monounsaturated (oleic), or trans (elaidic) fatty acids on insulin sensitivity and substrate oxidation in healthy adults. Diabetes Care, 25(8), 1283-1288. Mojska, H., Socha, P., Socha, J., Soplinska, E., Jaroszewska-Balicka,W., & Szponar, L. (2003). Trans fatty acids in human milk in Poland and their association with breastfeeding mother’s diets. Acta Paediatr. 92, 1381-1387. Moss, J. (2006). Labeling of trans fatty acid content in food, regulations and limits – The FDA view. Atherosclerosis Supplements, 7, 57-59. Mozaffarian, D., Pischon, T., Hankinson, S.E., Rifai, N., Joshipura, K., Willett, W.C., & Rimm, E.B. (2004). Dietary intake of trans fatty acids and systemic inflammation in women. Am. J. Clin. Nutr. 79, 606-612. National Cattleman’s Beef Association. (2003). Nutrient facts: trans fatty acids. Retrieved September 29, 2005, from National Cattleman’s Beef Association web site: http://www.nebeef.org/post/lfu/Trasn_Fatty_Acid_Fact_Sheet.pdf. Parmenter, K., & Wardle, J. (2000). Evaluation and design of nutrition knowledge measures. Journal of Nutrition Education, 32, 269-277. Salmeron, J., Hu, F.B., Manson, J.E., Stampfer, M.J., Colditz, G.A., Rimm, E.B., & Willet, W.C. (2001). Dietary fat intake and risk of type 2 diabetes in women. Am J Clin Nutr., 73, 1019-1026. Slattery, M.L., Benson, J., Ma, K., Schaffer, D., & Potter, J.D. (2001). Trans-fatty acids and colon cancer. Nutrition and Cancer, 39(2), 170-175. Stender, S., & Dyerberg, J. (2004). Influence of trans fatty acids on health. Annals of Nutrition and Metabolism, 48, 61-66. Stender, S., Dyerberg, J., Bysted, A., Leth, T., & Astrup, A. (2006). A trans world journey. Atherosclerosis Supplements, 7, 47-52. Voorips, L.E., Brants, H.A.M., Kardinaal, A.F.M., Hiddink, G.J., Brandt, P.A., & Goldbohm, R.A. (2002). Intake of conjugated linoleic acid, fat, and other fatty acids in relation to postmenopausal breast cancer: the Netherlands cohort study on diet and cancer. Am J Clin Nutr., 76, 873-882.
Texas Tech University, Jenny Strovas, August 2007
66
Welland, S.K., Mutius, E.V., Husing, A., Asher, M.I. (1999). Intake of trans fatty acids and prevelance of childhood asthma and allergies in Europe. Lancet, 353(9169). Wendy’s significantly cuts trans fats – switch to new cooking oil under way. (2006, June 8). News at Wendy’s. Retrieved on June 22, 2006, from Wendy’s web site: http://www.wendys.com/about_us/news/index.jsp?news=5 Zamora, A. (2005) Fats, oils, fatty acids, triglycerides - chemical structure. Scientific Psychic. Retrieved on October 15, 2005, from Scientific Psychic web site: http://www.scientificpsychic.com/fitness/fattyacids.html
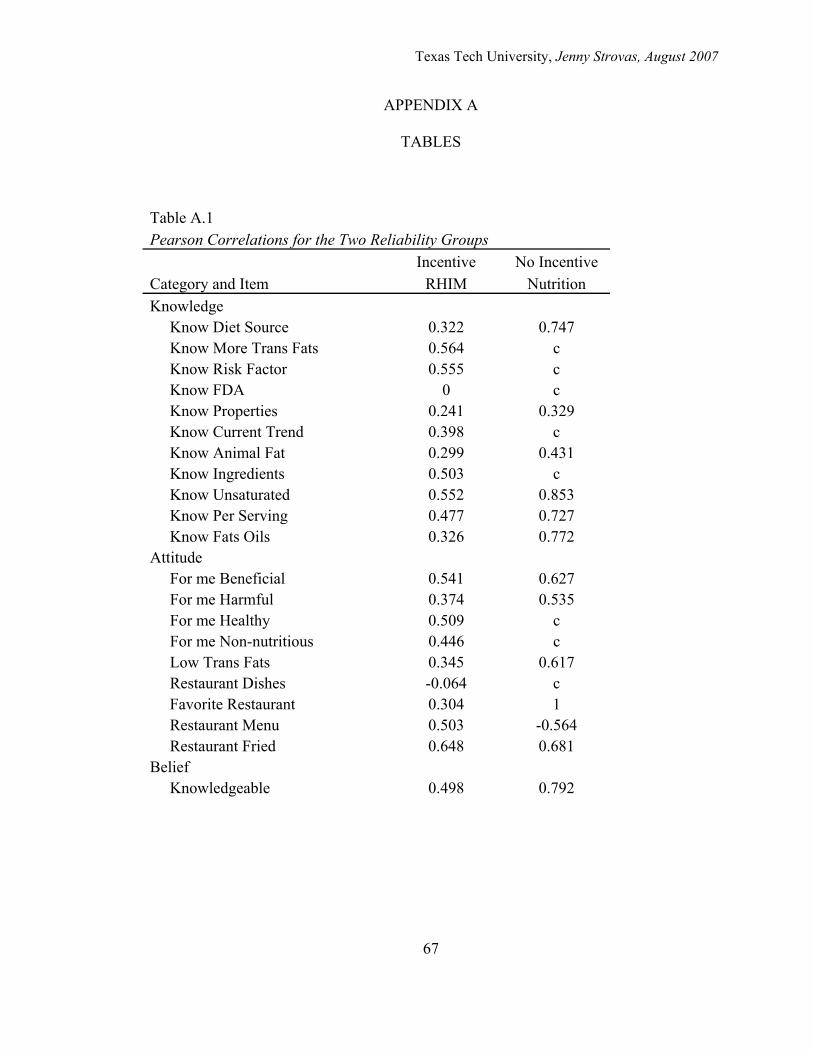
Texas Tech University, Jenny Strovas, August 2007
67
APPENDIX A
TABLES
Table A.1 Pearson Correlations for the Two Reliability Groups Incentive No Incentive Category and Item RHIM Nutrition Knowledge Know Diet Source 0.322 0.747 Know More Trans Fats 0.564 c Know Risk Factor 0.555 c Know FDA 0 c Know Properties 0.241 0.329 Know Current Trend 0.398 c Know Animal Fat 0.299 0.431 Know Ingredients 0.503 c Know Unsaturated 0.552 0.853 Know Per Serving 0.477 0.727 Know Fats Oils 0.326 0.772 Attitude For me Beneficial 0.541 0.627 For me Harmful 0.374 0.535 For me Healthy 0.509 c For me Non-nutritious 0.446 c Low Trans Fats 0.345 0.617 Restaurant Dishes -0.064 c Favorite Restaurant 0.304 1 Restaurant Menu 0.503 -0.564 Restaurant Fried 0.648 0.681 Belief Knowledgeable 0.498 0.792
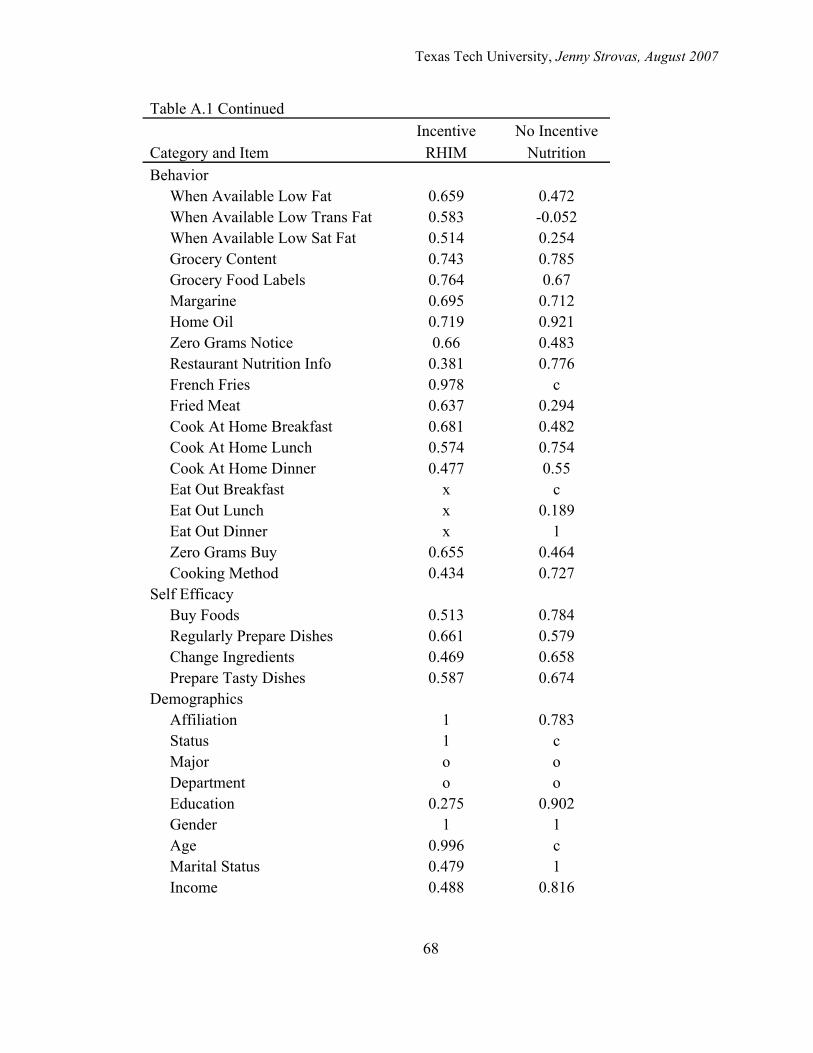
Texas Tech University, Jenny Strovas, August 2007
68
Table A.1 Continued Incentive No Incentive Category and Item RHIM Nutrition Behavior When Available Low Fat 0.659 0.472 When Available Low Trans Fat 0.583 -0.052 When Available Low Sat Fat 0.514 0.254 Grocery Content 0.743 0.785 Grocery Food Labels 0.764 0.67 Margarine 0.695 0.712 Home Oil 0.719 0.921 Zero Grams Notice 0.66 0.483 Restaurant Nutrition Info 0.381 0.776 French Fries 0.978 c Fried Meat 0.637 0.294 Cook At Home Breakfast 0.681 0.482 Cook At Home Lunch 0.574 0.754 Cook At Home Dinner 0.477 0.55 Eat Out Breakfast x c Eat Out Lunch x 0.189 Eat Out Dinner x 1 Zero Grams Buy 0.655 0.464 Cooking Method 0.434 0.727 Self Efficacy Buy Foods 0.513 0.784 Regularly Prepare Dishes 0.661 0.579 Change Ingredients 0.469 0.658 Prepare Tasty Dishes 0.587 0.674 Demographics Affiliation 1 0.783 Status 1 c Major o o Department o o Education 0.275 0.902 Gender 1 1 Age 0.996 c Marital Status 0.479 1 Income 0.488 0.816
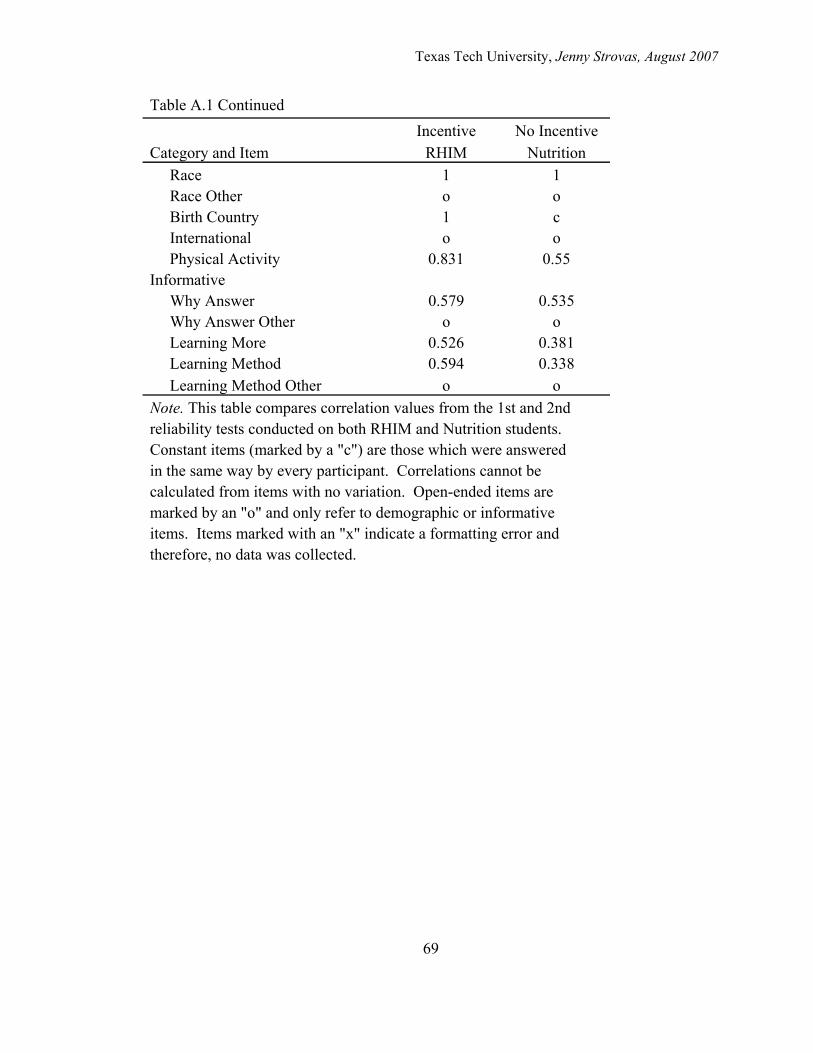
Texas Tech University, Jenny Strovas, August 2007
69
Table A.1 Continued Incentive No Incentive Category and Item RHIM Nutrition Race 1 1 Race Other o o Birth Country 1 c International o o Physical Activity 0.831 0.55 Informative Why Answer 0.579 0.535 Why Answer Other o o Learning More 0.526 0.381 Learning Method 0.594 0.338 Learning Method Other o o Note. This table compares correlation values from the 1st and 2nd reliability tests conducted on both RHIM and Nutrition students. Constant items (marked by a "c") are those which were answered in the same way by every participant. Correlations cannot be calculated from items with no variation. Open-ended items are marked by an "o" and only refer to demographic or informative items. Items marked with an "x" indicate a formatting error and therefore, no data was collected.
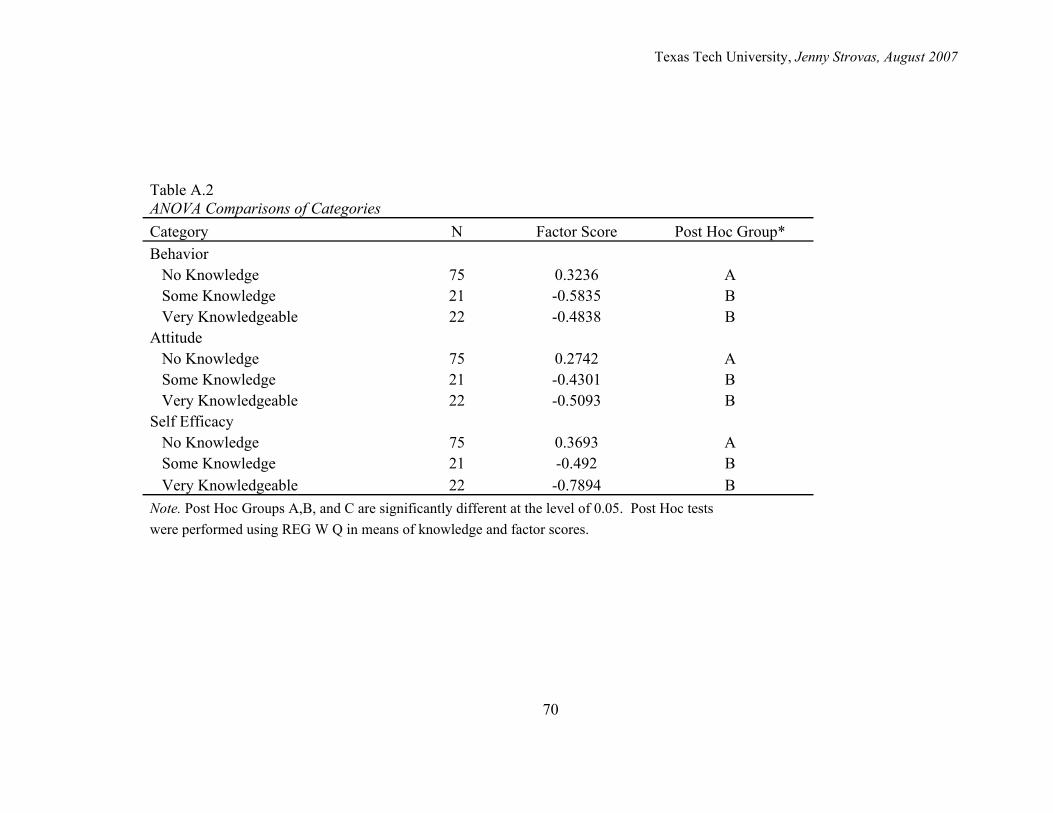
Texas Tech University, Jenny Strovas, August 2007
70
Table A.2 ANOVA Comparisons of Categories Category N Factor Score Post Hoc Group* Behavior No Knowledge 75 0.3236 A Some Knowledge 21 -0.5835 B Very Knowledgeable 22 -0.4838 B Attitude No Knowledge 75 0.2742 A Some Knowledge 21 -0.4301 B Very Knowledgeable 22 -0.5093 B Self Efficacy No Knowledge 75 0.3693 A Some Knowledge 21 -0.492 B Very Knowledgeable 22 -0.7894 B Note. Post Hoc Groups A,B, and C are significantly different at the level of 0.05. Post Hoc tests were performed using REG W Q in means of knowledge and factor scores.
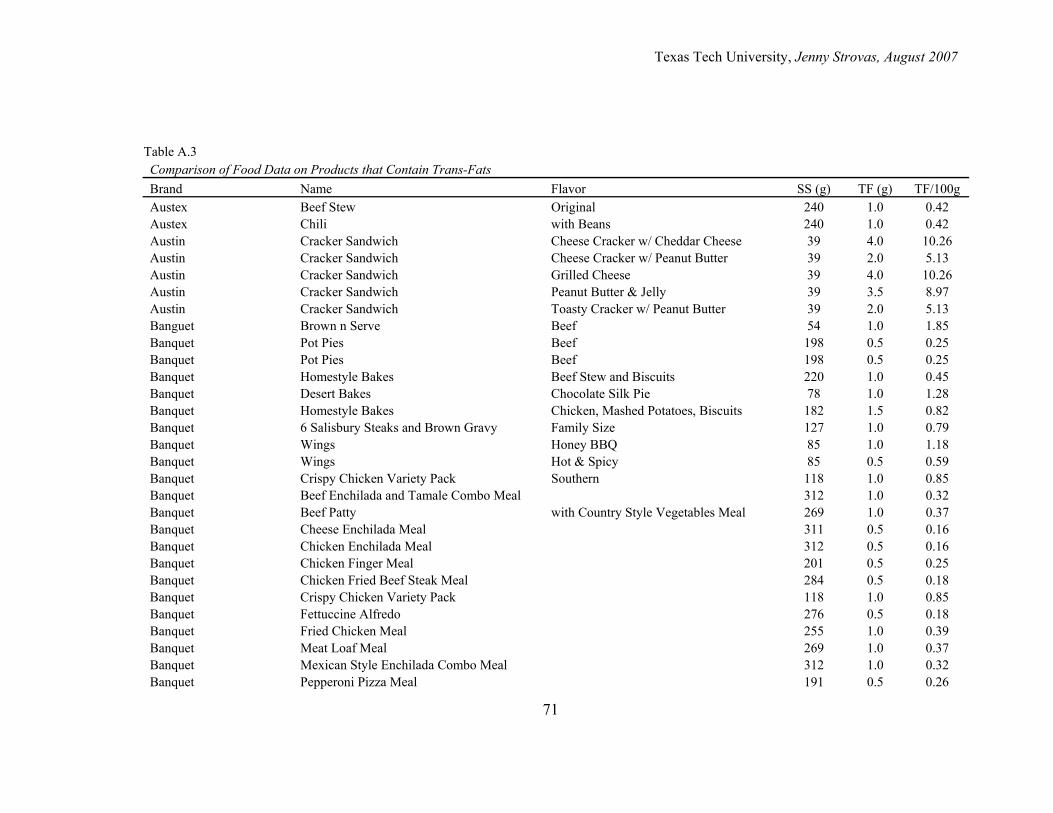
Texas Tech University, Jenny Strovas, August 2007
71
Table A.3 Comparison of Food Data on Products that Contain Trans-Fats Brand Name Flavor SS (g) TF (g) TF/100g Austex Beef Stew Original 240 1.0 0.42 Austex Chili with Beans 240 1.0 0.42 Austin Cracker Sandwich Cheese Cracker w/ Cheddar Cheese 39 4.0 10.26 Austin Cracker Sandwich Cheese Cracker w/ Peanut Butter 39 2.0 5.13 Austin Cracker Sandwich Grilled Cheese 39 4.0 10.26 Austin Cracker Sandwich Peanut Butter & Jelly 39 3.5 8.97 Austin Cracker Sandwich Toasty Cracker w/ Peanut Butter 39 2.0 5.13 Banguet Brown n Serve Beef 54 1.0 1.85 Banquet Pot Pies Beef 198 0.5 0.25 Banquet Pot Pies Beef 198 0.5 0.25 Banquet Homestyle Bakes Beef Stew and Biscuits 220 1.0 0.45 Banquet Desert Bakes Chocolate Silk Pie 78 1.0 1.28 Banquet Homestyle Bakes Chicken, Mashed Potatoes, Biscuits 182 1.5 0.82 Banquet 6 Salisbury Steaks and Brown Gravy Family Size 127 1.0 0.79 Banquet Wings Honey BBQ 85 1.0 1.18 Banquet Wings Hot & Spicy 85 0.5 0.59 Banquet Crispy Chicken Variety Pack Southern 118 1.0 0.85 Banquet Beef Enchilada and Tamale Combo Meal 312 1.0 0.32 Banquet Beef Patty with Country Style Vegetables Meal 269 1.0 0.37 Banquet Cheese Enchilada Meal 311 0.5 0.16 Banquet Chicken Enchilada Meal 312 0.5 0.16 Banquet Chicken Finger Meal 201 0.5 0.25 Banquet Chicken Fried Beef Steak Meal 284 0.5 0.18 Banquet Crispy Chicken Variety Pack 118 1.0 0.85 Banquet Fettuccine Alfredo 276 0.5 0.18 Banquet Fried Chicken Meal 255 1.0 0.39 Banquet Meat Loaf Meal 269 1.0 0.37 Banquet Mexican Style Enchilada Combo Meal 312 1.0 0.32 Banquet Pepperoni Pizza Meal 191 0.5 0.26
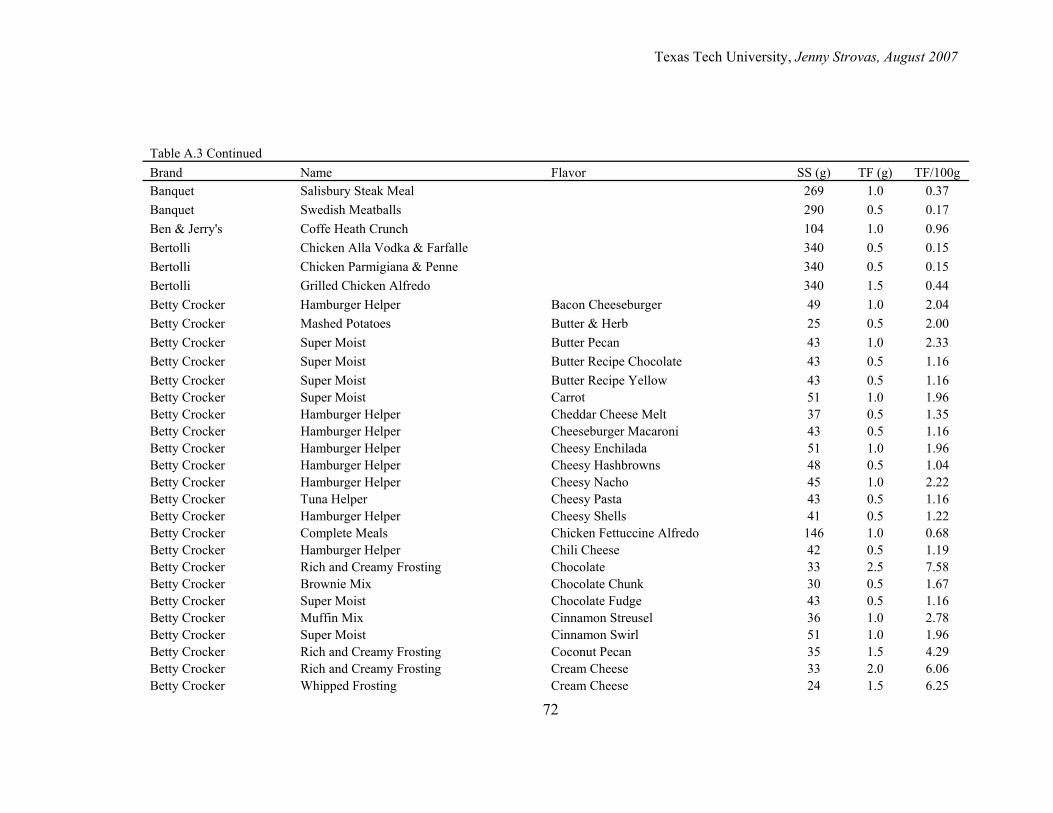
Texas Tech University, Jenny Strovas, August 2007
72
Table A.3 Continued Brand Name Flavor SS (g) TF (g) TF/100g Banquet Salisbury Steak Meal 269 1.0 0.37 Banquet Swedish Meatballs 290 0.5 0.17 Ben & Jerry's Coffe Heath Crunch 104 1.0 0.96 Bertolli Chicken Alla Vodka & Farfalle 340 0.5 0.15 Bertolli Chicken Parmigiana & Penne 340 0.5 0.15 Bertolli Grilled Chicken Alfredo 340 1.5 0.44 Betty Crocker Hamburger Helper Bacon Cheeseburger 49 1.0 2.04 Betty Crocker Mashed Potatoes Butter & Herb 25 0.5 2.00 Betty Crocker Super Moist Butter Pecan 43 1.0 2.33 Betty Crocker Super Moist Butter Recipe Chocolate 43 0.5 1.16 Betty Crocker Super Moist Butter Recipe Yellow 43 0.5 1.16 Betty Crocker Super Moist Carrot 51 1.0 1.96 Betty Crocker Hamburger Helper Cheddar Cheese Melt 37 0.5 1.35 Betty Crocker Hamburger Helper Cheeseburger Macaroni 43 0.5 1.16 Betty Crocker Hamburger Helper Cheesy Enchilada 51 1.0 1.96 Betty Crocker Hamburger Helper Cheesy Hashbrowns 48 0.5 1.04 Betty Crocker Hamburger Helper Cheesy Nacho 45 1.0 2.22 Betty Crocker Tuna Helper Cheesy Pasta 43 0.5 1.16 Betty Crocker Hamburger Helper Cheesy Shells 41 0.5 1.22 Betty Crocker Complete Meals Chicken Fettuccine Alfredo 146 1.0 0.68 Betty Crocker Hamburger Helper Chili Cheese 42 0.5 1.19 Betty Crocker Rich and Creamy Frosting Chocolate 33 2.5 7.58 Betty Crocker Brownie Mix Chocolate Chunk 30 0.5 1.67 Betty Crocker Super Moist Chocolate Fudge 43 0.5 1.16 Betty Crocker Muffin Mix Cinnamon Streusel 36 1.0 2.78 Betty Crocker Super Moist Cinnamon Swirl 51 1.0 1.96 Betty Crocker Rich and Creamy Frosting Coconut Pecan 35 1.5 4.29 Betty Crocker Rich and Creamy Frosting Cream Cheese 33 2.0 6.06 Betty Crocker Whipped Frosting Cream Cheese 24 1.5 6.25
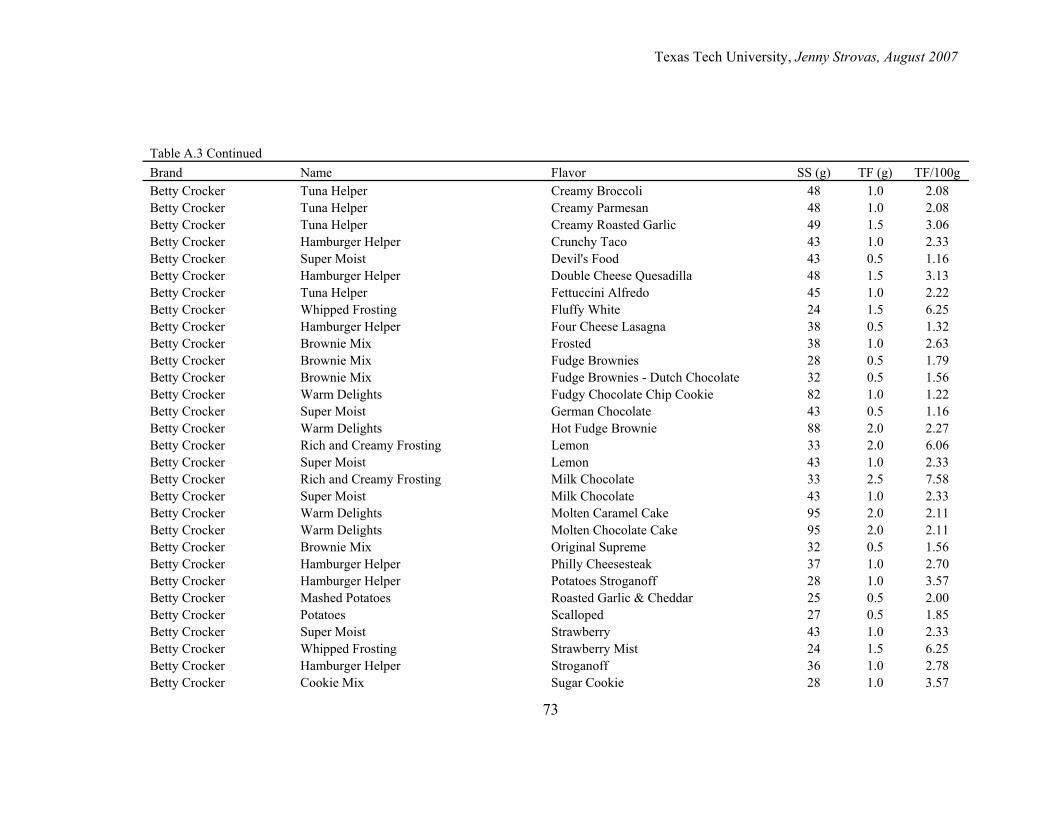
Texas Tech University, Jenny Strovas, August 2007
73
Table A.3 Continued Brand Name Flavor SS (g) TF (g) TF/100g Betty Crocker Tuna Helper Creamy Broccoli 48 1.0 2.08 Betty Crocker Tuna Helper Creamy Parmesan 48 1.0 2.08 Betty Crocker Tuna Helper Creamy Roasted Garlic 49 1.5 3.06 Betty Crocker Hamburger Helper Crunchy Taco 43 1.0 2.33 Betty Crocker Super Moist Devil's Food 43 0.5 1.16 Betty Crocker Hamburger Helper Double Cheese Quesadilla 48 1.5 3.13 Betty Crocker Tuna Helper Fettuccini Alfredo 45 1.0 2.22 Betty Crocker Whipped Frosting Fluffy White 24 1.5 6.25 Betty Crocker Hamburger Helper Four Cheese Lasagna 38 0.5 1.32 Betty Crocker Brownie Mix Frosted 38 1.0 2.63 Betty Crocker Brownie Mix Fudge Brownies 28 0.5 1.79 Betty Crocker Brownie Mix Fudge Brownies - Dutch Chocolate 32 0.5 1.56 Betty Crocker Warm Delights Fudgy Chocolate Chip Cookie 82 1.0 1.22 Betty Crocker Super Moist German Chocolate 43 0.5 1.16 Betty Crocker Warm Delights Hot Fudge Brownie 88 2.0 2.27 Betty Crocker Rich and Creamy Frosting Lemon 33 2.0 6.06 Betty Crocker Super Moist Lemon 43 1.0 2.33 Betty Crocker Rich and Creamy Frosting Milk Chocolate 33 2.5 7.58 Betty Crocker Super Moist Milk Chocolate 43 1.0 2.33 Betty Crocker Warm Delights Molten Caramel Cake 95 2.0 2.11 Betty Crocker Warm Delights Molten Chocolate Cake 95 2.0 2.11 Betty Crocker Brownie Mix Original Supreme 32 0.5 1.56 Betty Crocker Hamburger Helper Philly Cheesesteak 37 1.0 2.70 Betty Crocker Hamburger Helper Potatoes Stroganoff 28 1.0 3.57 Betty Crocker Mashed Potatoes Roasted Garlic & Cheddar 25 0.5 2.00 Betty Crocker Potatoes Scalloped 27 0.5 1.85 Betty Crocker Super Moist Strawberry 43 1.0 2.33 Betty Crocker Whipped Frosting Strawberry Mist 24 1.5 6.25 Betty Crocker Hamburger Helper Stroganoff 36 1.0 2.78 Betty Crocker Cookie Mix Sugar Cookie 28 1.0 3.57
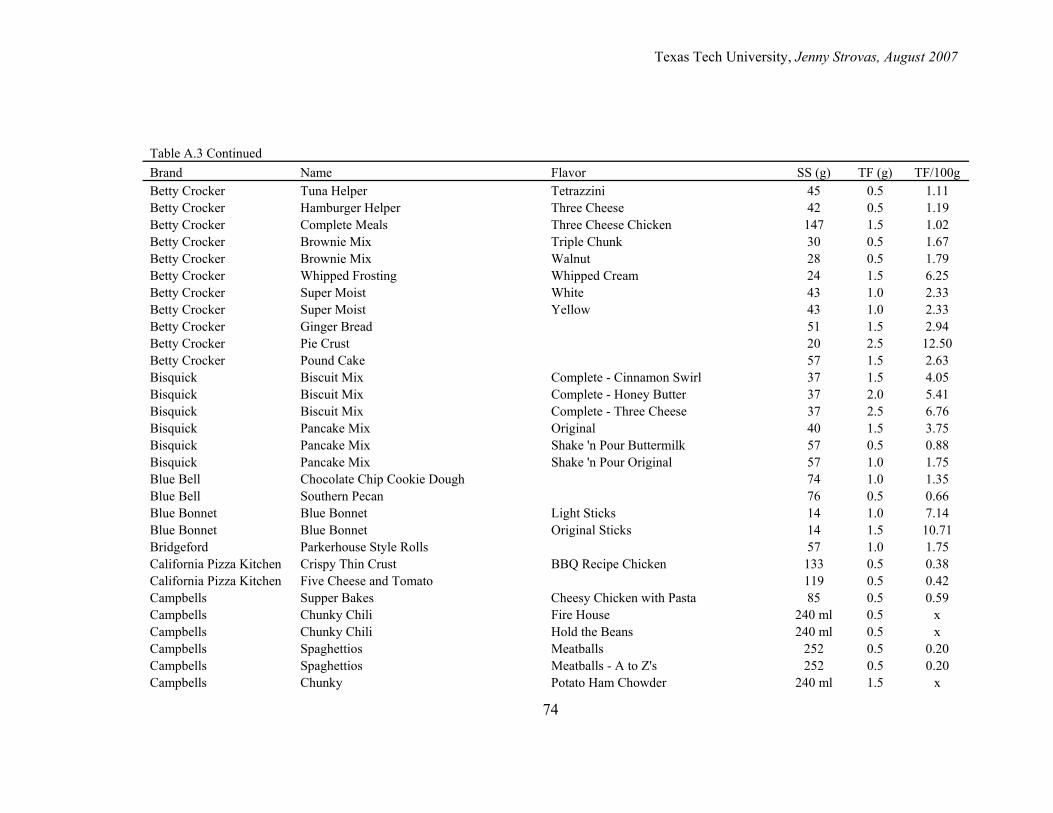
Texas Tech University, Jenny Strovas, August 2007
74
Table A.3 Continued Brand Name Flavor SS (g) TF (g) TF/100g Betty Crocker Tuna Helper Tetrazzini 45 0.5 1.11 Betty Crocker Hamburger Helper Three Cheese 42 0.5 1.19 Betty Crocker Complete Meals Three Cheese Chicken 147 1.5 1.02 Betty Crocker Brownie Mix Triple Chunk 30 0.5 1.67 Betty Crocker Brownie Mix Walnut 28 0.5 1.79 Betty Crocker Whipped Frosting Whipped Cream 24 1.5 6.25 Betty Crocker Super Moist White 43 1.0 2.33 Betty Crocker Super Moist Yellow 43 1.0 2.33 Betty Crocker Ginger Bread 51 1.5 2.94 Betty Crocker Pie Crust 20 2.5 12.50 Betty Crocker Pound Cake 57 1.5 2.63 Bisquick Biscuit Mix Complete - Cinnamon Swirl 37 1.5 4.05 Bisquick Biscuit Mix Complete - Honey Butter 37 2.0 5.41 Bisquick Biscuit Mix Complete - Three Cheese 37 2.5 6.76 Bisquick Pancake Mix Original 40 1.5 3.75 Bisquick Pancake Mix Shake 'n Pour Buttermilk 57 0.5 0.88 Bisquick Pancake Mix Shake 'n Pour Original 57 1.0 1.75 Blue Bell Chocolate Chip Cookie Dough 74 1.0 1.35 Blue Bell Southern Pecan 76 0.5 0.66 Blue Bonnet Blue Bonnet Light Sticks 14 1.0 7.14 Blue Bonnet Blue Bonnet Original Sticks 14 1.5 10.71 Bridgeford Parkerhouse Style Rolls 57 1.0 1.75 California Pizza Kitchen Crispy Thin Crust BBQ Recipe Chicken 133 0.5 0.38 California Pizza Kitchen Five Cheese and Tomato 119 0.5 0.42 Campbells Supper Bakes Cheesy Chicken with Pasta 85 0.5 0.59 Campbells Chunky Chili Fire House 240 ml 0.5 x Campbells Chunky Chili Hold the Beans 240 ml 0.5 x Campbells Spaghettios Meatballs 252 0.5 0.20 Campbells Spaghettios Meatballs - A to Z's 252 0.5 0.20 Campbells Chunky Potato Ham Chowder 240 ml 1.5 x
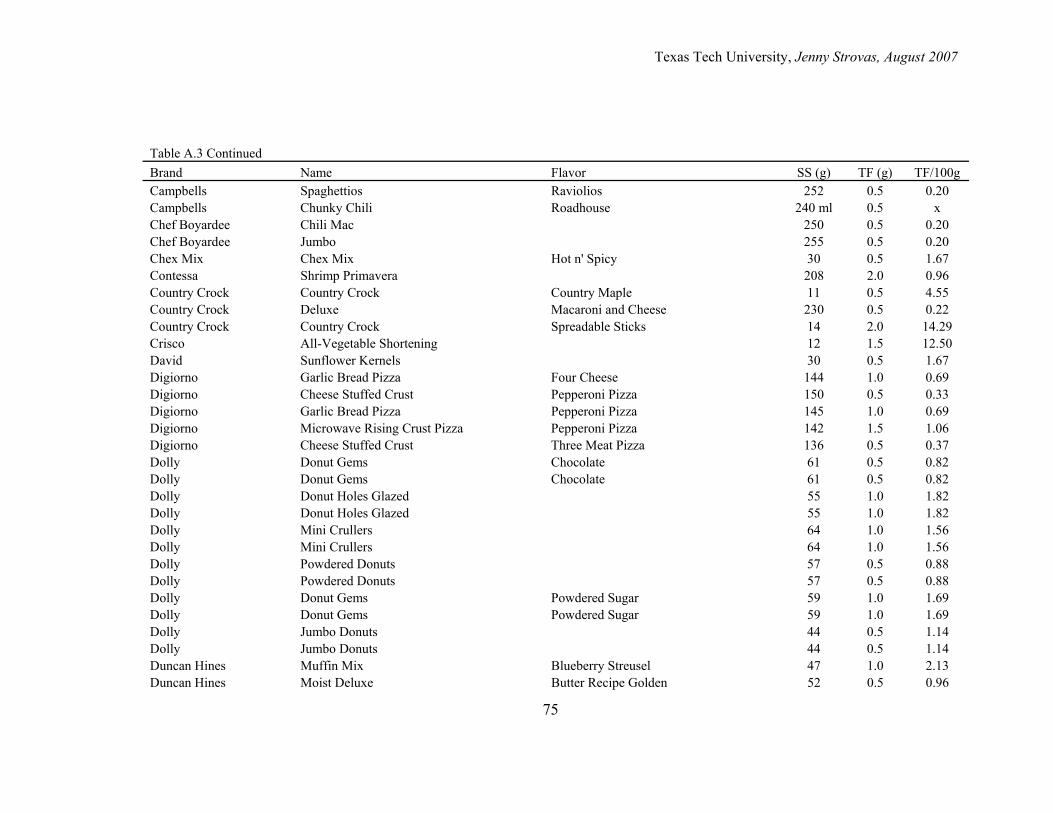
Texas Tech University, Jenny Strovas, August 2007
75
Table A.3 Continued Brand Name Flavor SS (g) TF (g) TF/100g Campbells Spaghettios Raviolios 252 0.5 0.20 Campbells Chunky Chili Roadhouse 240 ml 0.5 x Chef Boyardee Chili Mac 250 0.5 0.20 Chef Boyardee Jumbo 255 0.5 0.20 Chex Mix Chex Mix Hot n' Spicy 30 0.5 1.67 Contessa Shrimp Primavera 208 2.0 0.96 Country Crock Country Crock Country Maple 11 0.5 4.55 Country Crock Deluxe Macaroni and Cheese 230 0.5 0.22 Country Crock Country Crock Spreadable Sticks 14 2.0 14.29 Crisco All-Vegetable Shortening 12 1.5 12.50 David Sunflower Kernels 30 0.5 1.67 Digiorno Garlic Bread Pizza Four Cheese 144 1.0 0.69 Digiorno Cheese Stuffed Crust Pepperoni Pizza 150 0.5 0.33 Digiorno Garlic Bread Pizza Pepperoni Pizza 145 1.0 0.69 Digiorno Microwave Rising Crust Pizza Pepperoni Pizza 142 1.5 1.06 Digiorno Cheese Stuffed Crust Three Meat Pizza 136 0.5 0.37 Dolly Donut Gems Chocolate 61 0.5 0.82 Dolly Donut Gems Chocolate 61 0.5 0.82 Dolly Donut Holes Glazed 55 1.0 1.82 Dolly Donut Holes Glazed 55 1.0 1.82 Dolly Mini Crullers 64 1.0 1.56 Dolly Mini Crullers 64 1.0 1.56 Dolly Powdered Donuts 57 0.5 0.88 Dolly Powdered Donuts 57 0.5 0.88 Dolly Donut Gems Powdered Sugar 59 1.0 1.69 Dolly Donut Gems Powdered Sugar 59 1.0 1.69 Dolly Jumbo Donuts 44 0.5 1.14 Dolly Jumbo Donuts 44 0.5 1.14 Duncan Hines Muffin Mix Blueberry Streusel 47 1.0 2.13 Duncan Hines Moist Deluxe Butter Recipe Golden 52 0.5 0.96
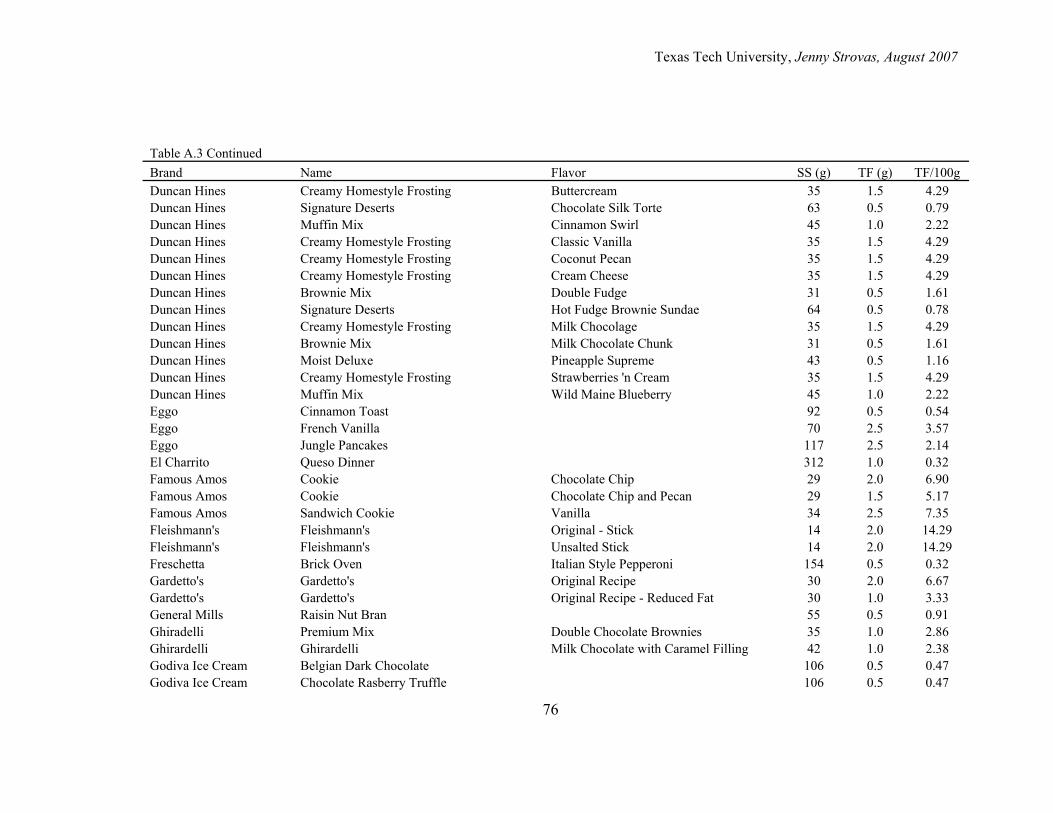
Texas Tech University, Jenny Strovas, August 2007
76
Table A.3 Continued Brand Name Flavor SS (g) TF (g) TF/100g Duncan Hines Creamy Homestyle Frosting Buttercream 35 1.5 4.29 Duncan Hines Signature Deserts Chocolate Silk Torte 63 0.5 0.79 Duncan Hines Muffin Mix Cinnamon Swirl 45 1.0 2.22 Duncan Hines Creamy Homestyle Frosting Classic Vanilla 35 1.5 4.29 Duncan Hines Creamy Homestyle Frosting Coconut Pecan 35 1.5 4.29 Duncan Hines Creamy Homestyle Frosting Cream Cheese 35 1.5 4.29 Duncan Hines Brownie Mix Double Fudge 31 0.5 1.61 Duncan Hines Signature Deserts Hot Fudge Brownie Sundae 64 0.5 0.78 Duncan Hines Creamy Homestyle Frosting Milk Chocolage 35 1.5 4.29 Duncan Hines Brownie Mix Milk Chocolate Chunk 31 0.5 1.61 Duncan Hines Moist Deluxe Pineapple Supreme 43 0.5 1.16 Duncan Hines Creamy Homestyle Frosting Strawberries 'n Cream 35 1.5 4.29 Duncan Hines Muffin Mix Wild Maine Blueberry 45 1.0 2.22 Eggo Cinnamon Toast 92 0.5 0.54 Eggo French Vanilla 70 2.5 3.57 Eggo Jungle Pancakes 117 2.5 2.14 El Charrito Queso Dinner 312 1.0 0.32 Famous Amos Cookie Chocolate Chip 29 2.0 6.90 Famous Amos Cookie Chocolate Chip and Pecan 29 1.5 5.17 Famous Amos Sandwich Cookie Vanilla 34 2.5 7.35 Fleishmann's Fleishmann's Original - Stick 14 2.0 14.29 Fleishmann's Fleishmann's Unsalted Stick 14 2.0 14.29 Freschetta Brick Oven Italian Style Pepperoni 154 0.5 0.32 Gardetto's Gardetto's Original Recipe 30 2.0 6.67 Gardetto's Gardetto's Original Recipe - Reduced Fat 30 1.0 3.33 General Mills Raisin Nut Bran 55 0.5 0.91 Ghiradelli Premium Mix Double Chocolate Brownies 35 1.0 2.86 Ghirardelli Ghirardelli Milk Chocolate with Caramel Filling 42 1.0 2.38 Godiva Ice Cream Belgian Dark Chocolate 106 0.5 0.47 Godiva Ice Cream Chocolate Rasberry Truffle 106 0.5 0.47
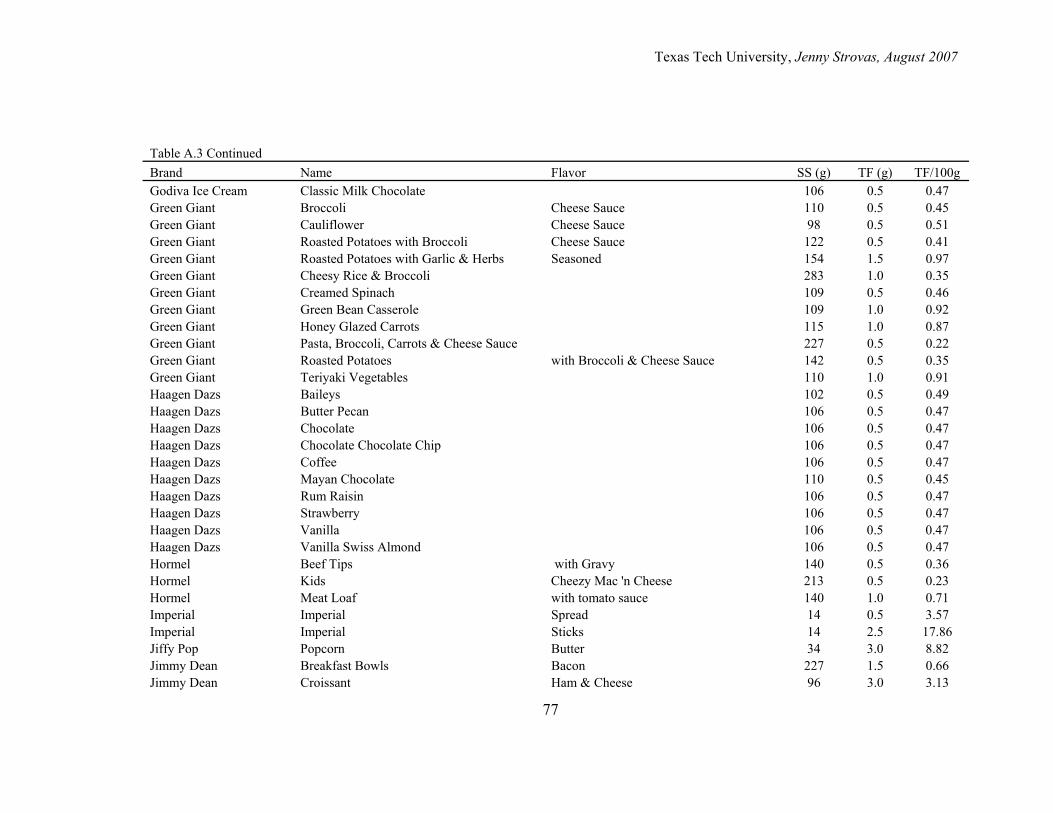
Texas Tech University, Jenny Strovas, August 2007
77
Table A.3 Continued Brand Name Flavor SS (g) TF (g) TF/100g Godiva Ice Cream Classic Milk Chocolate 106 0.5 0.47 Green Giant Broccoli Cheese Sauce 110 0.5 0.45 Green Giant Cauliflower Cheese Sauce 98 0.5 0.51 Green Giant Roasted Potatoes with Broccoli Cheese Sauce 122 0.5 0.41 Green Giant Roasted Potatoes with Garlic & Herbs Seasoned 154 1.5 0.97 Green Giant Cheesy Rice & Broccoli 283 1.0 0.35 Green Giant Creamed Spinach 109 0.5 0.46 Green Giant Green Bean Casserole 109 1.0 0.92 Green Giant Honey Glazed Carrots 115 1.0 0.87 Green Giant Pasta, Broccoli, Carrots & Cheese Sauce 227 0.5 0.22 Green Giant Roasted Potatoes with Broccoli & Cheese Sauce 142 0.5 0.35 Green Giant Teriyaki Vegetables 110 1.0 0.91 Haagen Dazs Baileys 102 0.5 0.49 Haagen Dazs Butter Pecan 106 0.5 0.47 Haagen Dazs Chocolate 106 0.5 0.47 Haagen Dazs Chocolate Chocolate Chip 106 0.5 0.47 Haagen Dazs Coffee 106 0.5 0.47 Haagen Dazs Mayan Chocolate 110 0.5 0.45 Haagen Dazs Rum Raisin 106 0.5 0.47 Haagen Dazs Strawberry 106 0.5 0.47 Haagen Dazs Vanilla 106 0.5 0.47 Haagen Dazs Vanilla Swiss Almond 106 0.5 0.47 Hormel Beef Tips with Gravy 140 0.5 0.36 Hormel Kids Cheezy Mac 'n Cheese 213 0.5 0.23 Hormel Meat Loaf with tomato sauce 140 1.0 0.71 Imperial Imperial Spread 14 0.5 3.57 Imperial Imperial Sticks 14 2.5 17.86 Jiffy Pop Popcorn Butter 34 3.0 8.82 Jimmy Dean Breakfast Bowls Bacon 227 1.5 0.66 Jimmy Dean Croissant Ham & Cheese 96 3.0 3.13
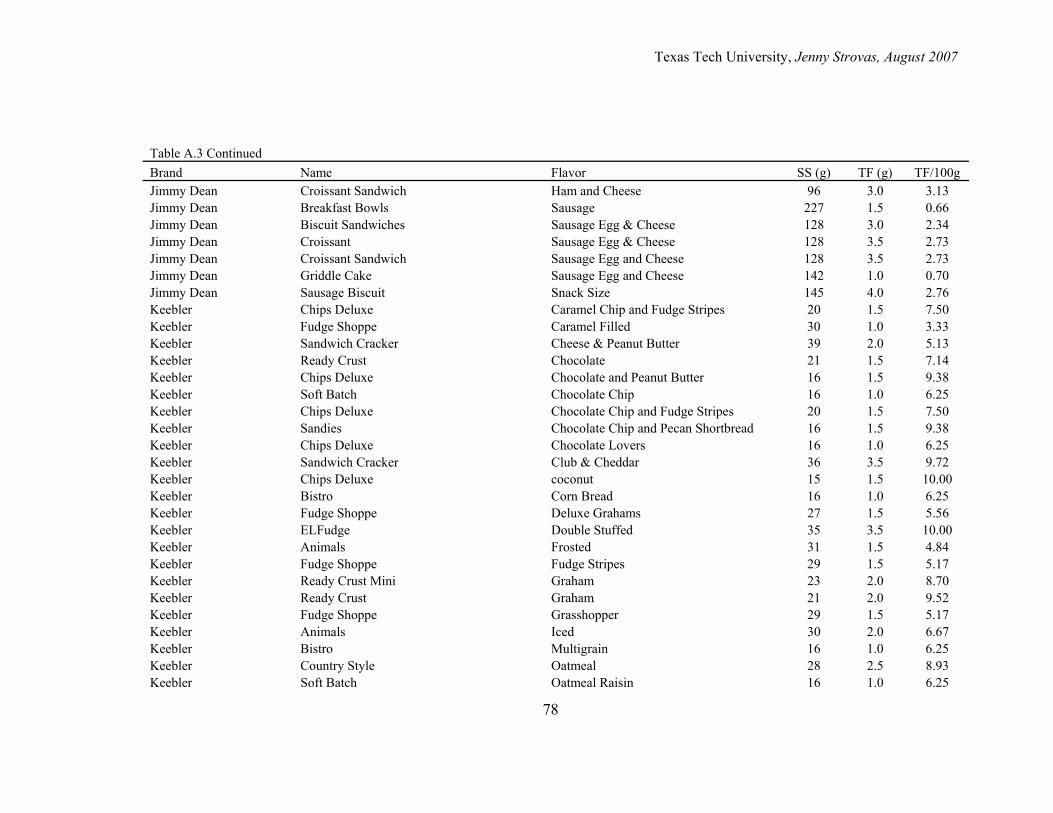
Texas Tech University, Jenny Strovas, August 2007
78
Table A.3 Continued Brand Name Flavor SS (g) TF (g) TF/100g Jimmy Dean Croissant Sandwich Ham and Cheese 96 3.0 3.13 Jimmy Dean Breakfast Bowls Sausage 227 1.5 0.66 Jimmy Dean Biscuit Sandwiches Sausage Egg & Cheese 128 3.0 2.34 Jimmy Dean Croissant Sausage Egg & Cheese 128 3.5 2.73 Jimmy Dean Croissant Sandwich Sausage Egg and Cheese 128 3.5 2.73 Jimmy Dean Griddle Cake Sausage Egg and Cheese 142 1.0 0.70 Jimmy Dean Sausage Biscuit Snack Size 145 4.0 2.76 Keebler Chips Deluxe Caramel Chip and Fudge Stripes 20 1.5 7.50 Keebler Fudge Shoppe Caramel Filled 30 1.0 3.33 Keebler Sandwich Cracker Cheese & Peanut Butter 39 2.0 5.13 Keebler Ready Crust Chocolate 21 1.5 7.14 Keebler Chips Deluxe Chocolate and Peanut Butter 16 1.5 9.38 Keebler Soft Batch Chocolate Chip 16 1.0 6.25 Keebler Chips Deluxe Chocolate Chip and Fudge Stripes 20 1.5 7.50 Keebler Sandies Chocolate Chip and Pecan Shortbread 16 1.5 9.38 Keebler Chips Deluxe Chocolate Lovers 16 1.0 6.25 Keebler Sandwich Cracker Club & Cheddar 36 3.5 9.72 Keebler Chips Deluxe coconut 15 1.5 10.00 Keebler Bistro Corn Bread 16 1.0 6.25 Keebler Fudge Shoppe Deluxe Grahams 27 1.5 5.56 Keebler ELFudge Double Stuffed 35 3.5 10.00 Keebler Animals Frosted 31 1.5 4.84 Keebler Fudge Shoppe Fudge Stripes 29 1.5 5.17 Keebler Ready Crust Mini Graham 23 2.0 8.70 Keebler Ready Crust Graham 21 2.0 9.52 Keebler Fudge Shoppe Grasshopper 29 1.5 5.17 Keebler Animals Iced 30 2.0 6.67 Keebler Bistro Multigrain 16 1.0 6.25 Keebler Country Style Oatmeal 28 2.5 8.93 Keebler Soft Batch Oatmeal Raisin 16 1.0 6.25
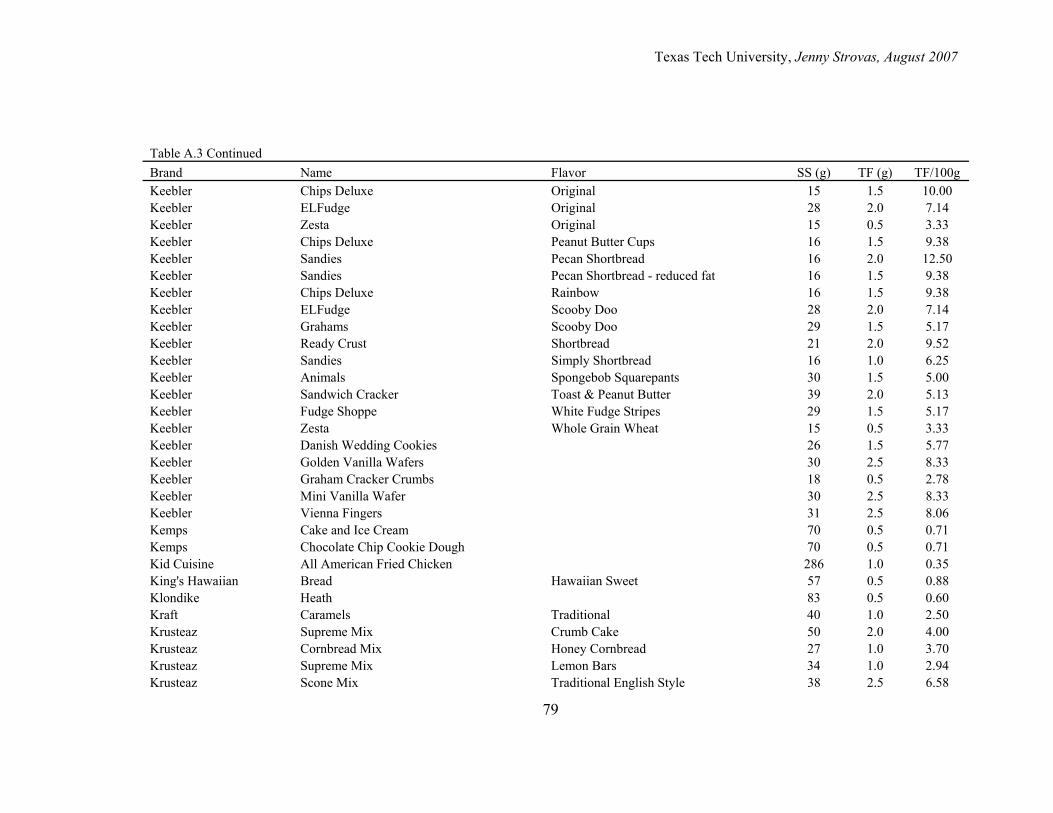
Texas Tech University, Jenny Strovas, August 2007
79
Table A.3 Continued Brand Name Flavor SS (g) TF (g) TF/100g Keebler Chips Deluxe Original 15 1.5 10.00 Keebler ELFudge Original 28 2.0 7.14 Keebler Zesta Original 15 0.5 3.33 Keebler Chips Deluxe Peanut Butter Cups 16 1.5 9.38 Keebler Sandies Pecan Shortbread 16 2.0 12.50 Keebler Sandies Pecan Shortbread - reduced fat 16 1.5 9.38 Keebler Chips Deluxe Rainbow 16 1.5 9.38 Keebler ELFudge Scooby Doo 28 2.0 7.14 Keebler Grahams Scooby Doo 29 1.5 5.17 Keebler Ready Crust Shortbread 21 2.0 9.52 Keebler Sandies Simply Shortbread 16 1.0 6.25 Keebler Animals Spongebob Squarepants 30 1.5 5.00 Keebler Sandwich Cracker Toast & Peanut Butter 39 2.0 5.13 Keebler Fudge Shoppe White Fudge Stripes 29 1.5 5.17 Keebler Zesta Whole Grain Wheat 15 0.5 3.33 Keebler Danish Wedding Cookies 26 1.5 5.77 Keebler Golden Vanilla Wafers 30 2.5 8.33 Keebler Graham Cracker Crumbs 18 0.5 2.78 Keebler Mini Vanilla Wafer 30 2.5 8.33 Keebler Vienna Fingers 31 2.5 8.06 Kemps Cake and Ice Cream 70 0.5 0.71 Kemps Chocolate Chip Cookie Dough 70 0.5 0.71 Kid Cuisine All American Fried Chicken 286 1.0 0.35 King's Hawaiian Bread Hawaiian Sweet 57 0.5 0.88 Klondike Heath 83 0.5 0.60 Kraft Caramels Traditional 40 1.0 2.50 Krusteaz Supreme Mix Crumb Cake 50 2.0 4.00 Krusteaz Cornbread Mix Honey Cornbread 27 1.0 3.70 Krusteaz Supreme Mix Lemon Bars 34 1.0 2.94 Krusteaz Scone Mix Traditional English Style 38 2.5 6.58
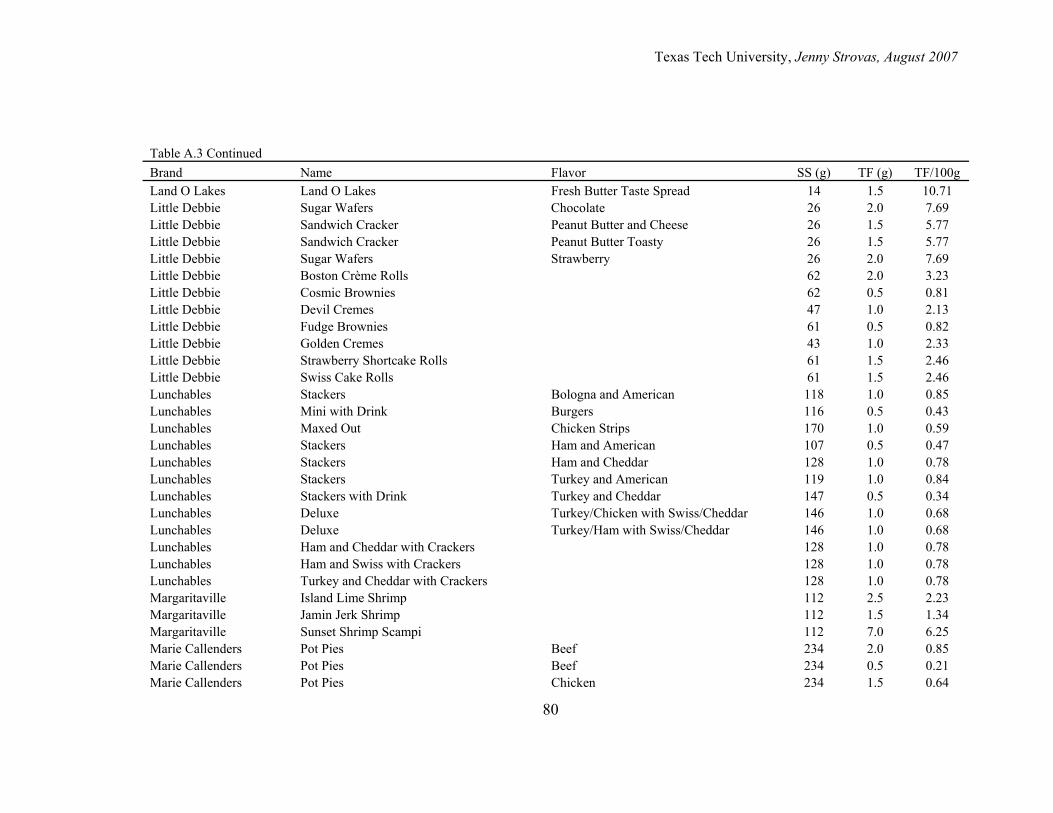
Texas Tech University, Jenny Strovas, August 2007
80
Table A.3 Continued Brand Name Flavor SS (g) TF (g) TF/100g Land O Lakes Land O Lakes Fresh Butter Taste Spread 14 1.5 10.71 Little Debbie Sugar Wafers Chocolate 26 2.0 7.69 Little Debbie Sandwich Cracker Peanut Butter and Cheese 26 1.5 5.77 Little Debbie Sandwich Cracker Peanut Butter Toasty 26 1.5 5.77 Little Debbie Sugar Wafers Strawberry 26 2.0 7.69 Little Debbie Boston Crème Rolls 62 2.0 3.23 Little Debbie Cosmic Brownies 62 0.5 0.81 Little Debbie Devil Cremes 47 1.0 2.13 Little Debbie Fudge Brownies 61 0.5 0.82 Little Debbie Golden Cremes 43 1.0 2.33 Little Debbie Strawberry Shortcake Rolls 61 1.5 2.46 Little Debbie Swiss Cake Rolls 61 1.5 2.46 Lunchables Stackers Bologna and American 118 1.0 0.85 Lunchables Mini with Drink Burgers 116 0.5 0.43 Lunchables Maxed Out Chicken Strips 170 1.0 0.59 Lunchables Stackers Ham and American 107 0.5 0.47 Lunchables Stackers Ham and Cheddar 128 1.0 0.78 Lunchables Stackers Turkey and American 119 1.0 0.84 Lunchables Stackers with Drink Turkey and Cheddar 147 0.5 0.34 Lunchables Deluxe Turkey/Chicken with Swiss/Cheddar 146 1.0 0.68 Lunchables Deluxe Turkey/Ham with Swiss/Cheddar 146 1.0 0.68 Lunchables Ham and Cheddar with Crackers 128 1.0 0.78 Lunchables Ham and Swiss with Crackers 128 1.0 0.78 Lunchables Turkey and Cheddar with Crackers 128 1.0 0.78 Margaritaville Island Lime Shrimp 112 2.5 2.23 Margaritaville Jamin Jerk Shrimp 112 1.5 1.34 Margaritaville Sunset Shrimp Scampi 112 7.0 6.25 Marie Callenders Pot Pies Beef 234 2.0 0.85 Marie Callenders Pot Pies Beef 234 0.5 0.21 Marie Callenders Pot Pies Chicken 234 1.5 0.64
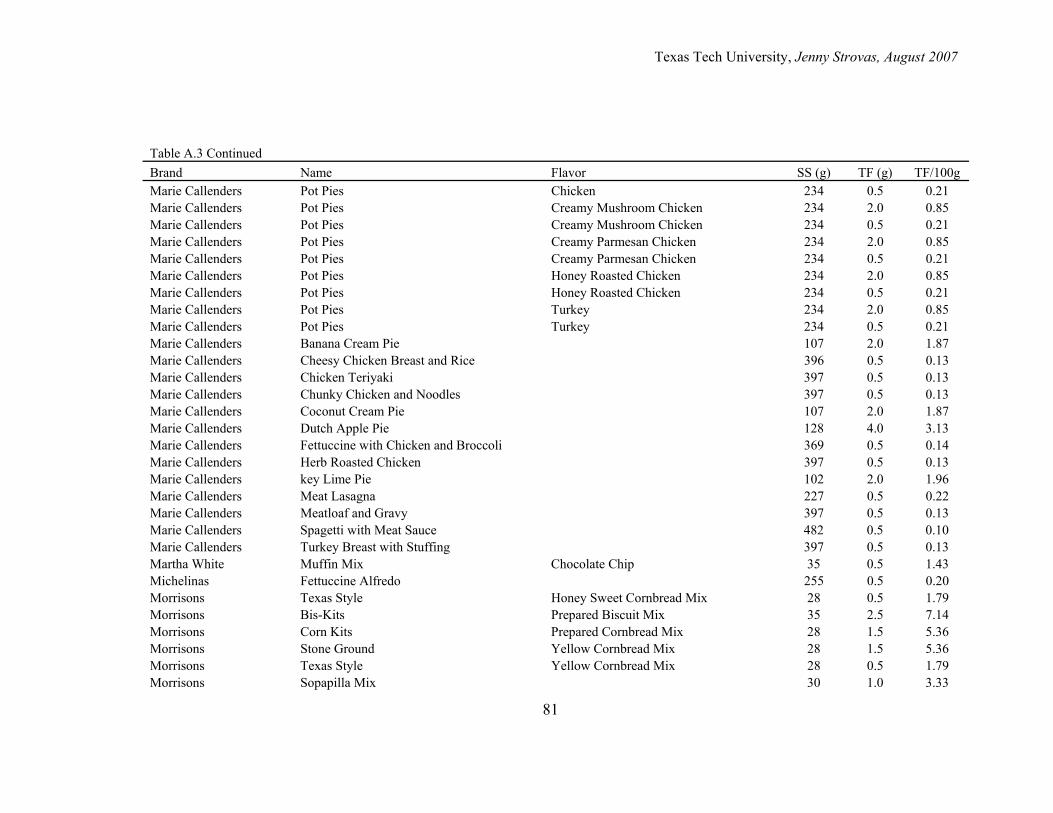
Texas Tech University, Jenny Strovas, August 2007
81
Table A.3 Continued Brand Name Flavor SS (g) TF (g) TF/100g Marie Callenders Pot Pies Chicken 234 0.5 0.21 Marie Callenders Pot Pies Creamy Mushroom Chicken 234 2.0 0.85 Marie Callenders Pot Pies Creamy Mushroom Chicken 234 0.5 0.21 Marie Callenders Pot Pies Creamy Parmesan Chicken 234 2.0 0.85 Marie Callenders Pot Pies Creamy Parmesan Chicken 234 0.5 0.21 Marie Callenders Pot Pies Honey Roasted Chicken 234 2.0 0.85 Marie Callenders Pot Pies Honey Roasted Chicken 234 0.5 0.21 Marie Callenders Pot Pies Turkey 234 2.0 0.85 Marie Callenders Pot Pies Turkey 234 0.5 0.21 Marie Callenders Banana Cream Pie 107 2.0 1.87 Marie Callenders Cheesy Chicken Breast and Rice 396 0.5 0.13 Marie Callenders Chicken Teriyaki 397 0.5 0.13 Marie Callenders Chunky Chicken and Noodles 397 0.5 0.13 Marie Callenders Coconut Cream Pie 107 2.0 1.87 Marie Callenders Dutch Apple Pie 128 4.0 3.13 Marie Callenders Fettuccine with Chicken and Broccoli 369 0.5 0.14 Marie Callenders Herb Roasted Chicken 397 0.5 0.13 Marie Callenders key Lime Pie 102 2.0 1.96 Marie Callenders Meat Lasagna 227 0.5 0.22 Marie Callenders Meatloaf and Gravy 397 0.5 0.13 Marie Callenders Spagetti with Meat Sauce 482 0.5 0.10 Marie Callenders Turkey Breast with Stuffing 397 0.5 0.13 Martha White Muffin Mix Chocolate Chip 35 0.5 1.43 Michelinas Fettuccine Alfredo 255 0.5 0.20 Morrisons Texas Style Honey Sweet Cornbread Mix 28 0.5 1.79 Morrisons Bis-Kits Prepared Biscuit Mix 35 2.5 7.14 Morrisons Corn Kits Prepared Cornbread Mix 28 1.5 5.36 Morrisons Stone Ground Yellow Cornbread Mix 28 1.5 5.36 Morrisons Texas Style Yellow Cornbread Mix 28 0.5 1.79 Morrisons Sopapilla Mix 30 1.0 3.33
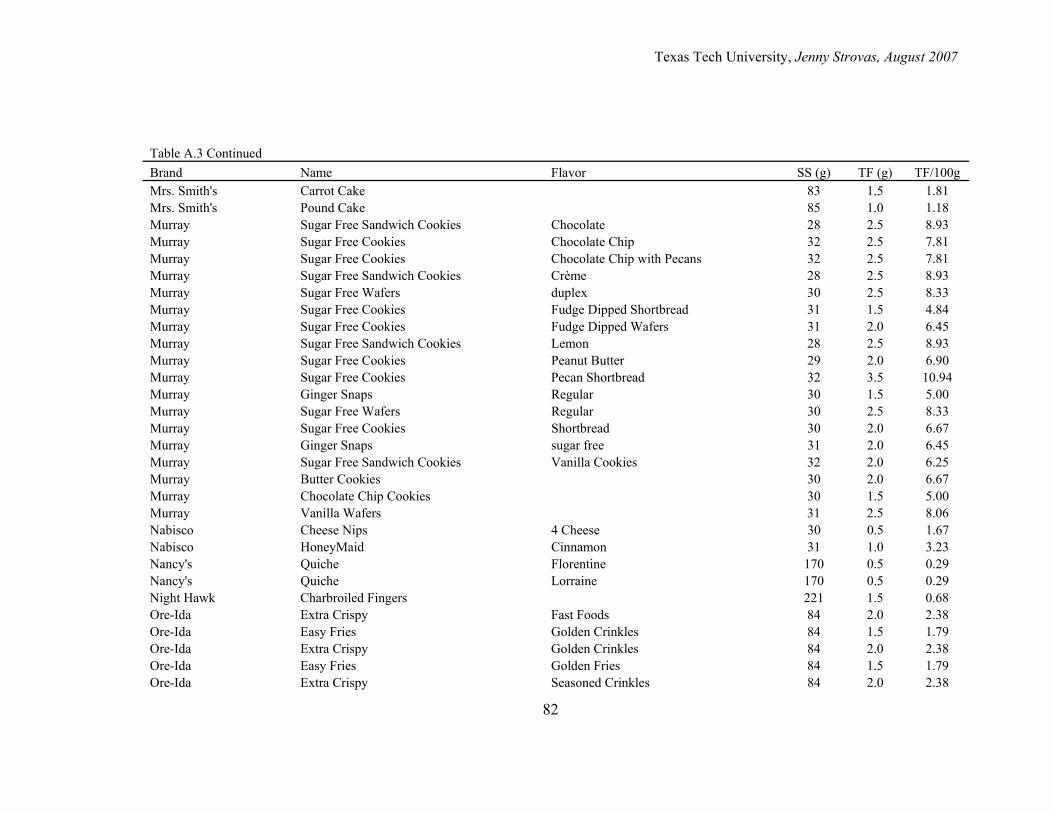
Texas Tech University, Jenny Strovas, August 2007
82
Table A.3 Continued Brand Name Flavor SS (g) TF (g) TF/100g Mrs. Smith's Carrot Cake 83 1.5 1.81 Mrs. Smith's Pound Cake 85 1.0 1.18 Murray Sugar Free Sandwich Cookies Chocolate 28 2.5 8.93 Murray Sugar Free Cookies Chocolate Chip 32 2.5 7.81 Murray Sugar Free Cookies Chocolate Chip with Pecans 32 2.5 7.81 Murray Sugar Free Sandwich Cookies Crème 28 2.5 8.93 Murray Sugar Free Wafers duplex 30 2.5 8.33 Murray Sugar Free Cookies Fudge Dipped Shortbread 31 1.5 4.84 Murray Sugar Free Cookies Fudge Dipped Wafers 31 2.0 6.45 Murray Sugar Free Sandwich Cookies Lemon 28 2.5 8.93 Murray Sugar Free Cookies Peanut Butter 29 2.0 6.90 Murray Sugar Free Cookies Pecan Shortbread 32 3.5 10.94 Murray Ginger Snaps Regular 30 1.5 5.00 Murray Sugar Free Wafers Regular 30 2.5 8.33 Murray Sugar Free Cookies Shortbread 30 2.0 6.67 Murray Ginger Snaps sugar free 31 2.0 6.45 Murray Sugar Free Sandwich Cookies Vanilla Cookies 32 2.0 6.25 Murray Butter Cookies 30 2.0 6.67 Murray Chocolate Chip Cookies 30 1.5 5.00 Murray Vanilla Wafers 31 2.5 8.06 Nabisco Cheese Nips 4 Cheese 30 0.5 1.67 Nabisco HoneyMaid Cinnamon 31 1.0 3.23 Nancy's Quiche Florentine 170 0.5 0.29 Nancy's Quiche Lorraine 170 0.5 0.29 Night Hawk Charbroiled Fingers 221 1.5 0.68 Ore-Ida Extra Crispy Fast Foods 84 2.0 2.38 Ore-Ida Easy Fries Golden Crinkles 84 1.5 1.79 Ore-Ida Extra Crispy Golden Crinkles 84 2.0 2.38 Ore-Ida Easy Fries Golden Fries 84 1.5 1.79 Ore-Ida Extra Crispy Seasoned Crinkles 84 2.0 2.38
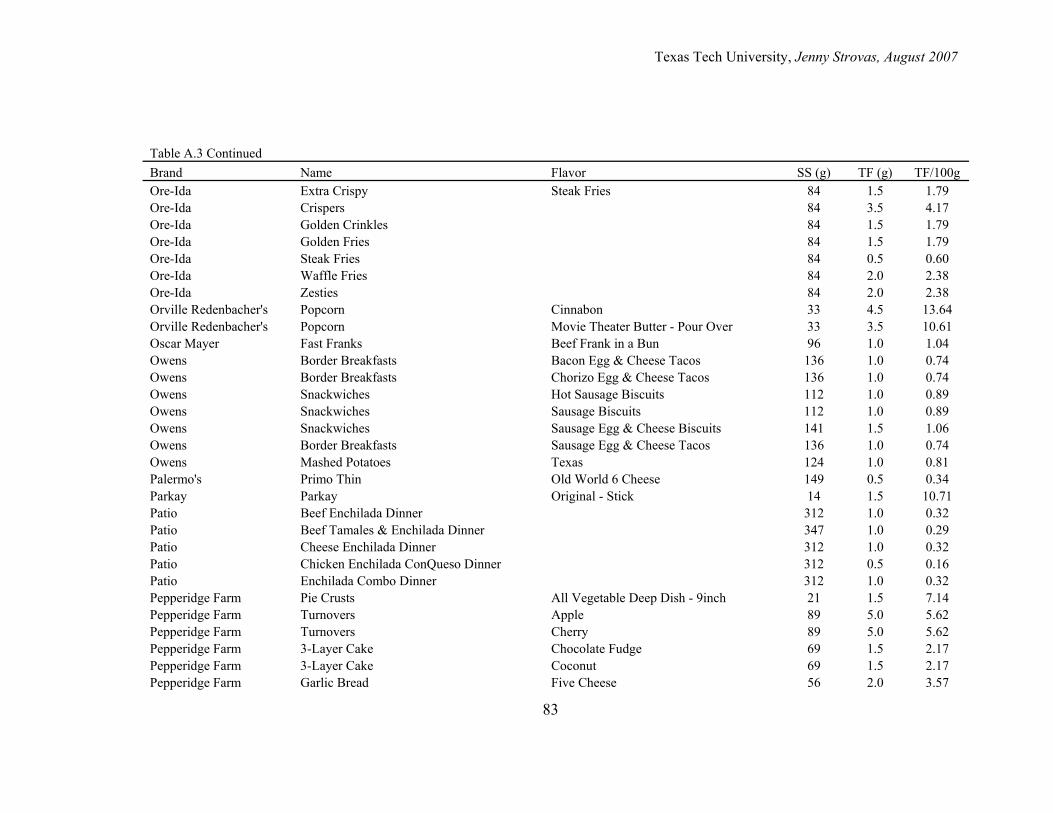
Texas Tech University, Jenny Strovas, August 2007
83
Table A.3 Continued Brand Name Flavor SS (g) TF (g) TF/100g Ore-Ida Extra Crispy Steak Fries 84 1.5 1.79 Ore-Ida Crispers 84 3.5 4.17 Ore-Ida Golden Crinkles 84 1.5 1.79 Ore-Ida Golden Fries 84 1.5 1.79 Ore-Ida Steak Fries 84 0.5 0.60 Ore-Ida Waffle Fries 84 2.0 2.38 Ore-Ida Zesties 84 2.0 2.38 Orville Redenbacher's Popcorn Cinnabon 33 4.5 13.64 Orville Redenbacher's Popcorn Movie Theater Butter - Pour Over 33 3.5 10.61 Oscar Mayer Fast Franks Beef Frank in a Bun 96 1.0 1.04 Owens Border Breakfasts Bacon Egg & Cheese Tacos 136 1.0 0.74 Owens Border Breakfasts Chorizo Egg & Cheese Tacos 136 1.0 0.74 Owens Snackwiches Hot Sausage Biscuits 112 1.0 0.89 Owens Snackwiches Sausage Biscuits 112 1.0 0.89 Owens Snackwiches Sausage Egg & Cheese Biscuits 141 1.5 1.06 Owens Border Breakfasts Sausage Egg & Cheese Tacos 136 1.0 0.74 Owens Mashed Potatoes Texas 124 1.0 0.81 Palermo's Primo Thin Old World 6 Cheese 149 0.5 0.34 Parkay Parkay Original - Stick 14 1.5 10.71 Patio Beef Enchilada Dinner 312 1.0 0.32 Patio Beef Tamales & Enchilada Dinner 347 1.0 0.29 Patio Cheese Enchilada Dinner 312 1.0 0.32 Patio Chicken Enchilada ConQueso Dinner 312 0.5 0.16 Patio Enchilada Combo Dinner 312 1.0 0.32 Pepperidge Farm Pie Crusts All Vegetable Deep Dish - 9inch 21 1.5 7.14 Pepperidge Farm Turnovers Apple 89 5.0 5.62 Pepperidge Farm Turnovers Cherry 89 5.0 5.62 Pepperidge Farm 3-Layer Cake Chocolate Fudge 69 1.5 2.17 Pepperidge Farm 3-Layer Cake Coconut 69 1.5 2.17 Pepperidge Farm Garlic Bread Five Cheese 56 2.0 3.57
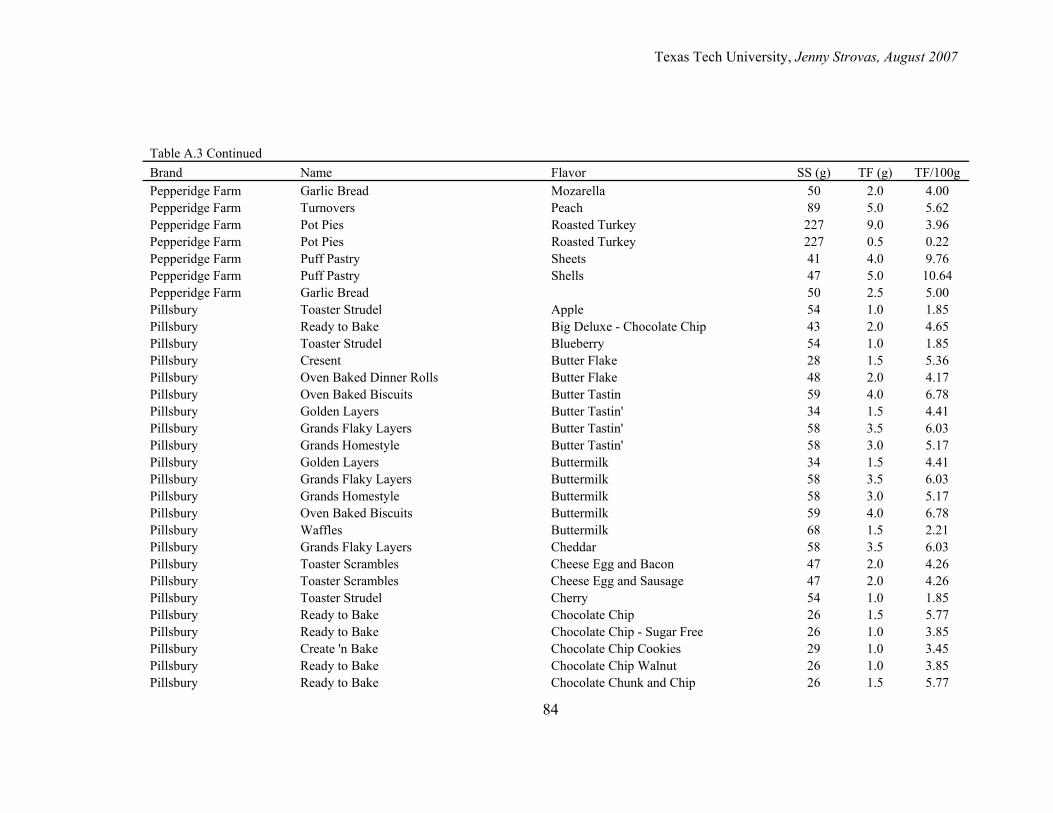
Texas Tech University, Jenny Strovas, August 2007
84
Table A.3 Continued Brand Name Flavor SS (g) TF (g) TF/100g Pepperidge Farm Garlic Bread Mozarella 50 2.0 4.00 Pepperidge Farm Turnovers Peach 89 5.0 5.62 Pepperidge Farm Pot Pies Roasted Turkey 227 9.0 3.96 Pepperidge Farm Pot Pies Roasted Turkey 227 0.5 0.22 Pepperidge Farm Puff Pastry Sheets 41 4.0 9.76 Pepperidge Farm Puff Pastry Shells 47 5.0 10.64 Pepperidge Farm Garlic Bread 50 2.5 5.00 Pillsbury Toaster Strudel Apple 54 1.0 1.85 Pillsbury Ready to Bake Big Deluxe - Chocolate Chip 43 2.0 4.65 Pillsbury Toaster Strudel Blueberry 54 1.0 1.85 Pillsbury Cresent Butter Flake 28 1.5 5.36 Pillsbury Oven Baked Dinner Rolls Butter Flake 48 2.0 4.17 Pillsbury Oven Baked Biscuits Butter Tastin 59 4.0 6.78 Pillsbury Golden Layers Butter Tastin' 34 1.5 4.41 Pillsbury Grands Flaky Layers Butter Tastin' 58 3.5 6.03 Pillsbury Grands Homestyle Butter Tastin' 58 3.0 5.17 Pillsbury Golden Layers Buttermilk 34 1.5 4.41 Pillsbury Grands Flaky Layers Buttermilk 58 3.5 6.03 Pillsbury Grands Homestyle Buttermilk 58 3.0 5.17 Pillsbury Oven Baked Biscuits Buttermilk 59 4.0 6.78 Pillsbury Waffles Buttermilk 68 1.5 2.21 Pillsbury Grands Flaky Layers Cheddar 58 3.5 6.03 Pillsbury Toaster Scrambles Cheese Egg and Bacon 47 2.0 4.26 Pillsbury Toaster Scrambles Cheese Egg and Sausage 47 2.0 4.26 Pillsbury Toaster Strudel Cherry 54 1.0 1.85 Pillsbury Ready to Bake Chocolate Chip 26 1.5 5.77 Pillsbury Ready to Bake Chocolate Chip - Sugar Free 26 1.0 3.85 Pillsbury Create 'n Bake Chocolate Chip Cookies 29 1.0 3.45 Pillsbury Ready to Bake Chocolate Chip Walnut 26 1.0 3.85 Pillsbury Ready to Bake Chocolate Chunk and Chip 26 1.5 5.77
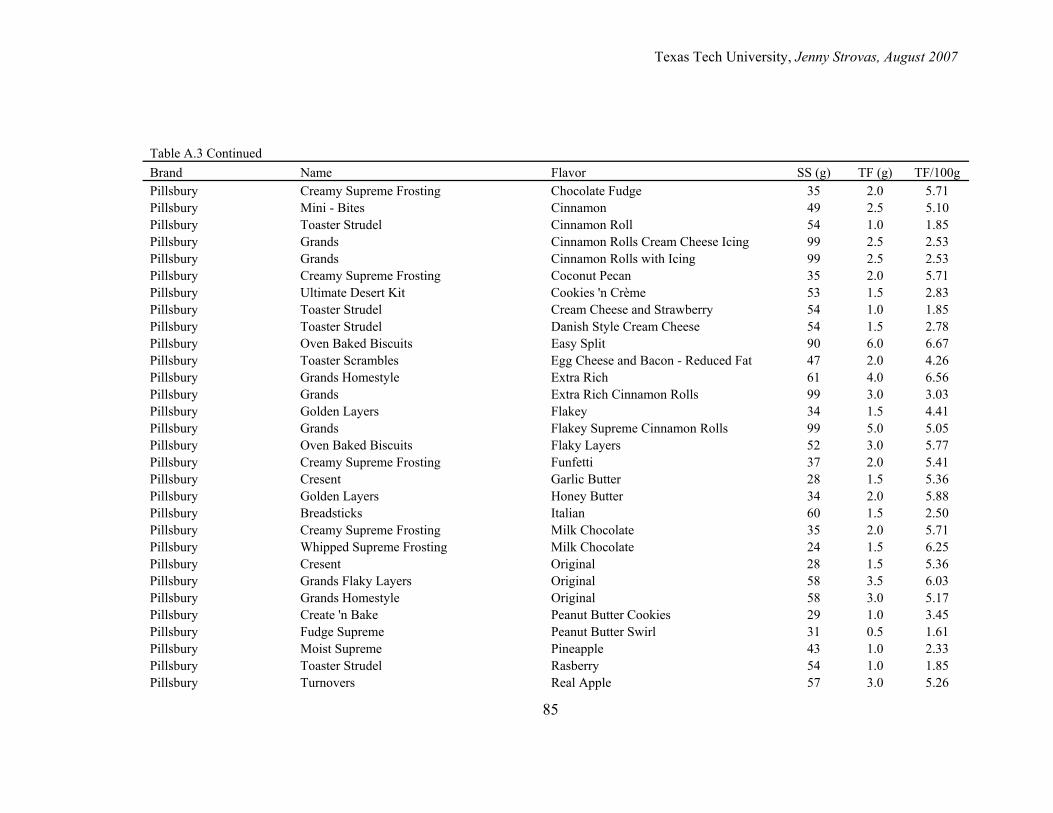
Texas Tech University, Jenny Strovas, August 2007
85
Table A.3 Continued Brand Name Flavor SS (g) TF (g) TF/100g Pillsbury Creamy Supreme Frosting Chocolate Fudge 35 2.0 5.71 Pillsbury Mini - Bites Cinnamon 49 2.5 5.10 Pillsbury Toaster Strudel Cinnamon Roll 54 1.0 1.85 Pillsbury Grands Cinnamon Rolls Cream Cheese Icing 99 2.5 2.53 Pillsbury Grands Cinnamon Rolls with Icing 99 2.5 2.53 Pillsbury Creamy Supreme Frosting Coconut Pecan 35 2.0 5.71 Pillsbury Ultimate Desert Kit Cookies 'n Crème 53 1.5 2.83 Pillsbury Toaster Strudel Cream Cheese and Strawberry 54 1.0 1.85 Pillsbury Toaster Strudel Danish Style Cream Cheese 54 1.5 2.78 Pillsbury Oven Baked Biscuits Easy Split 90 6.0 6.67 Pillsbury Toaster Scrambles Egg Cheese and Bacon - Reduced Fat 47 2.0 4.26 Pillsbury Grands Homestyle Extra Rich 61 4.0 6.56 Pillsbury Grands Extra Rich Cinnamon Rolls 99 3.0 3.03 Pillsbury Golden Layers Flakey 34 1.5 4.41 Pillsbury Grands Flakey Supreme Cinnamon Rolls 99 5.0 5.05 Pillsbury Oven Baked Biscuits Flaky Layers 52 3.0 5.77 Pillsbury Creamy Supreme Frosting Funfetti 37 2.0 5.41 Pillsbury Cresent Garlic Butter 28 1.5 5.36 Pillsbury Golden Layers Honey Butter 34 2.0 5.88 Pillsbury Breadsticks Italian 60 1.5 2.50 Pillsbury Creamy Supreme Frosting Milk Chocolate 35 2.0 5.71 Pillsbury Whipped Supreme Frosting Milk Chocolate 24 1.5 6.25 Pillsbury Cresent Original 28 1.5 5.36 Pillsbury Grands Flaky Layers Original 58 3.5 6.03 Pillsbury Grands Homestyle Original 58 3.0 5.17 Pillsbury Create 'n Bake Peanut Butter Cookies 29 1.0 3.45 Pillsbury Fudge Supreme Peanut Butter Swirl 31 0.5 1.61 Pillsbury Moist Supreme Pineapple 43 1.0 2.33 Pillsbury Toaster Strudel Rasberry 54 1.0 1.85 Pillsbury Turnovers Real Apple 57 3.0 5.26
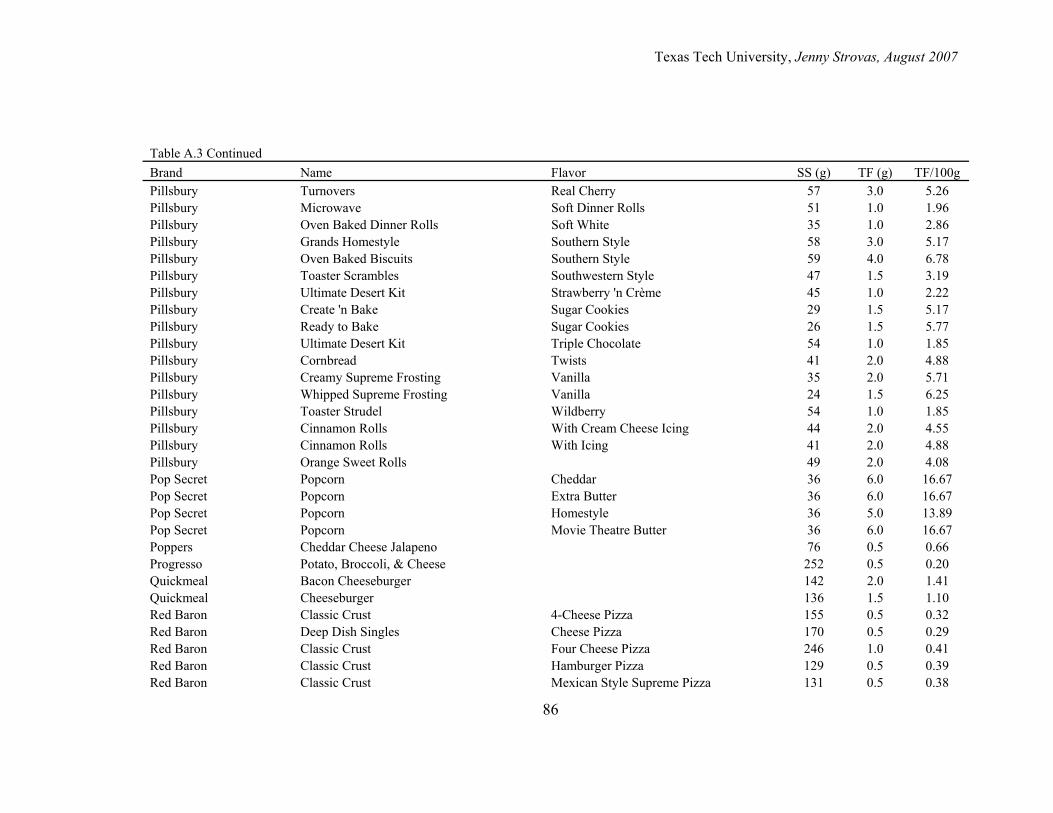
Texas Tech University, Jenny Strovas, August 2007
86
Table A.3 Continued Brand Name Flavor SS (g) TF (g) TF/100g Pillsbury Turnovers Real Cherry 57 3.0 5.26 Pillsbury Microwave Soft Dinner Rolls 51 1.0 1.96 Pillsbury Oven Baked Dinner Rolls Soft White 35 1.0 2.86 Pillsbury Grands Homestyle Southern Style 58 3.0 5.17 Pillsbury Oven Baked Biscuits Southern Style 59 4.0 6.78 Pillsbury Toaster Scrambles Southwestern Style 47 1.5 3.19 Pillsbury Ultimate Desert Kit Strawberry 'n Crème 45 1.0 2.22 Pillsbury Create 'n Bake Sugar Cookies 29 1.5 5.17 Pillsbury Ready to Bake Sugar Cookies 26 1.5 5.77 Pillsbury Ultimate Desert Kit Triple Chocolate 54 1.0 1.85 Pillsbury Cornbread Twists 41 2.0 4.88 Pillsbury Creamy Supreme Frosting Vanilla 35 2.0 5.71 Pillsbury Whipped Supreme Frosting Vanilla 24 1.5 6.25 Pillsbury Toaster Strudel Wildberry 54 1.0 1.85 Pillsbury Cinnamon Rolls With Cream Cheese Icing 44 2.0 4.55 Pillsbury Cinnamon Rolls With Icing 41 2.0 4.88 Pillsbury Orange Sweet Rolls 49 2.0 4.08 Pop Secret Popcorn Cheddar 36 6.0 16.67 Pop Secret Popcorn Extra Butter 36 6.0 16.67 Pop Secret Popcorn Homestyle 36 5.0 13.89 Pop Secret Popcorn Movie Theatre Butter 36 6.0 16.67 Poppers Cheddar Cheese Jalapeno 76 0.5 0.66 Progresso Potato, Broccoli, & Cheese 252 0.5 0.20 Quickmeal Bacon Cheeseburger 142 2.0 1.41 Quickmeal Cheeseburger 136 1.5 1.10 Red Baron Classic Crust 4-Cheese Pizza 155 0.5 0.32 Red Baron Deep Dish Singles Cheese Pizza 170 0.5 0.29 Red Baron Classic Crust Four Cheese Pizza 246 1.0 0.41 Red Baron Classic Crust Hamburger Pizza 129 0.5 0.39 Red Baron Classic Crust Mexican Style Supreme Pizza 131 0.5 0.38
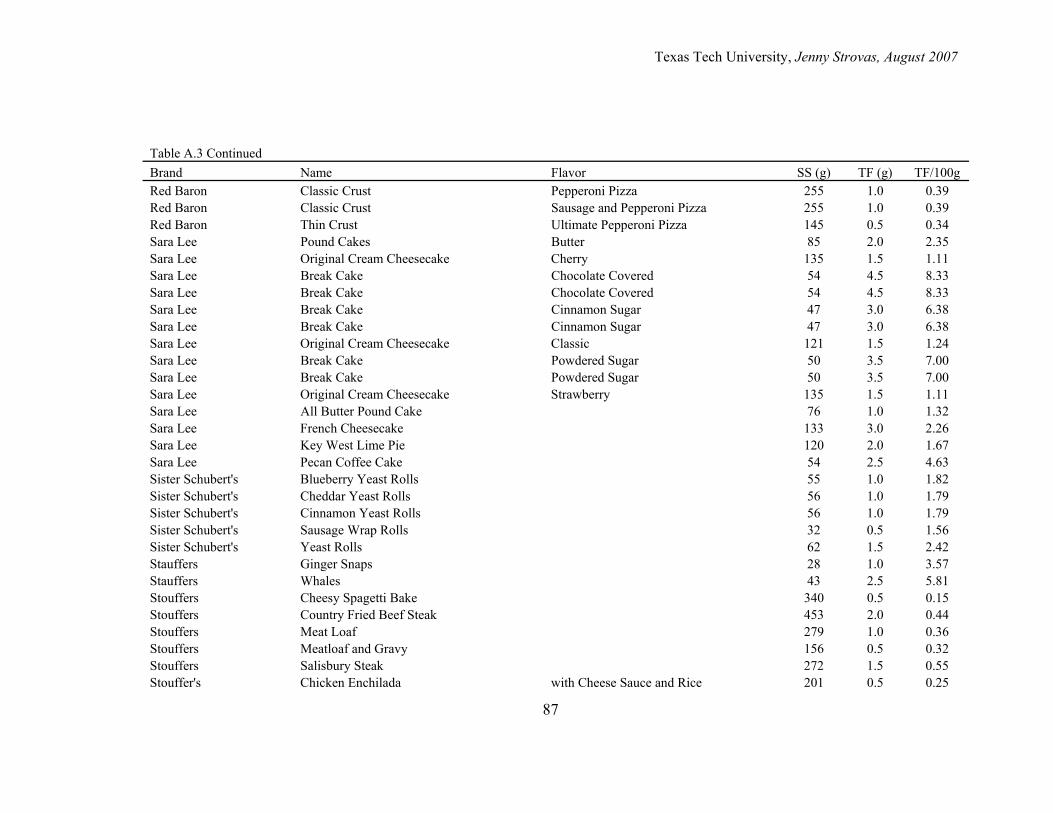
Texas Tech University, Jenny Strovas, August 2007
87
Table A.3 Continued Brand Name Flavor SS (g) TF (g) TF/100g Red Baron Classic Crust Pepperoni Pizza 255 1.0 0.39 Red Baron Classic Crust Sausage and Pepperoni Pizza 255 1.0 0.39 Red Baron Thin Crust Ultimate Pepperoni Pizza 145 0.5 0.34 Sara Lee Pound Cakes Butter 85 2.0 2.35 Sara Lee Original Cream Cheesecake Cherry 135 1.5 1.11 Sara Lee Break Cake Chocolate Covered 54 4.5 8.33 Sara Lee Break Cake Chocolate Covered 54 4.5 8.33 Sara Lee Break Cake Cinnamon Sugar 47 3.0 6.38 Sara Lee Break Cake Cinnamon Sugar 47 3.0 6.38 Sara Lee Original Cream Cheesecake Classic 121 1.5 1.24 Sara Lee Break Cake Powdered Sugar 50 3.5 7.00 Sara Lee Break Cake Powdered Sugar 50 3.5 7.00 Sara Lee Original Cream Cheesecake Strawberry 135 1.5 1.11 Sara Lee All Butter Pound Cake 76 1.0 1.32 Sara Lee French Cheesecake 133 3.0 2.26 Sara Lee Key West Lime Pie 120 2.0 1.67 Sara Lee Pecan Coffee Cake 54 2.5 4.63 Sister Schubert's Blueberry Yeast Rolls 55 1.0 1.82 Sister Schubert's Cheddar Yeast Rolls 56 1.0 1.79 Sister Schubert's Cinnamon Yeast Rolls 56 1.0 1.79 Sister Schubert's Sausage Wrap Rolls 32 0.5 1.56 Sister Schubert's Yeast Rolls 62 1.5 2.42 Stauffers Ginger Snaps 28 1.0 3.57 Stauffers Whales 43 2.5 5.81 Stouffers Cheesy Spagetti Bake 340 0.5 0.15 Stouffers Country Fried Beef Steak 453 2.0 0.44 Stouffers Meat Loaf 279 1.0 0.36 Stouffers Meatloaf and Gravy 156 0.5 0.32 Stouffers Salisbury Steak 272 1.5 0.55 Stouffer's Chicken Enchilada with Cheese Sauce and Rice 201 0.5 0.25
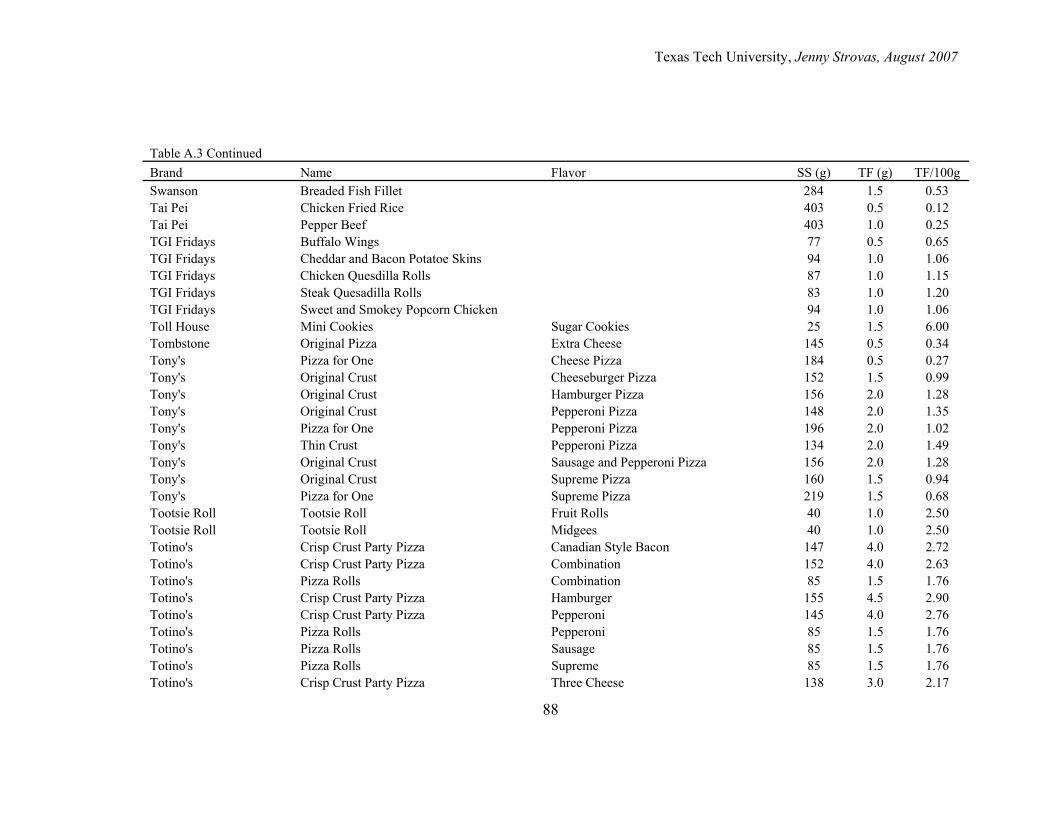
Texas Tech University, Jenny Strovas, August 2007
88
Table A.3 Continued Brand Name Flavor SS (g) TF (g) TF/100g Swanson Breaded Fish Fillet 284 1.5 0.53 Tai Pei Chicken Fried Rice 403 0.5 0.12 Tai Pei Pepper Beef 403 1.0 0.25 TGI Fridays Buffalo Wings 77 0.5 0.65 TGI Fridays Cheddar and Bacon Potatoe Skins 94 1.0 1.06 TGI Fridays Chicken Quesdilla Rolls 87 1.0 1.15 TGI Fridays Steak Quesadilla Rolls 83 1.0 1.20 TGI Fridays Sweet and Smokey Popcorn Chicken 94 1.0 1.06 Toll House Mini Cookies Sugar Cookies 25 1.5 6.00 Tombstone Original Pizza Extra Cheese 145 0.5 0.34 Tony's Pizza for One Cheese Pizza 184 0.5 0.27 Tony's Original Crust Cheeseburger Pizza 152 1.5 0.99 Tony's Original Crust Hamburger Pizza 156 2.0 1.28 Tony's Original Crust Pepperoni Pizza 148 2.0 1.35 Tony's Pizza for One Pepperoni Pizza 196 2.0 1.02 Tony's Thin Crust Pepperoni Pizza 134 2.0 1.49 Tony's Original Crust Sausage and Pepperoni Pizza 156 2.0 1.28 Tony's Original Crust Supreme Pizza 160 1.5 0.94 Tony's Pizza for One Supreme Pizza 219 1.5 0.68 Tootsie Roll Tootsie Roll Fruit Rolls 40 1.0 2.50 Tootsie Roll Tootsie Roll Midgees 40 1.0 2.50 Totino's Crisp Crust Party Pizza Canadian Style Bacon 147 4.0 2.72 Totino's Crisp Crust Party Pizza Combination 152 4.0 2.63 Totino's Pizza Rolls Combination 85 1.5 1.76 Totino's Crisp Crust Party Pizza Hamburger 155 4.5 2.90 Totino's Crisp Crust Party Pizza Pepperoni 145 4.0 2.76 Totino's Pizza Rolls Pepperoni 85 1.5 1.76 Totino's Pizza Rolls Sausage 85 1.5 1.76 Totino's Pizza Rolls Supreme 85 1.5 1.76 Totino's Crisp Crust Party Pizza Three Cheese 138 3.0 2.17
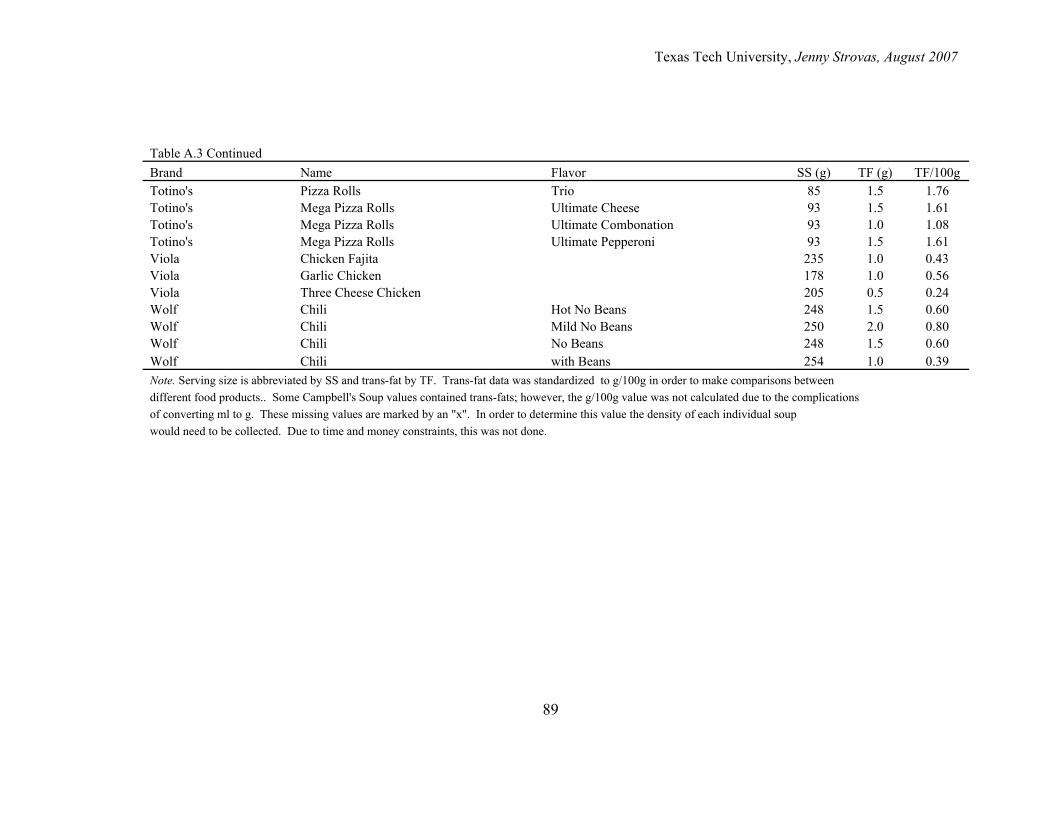
Texas Tech University, Jenny Strovas, August 2007
89
Table A.3 Continued Brand Name Flavor SS (g) TF (g) TF/100g Totino's Pizza Rolls Trio 85 1.5 1.76 Totino's Mega Pizza Rolls Ultimate Cheese 93 1.5 1.61 Totino's Mega Pizza Rolls Ultimate Combonation 93 1.0 1.08 Totino's Mega Pizza Rolls Ultimate Pepperoni 93 1.5 1.61 Viola Chicken Fajita 235 1.0 0.43 Viola Garlic Chicken 178 1.0 0.56 Viola Three Cheese Chicken 205 0.5 0.24 Wolf Chili Hot No Beans 248 1.5 0.60 Wolf Chili Mild No Beans 250 2.0 0.80 Wolf Chili No Beans 248 1.5 0.60 Wolf Chili with Beans 254 1.0 0.39 Note. Serving size is abbreviated by SS and trans-fat by TF. Trans-fat data was standardized to g/100g in order to make comparisons between different food products.. Some Campbell's Soup values contained trans-fats; however, the g/100g value was not calculated due to the complications of converting ml to g. These missing values are marked by an "x". In order to determine this value the density of each individual soup would need to be collected. Due to time and money constraints, this was not done.
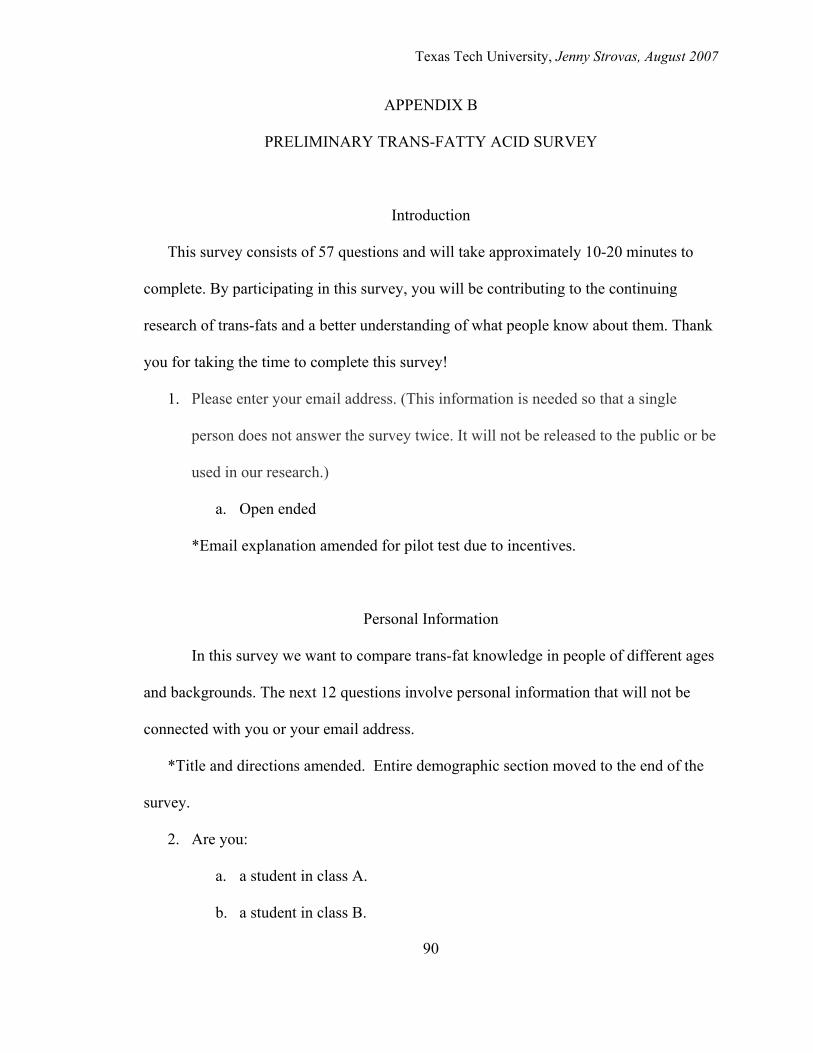
Texas Tech University, Jenny Strovas, August 2007
90
APPENDIX B
PRELIMINARY TRANS-FATTY ACID SURVEY
Introduction
This survey consists of 57 questions and will take approximately 10-20 minutes to
complete. By participating in this survey, you will be contributing to the continuing
research of trans-fats and a better understanding of what people know about them. Thank
you for taking the time to complete this survey!
1. Please enter your email address. (This information is needed so that a single
person does not answer the survey twice. It will not be released to the public or be
used in our research.)
a. Open ended
*Email explanation amended for pilot test due to incentives.
Personal Information
In this survey we want to compare trans-fat knowledge in people of different ages
and backgrounds. The next 12 questions involve personal information that will not be
connected with you or your email address.
*Title and directions amended. Entire demographic section moved to the end of the
survey.
2. Are you:
a. a student in class A.
b. a student in class B.

Texas Tech University, Jenny Strovas, August 2007
91
c. a Lubbock dietitian.
d. a faculty member in ANSC.
*Item amended for various subject groups. Pilot test item 37.
3. What college are you in?
a. Not affiliated with Tech
b. Agricultural Sciences & Natural Resources
c. Architecture
d. Arts & Sciences
e. Business Administration
f. Education
g. Engineering
h. Human Sciences
i. Mass Communications
j. School of Law
k. Visual & Performing Arts
l. Health Science Center
m. Other (please specify)
i. Open ended
*Item deleted. It was not necessary to know the college due to pilot test items
39 and 40.
4. If you are a student, what is your major?
a. Open ended
*Pilot test item number 40 was added.
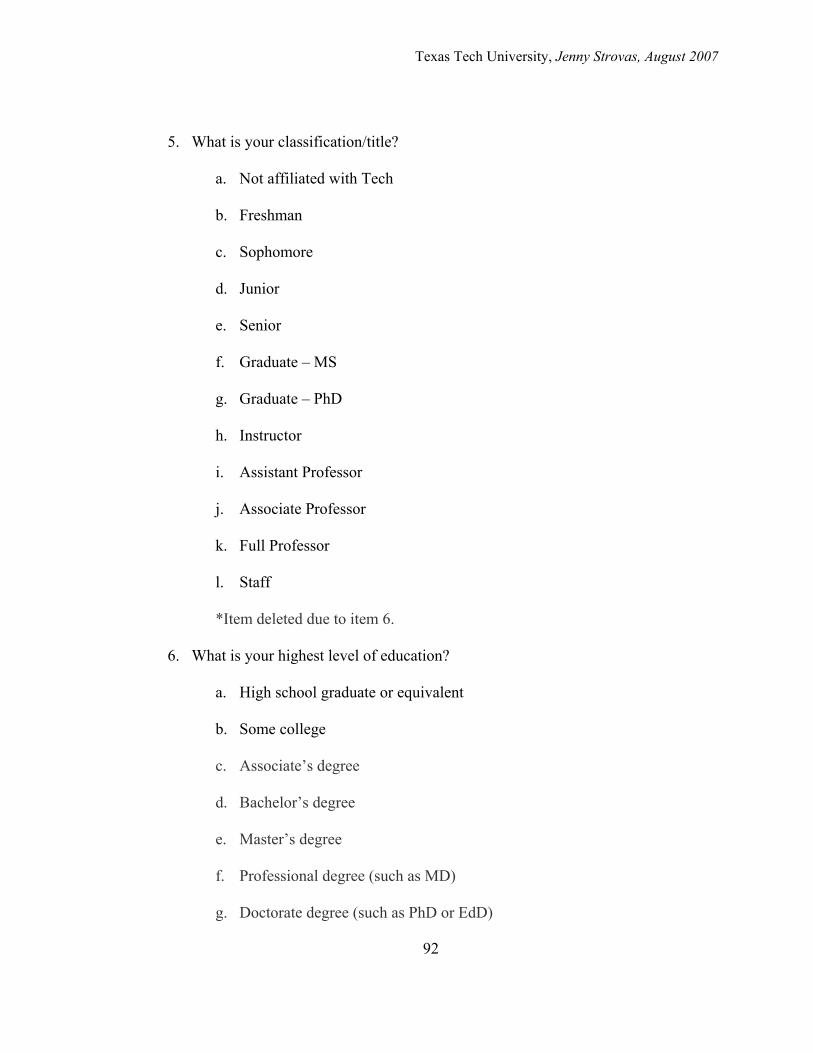
Texas Tech University, Jenny Strovas, August 2007
92
5. What is your classification/title?
a. Not affiliated with Tech
b. Freshman
c. Sophomore
d. Junior
e. Senior
f. Graduate – MS
g. Graduate – PhD
h. Instructor
i. Assistant Professor
j. Associate Professor
k. Full Professor
l. Staff
*Item deleted due to item 6.
6. What is your highest level of education?
a. High school graduate or equivalent
b. Some college
c. Associate’s degree
d. Bachelor’s degree
e. Master’s degree
f. Professional degree (such as MD)
g. Doctorate degree (such as PhD or EdD)
Texas Tech University, Jenny Strovas, August 2007
93
7. What is your age?
a. Open ended
8. Are you currently married?
a. Yes
b. No
9. Which best describes your personal income for 2006?
a. I don’t work while attending school.
b. $0 - $9,000
c. $10,000 - $19,000
d. $20,000 - $29,000
e. $30,000 - $39,000
f. $40,000 - $49,000
g. $50,000 - $59,000
h. $60,000 - $69,000
i. $70,000 - $79,000
j. $80,000 - $89,000
k. $90,000 - $99,000
l. $100,000 - $149,000
m. $150,000 - $199,000
n. $200,000 +
*Item amended. Pilot test item 45.
10. Which best describes your race/ethnicity?
Texas Tech University, Jenny Strovas, August 2007
94
a. African American
b. American Indian or Eskimo
c. Asian or Pacific Islander
d. Hispanic
e. White / Non Hispanic
f. Other (please specify)
i. Open ended
11. Are you American born or internationally born?
a. American
b. International (please specify which country)
i. Open ended
12. In the past month, how often did you exercise for a consecutive 30 minutes?
a. Once a day or more
b. Once every 2-3 days
c. Once a week
d. Once every 2 weeks
e. Once a month
f. Less than once a month
*Item amended. Pilot test item 48.
What do you know about trans-fats?
Please answer the following questions according to what you know about trans-
fats.
Texas Tech University, Jenny Strovas, August 2007
95
*Title and directions amended.
13. What are the major dietary sources for trans-fats? (Check all that apply.)
a. Fast foods
b. Vegetables
c. Margarine
d. Fruits
e. Packaged snacks
f. Bakery products
g. Meats
*Item amended. Pilot test item 2
14. Fried foods have more or less trans-fats than non fried foods?
a. More
b. Less
c. Not sure
*Item amended. Pilot test item 3.
15. Trans-fats are a risk factor for heart disease
a. Agree
b. Disagree
c. Not sure
*Item amended. Pilot test item 4.
16. Are trans-fat amounts required on food labels?
a. Yes
b. No
Texas Tech University, Jenny Strovas, August 2007
96
c. Not sure
*Item amended. Pilot test item 5.
17. What properties do adding trans-fat give to foods? (Check all that apply.)
a. Shelf life
b. Color
c. Flavor maintenance
d. Favorable texture
e. Lower calories
*Item amended. Pilot test item 6.
18. Do packaged foods today have more or less grams of trans-fats than one year
ago?
a. More
b. Less
c. Not sure
*Item amended. Pilot test item 7.
19. Trans-fat amounts are regulated by the Food and Drug Administration.
a. Agree
b. Disagree
c. Not sure
*Item deleted due to similarities with amended item 16.
20. What animal products have trans-fats? (Check all that apply.)
a. Beef
b. Chicken
Texas Tech University, Jenny Strovas, August 2007
97
c. Turkey
d. Pork
*Item amended. Pilot test item 8.
21. Would you favor fast food restaurants that changed their frying oil to a low trans-
fat oil?
a. Yes
b. Maybe
c. No
d. Don’t care
*Item deleted. Not a knowledge related item.
22. If “partially hydrogenated oil” is written on the food label, then the product is
trans-fat free.
a. Agree
b. Disagree
c. Not sure
*Item amended. Pilot test item 9.
23. Are trans-fats saturated or unsaturated fats?
a. Saturated
b. Unsaturated
c. Not sure
*Item amended. Pilot test item 10.
24. Companies can claim that a food product is trans-fat free if it has no more than
0.49 grams of trans-fat per serving.
Texas Tech University, Jenny Strovas, August 2007
98
a. Agree
b. Disagree
c. Not sure
*Item amended. Pilot test item 11.
25. Do natural vegetable oils (e.g. olive, peanut) contain trans-fats?
a. Yes
b. No
c. Not sure
*Item amended. Pilot test item 12.
How do you feel about trans-fats?
Answer the following questions according to how you feel about trans-fats.
*Title and directions amended.
26. I am concerned with the possible negative health effects caused by trans-fats.
a. Strongly agree
b. Agree
c. Not sure
d. Disagree
e. Strongly disagree
*Item amended due to its leading nature. Pilot test item 13.
27. It is important to me that food products have a low amount of trans-fats.
a. Strongly agree
b. Agree
Texas Tech University, Jenny Strovas, August 2007
99
c. Not sure
d. Disagree
e. Strongly disagree
28. I would like to see more low fat options on restaurant menus.
a. Strongly agree
b. Agree
c. Not sure
d. Disagree
e. Strongly disagree
*Item amended. Pilot test item 16.
29. Products that claim to be “trans-fat free” affect your decision to buy them.
a. Strongly agree
b. Agree
c. Not sure
d. Disagree
e. Strongly disagree
*Item deleted.
30. Would you like to see trans-fat amounts printed on restaurant menus?
a. Yes
b. Maybe
c. No
d. Don’t care
*Item amended. Pilot test item 17.
Texas Tech University, Jenny Strovas, August 2007
100
31. Would you positively view restaurants that had low trans-fat dishes?
a. Yes
b. Maybe
c. No
d. Don’t care
*Item amended. Pilot test item 15.
32. Would you like to see trans-fat free food items labeled on menus?
a. Yes
b. Maybe
c. No
d. Don’t care
*Item deleted.
33. Would you positively view restaurants that had low trans-fat dishes?
a. Yes
b. Maybe
c. No
d. Don’t care
*Item deleted.
34. Would you frequent restaurants that claimed trans-fat free/low dishes?
a. Yes
b. Maybe
c. No
d. Don’t care
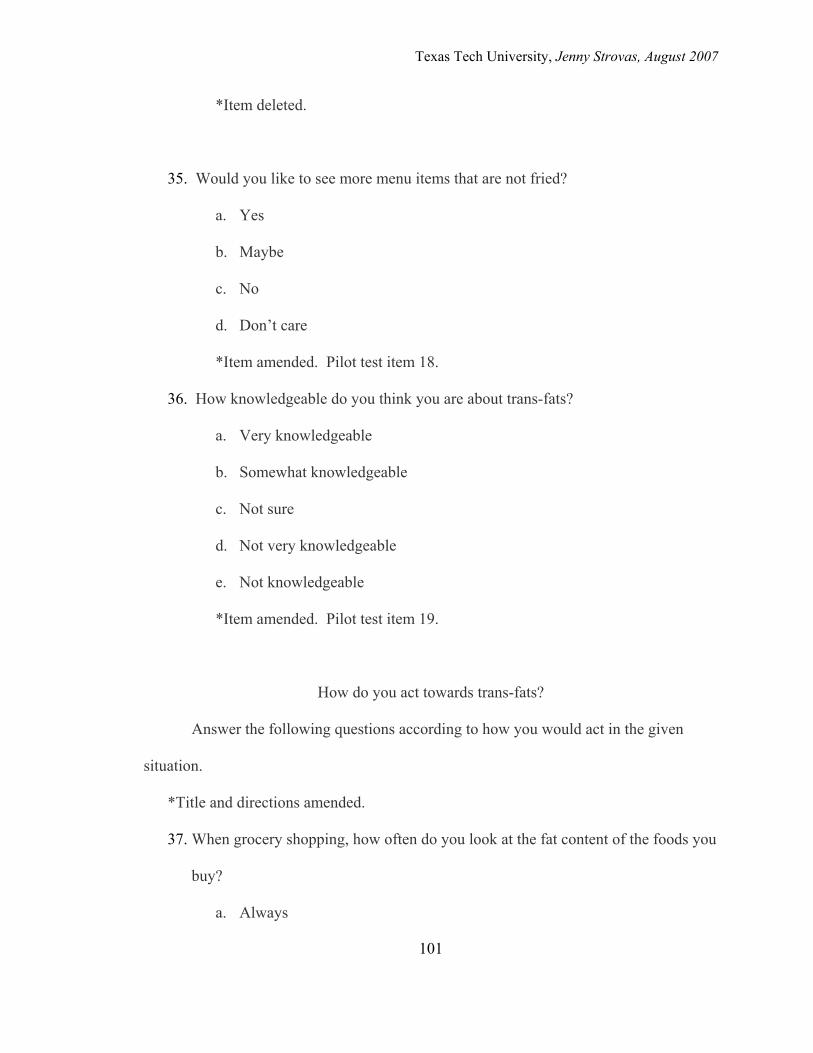
Texas Tech University, Jenny Strovas, August 2007
101
*Item deleted.
35. Would you like to see more menu items that are not fried?
a. Yes
b. Maybe
c. No
d. Don’t care
*Item amended. Pilot test item 18.
36. How knowledgeable do you think you are about trans-fats?
a. Very knowledgeable
b. Somewhat knowledgeable
c. Not sure
d. Not very knowledgeable
e. Not knowledgeable
*Item amended. Pilot test item 19.
How do you act towards trans-fats?
Answer the following questions according to how you would act in the given
situation.
*Title and directions amended.
37. When grocery shopping, how often do you look at the fat content of the foods you
buy?
a. Always
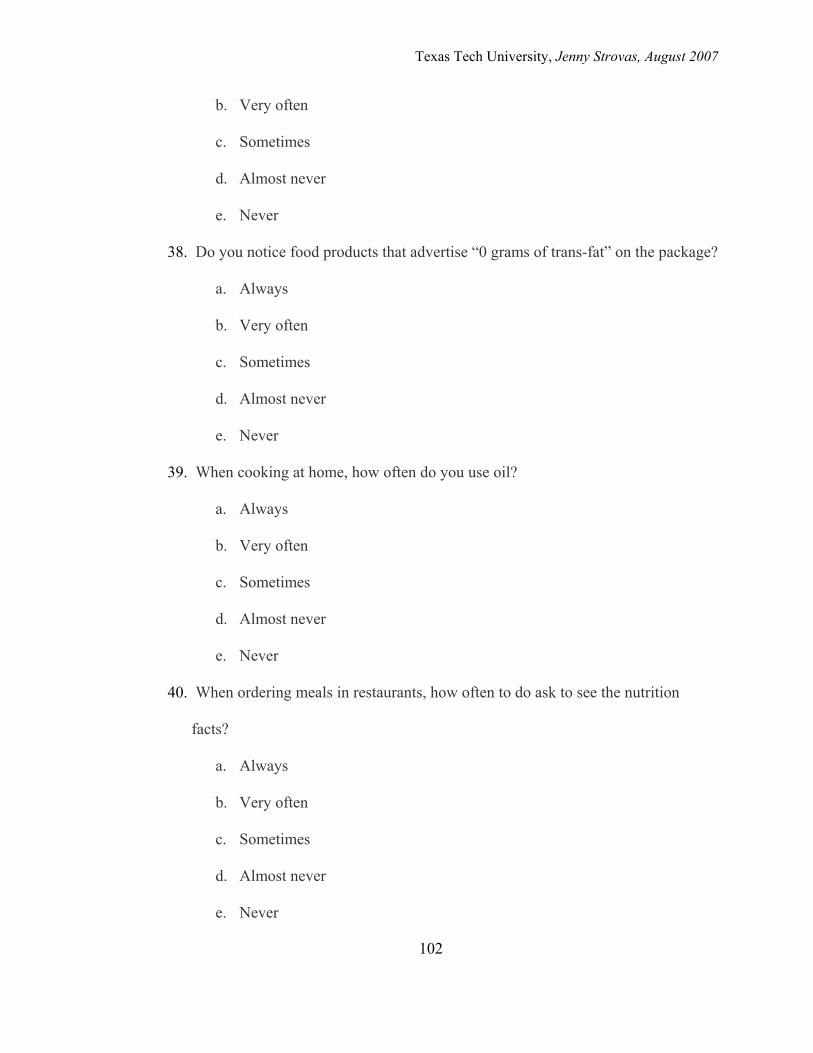
Texas Tech University, Jenny Strovas, August 2007
102
b. Very often
c. Sometimes
d. Almost never
e. Never
38. Do you notice food products that advertise “0 grams of trans-fat” on the package?
a. Always
b. Very often
c. Sometimes
d. Almost never
e. Never
39. When cooking at home, how often do you use oil?
a. Always
b. Very often
c. Sometimes
d. Almost never
e. Never
40. When ordering meals in restaurants, how often to do ask to see the nutrition
facts?
a. Always
b. Very often
c. Sometimes
d. Almost never
e. Never
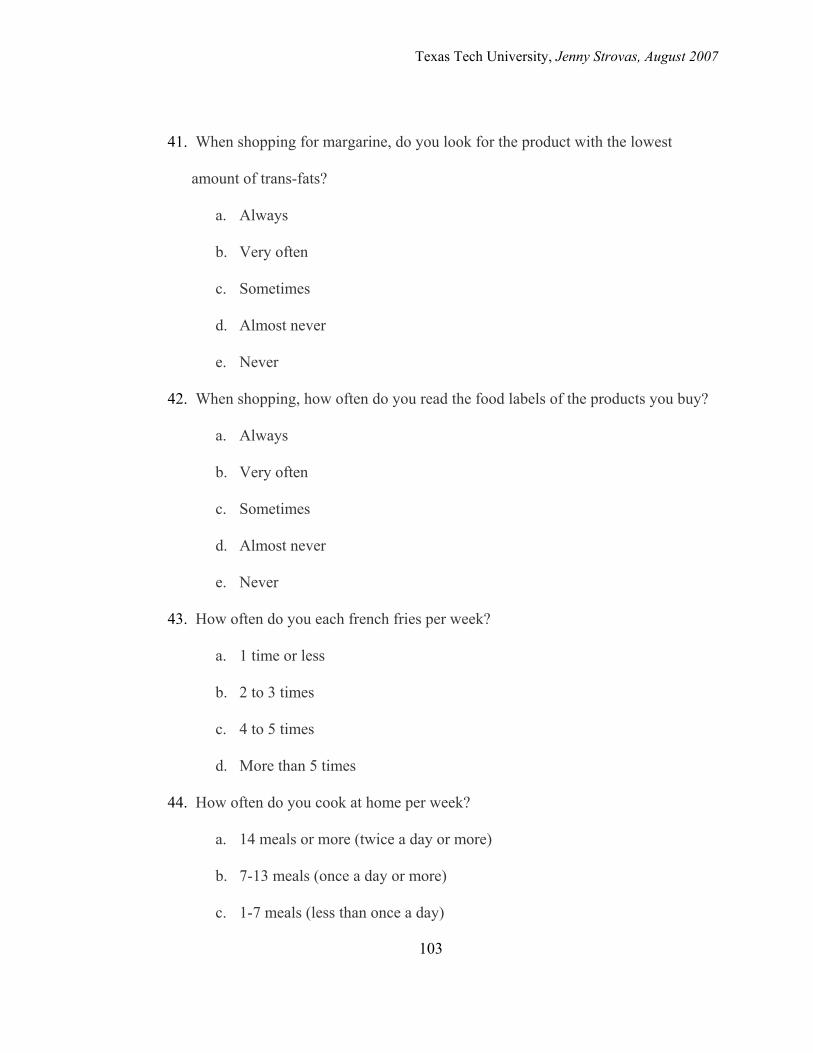
Texas Tech University, Jenny Strovas, August 2007
103
41. When shopping for margarine, do you look for the product with the lowest
amount of trans-fats?
a. Always
b. Very often
c. Sometimes
d. Almost never
e. Never
42. When shopping, how often do you read the food labels of the products you buy?
a. Always
b. Very often
c. Sometimes
d. Almost never
e. Never
43. How often do you each french fries per week?
a. 1 time or less
b. 2 to 3 times
c. 4 to 5 times
d. More than 5 times
44. How often do you cook at home per week?
a. 14 meals or more (twice a day or more)
b. 7-13 meals (once a day or more)
c. 1-7 meals (less than once a day)
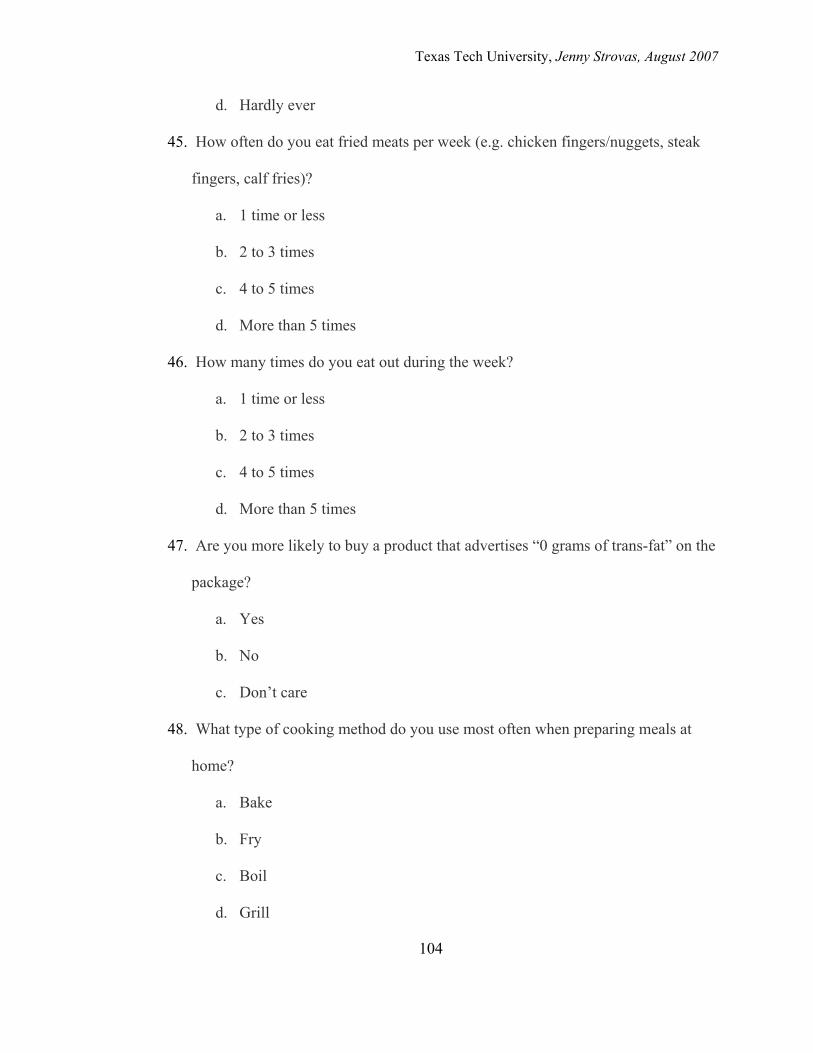
Texas Tech University, Jenny Strovas, August 2007
104
d. Hardly ever
45. How often do you eat fried meats per week (e.g. chicken fingers/nuggets, steak
fingers, calf fries)?
a. 1 time or less
b. 2 to 3 times
c. 4 to 5 times
d. More than 5 times
46. How many times do you eat out during the week?
a. 1 time or less
b. 2 to 3 times
c. 4 to 5 times
d. More than 5 times
47. Are you more likely to buy a product that advertises “0 grams of trans-fat” on the
package?
a. Yes
b. No
c. Don’t care
48. What type of cooking method do you use most often when preparing meals at
home?
a. Bake
b. Fry
c. Boil
d. Grill
Texas Tech University, Jenny Strovas, August 2007
105
e. Braise
f. Steam
49. I regularly choose low fat foods when they are available.
a. Strongly agree
b. Agree
c. Not sure
d. Disagree
e. Strongly disagree
Trans-fat choices.
Answer the following questions according to how confident you would feel in the
given situation.
50. How confident are you that you could regularly prepare low fat meals at home?
a. Very confident
b. Somewhat confident
c. Somewhat unconfident
d. Very unconfident
51. If you went to a restaurant, how confident would you feel about selecting foods
that are not fried?
a. Very confident
b. Somewhat confident
c. Somewhat unconfident
d. Very unconfident
Texas Tech University, Jenny Strovas, August 2007
106
52. How confident do you feel about your ability to buy foods that are low in trans-
fats?
a. Very confident
b. Somewhat confident
c. Somewhat unconfident
d. Very unconfident
53. If you were given a recipe for one of your favorite foods, how confident would
you be about changing the ingredients to reduce the amount of trans-fats?
a. Very confident
b. Somewhat confident
c. Somewhat unconfident
d. Very unconfident
54. How confident are you that you could prepare tasty and low fat dishes?
a. Very confident
b. Somewhat confident
c. Somewhat unconfident
d. Very unconfident
Last page
Please answer the following questions and click submit when you’re finished. Thank
you for taking the time to fill out our survey!
55. Why did you choose to answer this survey?
a. I’m interested in trans-fats.
Texas Tech University, Jenny Strovas, August 2007
107
b. I wanted the incentive.
c. I’m bored
d. Other (please specify)
i. Open ended
56. Would you be interested in learning more about trans-fats?
a. Yes
b. Maybe
c. No
57. If you answered yes or maybe to the previous questions, what educational
method would you prefer?
a. Online
b. Community program
c. Course on the Tech campus
d. Other (please specify)
i. Open ended
Texas Tech University, Jenny Strovas, August 2007
108
APPENDIX C
PILOT TEST TRANS-FATTY ACID SURVEY
Introduction
This survey consists of 54 questions and will take approximately 10-20 minutes to
complete. By participating in this survey, you will be contributing to the continuing
research of trans-fats and a better understanding of what people know about them. You
will also be entered into a drawing for some great prizes!
1. Please enter your email address. (This information is needed so that we can
notify the winner of the incentive drawing. It will not be released to the public or
used in our research.)
Section 1
Please complete each question by clicking the bubble next to the answer. Each
question must be answered before you can move on to the next section.
2. What are the major dietary sources of trans-fats? (Check all that apply.)
Item Title: Know Diet Source
a. Fats foods
b. Vegetables
c. Margarine
d. Fruit
e. Packaged snacks
f. Bakery products
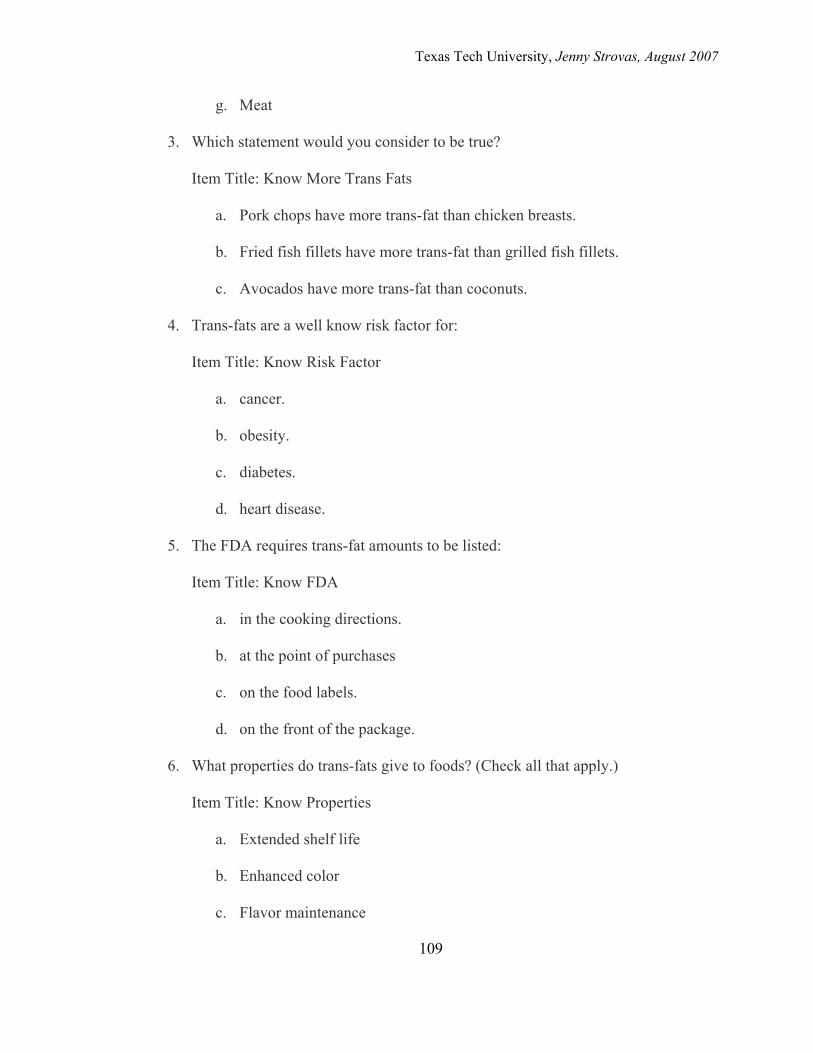
Texas Tech University, Jenny Strovas, August 2007
109
g. Meat
3. Which statement would you consider to be true?
Item Title: Know More Trans Fats
a. Pork chops have more trans-fat than chicken breasts.
b. Fried fish fillets have more trans-fat than grilled fish fillets.
c. Avocados have more trans-fat than coconuts.
4. Trans-fats are a well know risk factor for:
Item Title: Know Risk Factor
a. cancer.
b. obesity.
c. diabetes.
d. heart disease.
5. The FDA requires trans-fat amounts to be listed:
Item Title: Know FDA
a. in the cooking directions.
b. at the point of purchases
c. on the food labels.
d. on the front of the package.
6. What properties do trans-fats give to foods? (Check all that apply.)
Item Title: Know Properties
a. Extended shelf life
b. Enhanced color
c. Flavor maintenance
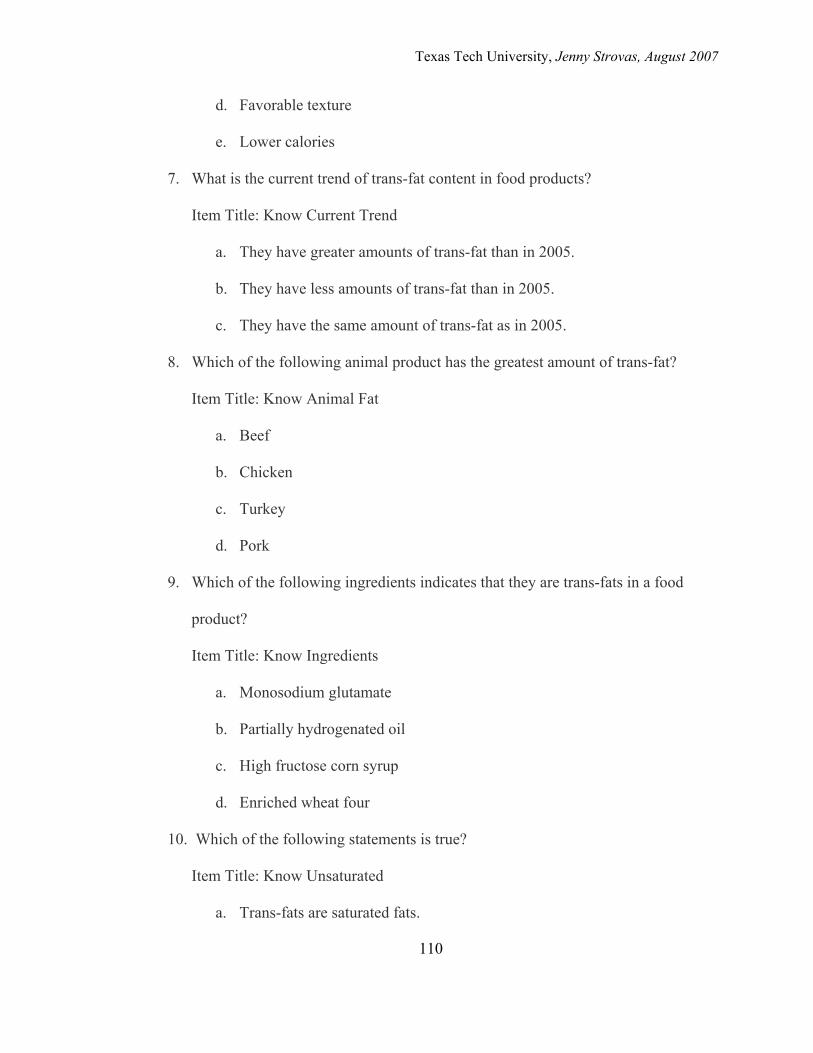
Texas Tech University, Jenny Strovas, August 2007
110
d. Favorable texture
e. Lower calories
7. What is the current trend of trans-fat content in food products?
Item Title: Know Current Trend
a. They have greater amounts of trans-fat than in 2005.
b. They have less amounts of trans-fat than in 2005.
c. They have the same amount of trans-fat as in 2005.
8. Which of the following animal product has the greatest amount of trans-fat?
Item Title: Know Animal Fat
a. Beef
b. Chicken
c. Turkey
d. Pork
9. Which of the following ingredients indicates that they are trans-fats in a food
product?
Item Title: Know Ingredients
a. Monosodium glutamate
b. Partially hydrogenated oil
c. High fructose corn syrup
d. Enriched wheat four
10. Which of the following statements is true?
Item Title: Know Unsaturated
a. Trans-fats are saturated fats.
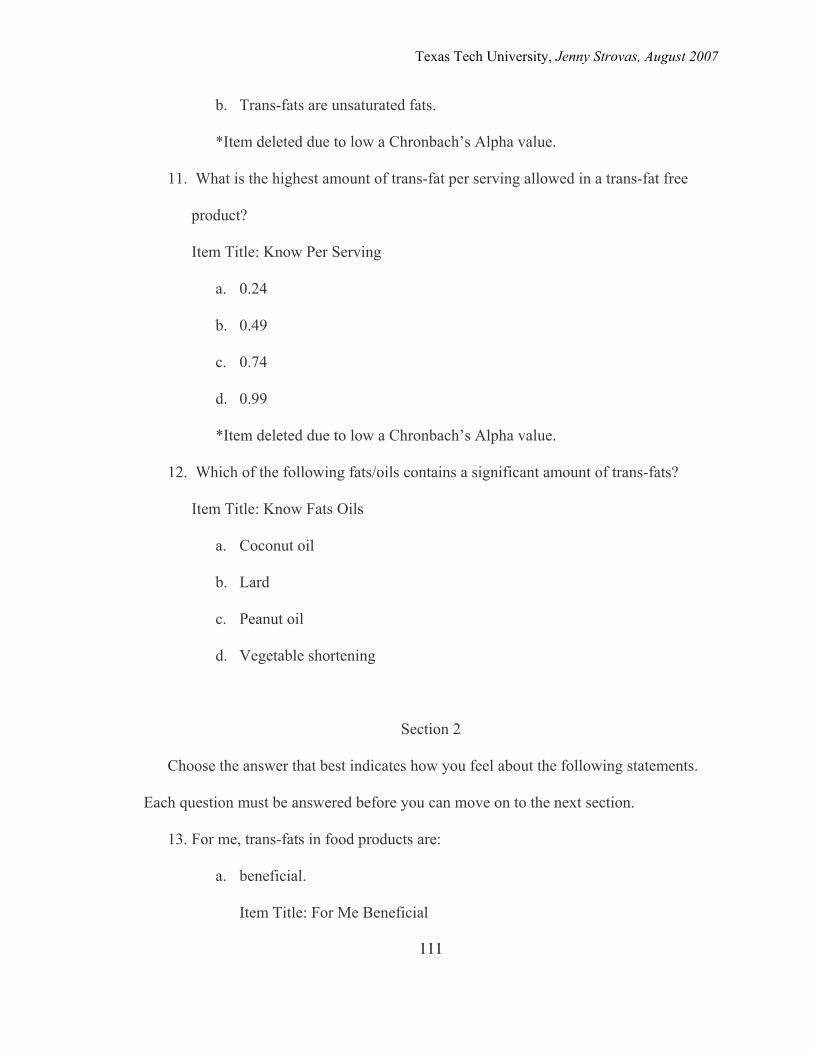
Texas Tech University, Jenny Strovas, August 2007
111
b. Trans-fats are unsaturated fats.
*Item deleted due to low a Chronbach’s Alpha value.
11. What is the highest amount of trans-fat per serving allowed in a trans-fat free
product?
Item Title: Know Per Serving
a. 0.24
b. 0.49
c. 0.74
d. 0.99
*Item deleted due to low a Chronbach’s Alpha value.
12. Which of the following fats/oils contains a significant amount of trans-fats?
Item Title: Know Fats Oils
a. Coconut oil
b. Lard
c. Peanut oil
d. Vegetable shortening
Section 2
Choose the answer that best indicates how you feel about the following statements.
Each question must be answered before you can move on to the next section.
13. For me, trans-fats in food products are:
a. beneficial.
Item Title: For Me Beneficial
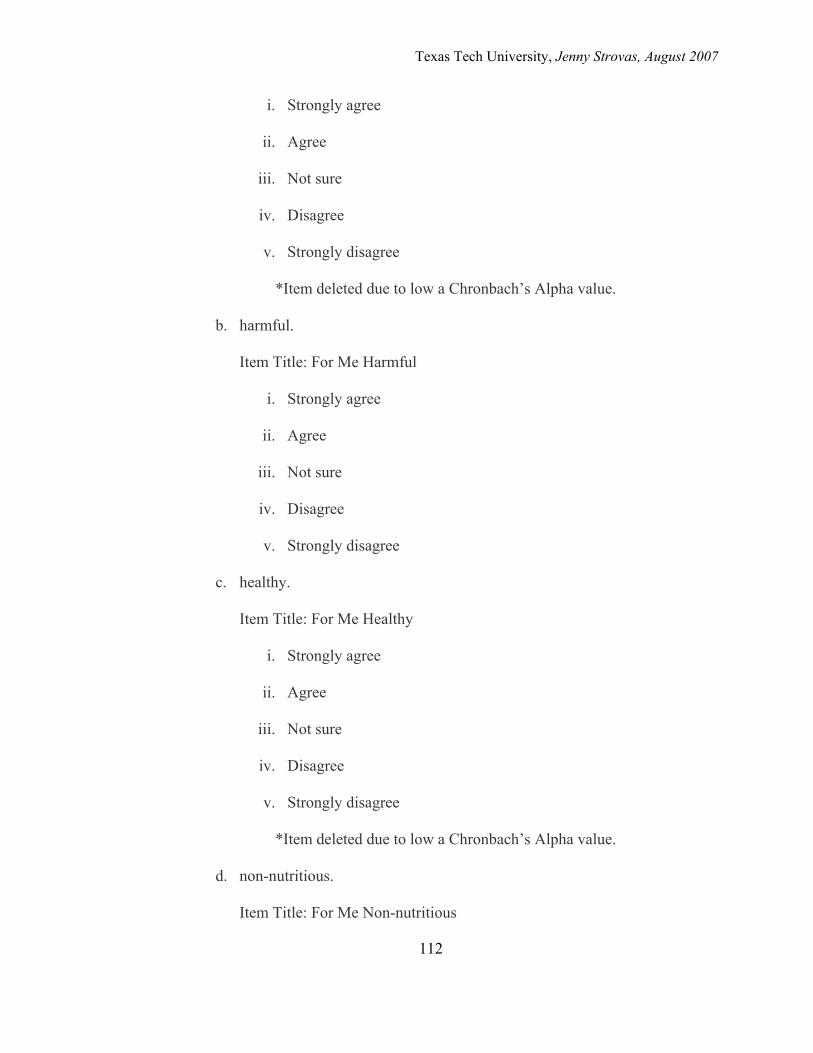
Texas Tech University, Jenny Strovas, August 2007
112
i. Strongly agree
ii. Agree
iii. Not sure
iv. Disagree
v. Strongly disagree
*Item deleted due to low a Chronbach’s Alpha value.
b. harmful.
Item Title: For Me Harmful
i. Strongly agree
ii. Agree
iii. Not sure
iv. Disagree
v. Strongly disagree
c. healthy.
Item Title: For Me Healthy
i. Strongly agree
ii. Agree
iii. Not sure
iv. Disagree
v. Strongly disagree
*Item deleted due to low a Chronbach’s Alpha value.
d. non-nutritious.
Item Title: For Me Non-nutritious
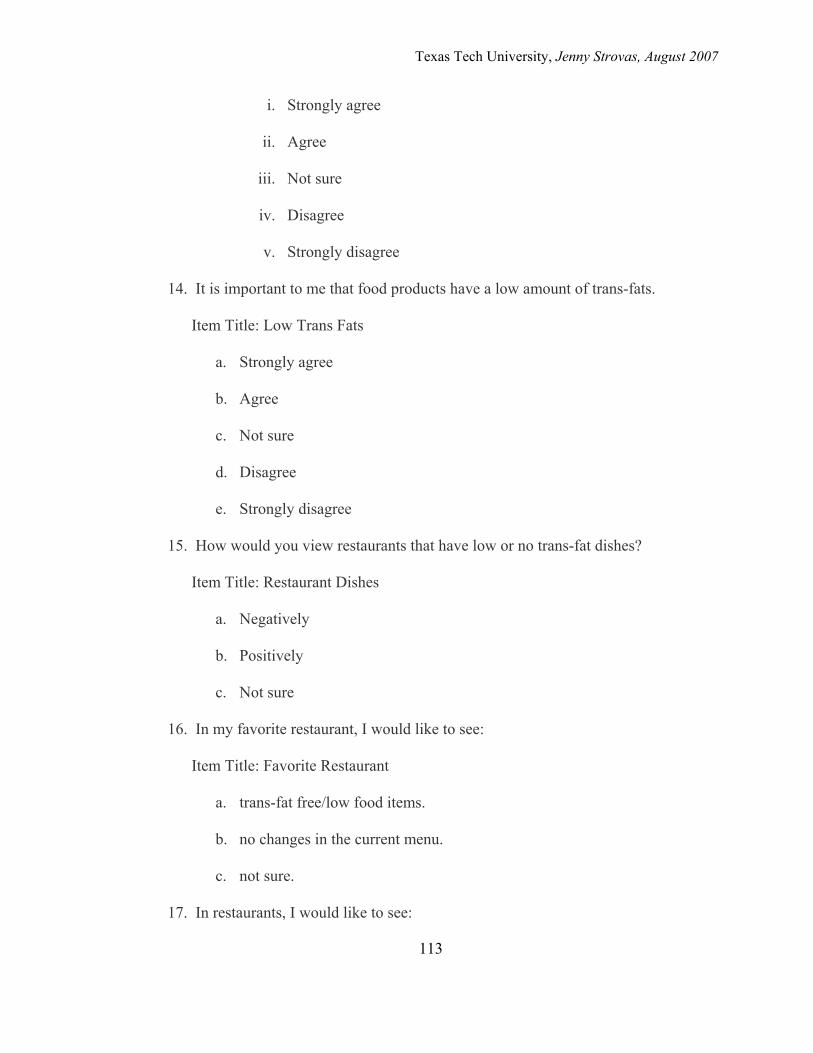
Texas Tech University, Jenny Strovas, August 2007
113
i. Strongly agree
ii. Agree
iii. Not sure
iv. Disagree
v. Strongly disagree
14. It is important to me that food products have a low amount of trans-fats.
Item Title: Low Trans Fats
a. Strongly agree
b. Agree
c. Not sure
d. Disagree
e. Strongly disagree
15. How would you view restaurants that have low or no trans-fat dishes?
Item Title: Restaurant Dishes
a. Negatively
b. Positively
c. Not sure
16. In my favorite restaurant, I would like to see:
Item Title: Favorite Restaurant
a. trans-fat free/low food items.
b. no changes in the current menu.
c. not sure.
17. In restaurants, I would like to see:
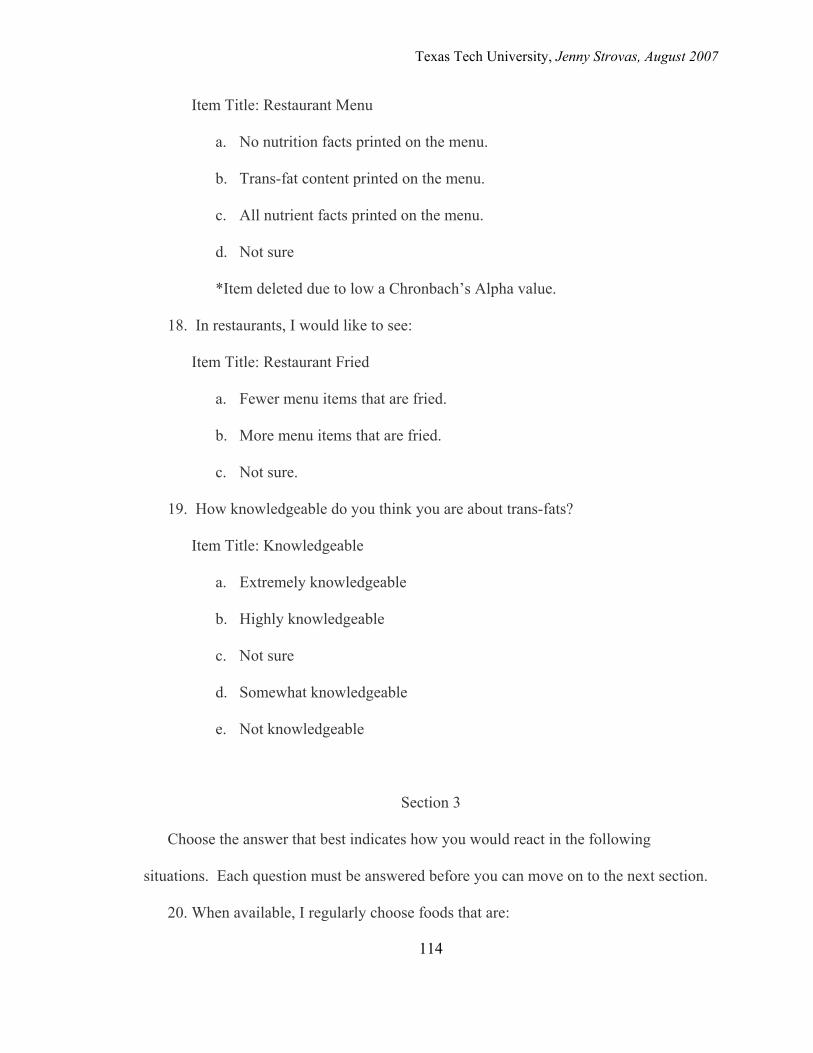
Texas Tech University, Jenny Strovas, August 2007
114
Item Title: Restaurant Menu
a. No nutrition facts printed on the menu.
b. Trans-fat content printed on the menu.
c. All nutrient facts printed on the menu.
d. Not sure
*Item deleted due to low a Chronbach’s Alpha value.
18. In restaurants, I would like to see:
Item Title: Restaurant Fried
a. Fewer menu items that are fried.
b. More menu items that are fried.
c. Not sure.
19. How knowledgeable do you think you are about trans-fats?
Item Title: Knowledgeable
a. Extremely knowledgeable
b. Highly knowledgeable
c. Not sure
d. Somewhat knowledgeable
e. Not knowledgeable
Section 3
Choose the answer that best indicates how you would react in the following
situations. Each question must be answered before you can move on to the next section.
20. When available, I regularly choose foods that are:
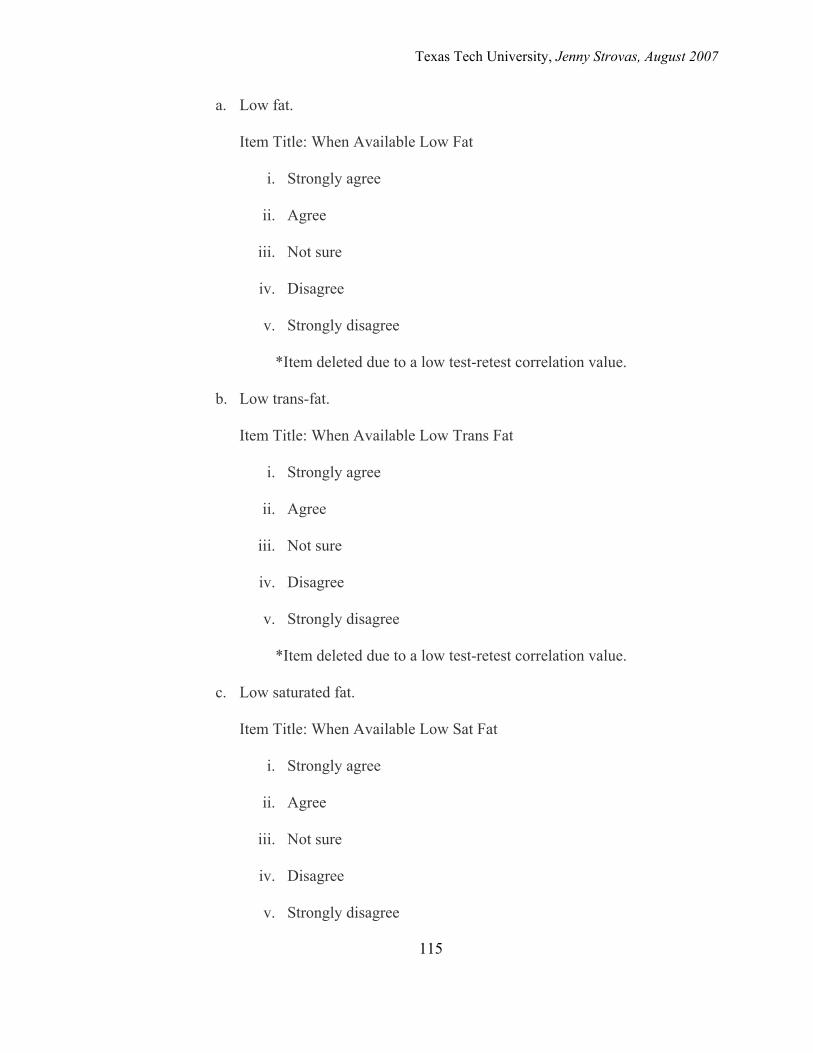
Texas Tech University, Jenny Strovas, August 2007
115
a. Low fat.
Item Title: When Available Low Fat
i. Strongly agree
ii. Agree
iii. Not sure
iv. Disagree
v. Strongly disagree
*Item deleted due to a low test-retest correlation value.
b. Low trans-fat.
Item Title: When Available Low Trans Fat
i. Strongly agree
ii. Agree
iii. Not sure
iv. Disagree
v. Strongly disagree
*Item deleted due to a low test-retest correlation value.
c. Low saturated fat.
Item Title: When Available Low Sat Fat
i. Strongly agree
ii. Agree
iii. Not sure
iv. Disagree
v. Strongly disagree
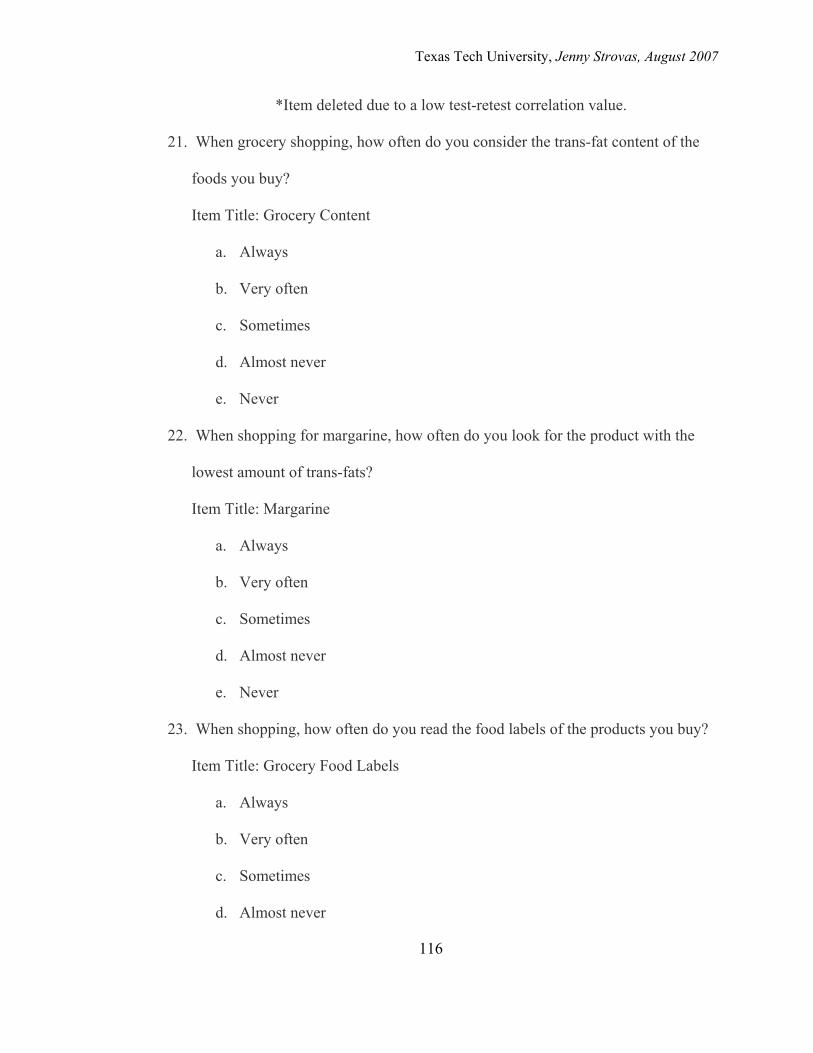
Texas Tech University, Jenny Strovas, August 2007
116
*Item deleted due to a low test-retest correlation value.
21. When grocery shopping, how often do you consider the trans-fat content of the
foods you buy?
Item Title: Grocery Content
a. Always
b. Very often
c. Sometimes
d. Almost never
e. Never
22. When shopping for margarine, how often do you look for the product with the
lowest amount of trans-fats?
Item Title: Margarine
a. Always
b. Very often
c. Sometimes
d. Almost never
e. Never
23. When shopping, how often do you read the food labels of the products you buy?
Item Title: Grocery Food Labels
a. Always
b. Very often
c. Sometimes
d. Almost never
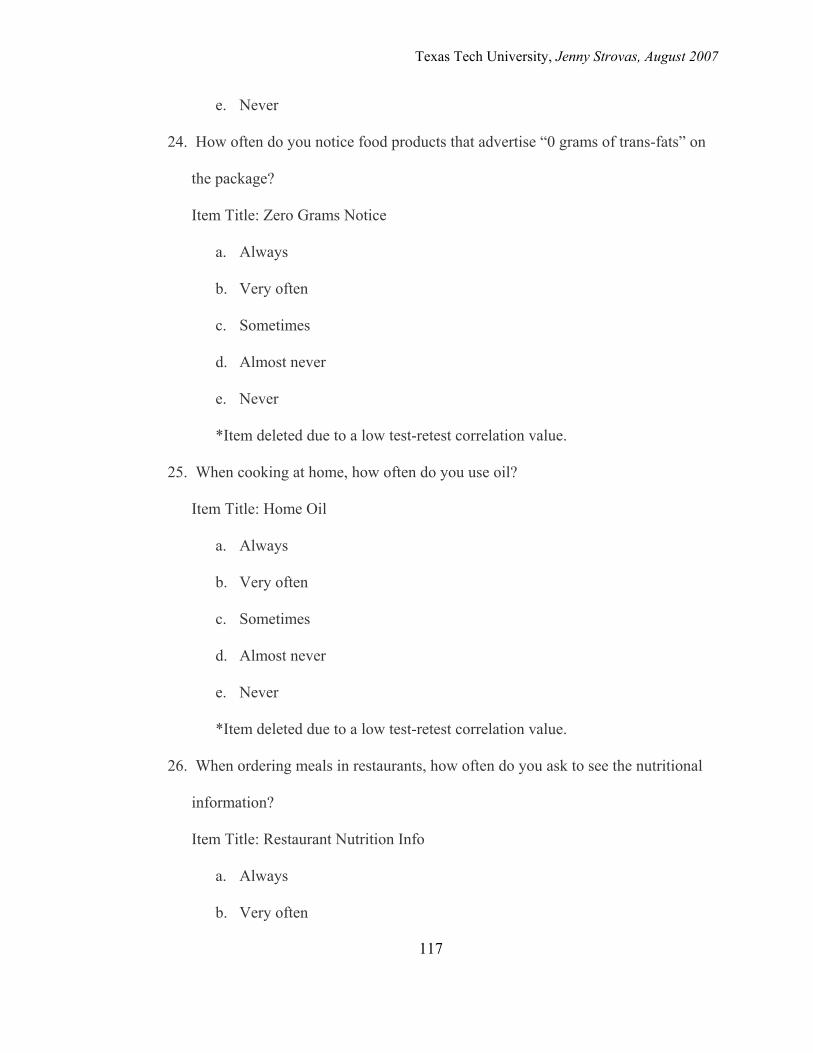
Texas Tech University, Jenny Strovas, August 2007
117
e. Never
24. How often do you notice food products that advertise “0 grams of trans-fats” on
the package?
Item Title: Zero Grams Notice
a. Always
b. Very often
c. Sometimes
d. Almost never
e. Never
*Item deleted due to a low test-retest correlation value.
25. When cooking at home, how often do you use oil?
Item Title: Home Oil
a. Always
b. Very often
c. Sometimes
d. Almost never
e. Never
*Item deleted due to a low test-retest correlation value.
26. When ordering meals in restaurants, how often do you ask to see the nutritional
information?
Item Title: Restaurant Nutrition Info
a. Always
b. Very often
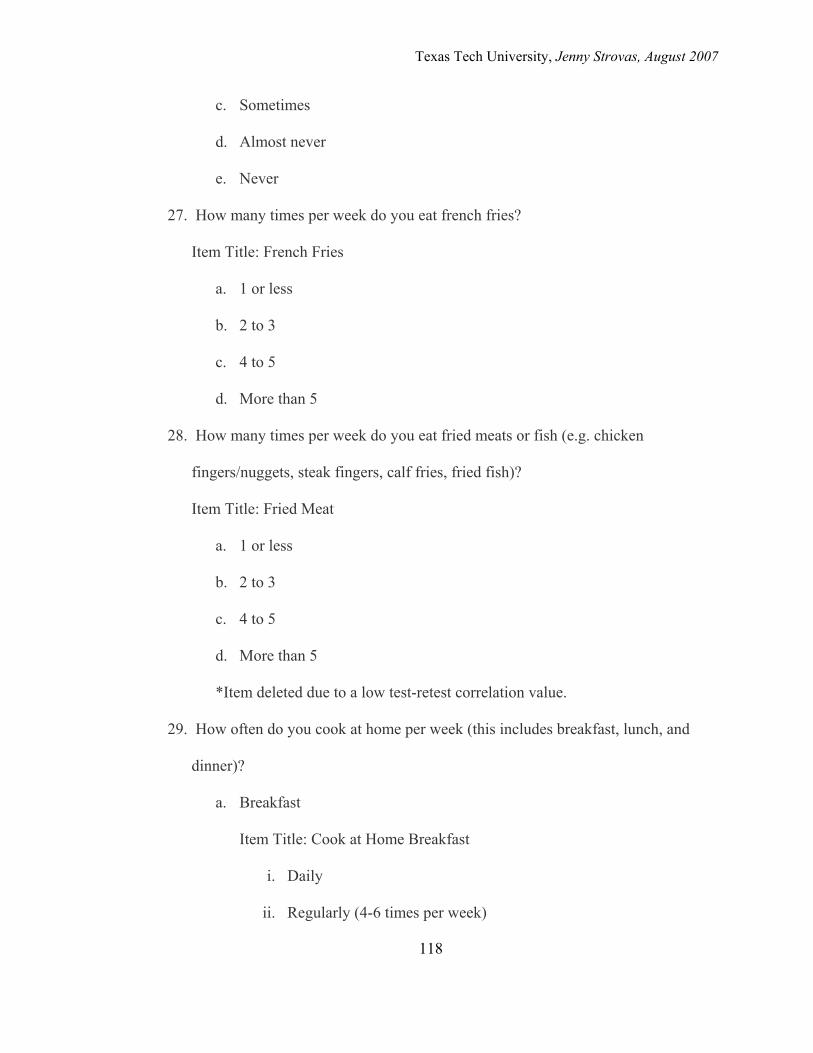
Texas Tech University, Jenny Strovas, August 2007
118
c. Sometimes
d. Almost never
e. Never
27. How many times per week do you eat french fries?
Item Title: French Fries
a. 1 or less
b. 2 to 3
c. 4 to 5
d. More than 5
28. How many times per week do you eat fried meats or fish (e.g. chicken
fingers/nuggets, steak fingers, calf fries, fried fish)?
Item Title: Fried Meat
a. 1 or less
b. 2 to 3
c. 4 to 5
d. More than 5
*Item deleted due to a low test-retest correlation value.
29. How often do you cook at home per week (this includes breakfast, lunch, and
dinner)?
a. Breakfast
Item Title: Cook at Home Breakfast
i. Daily
ii. Regularly (4-6 times per week)
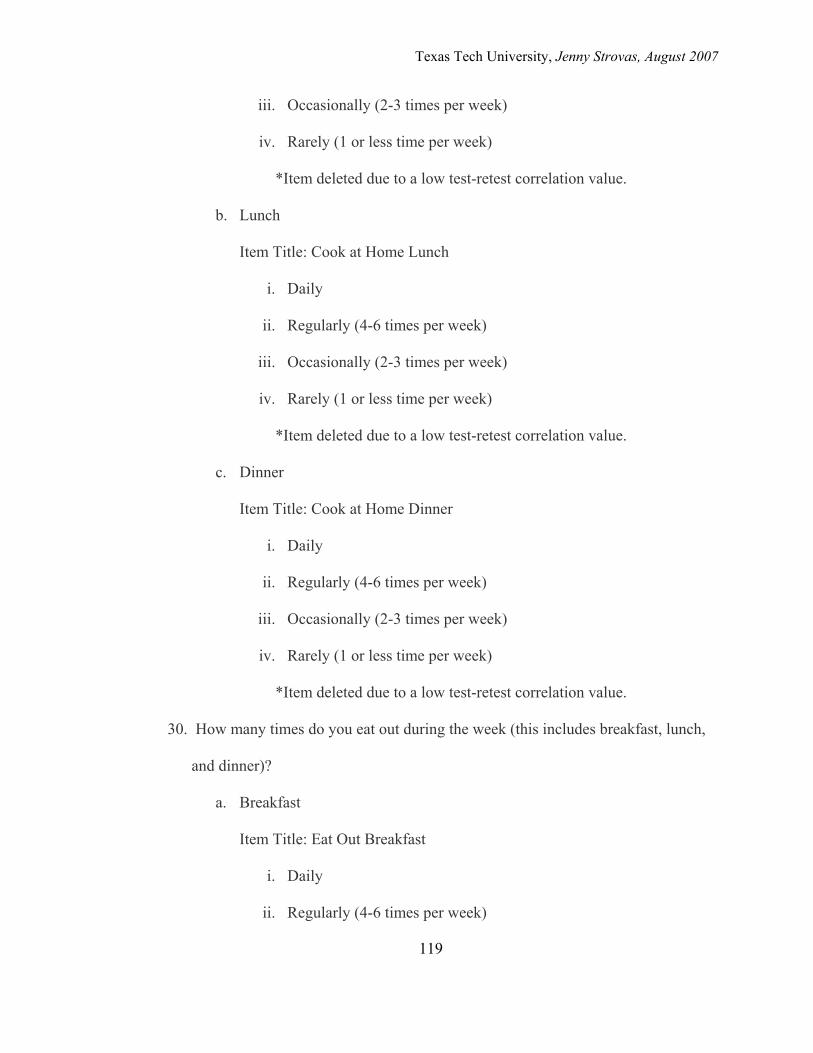
Texas Tech University, Jenny Strovas, August 2007
119
iii. Occasionally (2-3 times per week)
iv. Rarely (1 or less time per week)
*Item deleted due to a low test-retest correlation value.
b. Lunch
Item Title: Cook at Home Lunch
i. Daily
ii. Regularly (4-6 times per week)
iii. Occasionally (2-3 times per week)
iv. Rarely (1 or less time per week)
*Item deleted due to a low test-retest correlation value.
c. Dinner
Item Title: Cook at Home Dinner
i. Daily
ii. Regularly (4-6 times per week)
iii. Occasionally (2-3 times per week)
iv. Rarely (1 or less time per week)
*Item deleted due to a low test-retest correlation value.
30. How many times do you eat out during the week (this includes breakfast, lunch,
and dinner)?
a. Breakfast
Item Title: Eat Out Breakfast
i. Daily
ii. Regularly (4-6 times per week)

Texas Tech University, Jenny Strovas, August 2007
120
iii. Occasionally (2-3 times per week)
iv. Rarely (1 or less time per week)
*Item deleted due to a low test-retest correlation value.
b. Lunch
Item Title: Eat Out Lunch
i. Daily
ii. Regularly (4-6 times per week)
iii. Occasionally (2-3 times per week)
iv. Rarely (1 or less time per week)
*Item deleted due to a low test-retest correlation value.
c. Dinner
Item Title: Eat Out Dinner
i. Daily
ii. Regularly (4-6 times per week)
iii. Occasionally (2-3 times per week)
iv. Rarely (1 or less time per week)
31. Are you more likely to buy a product that advertises “0 grams of trans-fat” on the
package?
Item Title: Zero Grams Buy
a. Yes
b. No
c. Not sure

Texas Tech University, Jenny Strovas, August 2007
121
32. What type of cooking method do you use most often when preparing meals at
home?
Item Title: Cooking Method
a. Bake
b. Fry
c. Boil
d. Grill
e. Braise
f. Steam
Section 4
Choose the answer that best indicates how certain you would feel in the following
situations. Each question must be answered before you can move on to the following
section.
33. How certain are you about you ability to buy foods that are low in trans-fats?
Item Title: Buy Foods
a. Very sure
b. Somewhat sure
c. Don’t know
d. Somewhat unsure
e. Unsure
34. How certain are you that you could regularly prepare low trans-fat meals at
home?
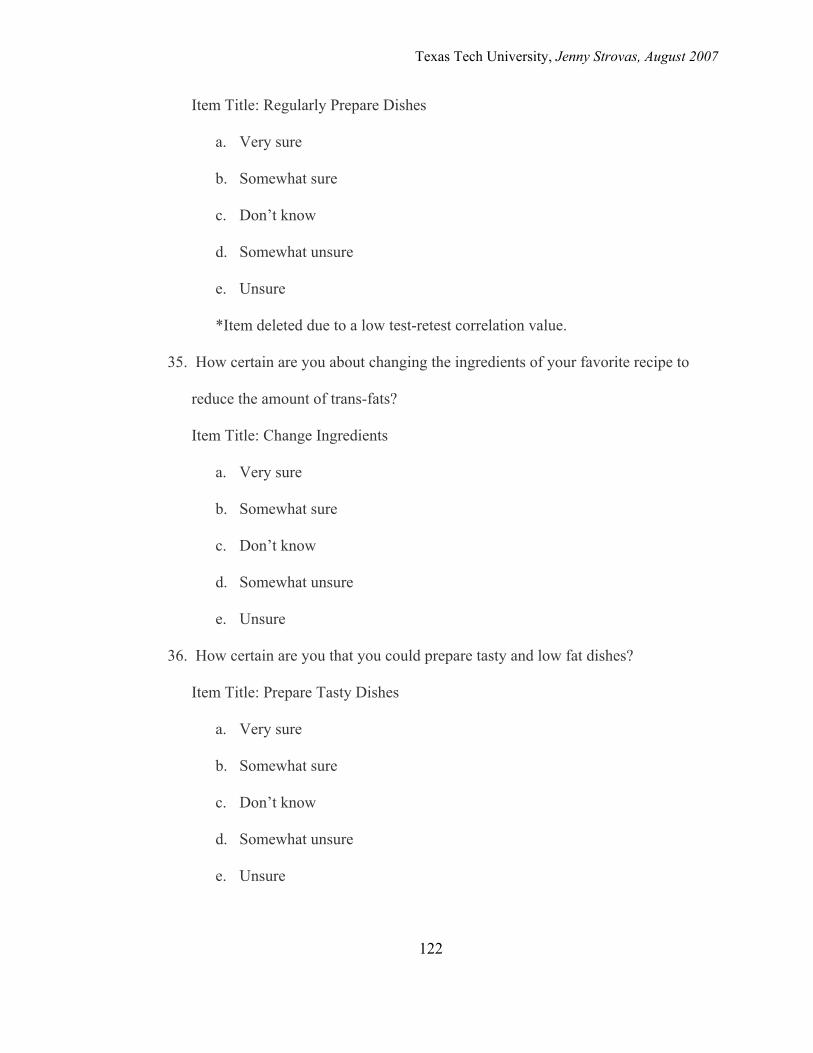
Texas Tech University, Jenny Strovas, August 2007
122
Item Title: Regularly Prepare Dishes
a. Very sure
b. Somewhat sure
c. Don’t know
d. Somewhat unsure
e. Unsure
*Item deleted due to a low test-retest correlation value.
35. How certain are you about changing the ingredients of your favorite recipe to
reduce the amount of trans-fats?
Item Title: Change Ingredients
a. Very sure
b. Somewhat sure
c. Don’t know
d. Somewhat unsure
e. Unsure
36. How certain are you that you could prepare tasty and low fat dishes?
Item Title: Prepare Tasty Dishes
a. Very sure
b. Somewhat sure
c. Don’t know
d. Somewhat unsure
e. Unsure
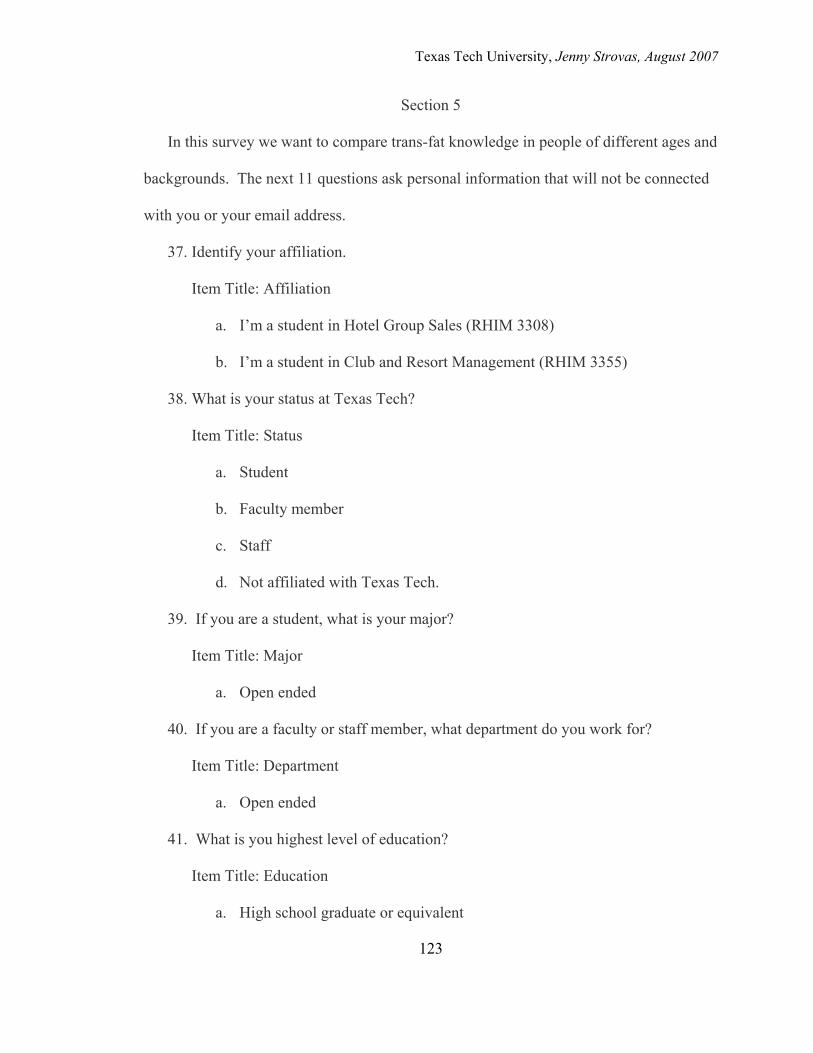
Texas Tech University, Jenny Strovas, August 2007
123
Section 5
In this survey we want to compare trans-fat knowledge in people of different ages and
backgrounds. The next 11 questions ask personal information that will not be connected
with you or your email address.
37. Identify your affiliation.
Item Title: Affiliation
a. I’m a student in Hotel Group Sales (RHIM 3308)
b. I’m a student in Club and Resort Management (RHIM 3355)
38. What is your status at Texas Tech?
Item Title: Status
a. Student
b. Faculty member
c. Staff
d. Not affiliated with Texas Tech.
39. If you are a student, what is your major?
Item Title: Major
a. Open ended
40. If you are a faculty or staff member, what department do you work for?
Item Title: Department
a. Open ended
41. What is you highest level of education?
Item Title: Education
a. High school graduate or equivalent
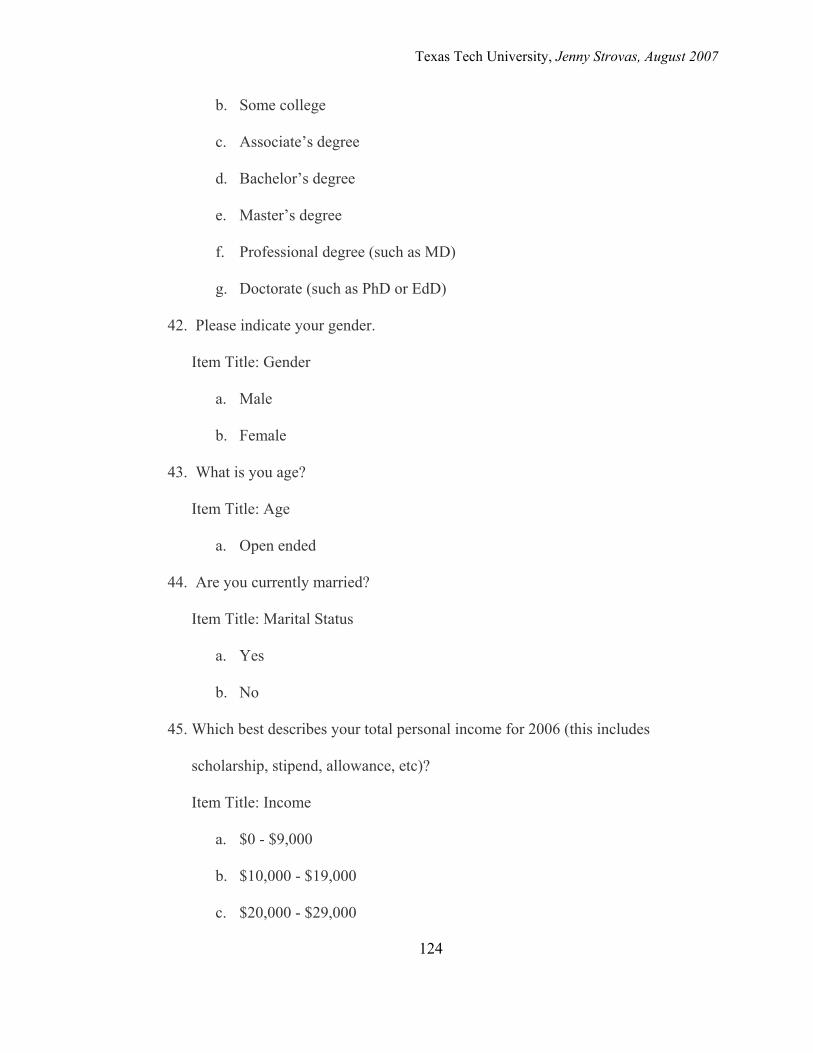
Texas Tech University, Jenny Strovas, August 2007
124
b. Some college
c. Associate’s degree
d. Bachelor’s degree
e. Master’s degree
f. Professional degree (such as MD)
g. Doctorate (such as PhD or EdD)
42. Please indicate your gender.
Item Title: Gender
a. Male
b. Female
43. What is you age?
Item Title: Age
a. Open ended
44. Are you currently married?
Item Title: Marital Status
a. Yes
b. No
45. Which best describes your total personal income for 2006 (this includes
scholarship, stipend, allowance, etc)?
Item Title: Income
a. $0 - $9,000
b. $10,000 - $19,000
c. $20,000 - $29,000
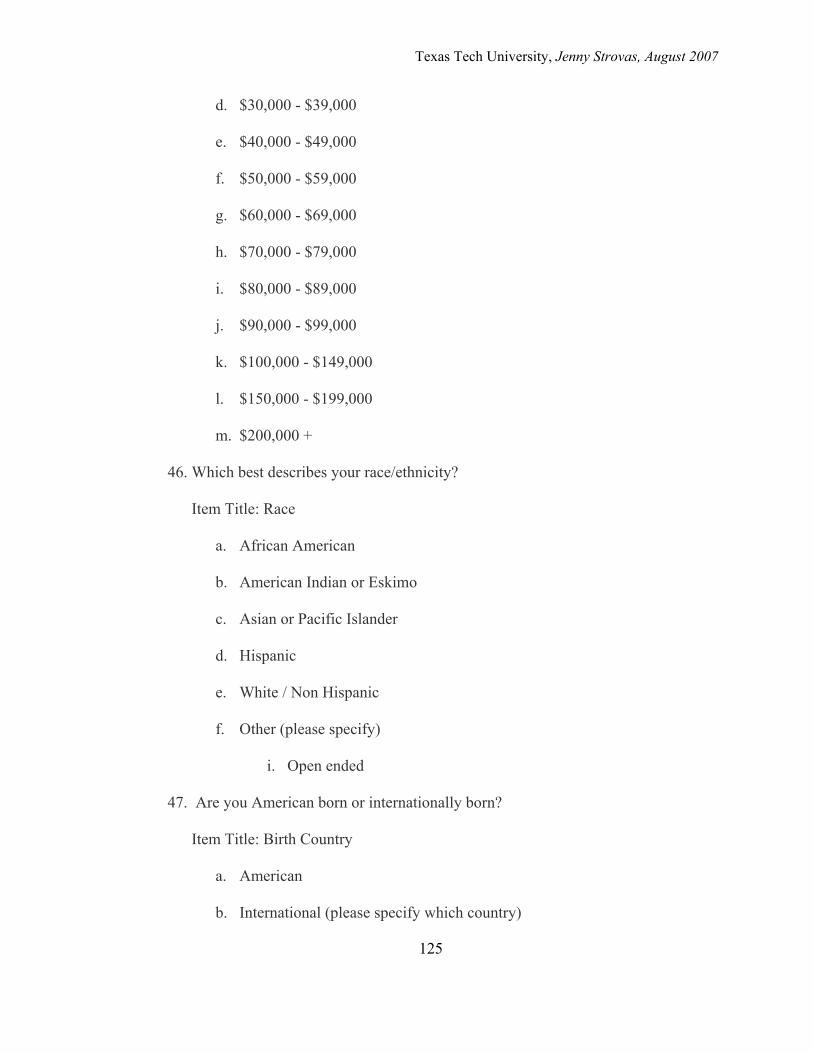
Texas Tech University, Jenny Strovas, August 2007
125
d. $30,000 - $39,000
e. $40,000 - $49,000
f. $50,000 - $59,000
g. $60,000 - $69,000
h. $70,000 - $79,000
i. $80,000 - $89,000
j. $90,000 - $99,000
k. $100,000 - $149,000
l. $150,000 - $199,000
m. $200,000 +
46. Which best describes your race/ethnicity?
Item Title: Race
a. African American
b. American Indian or Eskimo
c. Asian or Pacific Islander
d. Hispanic
e. White / Non Hispanic
f. Other (please specify)
i. Open ended
47. Are you American born or internationally born?
Item Title: Birth Country
a. American
b. International (please specify which country)
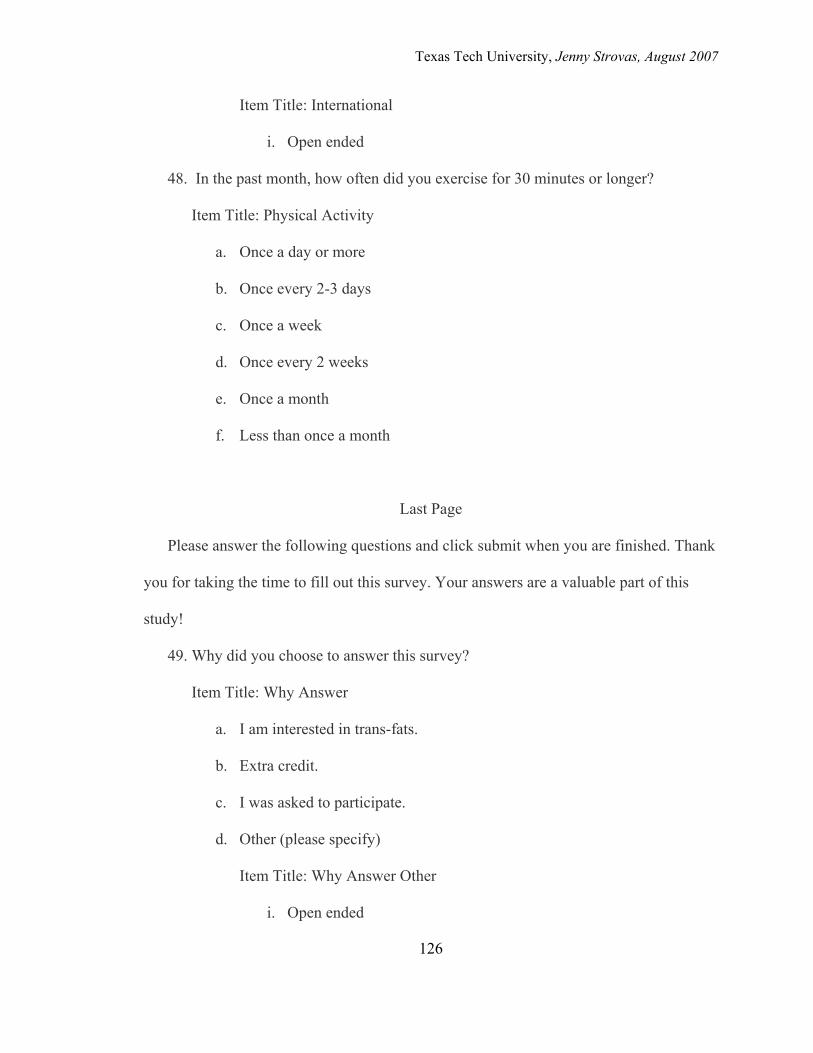
Texas Tech University, Jenny Strovas, August 2007
126
Item Title: International
i. Open ended
48. In the past month, how often did you exercise for 30 minutes or longer?
Item Title: Physical Activity
a. Once a day or more
b. Once every 2-3 days
c. Once a week
d. Once every 2 weeks
e. Once a month
f. Less than once a month
Last Page
Please answer the following questions and click submit when you are finished. Thank
you for taking the time to fill out this survey. Your answers are a valuable part of this
study!
49. Why did you choose to answer this survey?
Item Title: Why Answer
a. I am interested in trans-fats.
b. Extra credit.
c. I was asked to participate.
d. Other (please specify)
Item Title: Why Answer Other
i. Open ended

Texas Tech University, Jenny Strovas, August 2007
127
50. Would you be interested in learning more about trans-fats?
Item Title: Learning More
a. Yes
b. No
c. Maybe
51. If you answered yes or maybe to the previous question, what educational method
would you prefer?
Item Title: Learning Method
a. Online
b. Community program
c. Course on the Tech campus
d. Other (please specify)
Item Title: Learning Method Other
i. Open ended
52. Overall, I found this survey to be:
Item Title: Readable
a. easy to read.
b. hard to read.
c. other (please specify).
i. Open ended
53. Overall, I found the length of the survey to be:
Item Title: Survey Length
a. too short.
Texas Tech University, Jenny Strovas, August 2007
128
b. an appropriate length.
c. too long.
d. other (please specify).
54. On the web, I was able to access this survey:
Item Title: Accessibility
a. with ease.
b. with difficulty.
c. other (please specify).
Texas Tech University, Jenny Strovas, August 2007
129
APPENDIX D
FINAL TRANS-FATTY ACID SURVEY
Introduction
This survey consists of 41 questions and will take approximately 10 minutes to
complete. By participating in this survey, you will be contributing to the continuing
research of trans-fats and a better understanding of what people know about them.
1. Please enter your email address. (This information is needed to contact incentive
prize winners and to identify if a single person took the survey twice. It will not
be released to the public or be used in our research.)
a. Open ended
Section 1
Please complete each question by clicking the bubble next to the answer.
2. What are the major dietary sources of trans-fats? (Check all that apply.)
a. Fast foods
b. Vegetables
c. Margarine
d. Fruits
e. Packaged snacks
f. Bakery products
g. Meats
3. Which statement would you consider to be true?
a. Pork chops have more trans-fat than chicken breasts.
Texas Tech University, Jenny Strovas, August 2007
130
b. Fried fish fillets have more trans-fat than grilled fish fillets.
c. Avocados have more trans-fat than coconuts.
4. Trans-fats are a well known risk factor for:
a. cancer.
b. obesity.
c. diabetes.
d. heart disease.
5. The FDA requires trans-fat amounts to be listed:
a. in the cooking directions.
b. at the point of purchase.
c. on the food labels.
d. on the front of the package.
6. What properties do trans-fats give to foods? (Check all that apply.)
a. Extended shelf life
b. Enhanced color
c. Flavor maintenance
d. Favorable texture
e. Lower calories
7. What is the current trend of trans-fat content in food products?
a. They have greater amounts of trans-fat than in 2005.
b. They have less amounts of trans-fat than in 2005.
c. They have the same amount of trans-fat as in 2005.
8. Which of the following animal product has the greatest amount of trans-fat?
Texas Tech University, Jenny Strovas, August 2007
131
a. Beef
b. Chicken
c. Turkey
d. Pork
9. Which of the following ingredients indicates that there are trans-fats in a food
products?
a. Monosodium glutamate
b. Partially hydrogenated oil
c. High fructose corn syrup
d. Enriched wheat flour
10. Which of the following fats/oils contains a significant amount of trans-fat?
a. Coconut oil
b. Lard
c. Peanut oil
d. Vegetable shortening
Section 2
Choose the answer that best indicates how you feel about the following statements.
11. For me, trans-fats in food products are:
a. harmful.
i. Strongly agree
ii. Agree
iii. Not sure
iv. Disagree
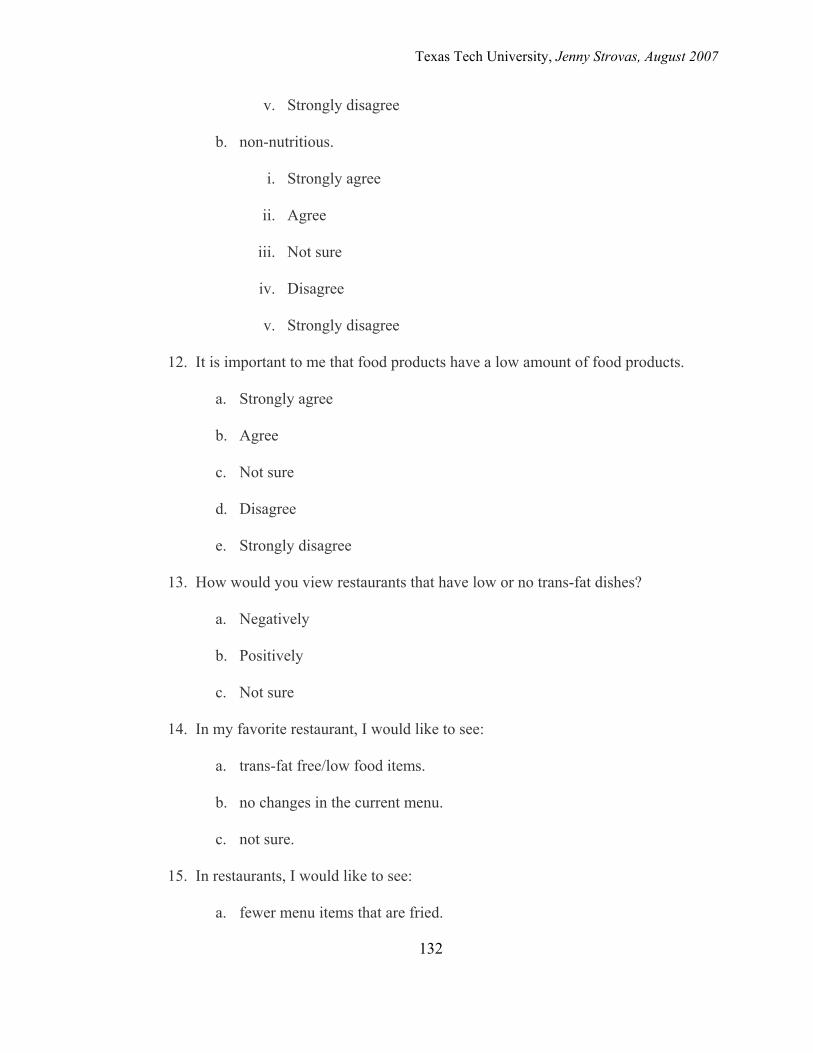
Texas Tech University, Jenny Strovas, August 2007
132
v. Strongly disagree
b. non-nutritious.
i. Strongly agree
ii. Agree
iii. Not sure
iv. Disagree
v. Strongly disagree
12. It is important to me that food products have a low amount of food products.
a. Strongly agree
b. Agree
c. Not sure
d. Disagree
e. Strongly disagree
13. How would you view restaurants that have low or no trans-fat dishes?
a. Negatively
b. Positively
c. Not sure
14. In my favorite restaurant, I would like to see:
a. trans-fat free/low food items.
b. no changes in the current menu.
c. not sure.
15. In restaurants, I would like to see:
a. fewer menu items that are fried.
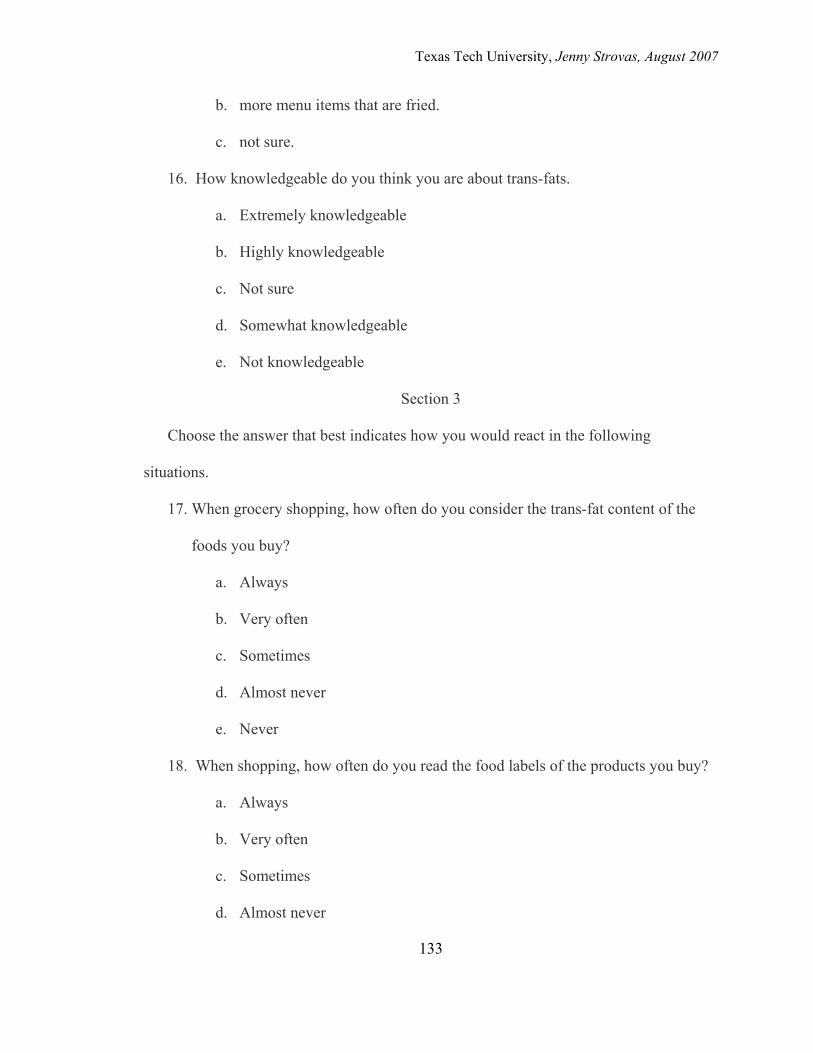
Texas Tech University, Jenny Strovas, August 2007
133
b. more menu items that are fried.
c. not sure.
16. How knowledgeable do you think you are about trans-fats.
a. Extremely knowledgeable
b. Highly knowledgeable
c. Not sure
d. Somewhat knowledgeable
e. Not knowledgeable
Section 3
Choose the answer that best indicates how you would react in the following
situations.
17. When grocery shopping, how often do you consider the trans-fat content of the
foods you buy?
a. Always
b. Very often
c. Sometimes
d. Almost never
e. Never
18. When shopping, how often do you read the food labels of the products you buy?
a. Always
b. Very often
c. Sometimes
d. Almost never
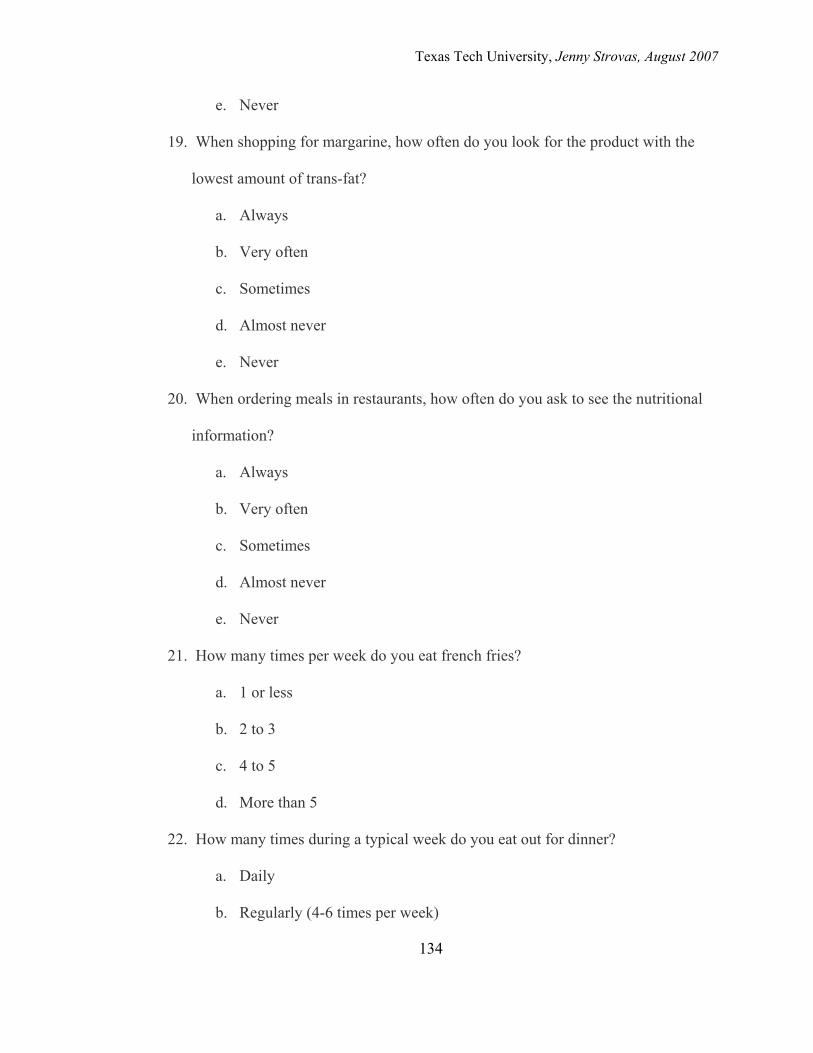
Texas Tech University, Jenny Strovas, August 2007
134
e. Never
19. When shopping for margarine, how often do you look for the product with the
lowest amount of trans-fat?
a. Always
b. Very often
c. Sometimes
d. Almost never
e. Never
20. When ordering meals in restaurants, how often do you ask to see the nutritional
information?
a. Always
b. Very often
c. Sometimes
d. Almost never
e. Never
21. How many times per week do you eat french fries?
a. 1 or less
b. 2 to 3
c. 4 to 5
d. More than 5
22. How many times during a typical week do you eat out for dinner?
a. Daily
b. Regularly (4-6 times per week)
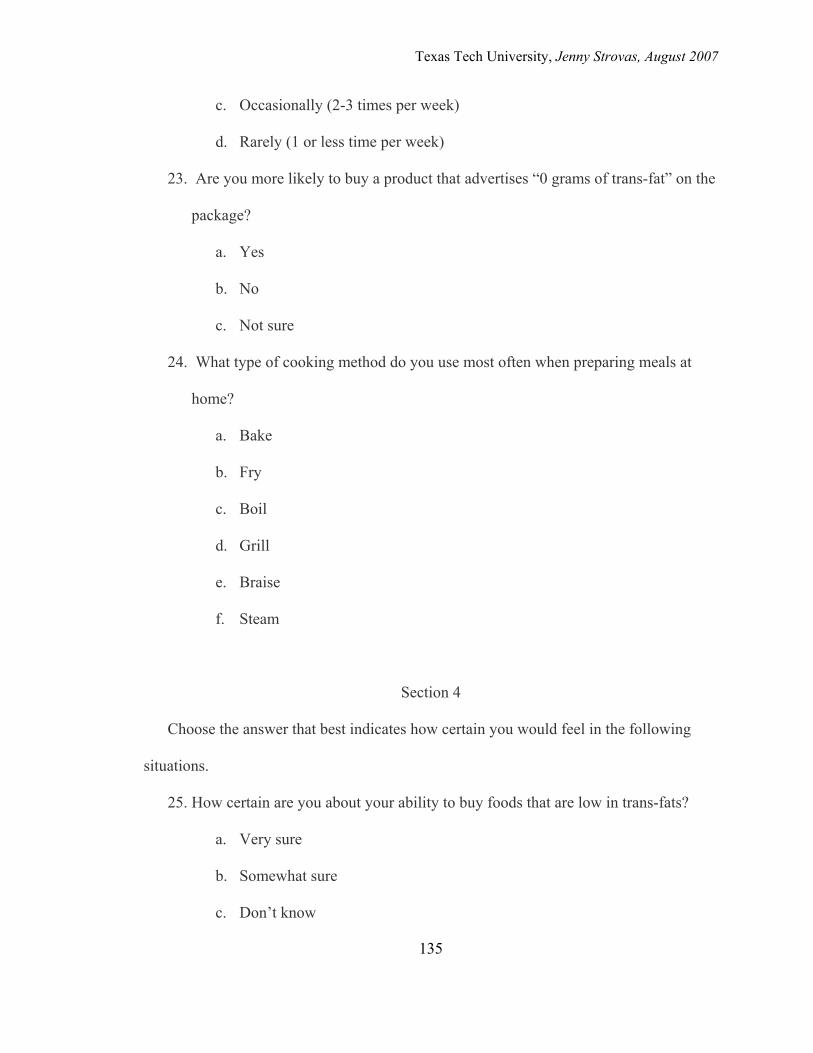
Texas Tech University, Jenny Strovas, August 2007
135
c. Occasionally (2-3 times per week)
d. Rarely (1 or less time per week)
23. Are you more likely to buy a product that advertises “0 grams of trans-fat” on the
package?
a. Yes
b. No
c. Not sure
24. What type of cooking method do you use most often when preparing meals at
home?
a. Bake
b. Fry
c. Boil
d. Grill
e. Braise
f. Steam
Section 4
Choose the answer that best indicates how certain you would feel in the following
situations.
25. How certain are you about your ability to buy foods that are low in trans-fats?
a. Very sure
b. Somewhat sure
c. Don’t know
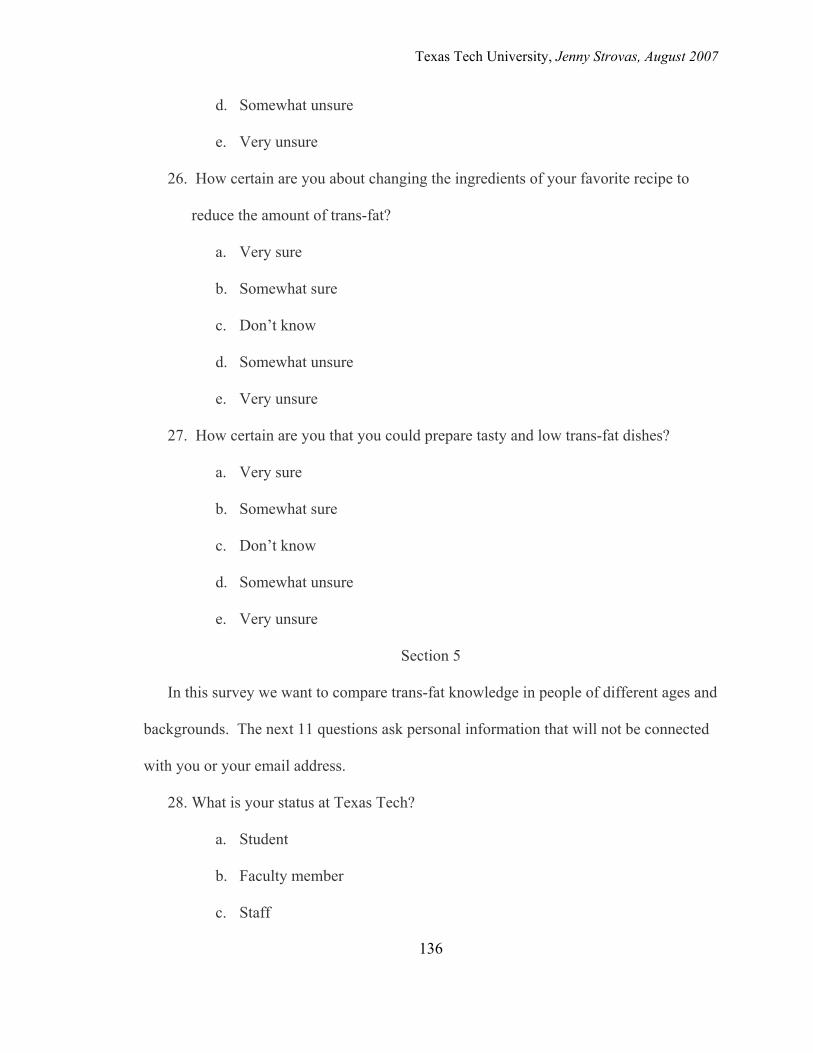
Texas Tech University, Jenny Strovas, August 2007
136
d. Somewhat unsure
e. Very unsure
26. How certain are you about changing the ingredients of your favorite recipe to
reduce the amount of trans-fat?
a. Very sure
b. Somewhat sure
c. Don’t know
d. Somewhat unsure
e. Very unsure
27. How certain are you that you could prepare tasty and low trans-fat dishes?
a. Very sure
b. Somewhat sure
c. Don’t know
d. Somewhat unsure
e. Very unsure
Section 5
In this survey we want to compare trans-fat knowledge in people of different ages and
backgrounds. The next 11 questions ask personal information that will not be connected
with you or your email address.
28. What is your status at Texas Tech?
a. Student
b. Faculty member
c. Staff
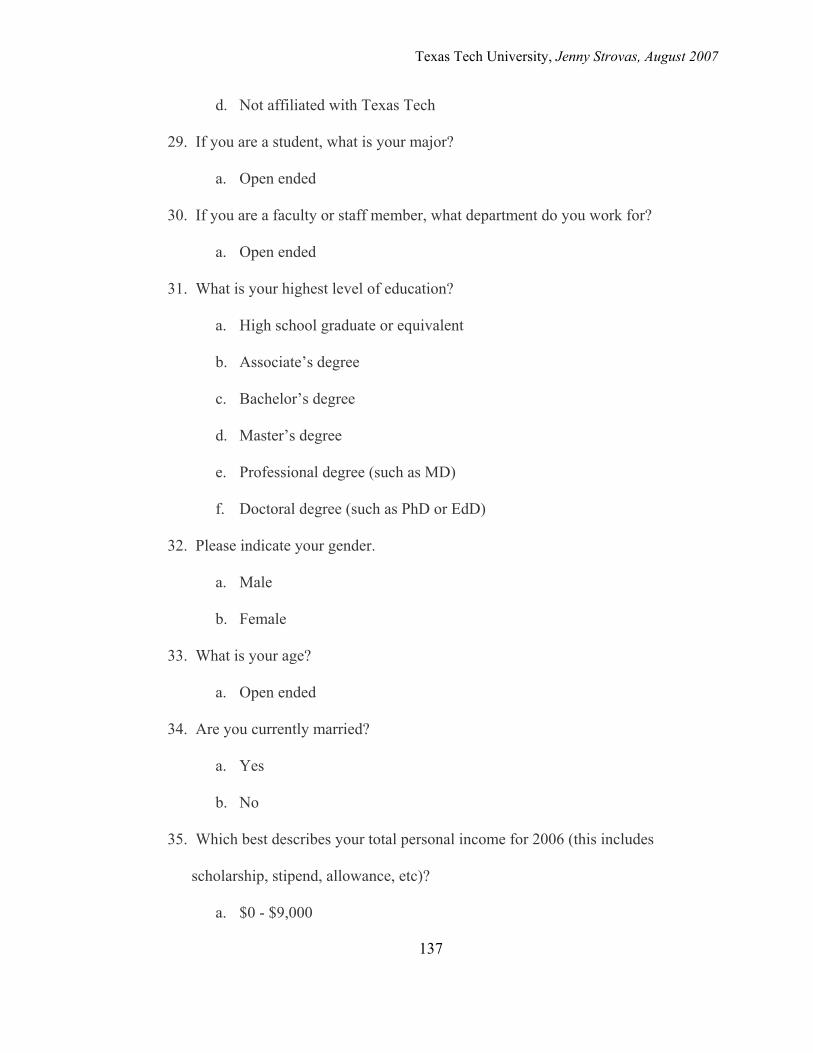
Texas Tech University, Jenny Strovas, August 2007
137
d. Not affiliated with Texas Tech
29. If you are a student, what is your major?
a. Open ended
30. If you are a faculty or staff member, what department do you work for?
a. Open ended
31. What is your highest level of education?
a. High school graduate or equivalent
b. Associate’s degree
c. Bachelor’s degree
d. Master’s degree
e. Professional degree (such as MD)
f. Doctoral degree (such as PhD or EdD)
32. Please indicate your gender.
a. Male
b. Female
33. What is your age?
a. Open ended
34. Are you currently married?
a. Yes
b. No
35. Which best describes your total personal income for 2006 (this includes
scholarship, stipend, allowance, etc)?
a. $0 - $9,000
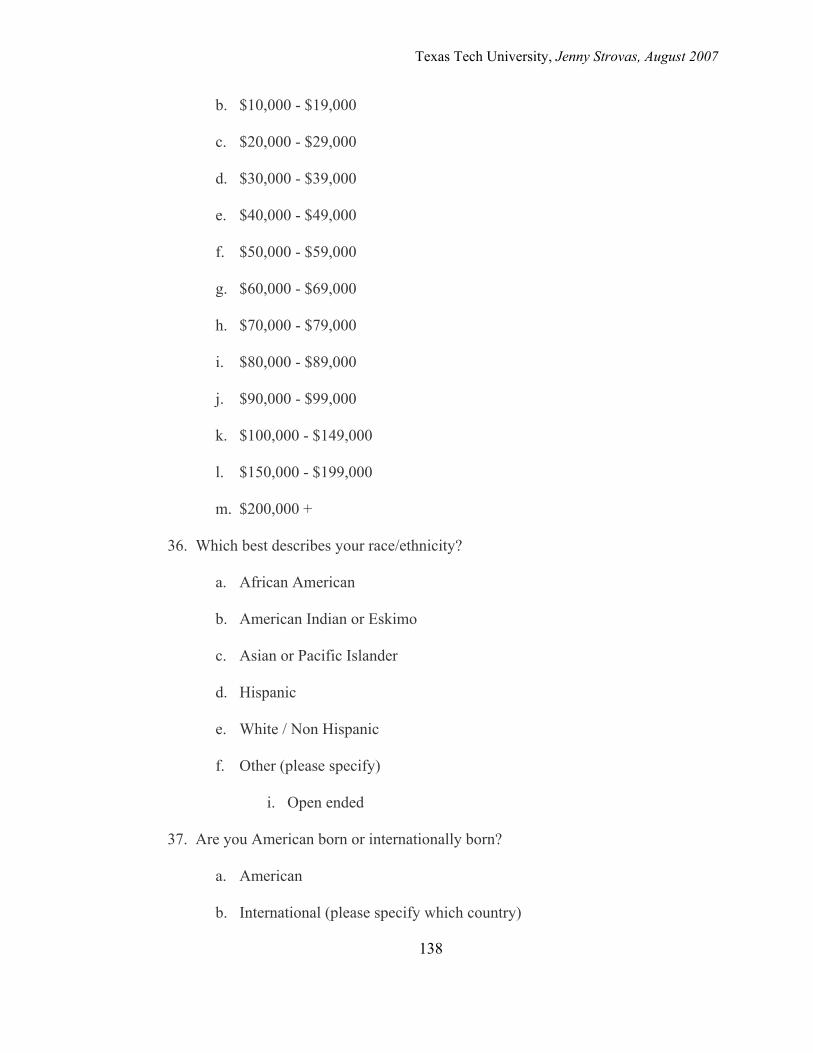
Texas Tech University, Jenny Strovas, August 2007
138
b. $10,000 - $19,000
c. $20,000 - $29,000
d. $30,000 - $39,000
e. $40,000 - $49,000
f. $50,000 - $59,000
g. $60,000 - $69,000
h. $70,000 - $79,000
i. $80,000 - $89,000
j. $90,000 - $99,000
k. $100,000 - $149,000
l. $150,000 - $199,000
m. $200,000 +
36. Which best describes your race/ethnicity?
a. African American
b. American Indian or Eskimo
c. Asian or Pacific Islander
d. Hispanic
e. White / Non Hispanic
f. Other (please specify)
i. Open ended
37. Are you American born or internationally born?
a. American
b. International (please specify which country)
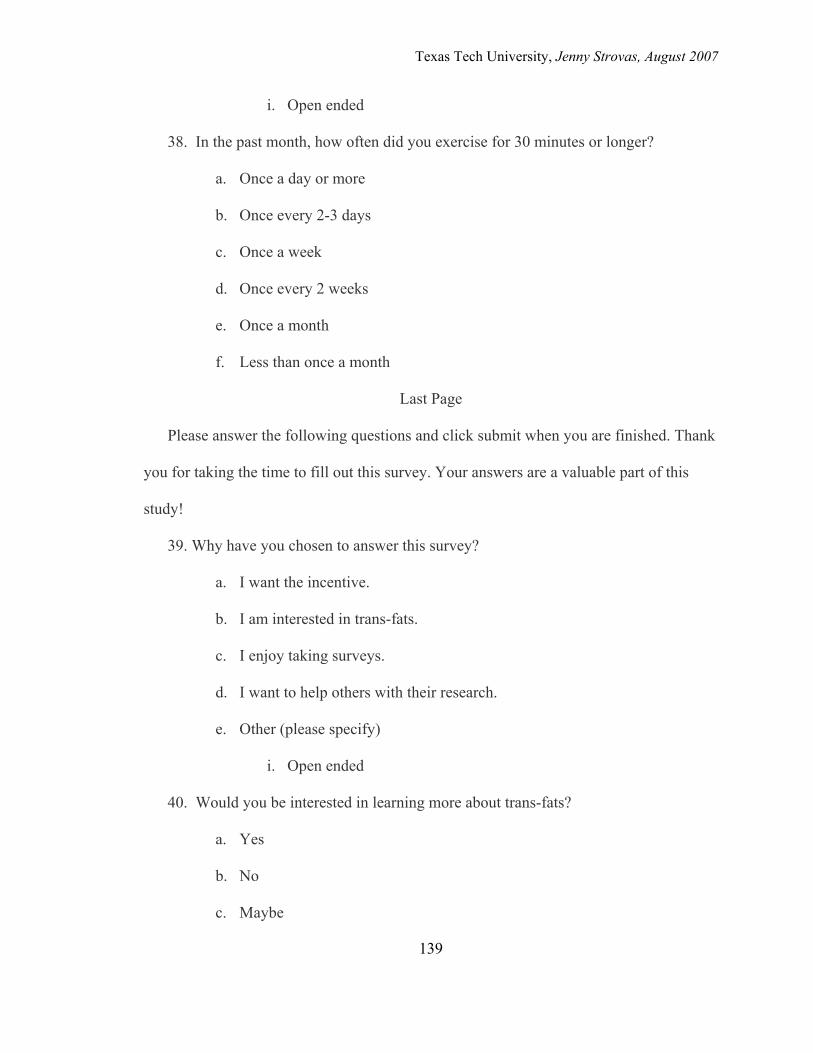
Texas Tech University, Jenny Strovas, August 2007
139
i. Open ended
38. In the past month, how often did you exercise for 30 minutes or longer?
a. Once a day or more
b. Once every 2-3 days
c. Once a week
d. Once every 2 weeks
e. Once a month
f. Less than once a month
Last Page
Please answer the following questions and click submit when you are finished. Thank
you for taking the time to fill out this survey. Your answers are a valuable part of this
study!
39. Why have you chosen to answer this survey?
a. I want the incentive.
b. I am interested in trans-fats.
c. I enjoy taking surveys.
d. I want to help others with their research.
e. Other (please specify)
i. Open ended
40. Would you be interested in learning more about trans-fats?
a. Yes
b. No
c. Maybe
Texas Tech University, Jenny Strovas, August 2007
140
41. If you answered yes or maybe to the previous question, what educational method
would you prefer?
a. Online
b. Community program
c. Course on the Tech campus
d. Other (please specify)
i. Open ended
Texas Tech University, Jenny Strovas, August 2007
PERMISSION TO COPY
In presenting this thesis in partial fulfillment of the requirements for a master’s
degree at Texas Tech University or Texas Tech University Health Sciences Center, I
agree that the Library and my major department shall make it freely available for research
purposes. Permission to copy this thesis for scholarly purposes may be granted by the
Director of the Library or my major professor. It is understood that any copying or
publication of this thesis for financial gain shall not be allowed without my further
written permission and that any user may be liable for copyright infringement.
Agree (Permission is granted.)
___Jenny D’Laine Strovas________________________ ____7/21/07_______
Student Signature Date
Disagree (Permission is not granted.)
_______________________________________________ _________________
Student Signature Date