assessment of differences in physical ...ufdcimages.uflib.ufl.edu/uf/e0/02/22/57/00001/brinn_l.pdf1...
TRANSCRIPT

1
ASSESSMENT OF DIFFERENCES IN PHYSICAL PROPERTIES OF SAND ASSOCIATED WITH BEACH NOURISHMENT AND EFFECTS ON LOGGERHEAD SEA TURTLE
(Caretta caretta) NESTING IN NORTHWEST FLORIDA
By
LORI ANN BRINN
A THESIS PRESENTED TO THE GRADUATE SCHOOL OF THE UNIVERSITY OF FLORIDA IN PARTIAL FULFILLMENT
OF THE REQUIREMENTS FOR THE DEGREE OF MASTER OF SCIENCE
UNIVERSITY OF FLORIDA
2008

2
© 2008 Lori Ann Brinn

3
To my wonderful and supportive husband Burnie

4
ACKNOWLEDGMENTS
This work was supported by a grant from the U.S. Fish and Wildlife Service. Much
gratitude is owed to Dr. Ray Carthy for being an excellent mentor and to committee members Dr.
Jim Jawitz and Dr. Bob Dean for their advice and support. The following individuals played a
significant role in the design and execution of this study, and without their help, this research
would not have been possible: Lorna Patrick, Riley Hoggard, Dr. Willie Harris, Dr. Blair
Witherington, Dr. David Bloomquist, Miguel Figueroa, Glenn Moll, Bob Whitfield, Sam Jones,
Donna Roberts, Joan Hill, Caprice McRae, Mario Mota, Gabby Hrycyshyn, Celeste Warner,
Scott Warner, Meg Lamont, and Andrew Sterner. Research assistants Lindsey Thurman and
Burnie Brinn deserve special recognition for their hard work and dedication. Last but not least, I
thank my parents Glenn and Tina Moll and my sister Carla for always believing in me and
encouraging me to follow my dreams.

5
TABLE OF CONTENTS page
ACKNOWLEDGMENTS ...............................................................................................................4
LIST OF TABLES ...........................................................................................................................7
LIST OF FIGURES .........................................................................................................................9
ABSTRACT ...................................................................................................................................10
CHAPTER
1 INTRODUCTION ..................................................................................................................12
2 LOOKING AT SAND FROM A SEA TURTLE’S PERSPECTIVE: DEVELOPMENT OF A NOVEL SHEAR VANE DEVICE TO COMPARE SHEAR RESISTANCE OF SAND ON NATURAL AND NOURISHED BEACHES......................................................16
Introduction .............................................................................................................................16 Methods ..................................................................................................................................18
Selection of Sampling Sites .............................................................................................18 Compaction and Shear Resistance ...................................................................................18
Results.....................................................................................................................................21 Discussion ...............................................................................................................................22
3 ASSESSMENT OF DIFFERENCES IN PHYSICAL PROPERTIES OF SAND ON NATURAL AND NOURISHED BEACHES IN NORTHWEST FLORIDA .......................33
Introduction .............................................................................................................................33 Methods ..................................................................................................................................34
Selection of Sampling Sites .............................................................................................34 Compaction and Shear Resistance ...................................................................................35 Bulk Density and Water Content .....................................................................................36 Grain Size Distribution and Soil Color ...........................................................................37 Soil Data Analysis ...........................................................................................................39
Results and Discussion ...........................................................................................................39 Compaction and Shear Resistance ...................................................................................40 Bulk Density and Water Content .....................................................................................41 Grain Size Distribution and Soil Color ...........................................................................41 Discriminant Analysis .....................................................................................................42
4 EFFECTS OF DIFFERENCES IN PHYSICAL PROPERTIES OF SAND ON LOGGERHEAD (Caretta caretta) SEA TURTLE NESTING IN NORTHWEST FLORIDA ...............................................................................................................................53

6
Introduction .............................................................................................................................53 Methods ..................................................................................................................................57 Results and Discussion ...........................................................................................................58
5 DISCUSSION AND CONCLUSIONS ..................................................................................62
LIST OF REFERENCES ...............................................................................................................64
BIOGRAPHICAL SKETCH .........................................................................................................70

7
LIST OF TABLES
Table page 2-1 Shear resistance values for individual beaches in Newton-meters. .......................................27
2-2 Proportion of zero values (too soft to read) and summary statistics for individual beaches. ..............................................................................................................................27
2-3 Proportion of zero values (too soft to read) on natural, nourished, and all beaches. .............28
2-4 Shear resistance values on Cape San Blas beaches over the course of the 2007 season. ......29
2-5 Proportion of zero values (too soft to read) and summary statistics for Cape San Blas beaches over the course of the 2007 season. ......................................................................30
2-6 Comparison of compaction and shear resistance on natural and nourished beaches. ...........30
2-7 Comparison of compaction and shear resistance on Cape San Blas beaches over the course of the 2007 season. .................................................................................................30
2-8 Vane shear strength of soil (kPa) for all beaches measured in 2007. ....................................31
2-9 Mean compaction values (Newtons) for each depth range measured. ..................................32
3-1 Sampling locations of corresponding nourished and natural beaches included in this study. ..................................................................................................................................46
3-2 Timing and method of nourishment of nourished beaches included in this study. ...............46
3-3 Selection of statistical tests for comparing physical properties of sand on natural versus nourished beaches. .............................................................................................................46
3-4 Differences in physical properties of sand on pairs of natural and nourished beaches. ........47
3-5 Differences in physical properties of sand on the same beach over the course of a season. ................................................................................................................................48
3-6 Mean color results for northwest Florida beaches in 2006. ...................................................48
3-7 Mean color results for northwest Florida beaches in 2007. ...................................................49
3-8 Mean grain size results (% Passing) of each sieve size measured for northwest Florida beaches in 2006. .................................................................................................................49
3-9 Mean grain size results (% Passing) of each sieve size measured for northwest Florida beaches in 2007. .................................................................................................................50
3-10 ASTM standard sieve opening sizes (cm) for sieves used in this study. .............................50

8
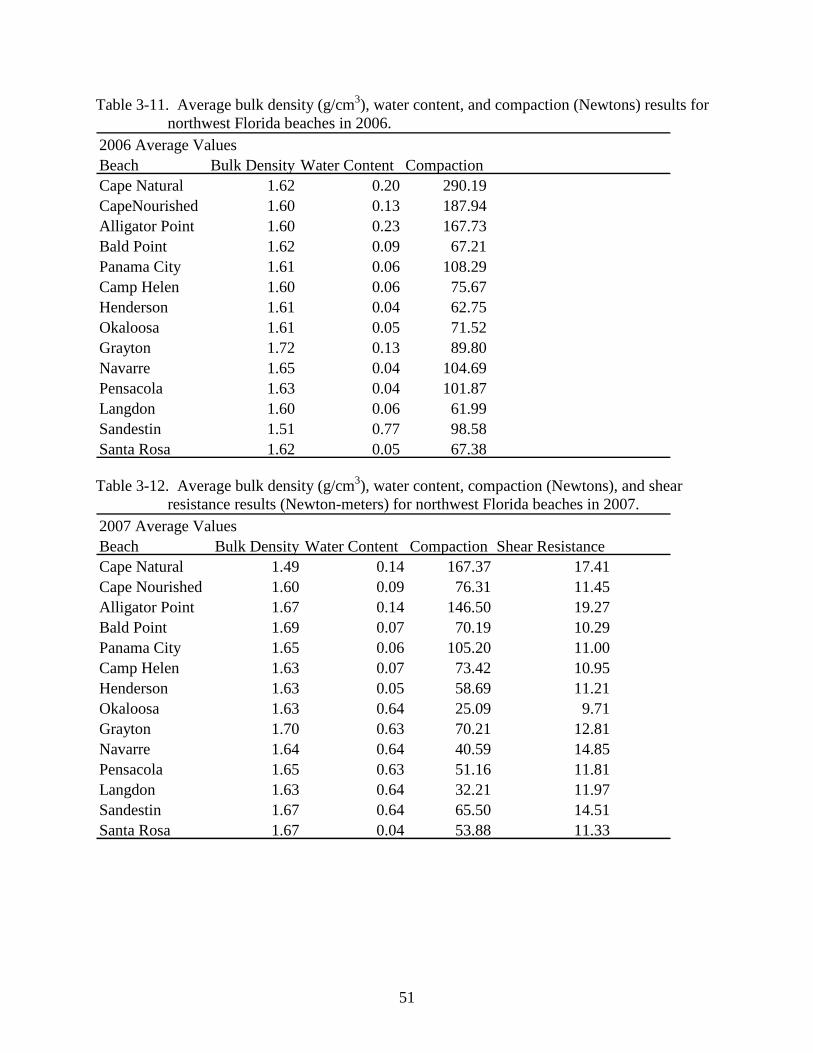
3-11 Average bulk density (g/cm3), water content, and compaction (Newtons) results for northwest Florida beaches in 2006. ...................................................................................51
3-12 Average bulk density (g/cm3), water content, compaction (Newtons), and shear resistance results (Newton-meters) for northwest Florida beaches in 2007. .....................51
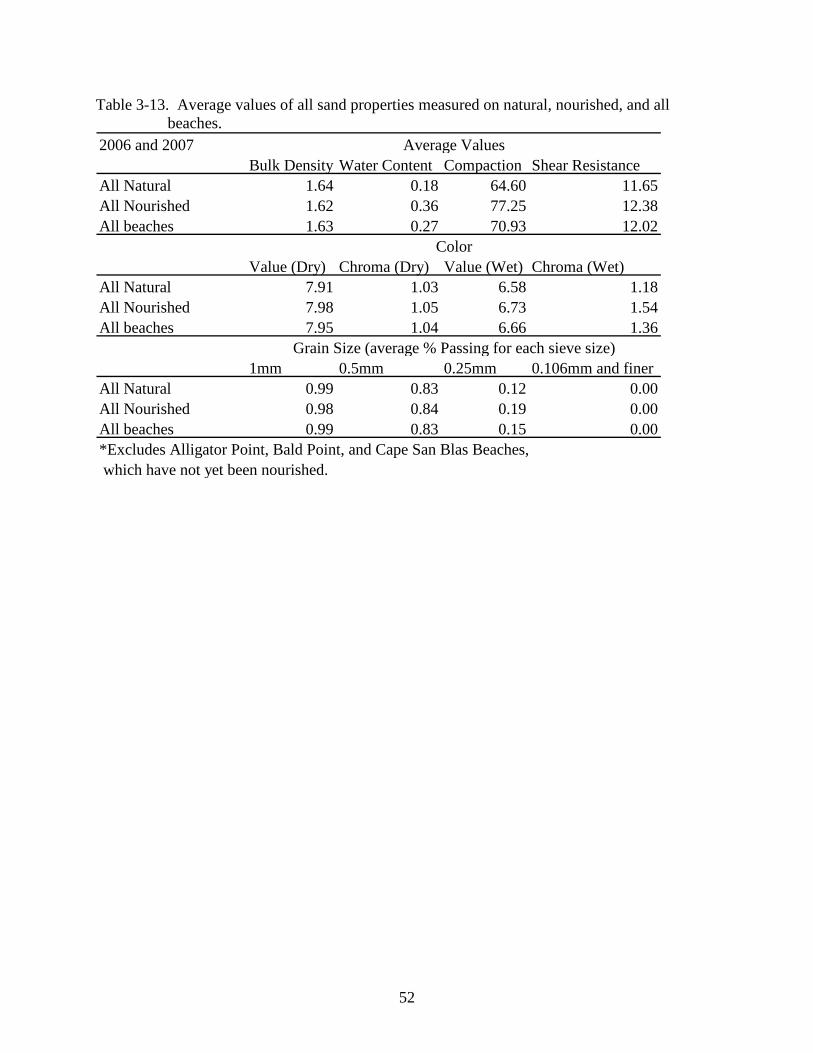
3-13 Average values of all sand properties measured on natural, nourished, and all beaches. ...52
4-1 Nesting Density of loggerhead sea turtles in northwest Florida from 2002 to 2006. ............60
4-2 Nest counts of loggerhead sea turtles in northwest Florida from 2002 to 2006. ...................60
4-3 Ratio of false crawls to nests for loggerhead sea turtles in northwest Florida from 2002 to 2006. ..............................................................................................................................60
4-4 Hatching success and emerging success of loggerhead sea turtles in northwest Florida from 2002 to 2005. .............................................................................................................61

9
LIST OF FIGURES
Figure page 2-1 Enlarged shear vane device used to conduct shear resistance measurements, view
from underneath. ................................................................................................................24
2-2 Enlarged shear vane device used to conduct shear resistance measurements, view from above. ........................................................................................................................25
2-3 Linear Regression plot of shear versus compaction. .........................................................26
3-1 Map of sampling locations along the Florida panhandle. ..................................................43
3-2 Sampling regime for core sand sampling, shear resistance, and penetrometer readings. .............................................................................................................................43
3-3 Canonical plot display of discriminant analysis results including normal 50% contours for nourished (Y) versus non-nourished (N). ......................................................44
3-4 Graph of grain size distribution for all beaches, 2006 and 2007. ......................................45

10
Abstract of Thesis Presented to the Graduate School of the University of Florida in Partial Fulfillment of the
Requirements for the Degree of Master of Science
ASSESSMENT OF DIFFERENCES IN PHYSICAL PROPERTIES OF SAND ASSOCIATED WITH BEACH NOURISHMENT AND EFFECTS ON LOGGERHEAD SEA TURTLE
(Caretta caretta) NESTING IN NORTHWEST FLORIDA
By
Lori Brinn
May 2008
Chair: Raymond R. Carthy Major: Interdisciplinary Ecology
Beach nourishment is increasing in scope and execution as a response to coastal erosion in
Florida. However, if sand used for nourishment has different properties than natural sand, then
the beach ecosystem may be altered. Regulatory agencies maintain sand specifications for
nourishment projects to monitor quality of fill materials. The reproductive effort of nesting sea
turtles requires a suitable incubation environment: the effects of substandard fill material may be
immediate (false crawl) or sublethal (poor incubation environment). Our objective was to
determine if the physical properties of sand on post-nourishment beaches differed from natural
beach sand, and whether any differences observed appeared to affect nesting loggerhead (Caretta
caretta) sea turtles. Compaction, bulk density, water content, color (chroma and value), and
grain size distribution were analyzed on seven pairs of nourished beaches and natural beaches in
northwest Florida in 2006. We hypothesized that any differences in these physical properties on
nourished versus natural beaches could affect loggerhead sea turtle nesting success. While
compaction measurements are often the primary method of evaluating beaches post-nourishment,
measuring shear resistance may provide a more complete picture of a sea turtle’s perception of
the beach during nest chamber excavation. In summer 2007, shear resistance measurements

11
were taken alongside compaction readings using a device developed for this study. Our shear
vane device was more successful at depth than on the surface, and results were repeatable on the
same beach over time. We saw a general trend of the physical properties of several recently
nourished beaches returning over time to a state more similar to that of the native beach. The
nesting density, hatching success, and emerging success of loggerhead sea turtles did not appear
to be adversely affected by beach nourishment. Overall, it appears that the processes in place for
nourishing and maintaining beaches in northwest Florida are not incompatible with loggerhead
sea turtle nesting, and implementing shear resistance measurements as a management tool
following beach nourishment projects would provide useful information to coastal managers
which could be beneficial to nesting loggerhead sea turtles.

12
CHAPTER 1 INTRODUCTION
Beach nourishment is the placement of large amounts of sand on a beach to mitigate
coastal erosion by extending the shoreline seaward or by reconstructing a dune (DEAN, 2002).
Nourishing beaches provides protection of urban areas, recreational and tourism benefits, and if
done properly, ecological benefits (LUCAS and PARKINSON, 2002). Because beach nourishment
can alter abiotic and biotic elements of the ecosystem, it has the potential to significantly affect
all organisms in the coastal system. The effects can be harmful or advantageous, and can be
either temporary or long-term depending upon the nature of the system in question (DEAN,
2002). Through responsible design and monitoring, coastal managers seek to minimize negative
impacts of beach nourishment and maximize recreational and economic benefits.
Habitat alteration within an ecosystem is frequently a major cause of reduced species
diversity (EHRENFELD, 1970). Environmental changes occur naturally but can be interfered with,
impeded by, or accelerated by human actions (SOUTHWICK, 1996). Severe storms and sea level
rise cause coastal erosion, which means that the shoreline retreats inland (WALTON, 1978).
Human actions, such as the creation of artificial navigational inlets, can speed this natural
recession by inhibiting the littoral transport and accretion of sands (DOUGLAS, 2002, KRIEBEL et
al., 2003). Receding coastlines threaten human structures and recreation, thus increasing the
desire to nourish beaches (PILKEY, 1991, OLSEN and BODGE, 1991).
A variety of organisms including invertebrates, fish, birds, and sea turtles, inhabit the
coastal areas at some point in their life cycle. Beach nourishment has the potential to
significantly impact all of these groups. Invertebrates such as coquina clams (Donax spp.) and
mole crabs (Emerita talpoida) comprise a substantial portion of the prey base for ecologically
and economically valuable coastal birds and fish. Schmitt and Haines (2003) found that the

13
impact of beach nourishment on invertebrate populations is generally negative in the short term.
Long-term recovery time, however, depends on the duration and timing of the nourishment
project and the interval between nourishment episodes. Because invertebrates comprise a large
portion of the prey base for many shoreline fish, their loss could mean a reduction in fish
populations. Nourishment also stirs up sediments near the project site, which can cause gill
damage and even death of near-shore fishes (SCHMITT and HAINES, 2003).
Female turtles assess a nesting beach from the water before coming ashore to nest (CARR
and OGREN, 1960, HENDRICKSON, 1982). Loggerhead sea turtles tend to favor steeply-sloped,
moderate to high energy beaches that have moderately-sloped offshore approaches (PROVANCHA
and EHRHART, 1987, WOOD and BJORNDAL, 2000). Geomorphology and dimensions of the
beach are considered important factors in nest site selection (MORTIMER 1982, JOHANNES and
RIMMER, 1984), as are depth of offshore waters (HUGHES, 1974, MORTIMER, 1982), texture of
the sediment (STANYCK and ROSS, 1978, MORTIMER, 1990), and artificial lighting on the beach
(MORTIMER, 1982, WITHERINGTON, 1992, SALMON et al., 1995). All marine turtle species
exhibit a common core sequence of nesting behaviors. The female emerges from the water,
crawls up the beach, excavates a body pit, digs out an egg chamber, oviposition occurs, and
finally the egg chamber and body pit are filled in with sand prior to her return to the ocean
(MILLER et al., 2003). Nourishing beaches may influence nest digging, potentially causing the
shape of the nest to be altered, if the nourished beach has different sand properties than the
natural beach (CARTHY, 1996).
Sediment characteristics play a vital role in the reproductive success of turtles and can
profoundly influence embryological development and survival (BUSTARD, 1973, MCGEHEE,
1979, PACKARD AND PACKARD, 1988). Both ambient nest temperature and incubation duration

14
are impacted by changes in sediment color, grain size, and grain shape resulting from beach
nourishment (MILTON et al., 1997). Because the sex of marine turtles is determined by nest
incubation temperature, with a higher proportion of males produced at lower temperatures and a
higher proportion females at higher temperatures, if a beach nourishment project alters physical
properties of the sand capable of influencing the incubation temperature, sex determination of
turtle hatchlings could be directly affected (MROSOVSKY et al., 1998). Although sea turtle nests
deposited onto nourished beaches tend to hatch successfully (EHRHART and RAYMOND, 1983,
Raymond, 1984, Wolf et al., 1986, Nelson et al., 1987), monitoring of hatchling sex ratios is
important from a conservation standpoint (MROSOVSKY and YNTEMA, 1980, MORREALE et al.,
1982) because they could alter the population sex ratio, thereby affecting the reproductive
success of the population (HANSON et al., 1998). Approximately 90 percent of the loggerhead
nests in the United States occur in Florida (Murphy and Hopkins, 1984) where the sex ratios of
hatchlings and immature sea turtles are significantly female biased (MROSOVSKY and
PROVANCHA, 1989, 1992, WIBBLES et al., 1991).
Beach nourishment projects can alter hatchling development by changing beach
characteristics such as sand compaction, nutrient availability and the gaseous, hydric, and
thermal environments of the nest chamber (CRAIN et al., 1995). Grain size and sorting are
important determinants of gas exchange, moisture content, and other vital characteristics of the
nesting environment for developing sea turtles (ACKERMAN, 1980, NELSON and DICKERSON,
1989, MORTIMER, 1990, ACKERMAN et al., 1992). Nourished beaches have demonstrated positive
impacts (BROADWELL, 1991, EHRHART and HOLLOWAY-ADKINS, 2000, EHRHART and ROBERTS,
2001), negative impacts (EHRHART, 1995, ECOLOGICAL ASSOCIATES INC., 1998), or no apparent

15
impact (RAYMOND, 1984, NELSON et al., 1987, BROADWELL ,1991, STEINITZ et al., 1998) on
marine turtle hatchling success.
The goal of this study was to compare physical characteristics of sand on natural and
nourished beaches including compaction, shear resistance, bulk density, water content, soil color,
and grain size distribution and to relate any differences in these physical sand characteristics to
differences in loggerhead sea turtle (Caretta caretta) nesting success in northwest Florida.

16
CHAPTER 2 LOOKING AT SAND FROM A SEA TURTLE’S PERSPECTIVE: DEVELOPMENT OF A NOVEL SHEAR VANE DEVICE TO COMPARE SHEAR RESISTANCE OF SAND ON
NATURAL AND NOURISHED BEACHES
Introduction
Following beach nourishment projects, the U.S. Fish and Wildlife Service requires that
beach compaction be measured to ensure that the nourished sand provides viable habitat for sea
turtle nesting (COOPER, 1998). Steinitz et al. (1998) found that on nourished beaches, nesting
success of sea turtles was significantly and negatively correlated with increasing compaction at a
depth of 20 cm, while natural beaches experienced no correlation between compaction and
nesting success. Compaction is also known to increase with sand depth (NELSON et al., 1987).
This parameter could influence nest excavation and conditions such as temperature, moisture,
and ease of gas exchange between incubating sea turtle eggs and their surrounding environment.
A physical monitoring workshop undertaken at the 20th Annual Symposium on Sea Turtle
Biology and Conservation cited beach hardness as the most important factor in measuring
impacts of beach nourishment (PARKINSON, 2000).
Between 30 and 40 percent of the time, loggerhead sea turtles emerging onto a nesting
beach return to the ocean without excavating a nest chamber (STONEBURNER AND RICHARDSON,
1981, EHRHART AND RAYMOND, 1983, WILLIAMS-WALLS et al., 1983), a behavior known as a
false crawl. Females may also perform a false dig, which involves emerging from the water,
digging a nest chamber, and abandoning it without laying any eggs. False crawls and false digs
could be caused by a turtle’s “readiness” to lay, physical characteristics of the beach, temperature
of the beach sediment, and disturbances such as the presence of predators or lights on the beach
(MANN, 1978, FLETEMEYER, 1981, STONEBURNER and RICHARDSON, 1981, EHRHART and
RAYMOND, 1983). If the physical consistency of a nourished beach is too hard, females may be

17
forced to spend more time on the beach nesting, which is physiologically taxing and increases
potential exposure to disturbances and predation, all of which could lead to a false dig (NELSON
and DICKERSON, 1989).
Beach compaction is commonly measured using a device called a cone penetrometer,
which measures the penetration resistance associated with pressing a conical point of known
volume down into the soil until it is just below the soil surface (ELE INTERNATIONAL, 2004).
While compaction is one important factor to examine on nourished beaches, it may not provide a
complete picture of how the sand is perceived by a nesting sea turtle crawling onto the beach and
excavating a body pit. Because nesting sea turtles follow a core sequence of behaviors that is
more complex than simply inserting their limbs straight down into the sand, measuring other
properties such as shear resistance may provide additional information about a sea turtle’s
perception of the beach (MILLER et al., 2003). Shearing resistance is a consequence of the
pressure between sand grains and is influenced by grain size distribution, grain shape and
orientation, and weight of overburden (NELSON et al., 1987). Synonyms for shear resistance are
beach hardness and compaction (PARKINSON, 2000). For the purposes of this study, shear
resistance will refer to the force required to move sand in a horizontal direction, while
compaction will be defined as the force required to penetrate the sand in a vertical direction. By
measuring shear resistance in addition to sand compaction, we may gain insight about why sea
turtles decide to false crawl or false dig on certain beaches.
In summer 2007, we measured shear resistance as a separate entity from beach
compaction using a slightly modified, enlarged version of a shear vane apparatus. The goal of
conducting these shear resistance procedures was to provide insight about how nesting sea turtles
perceive the beach while crawling up and digging a nest chamber. Work was conducted on 7

18
pairs of natural (never nourished) and nourished (at least one nourishment project had occurred
or was planned to begin before the study date) beaches in northwest Florida.
Methods
Selection of Sampling Sites
Pairs of natural and nourished beaches were chosen based on two criteria: geographic
orientation and distance apart. Each pair of beaches needed to have the same orientation, and
pairs needed to be spaced closely enough to each other to be comparable but not so close that a
significant amount of sand was likely to mix between them. Consultations with U.S. Fish and
Wildlife Service biologists helped to finalize our sampling site selection. Sampling was confined
to the Florida panhandle with sites ranging from Alligator Point in the east to Langdon Beach on
Gulf Islands National Seashore property in the west.
Compaction and Shear Resistance
U.S. Fish and Wildlife Service requirements dictate that reasonable measures of
minimizing the effects of nourishment on sea turtles include three years of beach monitoring
after a nourishment project. Protocol states that sand compaction should be measured using a
cone penetrometer at 500 foot (152m) intervals along the nourished region and at three evenly
spaced stations; one at the dune or bulkhead line, one at the high water line, and one directly
between these reference points. At each station, the Penetrometer should be pressed to depths of
6, 12, and 18 inches (15.24cm, 30.48cm, and 45.72cm), using three replicate measurements per
location. Replicate measurements should be taken as close together as possible without
interacting with previous measurements. The three replicate compaction readings for each
location should be averaged to yield final values for each depth at each station. Reports must
include 27 compaction values for each beach monitored (COOPER, 1998). For this study, depth

19
of measurements, replication, and spacing of transects followed the protocol above with regard
to both compaction and shear measurements.
Shear resistance measurements were taken using a device and techniques developed in
this course of study. An enlarged shear vane was constructed from steel. The four steel blades
of the shear vane were welded at approximately 90º angles to each other. Each blade measured
approximately 4.75 cm wide by 7.25 cm tall, 2.5 times larger than a standard shear vane (NEW
ZEALAND GEOTECHNICAL SOCIETY, 2001). The blades were welded to a 12 inch (30.48 cm) steel
shaft with a ¼-inch male fitting at the top. An 8 cm long, 2 cm thick steel cylinder with an
opening slightly wider than the diameter of the vane shaft was welded to the center of a 12 inch
by 12 inch (30.48 cm by 30.48 cm) steel plate designed to provide stability to the shear vane
during measurements (Figure 2-1). Preliminary tests were done using several prototypes in sand
at various depths, and the 2.5 times enlarged shear vane size was found to deliver the most
consistent results within the operating range of the torque wrench used.
Our enlarged shear vane was first inserted through the cylinder in the center of the steel
plate for stability (Figure 2-1). The shear vane was able to rotate freely within the cylinder,
minimizing unnecessary horizontal movement. The plate was placed flat onto the surface of the
sand and secured into place using a metal hammer. A TECH1 ¼-inch drive Snap-on®
TECHWRENCH® electronic torque wrench was attached to the top of the shear vane apparatus
and rotated 90º using one constant motion (Figure 2-2). The torque reading was recorded in
Newton-meters and reported as the shear resistance for that sample.
The area ratio of our enlarged shear vane blades was calculated as a percentage using the
equation area ratio = [8T(D-d) + πd2] / πD2 x 100, where D is the overall width of the vane in
millimeters, T is the thickness of the blades in millimeters, and d is the diameter of the vane rod

20
in millimeters. In determining the area ratio, the average of the two blade widths was reported as
overall width D, and the average of the four blade thicknesses at the midpoint of each blade was
reported as the thickness of the blades T. Rod diameter d was measured at the midpoint of the
rod. A Westward® IP-54 Electronic Caliper, model number 2ZA60, was used to obtain
dimensions of the shear vane and extension rod to the nearest 0.01 mm. According to New
Zealand Geotechnical Society guidelines for hand held shear vane testing, the area ratio should
not exceed 25% (2001). The area ratio of our shear vane was calculated as 9.05%, which is well
below the 25% limit, indicating that our shear vane meets the area ratio requirement.
Shear resistance measurements were also used to determine the vane shear strength of
soil, in kilopascals (kPa); which was calculated from the equation τ = M/K, where M is the
torque required to shear the soil in Newton-meters, and K is a constant dependent on the
dimensions and shape of the shear vane. The constant K was calculated as K = 0.33 = πD2H/2 x
(1 + D/3H) x 10-6; where D is the overall width of the vane in millimeters, and H is the height of
the vane in millimeters (NEW ZEALAND GEOTECHNICAL SOCIETY, 2001). A Westward® IP-54
Electronic Caliper, model number 2ZA60, was used to obtain dimensions of the shear vane and
extension rod to the nearest 0.01 mm. In determining the constant K, the average of the two
blade widths was reported as overall width D, and the average of the four blade heights at the
midpoint of each blade was reported as the height of the vane H.
Because of the relatively large proportion of zero values in the data, a Wilcoxon Sign-
Rank test was used to statistically compare the shear resistance of natural versus nourished
beaches. Compaction data did not follow a normal distribution; therefore the Wilcoxon Sign-
Rank test was also used to compare those values. The statistical program JMP was used to
perform all statistical tests.

21
Results
Table 2-1 shows the raw data; all shear resistance measurements (in Newton-meters)
taken for all beaches. Table 2-2 displays the proportion of zeroes, or the proportion of the time
that the device did not register a reading because the sand was too soft. These proportions are
summarized in Table 2-3, which reports the proportion of zero readings for all beaches, all
natural beaches, and all nourished beaches separately. When all beaches were included, the
overall success of the shear vane at registering a reading above zero was 68%. However, 78% of
the zero readings occurred at the surface, while the readings taken at 6 inches and 12 inches
(15.24cm and 30.48cm) had a much lower proportion of zero values. On nourished beaches,
surface measurements registered a zero value 93% of the time. The mean vane shear strength of
soil and standard deviation for each beach are reported Table 2-8.
Of the seven nourished beaches that we studied, two were not actually nourished by the
time of the study. Four of the remaining five pairs of natural versus nourished beaches showed
no statistically significant difference in overall shear resistance, while only two of the five pairs
had no significant difference in overall compaction. Navarre beach, which was nourished most
recently (2006) did have a significantly different overall shear resistance as compared to its
natural counterpart, Santa Rosa. Overall shear resistance may not be the best indicator of
whether natural versus nourished beaches are significantly different because of the relatively
high proportion of zero readings at the surface. However, when surface readings were excluded
from the analysis, results were exactly the same for all beach pairs (Table 2-6).
To test the repeatability of using the enlarged shear vane device, we sampled both Cape
San Blas beaches twice in 2007. No significant differences were found in the overall shear
resistance over the course of the season (Table 2-7). When surface readings were excluded from
the analysis, there was not enough data to compare Cape San Blas natural beach statistically over

22
the course of the season because we were only able to sample two of three transects a second
time due to erosion. The Cape San Blas not yet nourished beach was not significantly different
over the course of the season when surface readings were excluded from the analysis. Sand
compaction was significantly different on the natural Cape San Blas beach over the course of the
season, probably due to the large amount of erosion that occurred on that beach during the
season.
We found no significant linear correlation between beach compaction and shear
resistance measurements. Figure 2-3 shows a linear regression plot of shear versus compaction,
with an R2 correlation coefficient of 0.19. Table 2-9 shows overall compaction values and
results for each depth range measured.
Discussion
One indicator of the success of our shear vane device was the proportion of the time that
the device gave a reliable reading. Our device did not register a reading due to soft surface sand
more than half the time, indicating that it is a more useful tool at depth than on the surface,
particularly on nourished beaches. Perhaps using a shear vane that had even larger blades would
yield more reliable readings at the surface. Because shear resistance may be present at nest
depth even when surface sand has no shear measurable resistance, beach monitoring protocol
following a nourishment project should include the use of an enlarged shear vane device at nest
depth. Our device detected no difference in shear resistance on either Cape San Blas beach over
the course of the season, giving us confidence that our shear vane device delivered repeatable
results.
Because our findings suggest that sand compaction does not exhibit a positive linear correlation
with shear resistance, we conclude that measuring shear resistance as a separate entity from
beach compaction is important. Compaction did tend to be lower on the surface than at depth in

23
most cases, but the readings did not always increase with depth after the surface reading. The
graph also indicates that there is a lower detectability limit for the specific shear vane size and
torque wrench that we used. Measuring shear resistance gives us additional information about
the physical condition of sand placed on a beach during nourishment and may provide useful
insight from a sea turtle conservation management perspective.

24
Figure 2-1. Enlarged shear vane device used to conduct shear resistance measurements, view from underneath.

25
Figure 2-2. Enlarged shear vane device used to conduct shear resistance measurements, view from above.

26
Figure 2-3. Linear Regression plot of shear versus compaction.

27
Table 2-1. Shear resistance values for individual beaches in Newton-meters. Shear Resistance (Nm) - Raw DataBeachCape Nat. 12.43 3.75 4.75 6.76 6.49 3.25 11.49 3.29 - 5.40 5.34 3.98 10.62 3.94 4.24 8.74 4.58 3.03 - 7.59 4.14 - 4.23 3.33 - 6.79 4.00Cape Nour. 3.39 - 2.74 2.95 - - 3.32 - - 4.54 2.87 3.87 3.95 3.10 3.67 3.62 3.52 - 4.84 4.62 3.81 3.67 - 5.32 4.01 4.01 -Alligator Point 3.31 3.89 - 6.78 - 4.78 3.97 3.31 3.35 9.20 7.08 3.89 10.61 8.84 6.56 6.42 5.63 4.39 9.10 4.12 6.73 9.58 6.63 7.39 7.07 7.63 8.74Bald Point - - - - - - - - - 3.42 4.10 2.89 3.85 - 3.02 3.07 - - 3.34 3.96 4.15 3.36 2.89 - 2.71 - -Panama City - - - - - - 2.93 - - 3.60 4.74 4.36 3.24 2.75 4.72 3.65 3.24 3.16 4.15 3.57 3.77 2.80 - 3.53 3.77 4.53 2.85Camp Helen - - - - - - - - - - 3.18 4.06 - 3.16 - 3.01 3.34 3.60 3.27 3.58 3.82 3.51 3.59 3.52 - 3.90 5.04Henderson - - - - - - - - - 3.50 4.52 3.55 2.89 3.59 4.96 3.83 5.26 2.85 3.34 3.73 3.24 3.10 3.74 3.70 3.36 4.62 2.83Okaloosa 2.85 - - - - - - - - 3.78 3.15 3.12 2.76 3.76 4.22 - 3.43 3.14 3.67 3.52 3.09 3.28 3.76 2.76 3.41 3.60 3.58Grayton - - - - - - - - - - 3.07 2.73 3.46 4.98 4.54 4.61 4.95 6.14 3.58 2.78 4.43 4.72 3.05 3.85 3.18 5.12 6.66Sandestin 3.85 - - - - - - - - 2.97 2.73 7.68 6.90 3.06 7.25 2.88 3.87 6.53 2.99 5.78 6.61 5.26 4.80 3.25 5.08 5.75 3.75Pensacola - - - - - - - - - 3.43 3.01 4.05 3.80 4.10 3.78 4.71 4.63 2.82 3.86 4.94 3.90 3.91 5.47 3.49 4.56 2.79 2.91Langdon - - - - - - - - 3.69 3.11 2.92 3.52 2.76 3.89 4.57 2.71 4.37 2.95 3.60 5.11 6.67 - - 4.41 3.23 4.10 5.55Navarre - - - - - - - - - 5.73 2.78 4.26 6.47 3.92 5.38 5.02 6.30 3.52 - - 2.80 5.30 4.28 7.84 5.86 3.75 5.19Santa Rosa 2.78 2.88 - 2.72 - 2.84 - - 3.10 5.07 4.14 2.81 4.10 4.61 4.52 3.67 3.38 3.06 5.12 - 5.43 3.54 3.57 3.35 3.42 2.81 5.35
Surface 15.24 cm (6 inch) depth 30.48 cm (12 inch) depth
Table 2-2. Proportion of zero values (too soft to read) and summary statistics for individual beaches. Beach Cape Nat. Cape Nour. Alligator Point Bald Point Panama City Camp Helen Henderson Okaloosa Grayton Sandestin Pensacola Langdon Navarre Santa RosaProportion of zero readings (too soft to read)Surface 0.11 0.56 0.22 1.00 0.89 1.00 1.00 0.89 1.00 0.89 1.00 0.89 1.00 0.446 inch depth 0.00 0.11 0.00 0.33 0.00 0.33 0.00 0.11 0.11 0.00 0.00 0.00 0.00 0.0012 inch depth 0.33 0.22 0.00 0.33 0.11 0.11 0.00 0.00 0.00 0.00 0.00 0.22 0.22 0.11Overall 0.15 0.30 0.07 0.56 0.33 0.48 0.33 0.33 0.37 0.30 0.33 0.37 0.41 0.19Mean TorqueSurface 6.53 3.10 4.20 N/A 2.93 N/A N/A 2.85 N/A 3.85 N/A 3.69 N/A 2.866 inch depth 5.54 3.64 6.96 3.39 3.72 3.39 3.88 3.42 4.31 4.87 3.81 3.42 4.82 3.9312 inch depth 5.01 4.33 7.44 3.40 3.62 3.78 3.52 3.41 4.15 4.81 3.98 4.67 5.00 4.07Overall 5.75 3.78 6.36 3.40 3.63 3.61 3.70 3.38 4.23 4.79 3.90 3.95 4.90 3.74Standard DeviationSurface 3.62 0.31 1.25 N/A N/A N/A N/A N/A N/A N/A N/A N/A N/A 0.156 inch depth 2.50 0.52 2.24 0.49 0.72 0.38 0.86 0.47 1.14 2.15 0.65 0.70 1.28 0.7612 inch depth 1.73 0.61 1.63 0.57 0.59 0.55 0.52 0.32 1.23 1.24 0.89 1.20 1.63 1.05Overall 2.74 0.69 2.21 0.51 0.65 0.51 0.71 0.40 1.15 1.67 0.76 1.08 1.39 0.91

28
Table 2-3. Proportion of zero values (too soft to read) on natural, nourished, and all beaches. Proportion of zero readings (too soft to read)
All Beaches All Natural Beaches All Nourished Beaches*Surface 0.78 0.78 0.936 in depth 0.07 0.11 0.0212 in depth 0.12 0.16 0.07Overall 0.32 0.35 0.34
*Excluding Alligator Point and Cape Nourished, which have not yet been nourished.

29
Table 2-4. Shear resistance values on Cape San Blas beaches over the course of the 2007 season. Shear Resistance (Nm) - Raw DataBeach DateCape 5/10/2007 12.43 3.75 4.75 6.76 6.49 3.25 11.49 3.29 - 5.40 5.34 3.98 10.62 3.94 4.24 8.74 4.58 3.03 - 7.59 4.14 - 4.23 3.33 - 6.79 4.00Natural 8/12/2007 3.55 3.07 - 3.93 3.39 2.91 N/A N/A N/A 4.74 3.52 4.61 5.00 6.70 4.17 N/A* N/A N/A 10.30 7.06 5.64 7.62 7.97 7.80 N/A N/A N/ACape 5/11/2007 3.39 - 2.74 2.95 - - 3.32 - - 4.54 2.87 3.87 3.95 3.10 3.67 3.62 3.52 - 4.84 4.62 3.81 3.67 - 5.32 4.01 4.01 -Nourished 8/12/2007 - - - - - - - - - 2.83 4.82 2.71 4.16 4.05 3.77 4.97 3.36 4.16 5.01 4.50 5.74 4.29 5.18 3.75 3.17 5.53 3.86
Surface 15.24 cm (6 inch) depth 30.48 cm (12 inch) depth

30
Table 2-5. Proportion of zero values (too soft to read) and summary statistics for Cape San Blas beaches over the course of the 2007 season.
BeachSampling Date 5/10/07 8/12/07 5/11/07 8/12/07Proportion of zero readings (too soft to read)Surface 0.11 0.17 0.56 1.006 inch depth 0.00 0.00 0.11 0.0012 inch depth 0.33 0.00 0.22 0.00Overall 0.15 0.06 0.30 0.33Mean TorqueSurface 6.53 3.37 3.10 N/A6 inch depth 5.54 4.79 3.64 3.8712 inch depth 5.01 7.73 4.33 4.56Overall 5.75 5.41 3.78 4.21Standard DeviationSurface 4.30 6.02 3.78 N/A6 inch depth 5.58 2.56 2.75 0.0012 inch depth 4.90 3.75 4.34 5.02Overall 4.92 4.30 3.80 4.27
Cape Natural Cape (Not Yet Nourished)
Table 2-6. Comparison of compaction and shear resistance on natural and nourished beaches. Physical Property of Soil
Navarre* Pensacola* Panama City* Okaloosa* Sandestin* Cape* Alligator Point*2007 Santa Rosa Langdon Camp Helen Henderson Grayton Cape Bald PointCompaction NS * ** ** NS ** **Shear Resistance * NS NS NS NS ** **Shear Resistance (excluding surface values) * NS NS NS NS ** ***Year of Last Nourishment 2006 2005 2005 2004 1988 Future Plans Future Plans
Beach Pairs Compared
Table 2-7. Comparison of compaction and shear resistance on Cape San Blas beaches over the course of the 2007 season. Beach: Cape (Natural) Cape (Not Yet Nourished)Compaction ** NS Shear Resistance NS NS Sampling Dates: 5/10/07, 8/12/07 5/11/07, 8/12/07

31
Table 2-8. Vane shear strength of soil (kPa) for all beaches measured in 2007. 2007 Vane Shear Strength of Soil
Standard *Year of LastBeach Mean Deviation NourishmentNavarre* 14.85 4.22 2006Santa Rosa 11.33 2.75Pensacola* 11.81 2.30 2005Langdon 11.97 3.28Panama City* 11.00 1.97 2005Camp Helen 10.95 1.53Okaloosa* 9.71 2.63 2004Henderson 11.21 2.15Sandestin* 14.51 5.05 1988Grayton 12.81 3.50Cape* 5/11/07 11.45 2.08 N/ACape 5/10/07 17.41 8.30 Future PlansCape* 8/12/07 12.77 2.67 N/ACape 8/12/07 16.40 6.49 Future PlansAlligator* 19.27 6.70 N/ABald 10.29 1.54 Future Plans

32
Table 2-9. Mean compaction values (Newtons) for each depth range measured. Mean Compaction (Newtons) by Sampling Depth2006 Cape Nat. Cape Nour. Bald Point Alligator Point Camp Helen Panama City Henderson Okaloosa Grayton Sandestin Langdon Pensacola Santa Rosa NavarreOverall 290.19 187.94 67.21 167.73 75.67 108.29 62.75 71.52 89.80 98.58 61.99 101.87 67.38 104.690-15.24cm 314.33 104.46 22.68 148.97 20.13 21.08 13.26 26.04 31.20 15.17 25.02 11.07 19.38 9.0515.24-30.48cm 303.36 232.23 73.95 203.48 91.57 160.47 86.99 90.03 122.61 153.07 76.93 152.32 80.98 124.3730.48-45.72cm 252.89 227.12 104.99 148.61 115.32 143.32 88.01 98.49 115.58 127.51 84.01 142.20 101.80 180.642007Overall 167.37 76.31 70.19 146.50 73.42 105.20 58.69 25.09 70.21 65.50 32.21 51.16 53.88 40.590-15.24cm 136.40 21.88 14.80 76.19 18.10 18.42 19.75 5.86 20.07 11.02 12.03 6.28 19.97 7.9315.24-30.48cm 188.95 84.23 83.06 173.40 99.83 142.68 78.90 39.19 87.63 91.95 40.36 70.97 74.27 63.0930.48-45.72cm 181.47 122.83 112.71 189.91 102.33 154.50 77.41 30.24 102.91 93.54 44.24 76.24 67.40 50.74

33
CHAPTER 3 ASSESSMENT OF DIFFERENCES IN PHYSICAL PROPERTIES OF SAND ON NATURAL
AND NOURISHED BEACHES IN NORTHWEST FLORIDA
Introduction
Erosion and sea level rise threaten structures along developed coastlines each year. The
beach acts as a natural barrier, protecting developed areas during storm events. Beaches are
dynamic systems that erode during winter months, accrete in the summer, and shift constantly
due to waves, currents, and wind (SCHMITT and HAINES, 2003). The forces of nature move and
reallocate portions of the shoreline considerably over time, sometimes causing accretion or even
a temporary disappearance. Generally, sand is pulled offshore in winter and during storm events
and pushed back onshore in spring and summer. Because of the constant pressure of natural
forces, beaches, especially on barrier islands, naturally migrate. Hardened structures imposed by
humans may alter this natural cycle by impeding the transfer of sand needed for beach accretion.
Human engineered solutions such as sea walls, groins, jetties, and other hardened structures
intensify the problem. Beach nourishment is currently the most accepted engineered system for
the protection of natural and man-made areas from the effects of erosion (JONES and MANGUN,
2001).
Significant alterations in beach substrate properties could occur if fill sediment from
physically incompatible sources is used. Beach nourishment can alter the density, compaction,
shear resistance, moisture content, beach slope, sediment color, grain size, grain shape, and
mineral content of sediment in the beach system (PIATKOWSKI, 2002). Differences in particle
size can directly impact the shear resistance of the sediment, making the beach relatively harder
after a nourishment project. Harder or more compacted sand result primarily from the angular,
finer grain sediment dredged out of stable offshore borrow pits. Softer, less compacted beaches
result from smoother, coarse sediment dredged from high energy borrow sites such as inlets

34
(NELSON and DICKERSON, 1989). Sediment used for beach nourishment projects is obtained
from three main sources: inlets, channels, and offshore borrow sites (CRAIN et al., 1995).
Potential borrow sites of beach-compatible sand for Florida’s beaches include offshore
interreefal sedimentary infills, upland dunes, sand sheet inland deposits, and oolithic sand from
the Bahama Banks. The cost of finding and transporting beach compatible sand may be a
limiting factor in future beach nourishment projects in Florida, and alternatives such as recycled
glass have been proposed as potential beach fill material (MAKOWSKI and RUSENKO, 2007).
Management agencies that regulate beach nourishment projects maintain specifications
regarding the quality of fill material used. Our objective was to determine whether there were
significant differences in physical properties of sand between natural and nourished beaches in
northwest Florida. Specifically, compaction, shear resistance, bulk density, water content, grain
size distribution, and soil color were measured.
Methods
Selection of Sampling Sites
We sampled 14 beaches in northwest Florida in 2006 and again in 2007. Seven of the
beaches were considered natural, meaning those beaches have never been nourished and no
current plans for nourishment currently exist. The other seven “partners” had either undergone
or planned at least one beach nourishment project. Northwest Florida was chosen because of the
relatively large number of nourishment projects that are planned or have already taken place in
that region. Also, these beaches are utilized by threatened loggerhead sea turtles (Caretta
caretta) for nesting each year.
Pairs of natural and nourished beaches were selected based primarily on two criteria:
geographic orientation and distance apart. Pairs of beaches needed to face the same direction
and be spaced closely enough to each other to be comparable but not so close that a significant

35
amount of sand was likely to mix between natural and nourished sites. Consultations with U.S.
Fish and Wildlife Service biologists helped to finalize the sampling site selection process.
Sampling was constrained to the Florida panhandle, and sites ranged from Alligator Point in the
east to Langdon Beach on Gulf Islands National Seashore property in the west. Table 3-1 lists
all seven pairs of natural and nourished beaches sampled in this study. Figure 3-1 displays the
geographic location of all of the beaches on a map. Navarre beach was sampled twice in 2006 to
observe change in physical properties on the same beach over the course of the season. Both
Cape San Blas natural beaches were measured twice in 2007 for the same reason. Table 3-2 lists
the nourishment method and years of nourishment for the seven nourished beaches sampled in
this study.
Compaction and Shear Resistance
According to U.S. Fish and Wildlife Service requirements, reasonable measures of
minimizing the effects of nourishment on sea turtles include three years of beach monitoring
following a nourishment project. Protocol mandates that compaction should be measured using a
cone penetrometer at 500 foot (152m) intervals along the nourished area and at three evenly
spaced stations; one at the dune or bulkhead line, one at the high water line, and one directly
between these reference points. At each station, the Penetrometer should be pressed to depths of
6, 12, and 18 inches (15.24cm, 30.48cm, and 45.72cm), with three replicate measurements per
location. Replications should be done as close together as possible without interacting with
previously measurements. The three replicate compaction values for each location are to be
averaged to yield final values for each depth at each station. Reports must include 27
compaction values per each transect (COOPER 1998). For this study, depth of measurements and
spacing of transects followed the protocol above for both compaction and shear measurements.
Figure 3-2 illustrates the sampling regime used. A total of 27 measurements per beach were

36
taken on each beach. Each measurement was based upon an average of three replicate
measurements at the same depth and location. Portable Global Positioning System (GPS) units
were used to mark each sampling location. Shear resistance measurements were taken using
techniques described in Chapter 2.
Bulk Density and Water Content
Standard methods of bulk density and water content determination were obtained from
U.S. Fish and Wildlife Service requirements and from a report by Steinitz et al. that utilized
similar procedures (1998). Core samples for these measurements were obtained at intervals of 0
to 15.24cm, 15.24 to 30.48cm, and 30.48 to 45.72cm below the surface at each location used for
shear resistance measurement. Portable Global Positioning System (GPS) units were used to
record each sampling location. One Ziploc bag was labeled for each sample to be collected (27
total per beach in 2006). A mallet was used to drive a PVC pipe (henceforth known as the “core
sampler”) of known volume (308.889 cm3) directly into the ground, filling it completely to
collect a core sample 15.24 centimeters in depth. The top of the core sampler was covered with a
wide spatula to ensure that sand particles did not escape through the top. Sand was removed
around the core sampler, and the outside was wiped clean with a rag. A wide spatula was then
carefully placed underneath it, completely flush with the bottom of the tube. The spatula was
then removed from the top of the core sampler and carefully replaced with a Ziploc bag. The
sample was then inverted into the bag. Using a narrow spatula, excess sand grains were scraped
into the Ziploc bag from the inside of the core sampler. Samples were placed into an un-iced
cooler to avoid extreme heat or sun during transport. The inside of the core sampler and all
spatulas were wiped clean with a rag between samples. These steps were repeated for depth
ranges of 15.24 to 30.48 cm and 30.48 to 45.72 cm at each sampling location. Figure 3-2

37
outlines the sampling regime used, and the same locations were used for core sampling as for
compaction and shear resistance measurements.
One 600 ml beaker was labeled for each sample to be analyzed using pencil and non-
volatile ink. Beakers were pre-dried for two hours in a gravity convection scientific oven
calibrated at 105ºC. The tare weight of each beaker was recorded to the nearest 0.01g. Sand
samples were then randomly selected for analysis. The entire sample of known volume was
placed into its corresponding beaker. Care was used to transfer all of the sand, to keep spilling or
leaving sand in the sampling bag to a minimum. The weight of the beaker and wet sample was
recorded to the nearest 0.01g. Each beaker was covered with Aluminum foil to prevent exposure
to open air. All samples were dried for 16 hours at 105ºC. Samples were allowed to cool
without exposure to open air. The weight of the beaker and dry sample was recorded to the
nearest 0.01g. Bulk density (g/cm3) was determined by dividing the weight of dry sand by the
volume inside the core sampler. Water content was also obtained by dividing the volume of
water in each sample (assuming 1g/mL as the density of water) by the total volume of that
sample. Each sample was returned to its original Ziploc bag and sealed in an un-iced cooler for
storage and transport.
Grain Size Distribution and Soil Color
U.S. Fish and Wildlife Service requirements dictate that all fill material placed must be
compatible with natural, undisturbed beach sand in the area being nourished. Grain size
distribution must be similar such that it does not contain construction debris, rocks, or other
foreign matter. Furthermore, fill material must not contain, on average, more than 10% silt and
clay, which is defined as fine material passing the #200 (0.075 mm particle diameter) ASTM
Standard Sieve; and must not contain, on average, more than 5% coarse gravel or cobbles,

38
excluding shell material, that is retained by the #4 (4.75 mm) ASTM Standard Sieve (Mizzi
2005).
Dried samples collected for bulk density and water content analysis were transported to
the University of Florida soil science laboratory in Gainesville, FL. All samples were analyzed
on the basis of color and grain size distribution under laboratory conditions. ASTM standard
mesh sieves of standard sizes #18 (1 mm), #35 (0.5 mm), #60 (0.25 mm), #140 (0.106 mm), and
#325 (0.045 mm) were stacked in ascending order with a clean collecting pan on the bottom. A
single sample was randomly selected for analysis. A subsample of approximately 100g was
weighed and poured into the sieve stack. The lid was placed on the stack, and the unit was
situated on a mechanical sieve shaker. The unit was shaken for 5 minutes using the timer on the
sieve shaker. After removal from the mechanical sieve shaker, each sand fraction was weighed
individually from top to bottom. Weights were recorded to the nearest 0.01g. Each sieve and the
collecting pan were cleaned gently with a small brush between samples. The mass of soil in all
sieve fractions was compared to the mass of the entire sample before sieving for mass balance.
For our purposes, the proportion of fine grains was considered that which passed through the
smallest #325 (0.045 mm) sieve, and the proportion of coarse grains was considered that which
was retained in the largest #18 (1 mm) sieve. These sieve sizes were the closest that we were
able to obtain to the #200 and #4 standard sizes.
Soil color was determined using a Munsell soil color book. A quarter-sized pinch of dry
soil was deposited into the palm of the gloved hand of the laboratory assistant. Color charts were
held over the sample under sunlight, and a match was identified. Chroma and value as well as
the reference number of the color chart (the hue) were recorded. Using deionized water, the

39
same sample was wet until glistening, and the process of comparing the sample to the chart was
repeated on a wet basis.
Soil Data Analysis
Data for each of the physical properties measured were first assembled into a histogram
and checked for overall normality and to make sure that there was not a large proportion of
zeroes. All variables were checked for dependency or correlation with other variables, and no
significant correlations were found among any of the sand properties measured. If the normality
assumption was reasonable and there were not too many zero values in the data, a paired t-test
was used for analysis. Compaction and shear resistance did not meet the normality assumption;
therefore these properties were analyzed using a Wilcoxon Sign-Rank test. Soil color, a
categorical variable, was analyzed using a chi-square distribution. Table 3-c outlines the
normality assumption verification and test used for each variable measured. All statistical
analyses were performed using the program JMP® 7.0.1.
Results and Discussion
In 2007, Navarre beach, which was nourished in 2006, and Pensacola beach, nourished in
2005, were more physically similar to their natural beach partners as compared to 2006 values
(Table 3-4). This indicates recovery over time of these recently nourished beaches to a state that
is physically more similar to the native beach. Navarre beach also experienced changes in
physical properties over the course of the 2006 season, most likely a result of sand being added
to the system (Table 3-5). Panama City beach, which was nourished in 2005, and Okaloosa
Island, nourished in 2004, were less physically similar to their natural beach counterparts in 2007
than they were in 2006. Okaloosa Island had differences in grain size distribution and
compaction in 2007 that were not seen in 2006, and Panama City beach had differences in bulk
density in 2007 that were not observed the previous year. There may be many reasons for this

40
variability in sand properties, which could be attributable to the dynamic nature of the beaches
themselves, human actions such as beach driving, tilling, or heavy foot traffic, or other factors.
Even on nonnourished beaches, high levels of variability can be present among years. Cape San
Blas beaches, which have not been nourished, were only different with regard to sand
compaction over the course of the 2007 season, yet these quickly eroding beaches were highly
variable with regard to differences in their physical properties among years, as were Alligator
Point and Bald Point, both of which have yet to be nourished. Although a fair amount of
variability was observed, at least some of these beaches seem to be recovering over time to a
state more similar to that of the natural beach.
Compaction and Shear Resistance
In 2006, overall sand compaction was significantly different in only one of the five pairs
of natural versus nourished beaches for which the nourished beach actually was nourished in
time for this study. Three of the five pairs of beaches exhibited significant differences in
compaction in 2007. Alligator Point and Bald Point appear to have a high level of natural
variation in sand compaction levels, as do the Cape San Blas beaches. Shear resistance, which
was only measured in 2007, was different only for Navarre beach and Santa Rosa. Navarre
beach was nourished the most recently of all beaches studied, with sand placement occurring in
2006 (Table 3-4). Compaction was significantly different on Navarre beach upon the second
sampling event in 2006. The natural Cape San Blas beach showed significantly different overall
compaction over the course of the 2007 season, but its not yet nourished counterpart did not.
There was no significant change in shear resistance over the course of the 2007 season for either
Cape San Blas beach (Table 3-5). Compaction and shear resistance provide useful but different
information and should both be included in monitoring programs following a beach nourishment
project.
41
Bulk Density and Water Content
Differences in bulk density and water content were highly variable among all beach pairs
during both study years (Table 3-4). Over the course of the 2006 and 2007 seasons respectively,
bulk density was not found to be significantly different on any of the beaches that were sampled
multiple times. Water content was significantly different on Navarre beach during the second
round of sampling in 2006, but both Cape San Blas beaches showed no significant difference in
water content between sampling events in 2007 (Table 3-5). Because water content is highly
variable and depends on many factors including rainfall, tide, and time of day, it may not be the
most useful indicator of the physical compatibility of sand on natural versus nourished beaches.
However, results of a discriminant analysis (below) indicate that it may be an important
contributing factor to measure. Bulk density is a property worthy of consideration because its
measurements are less dependent upon daily fluctuations in ambient weather conditions.
Grain Size Distribution and Soil Color
No significant differences were found in soil color on any of the beach pairs that we
studied. The proportion of fine grains was significantly different on Navarre beach as compared
to Santa Rosa beach in 2006, but no significant difference was found in the proportion of fine
grains on these beaches in 2007. Significant differences in the proportion of coarse grains were
seen on Navarre beach versus Santa Rosa during both years of this study. There was no
difference in the proportion of fine and coarse grains for either year on the two pairs of beaches
for which the nourished counterparts were not nourished by the time of this study (Table 3-4).
The proportion of fine and coarse grains was significantly different upon the second round of
sampling in 2006 on Navarre beach. Cape San Blas beaches experienced no significant change
in the proportion of fine or coarse grains over the course of the 2007 season (Table 3-5). Figure
3-4 displays the grain size distribution graphically for all beaches studied during both years,

42
excluding Alligator Point, Cape San Blas, and their natural beach counterparts. Table 3-13 gives
average grain size distribution and soil color values for all natural beaches, all nourished
beaches, and all beaches during both years. Cape San Blas beach, Alligator Point beach, and
their natural beach counterparts were excluded from table 3-13 because these beaches have not
yet been nourished. Mean grain size was between 0.5mm and 0.25mm for all beaches, and
neither the natural nor the nourished beaches had a high proportion of extremely coarse or
extremely fine sand grains. The overall average color values for all beaches were 10Yellow-Red
hue, 7.95 value, and 1.04 chroma in dry sand, and 10Yellow-Red hue, 6.66 value, and 1.36
chroma in wet sand. Florida has legal guidelines concerning the color of sediment placed on a
nourished beach. According to our findings, these guidelines are doing their job of ensuring that
sand placed on nourished beaches in northwest Florida is the same color as the natural beach
sand. Grain size distribution, particularly the proportion of coarse and fine grains on a beach,
should be measured in future monitoring studies following beach nourishment projects.
Discriminant Analysis
Results of a discriminant analysis performed using bulk density, water content, and grain
size distribution (proportion of fine and coarse) as Y covariates and Nourished (Yes or No) as the
X category resulted in a 24.7% misclassification. The Canonical plot (Figure 3-3) displays
nonoverlapping normal 50% contours for Y (nourished) versus N (non-nourished) using these
properties. Because using only these properties yielded results similar in accuracy to results
obtained using all properties measured (23.6% misclassification), we conclude that of the
properties we measured, bulk density, water content, and grain size distribution are the most
important indicators of a nourished beach. Cape San Blas beaches, Alligator Point, and Bald
Point were excluded from this analysis because these pairs of beaches have not yet been
nourished (Table 3-2).

43
Figure 3-1. Map of sampling locations along the Florida panhandle.
Figure 3-2. Sampling regime for core sand sampling, shear resistance, and penetrometer readings.

44
Figure 3-3. Canonical plot display of discriminant analysis results including normal 50% contours for nourished (Y) versus non-nourished (N).

45
Figure 3-4. Graph of grain size distribution for all beaches, 2006 and 2007.

46
Table 3-1. Sampling locations of corresponding nourished and natural beaches included in this study. Nourished Beach Corresponding Natural Beach County (Florida) Alligator Pointe Bald Pointe Franklin Cape San Blas (near State Park) Cape San Blas (near lighthouse) Gulf Panama City Beach Camp Helen State Park Bay Okaloosa Island Henderson Beach State Park Okaloosa Sandestin Development Beaches Grayton Beach State Park Walton Pensacola Beach Langdon Beach Escambia Navarre Beach Santa Rosa Island Authority Santa Rosa Table 3-2. Timing and method of nourishment of nourished beaches included in this study. Nourished Beach Year(s) of Nourishment Nourishment Method Alligator Pointe N/A, Future nourishment plans exist Dredge Cape San Blas N/A, Future nourishment plans exist (May 2008) Dredge, Bags (near State Park) Private groin bags (unpermitted) after Hurricane Ivan Panama City Beach 1976, 1982, 1984, 1986, 1988, 1996, 1998, 2004, 2005 Dredge Okaloosa Island 2004 Dredge Sandestin Development Beaches 1986, 1987, 1988 Dredge Pensacola Beach 1986, 2003, 2005 Dredge Navarre Beach 2006 Dredge Table 3-3. Selection of statistical tests for comparing physical properties of sand on natural
versus nourished beaches. Physical Property of Soil Normality Assumption Reasonable? Test Selected for ComparisonCompaction No, left skewed Wilcoxon Sign-Rank TestBulk Density Yes Paired t-testWater Content Yes Paired t-testProp. Fine Grains Yes Paired t-testProp. Coarse Grains Yes Paired t-testShear Resistance No, too many zeroes Wilcoxon Sign-Rank TestSoil Color N/A, categorical variable Chi-Square

47
Table 3-4. Differences in physical properties of sand on pairs of natural and nourished beaches. Physical Property of Soil
Navarre* Pensacola* Panama City* Okaloosa* Sandestin* Cape* Alligator Point*2006 Santa Rosa Langdon Camp Helen Henderson Grayton Cape Bald PointCompaction NS NS ** NS NS * **Bulk Density * ** NS NS ** NS NS Water Content * * NS * ** ** **Prop. Fine Grains * NS NS NS NS NS NS Prop. Coarse Grains ** * NS NS NS NS *Soil Color NS NS NS NS NS NS NS 2007Compaction NS * ** ** NS ** **Bulk Density * NS * NS ** ** *Water Content ** NS NS ** NS ** **Prop. Fine Grains NS NS NS * NS NS NS Prop. Coarse Grains ** NS NS * ** NS NS Soil Color NS NS NS NS NS NS NS Shear Resistance * NS NS NS NS ** ***Year of Last Nourishment 2006 2005 2005 2004 1988 Future Plans Future Plans* indicates p<0.05, ** indicates p<0.01, NS indicates no significant difference.
Beach Pairs Compared

48
Table 3-5. Differences in physical properties of sand on the same beach over the course of a season. Beach Navarre Beach Cape (Natural) Cape (Not Yet Nourished)Compaction ** ** NS Bulk Density NS NS NS Water Content ** NS NS Prop. Fine Grains ** NS NS Prop. Coarse Grains ** NS NS Soil Color NS NS NS Shear Resistance N/A NS NS Sampling Dates 7/10/06, 9/29/06 5/10/07, 8/12/07 5/11/07, 8/12/07* indicates p<0.05, ** indicates p<0.01, NS indicates no significant difference. Table 3-6. Mean color results for northwest Florida beaches in 2006. Mean Color Values 2006Beach Value (Dry) Chroma (Dry) Value (Wet) Chroma (Wet)Cape Natural 7.85 1.19 5.89 2.07Cape Nourished 7.96 1.00 6.85 1.96Alligator Point 8.00 2.00 6.88 2.31Bald Point 7.81 1.67 6.67 2.30Panama City 8.00 1.30 6.85 2.33Camp Helen 8.00 1.07 7.00 1.52Henderson 8.00 1.00 7.00 1.48Okaloosa 8.00 1.00 7.00 1.19Grayton 7.59 1.04 5.74 1.11Navarre 8.00 1.00 7.00 1.93Pensacola 8.00 1.00 7.00 1.85Langdon 8.00 1.00 6.96 1.19Sandestin 8.00 1.04 7.00 1.56Santa Rosa 8.00 1.07 6.93 1.19*Munsell Color Book, 10 YR Chart

49
Table 3-7. Mean color results for northwest Florida beaches in 2007. Mean Color Values 2007Beach Value (Dry) Chroma (Dry) Value (Wet) Chroma (Wet)Cape Natural 7.92 1.08 6.00 1.33Cape Nourished 7.85 1.07 5.89 1.33Alligator Point 8.00 1.22 6.00 1.85Bald Point 7.59 1.96 5.81 2.96Panama City 7.81 1.15 6.00 1.81Camp Helen 8.00 1.00 6.15 1.07Henderson 8.00 1.00 6.89 1.00Okaloosa 8.00 1.00 6.89 1.00Grayton 7.56 1.00 5.74 1.00Navarre 8.00 1.00 6.59 1.44Pensacola 8.00 1.00 6.63 1.15Langdon 8.00 1.00 7.00 1.00Sandestin 8.00 1.00 6.33 1.11Santa Rosa 7.96 1.11 6.41 1.26 Table 3-8. Mean grain size results (% Passing) of each sieve size measured for northwest Florida beaches in 2006. 2006 Grain Size (average % Passing for each sieve size)Beach no. 18 no.35 no.60 no.140 no.325 panCape Natural 0.9946 0.9833 0.7101 0.0032 0.0003 0.0014Cape Nourished 0.9979 0.9920 0.4857 0.0009 0.0001 0.0012Alligator Point 0.9951 0.9762 0.6154 0.0130 0.0001 0.0010Bald Point 0.9834 0.8028 0.1396 0.0080 0.0024 0.0021Panama City 0.9842 0.8934 0.3564 0.0034 0.0003 0.0014Camp Helen 0.9911 0.8265 0.1398 0.0003 0.0000 0.0012Henderson 0.9952 0.8038 0.0716 0.0002 0.0000 0.0015Okaloosa 0.9959 0.8511 0.1236 0.0002 0.0000 0.0019Grayton 0.9965 0.9329 0.2981 0.0020 0.0000 0.0010Navarre 0.9557 0.7171 0.1212 0.0013 0.0003 0.0019Pensacola 0.9713 0.7891 0.0849 0.0008 0.0002 0.0011Langdon 0.9920 0.8330 0.1011 0.0002 0.0000 0.0010Sandestin 0.9942 0.9148 0.2729 0.0008 0.0001 0.0009Santa Rosa 0.9920 0.7315 0.0317 0.0002 0.0001 0.0012

50
Table 3-9. Mean grain size results (% Passing) of each sieve size measured for northwest
Florida beaches in 2007. 2007 Grain Size (average % Passing for each sieve size)Beach no. 18 no.35 no.60 no.140 no.325 panCape Natural 1.0009 0.9908 0.6602 0.0025 0.0001 -0.0023Cape Nourished 0.9944 0.9774 0.4786 0.0012 0.0002 0.0002Alligator Point 0.9913 0.9758 0.6195 0.0084 0.0000 0.0010Bald Point 0.9901 0.8610 0.1820 0.0084 0.0023 0.0019Panama City 0.9764 0.8850 0.3746 0.0043 0.0002 0.0015Camp Helen 0.9925 0.8119 0.1079 0.0002 0.0000 0.0010Henderson 1.0003 0.8909 0.0950 0.0001 0.0000 -0.0007Okaloosa 0.9972 0.8861 0.1293 0.0000 0.0000 0.0010Grayton 0.9987 0.9509 0.2205 0.0009 0.0000 0.0009Navarre 0.9651 0.6804 0.0653 0.0005 0.0002 0.0002Pensacola 0.9770 0.8188 0.0801 0.0005 0.0002 0.0011Langdon 0.9883 0.7784 0.0738 0.0000 0.0000 0.0000Sandestin 0.9937 0.9198 0.2465 0.0005 0.0001 0.0011Santa Rosa 0.9857 0.7297 0.0358 0.0003 0.0001 0.0013 Table 3-10. ASTM standard sieve opening sizes (cm) for sieves used in this study. ASTM Sieve Number Size of Opening (cm)
18 0.135 0.0560 0.025
140 0.0106325 0.0045
51
Table 3-11. Average bulk density (g/cm3), water content, and compaction (Newtons) results for northwest Florida beaches in 2006.
2006 Average ValuesBeach Bulk Density Water Content CompactionCape Natural 1.62 0.20 290.19CapeNourished 1.60 0.13 187.94Alligator Point 1.60 0.23 167.73Bald Point 1.62 0.09 67.21Panama City 1.61 0.06 108.29Camp Helen 1.60 0.06 75.67Henderson 1.61 0.04 62.75Okaloosa 1.61 0.05 71.52Grayton 1.72 0.13 89.80Navarre 1.65 0.04 104.69Pensacola 1.63 0.04 101.87Langdon 1.60 0.06 61.99Sandestin 1.51 0.77 98.58Santa Rosa 1.62 0.05 67.38 Table 3-12. Average bulk density (g/cm3), water content, compaction (Newtons), and shear
resistance results (Newton-meters) for northwest Florida beaches in 2007. 2007 Average ValuesBeach Bulk Density Water Content Compaction Shear ResistanceCape Natural 1.49 0.14 167.37 17.41Cape Nourished 1.60 0.09 76.31 11.45Alligator Point 1.67 0.14 146.50 19.27Bald Point 1.69 0.07 70.19 10.29Panama City 1.65 0.06 105.20 11.00Camp Helen 1.63 0.07 73.42 10.95Henderson 1.63 0.05 58.69 11.21Okaloosa 1.63 0.64 25.09 9.71Grayton 1.70 0.63 70.21 12.81Navarre 1.64 0.64 40.59 14.85Pensacola 1.65 0.63 51.16 11.81Langdon 1.63 0.64 32.21 11.97Sandestin 1.67 0.64 65.50 14.51Santa Rosa 1.67 0.04 53.88 11.33
52
Table 3-13. Average values of all sand properties measured on natural, nourished, and all beaches.
2006 and 2007Bulk Density Water Content Compaction Shear Resistance
All Natural 1.64 0.18 64.60 11.65All Nourished 1.62 0.36 77.25 12.38All beaches 1.63 0.27 70.93 12.02
Value (Dry) Chroma (Dry) Value (Wet) Chroma (Wet)All Natural 7.91 1.03 6.58 1.18All Nourished 7.98 1.05 6.73 1.54All beaches 7.95 1.04 6.66 1.36
1mm 0.5mm 0.25mm 0.106mm and finerAll Natural 0.99 0.83 0.12 0.00All Nourished 0.98 0.84 0.19 0.00All beaches 0.99 0.83 0.15 0.00*Excludes Alligator Point, Bald Point, and Cape San Blas Beaches, which have not yet been nourished.
Average Values
Color
Grain Size (average % Passing for each sieve size)

53
CHAPTER 4 EFFECTS OF DIFFERENCES IN PHYSICAL PROPERTIES OF SAND ON LOGGERHEAD
(CARETTA CARETTA) SEA TURTLE NESTING IN NORTHWEST FLORIDA
Introduction
In oviparous species, the habitat in which eggs are deposited greatly influences the
survival of the offspring and therefore could have significant consequences for the reproductive
success of the adult (MARTIN, 1988, HAYS AND SPEAKMAN ,1993). Marine turtles evolved
secondarily into an aquatic existence and have unique adaptations pertaining to the species-
habitat relationship (EHRHART, 1998). All marine turtles possess modified limbs or flippers that
work nicely for swimming but are poorly suited for terrestrial locomotion; but because marine
turtles have retained an oviparous reproductive strategy, their survival hinges on their ability to
nest terrestrially (PRITCHARD, 1997). Nest site selection is an adaptive compromise between the
cost of searching and the reproductive benefits of selecting a successful site for egg incubation
(WOOD and BJORNDAL, 2000).
Tagging studies reveal that most nesting female loggerheads come back to the same area
in successive nesting seasons and that males and females return to resident foraging areas
between reproductive migrations (LIMPUS et al., 1992). However, adult site fidelity may not
require natal homing. Neophyte nesting females may follow experienced breeders to a nesting
beach and focus on that area for subsequent nesting efforts, a behavior known as social
facilitation (OWENS et al., 1982). Using social facilitation, the nesting beaches in a particular
region would be linked by gene flow, whereas using natural homing, individual nesting colonies
would be genetically isolated by homing behavior (BOLTEN and WITHERINGTON, 2003).
Reproductively active female turtles tend to exhibit nest site fidelity for beaches that over
evolutionary time have possessed characteristics conducive to successful nesting (CARR, 1986,
WITHERINGTON, 1986, BOWEN et al., 1992, WEISHAMPEL et al., 2003). This behavior results in
54
high reproductive success and offspring survival in contrast to random beach selection
(BJORNDAL and BOLTEN, 1992, CRAIN et al., 1995). However, the evolution of a female’s ability
to select or be more drawn to beaches on which their eggs would stand a better chance of
survival has not been demonstrated. Turtles sometimes nest in media that produce zero hatching
success and contain sands that are less than optimal for clutch survival (MORTIMER, 1990).
Therefore, coastal managers should be mindful of the physical characteristics of fill material
used in beach nourishment projects.
Haplotype frequencies of mitochondrial DNA (mtDNA) have been used to determine
how precise natal homing behavior is in loggerhead turtles. Pearce found that most adjacent
beaches do not have significantly different mtDNA haplotype frequencies (2001). However,
study results did resolve three independent clusters of nesting beaches corresponding to the
Florida panhandle (Gulf of Mexico), southern Florida, and northeast Florida, with additional
management units indicated for the Dry Tortugas and possibly Volusia County (north of Cape
Canaveral). Pearce suggests that population partitions are evident in loggerhead nesting habitats
separated by 100+ km of inappropriate nesting habitat, providing an approximate benchmark for
natal site fidelity (2001). Nesting habitats are most likely ephemeral over an evolutionary
timescale, continually arising and disappearing due to changes in the physical environment (sea
level, geography, and beach characteristics), global climate (glacial intervals), and biotic
environment (nest predation or competition for nesting space). Because rookeries are transient
over evolutionary time, absolute natal homing would be a formula for extinction (BOLTEN and
WITHERINGTON, 2003).
A large proportion of sea turtles nests occur on nourished beaches in the United States
(NELSON and Dickerson, 1989), therefore, consideration and careful monitoring in regards to the

55
effects of nourishment practices on these threatened and endangered species is critical to beach
restoration (CRAIN et al., 1995). Typically, in the first season following a nourishment episode,
loggerhead sea turtle (Caretta caretta) nesting success is adversely affected, but a return to near
average levels is usually observed by the second or third season. Nesting success on nourished
and natural beaches is more comparable when the physical characteristics of the beach become
similar (STEINITZ et al., 1998). Hardened sediment can prevent a female sea turtle from
successfully excavating a nest chamber or result in a poorly constructed nest cavity. If nesting
does occur in hardened sediment, embryonic development within a nourished nest cavity can be
adversely affected by insufficient oxygen diffusion and variation in moisture content levels
inside the egg clutch (ACKERMAN, 1980, MORTIMER, 1990, ACKERMAN et al., 1992). The use of
physically compatible fill material is necessary to minimize the detrimental effects of beach
nourishment on sea turtles and their hatchlings.
Beach compaction due to the use of fine-grained sand may make it difficult for a female
to excavate a nest. Conversely, sand that is too coarse could cause the nest to collapse during
excavation (MORTIMER, 1990). Another important factor relevant to nesting success is the
temperature of the sand in which the eggs incubate. The sex of turtle hatchlings is temperature
dependent, with cooler temperatures producing a higher proportion of males and warmer
temperatures producing a higher proportion of females, and the temperature of the incubation
environment is very dependent upon the color of the sediment (MROSOVSKY and YNTEMA, 1980).
Consequently, a nourishment project that utilizes sediment that does not match the natural color
of a particular beach could alter the sex ratio of the hatchlings, which could potentially impact
the future breeding success of already threatened sea turtle species (MILTON et al., 1997).

56
Homing by females designates each nesting colony as a demographically independent
unit having a distinct sex ratio, age class structure, survivorship, and other demographic
characteristics. Male-mediated gene flow does not modify the status of nesting populations as
independent management units. In terms of management implications, it is helpful to consider
the extreme situations: if all females at a nesting colony were killed, mtDNA data indicate that
the nesting colony would die away. If all breeding males in an area were killed, nDNA data
indicate that other males would quickly fill the void. Therefore, nesting populations are still the
fundamental unit of sea turtle management (BOLTEN and WITHERINGTON, 2003).
Florida’s panhandle has low levels of loggerhead nesting relative to other areas within the
state, but these turtles are important in terms of conservation and management because they are
genetically distinct contributors to the overall Florida loggerhead population as mentioned above.
Taken together, data from mitochondrial DNA (mtDNA) and data from nuclear DNA (nDNA)
indicate that females show site fidelity for a particular nesting region in the southeast United
States, while males supply an avenue of gene flow between nesting locations (PEARCE, 2001).
Male-mediated gene flow facilitates strong connections between regional nesting colonies
throughout the southeastern United States, passing on nuclear genes that mediate disease
resistance, response to environmental challenges, and thousands of other key survival traits.
Because of this gene flow, small nesting colonies such as those in the Florida panhandle do not
suffer the bottleneck effects of reduced genetic diversity (PEARCE, 2001). This puts to rest
concerns about inbreeding and any corresponding loss of genetic diversity for this population
(BOLTEN and WITHERINGTON, 2003).

57
The objective of this study was to determine whether differences existed in physical
properties of sand from natural versus nourished beaches, and if any differences observed had an
impact on loggerhead sea turtle nesting in northwest Florida.
Methods
In summer 2006, 27 core soil samples per beach were taken on seven pairs of natural and
nourished beaches along the Florida Panhandle. Compaction measurements were also taken at
each sampling site using a cone penetrometer. Each core sample was dried for 16 hours at 105°C
in a gravity convection oven. Bulk density and water content of samples were calculated.
Samples were transported to Gainesville, FL in an un-iced cooler where they were analyzed on
the basis of color (wet and dry basis) and grain size distribution under laboratory conditions. In
summer 2007, methods of core sampling, compaction reading, and other analyses were repeated
on all beaches. In addition, shear resistance measurements were taken alongside compaction
readings using a digital torque wrench attached to a 2.5 times magnified shear vane developed
for this study which was rotated over a 90 degree angle.
Data on loggerhead sea turtle nest counts, nesting density, false crawls, and hatching
success on the study beaches were obtained from the Florida Marine Research Institute and
examined for patterns that could be related to sand quality and nourishment status. There was
insufficient data for statistical analysis of the sea turtle data, but observations were made about
general trends. Two measures of nesting success were used. The first was nesting density,
which was calculated as the number of nests per kilometer of beach. The second was false crawl
to nest ratio, which was the number of false crawls divided by the number of nests. Two
measures of hatching success were also examined. Hatching success was calculated as the
number of eggs that hatched divided by the total number of eggs in the nest. Emerging success

58
was calculated by subtracting the number of turtles dead in the nest from the number that hatched
before dividing by the total number of eggs in the nest.
Results and Discussion
Differences in physical properties of sand on pairs of natural and nourished beaches were
discussed in Chapter 3 and are summarized in Table 3-4. Table 4-1 shows the 2002 to 2006
loggerhead sea turtle nesting density for all pairs of beaches studied. Figure 4-3 displays these
results graphically. Although nesting density was slightly lower on Panama City beach during
the year of and the year following nourishment, other beaches did not experience this trend.
Also, the lower levels observed on Panama City beach following the nourishment were not
drastically lower than in the years preceding the nourishment. Table 4-2 gives nesting counts for
all beach pairs studied between 2002 and 2006. Data dating back from 2002 indicate that 2006
was not a significantly low “off” year, but that it was instead in keeping with normal nesting
levels for these Florida panhandle beaches. The ratio of false crawls to nests is given in Table 4-
3 and in Figure 4-4. False crawl to nest ratio was higher on Panama City beach during its
nourishment year, but not on other beaches during their nourishment years. The highest false
crawl to nest ratio observed was seen on Langdon beach, a natural, dark, undeveloped beach
where turtles were least likely to be disturbed by human causes. Because of the high and
unexplained variability in false crawl to nest ratios, examining false crawls may not be the best
indicator of sea turtle nesting success on the beaches of northwest Florida. Hatching success is
displayed in Table 4-4 and in Figure 4-1. Lower hatching success was observed on Pensacola
and Panama City beaches during 2005, their nourishment year, but not on Okaloosa Island
during 2004, its nourishment year. Hatching success varied widely among natural beaches,
particularly where nesting counts were very low, but this parameter is important to measure
following a beach nourishment project to ensure that nourishment efforts are not creating a poor

59
incubation environment. Emerging success, which is displayed in Table 4-4 and in Figure 4-2,
was similar to hatching success on all beaches studied. There was also a similar level of
variability among the natural beaches. Emerging success did not appear to be severely lower
than hatching success on any beach; therefore, beach nourishment does not appear to be
contributing to a lower emerging success relative to hatching success on the beaches studied.

60
Table 4-1. Nesting Density of loggerhead sea turtles in northwest Florida from 2002 to 2006. Loggerhead Sea Turtle Nesting Density (# of nests per km of beach)Nourished*/Natural 2002 2003 2004 2005 2006Navarre*/Santa Rosa No Data/0.38 No Data/1.35 0.00/0.96 0.00/0.58 0.00/0.19Pensacola*/Langdon 0.30/0.34 0.44/0.81 0.52/0.58 0.67/0.26 0.52/0.45Panama City*/Camp Helen 0.76/No Data 0.36/0.83 0.97/0.00 0.76/0.83 0.40/1.67Okaloosa*/Henderson 0.07/0.00 0.59/0.45 0.37/0.91 0.74/0.91 0.29/0.45Sandestin*/Grayton 0.88/0.79 0.93/1.05 0.56/1.05 0.50/1.32 0.50/0.00Cape*/Cape 1.33/6.46 2.29/12.29 1.24/10.21 1.14/3.13 0.86/5.00Alligator Point*/Bald Point 1.57/No Data 3.57/1.67 2.71/0.83 1.29/0.00 0.14/1.04 Table 4-2. Nest counts of loggerhead sea turtles in northwest Florida from 2002 to 2006. Loggerhead Sea Turtle Nesting Counts (# of nests)Nourished*/Natural 2002 2003 2004 2005 2006Navarre*/Santa Rosa No Data/2 No Data/7 0/5 0/3 0/1Pensacola*/Langdon 4/13 6/31 7/22 9/10 7/17Panama City*/Camp Helen 21/No Data 10/1 27/0 21/1 11/2Okaloosa*/Henderson 1/0 8/1 5/2 10/2 4/1Sandestin*/Grayton 33/3 35/4 21/4 19/5 19/0Cape*/Cape 14/31 24/59 13/49 12/15 9/24Alligator Point*/Bald Point 11/No Data 25/8 19/4 9/0 1/5
Table 4-3. Ratio of false crawls to nests for loggerhead sea turtles in northwest Florida from 2002 to 2006. Loggerhead Sea Turtle False Crawl/Nest Ratio (# of false crawls/# of nests)Nourished*/Natural 2002 2003 2004 2005 2006Navarre*/Santa Rosa No Data/0.50 No Data/0.14 0FC /0.40 1FC /2.00 0FC /0.00Pensacola*/Langdon 0.25/0.69 1.00/1.10 0.71/0.59 0.67/4.40 1.57/3.24Panama City*/Camp Helen 0.62/No Data 1.50/0.00 0.30/ 0FC 1.57/0.00 0.64/0.00Okaloosa*/Henderson 2.00/ 0FC 0.75/0.00 0.40/0.00 0.80/0.50 0.25/2.00Sandestin*/Grayton 0.64/0.33 0.63/0.50 0.52/0.75 1.68/0.40 0.79/ 2FCCape*/Cape 1.43/2.19 1.21/1.49 1.15/1.39 0.75/3.80 1.78/2.96Alligator Point*/Bald Point 1.55/No Data 2.64/0.63 0.95/9.75 2.44/ 7FC 4.00/5.00

61
Table 4-4. Hatching success and emerging success of loggerhead sea turtles in northwest Florida from 2002 to 2005. 2002 2002 2003 2003 2004 2004 2005 2005
Hatching Emerging Hatching Emerging Hatching Emerging Hatching Emerging *Year of LastBeach Success Success Success Success Success Success Success Success NourishmentNavarre* No Data No Data No Data No Data No Nests No Nests No Nests No Nests 2006Santa Rosa 0.93 0.93 0.88 0.88 0.63 0.62 0.95 0.93Pensacola* 0.81 0.81 0.82 0.82 0.80 0.80 0.66 0.66 2005Langdon 0.65 0.65 0.76 0.76 0.71 0.71 0.53 0.53Panama City* 0.83 0.82 0.54 0.53 0.68 0.68 0.16 0.15 2005Camp Helen No Data No Data No Data No Data No Nests No Nests 0.00 0.00Okaloosa* No Data No Data 0.68 0.68 0.96 0.96 0.37 0.37 2004Henderson Beach No Nests No Nests 0.01 0.01 0.90 0.90 0.24 0.24Sandestin* 0.72 0.71 0.65 0.63 0.69 0.68 0.45 0.42 1988Grayton 0.84 0.83 0.14 0.14 0.45 0.44 No Data No DataCape Nourished* 0.68 0.67 0.61 0.60 0.75 0.75 0.48 0.48 Future PlansCapeNatural 0.39 0.36 0.58 0.57 0.33 0.27 No Data No DataAlligator Point* 0.71 0.63 0.63 0.62 0.64 0.64 No Data No Data Future Plans Bald Point No Data No Data 0.78 0.72 0.86 0.86 No Nests No Nests

62
CHAPTER 5 DISCUSSION AND CONCLUSIONS
Because our findings suggest that sand compaction is not linearly correlated with shear
resistance, we conclude that measuring shear resistance as a separate entity from beach
compaction is critical. Measuring shear resistance provides additional information about the
physical condition of sand placed on a beach during nourishment and may offer valuable insights
from a sea turtle conservation management perspective. In order for the shear vane device to be
implemented as a management tool following beach nourishment projects, future studies should
be conducted. Studies should focus on higher density nesting beaches with a goal of obtaining a
tolerable range of shear resistance levels for loggerhead sea turtles, both on the surface and at
depth. If a tolerable range of shear resistance could be determined for nesting sea turtles on
Florida beaches, guidelines could be established to promote a more suitable nesting habitat for
sea turtles on nourished beaches.
Our shear vane device was a more useful tool at depth than on surface sand, particularly on
nourished beaches, where surface readings registered a zero value 93% of the time. These
results may be improved by using a range of different shear vane sizes and perhaps pairing them
with more or less sensitive torque wrenches, depending on the size of the shear vane used. Using
different sized torque wrenches and shear vanes may combat the problem of the lower
detectability limit observed for shear resistance measurements in this study.
Overall, beach nourishment practices in northwest Florida seem to be compatible with
loggerhead sea turtle nesting; and implementing shear resistance measurements as an additional
parameter to examine following a beach nourishment project would provide useful information
to coastal managers. Other properties measured including compaction, bulk density, grain size
distribution, water content, and soil color, also provide useful information and should be

63
included in management protocol following a beach nourishment project. Hatching success and
emerging success seem to be good indicators of the suitability of the incubation environment for
loggerhead sea turtles, while nesting density appears to be a more useful indicator of nesting
success on a particular beach than does the false crawl to nest ratio.

64
LIST OF REFERENCES
ACKERMAN, R.A., 1980. Physiological and ecological aspects of gas exchange by sea turtle eggs. American Zoology, 20, 575-583.
ACKERMAN, R.A., RIMKUS R., and HORTON R., 1992. Hydric structure and climate of natural and renourished sea turtle nesting beaches along the coast of Florida. Tallahassee, Florida: Florida Department of Natural Resources.
ACKERMAN, R.A., 1997. The nest environment and the embryonic development of sea turtles. In: LUTZ, P.L. and MUSICK, J.A. (eds.), The Biology of Sea Turtles. Boca Raton, Florida: CRC Press, Inc., pp. 83-106.
BJORNDAL, K.A. and BOLTEN, A.B., 1992. Spatial distribution of green turtle (Chelonia mydas) nests at Tortuguero, Costa Rica. Copeia, 1992, 45-53.
BOLTEN, A.B. and WITHERINGTON, B.E. (eds.), 2003. Loggerhead Sea Turtles. Washington, D.C.: Smithsonian Books, 319p.
BOWEN, B.W., MEYLAN, A.B., ROSS, J.P., LIMPUS, C.J., BALAZS, G.H., and AVISE, J.C., 1992. Global population structure and natural history of the green turtle (Chelonia mydas) in terms of matriarchal phylogeny. Evolution, 46, 865-881.
BROADWELL, A.L., 1991. Effects of beach nourishment on the survival of loggerhead sea turtles. Boca Raton, Florida: Florida Atlantic University, Master’s thesis, 42p.
BUSTARD, H.R., 1973. Sea turtles: natural history and conservation. New York, New York: Taplinger Publishing Company, 220p.
CARR, A. and OGREN, L., 1960. The ecology and migrations of sea turtles, 4. The green turtle in the Caribbean Sea. Bulletin of American Museum of Natural Hisotry, 121(1), 1-48.
CARR, A., 1986. Rips, FADs, and little loggerheads. Bioscience, 36, 92-100.
CARTHY, R.R., 1996. The role of the eggshell and nest chamber in loggerhead turtle (Caretta caretta) egg incubation. Gainesville, Florida: University of Florida, Ph.D. thesis, 121 pp.
COOPER, H., 1998. Public Notice: Biological Opinion for Panama City Beach Nourishment. U.S. Department of the Interior, Fish and Wildlife Service.
CRAIN, D.A., BOLTEN, A.B., and BJORNDAL, K.A., 1995. Effects of beach nourishment on sea turtles: review and initiatives. Restoration Ecology, 3, 95-104.
DEAN, R.G. 2002. Beach Nourishment: theory and practice. River Edge, New Jersey: World Scientific Publishing Company, Advanced Series on Ocean Engineering, 18, 420p.
DOUGLAS, S.L., 2002. Saving America’s beaches: the causes of and solutions to beach erosion. River Edge, New Jersey: World Scientific Publishing Company, 91p.

65
ECOLOGICAL ASSOCIATES, INC., 1998. FIND Beach Nourishment Project: results of the 1998 sea turtle monitoring, Jupiter Island, Florida. Vero Beach, Florida: Ecological Associates, Inc., Report to Coastal Technology Corp. 26p.
EHRENFELD, D.W., 1970. Biological Conservation. Chicago, Illinois: Holt, Rinehart, and Winston Inc., 219p.
EHRHART, L.M., 1995. The relationship between marine turtle nesting and reproductive success and the beach nourishment project at Sebastian Inlet, Florida, in 1994. Melbourne, Florida: University of Central Florida, Technical Report to the Florida Institute of Technology, 55p.
EHRHART, L.M. 1998. Habitat protection revisited: debunking the Noah solution. In: Epperly, S.P. and Braun, J. (compilers), Proceedings of the Seventeenth Annual Sea Turtle Symposium. NOAA Technical Memorandum NMFS-SEFSC-415, 46-49.
EHRHART, L.M., and HOLLOWAY-ADKINS, K.G., 2000. Marine Turtle Nesting and Reproductive Success at Patrick Air Force Base; Summer, 2000. Orlando, Florida: University of Central Florida, Final Report to US Air Force Eastern Space and Missile Center; Patrick Air Force Base, Florida, 45p.
EHRHART, L.M. and RAYMONd, R.W., 1983. The effects of beach restoration on marine turtles nesting in South Brevard County, Florida. Jacksonville, Florida: U.S. Army Corps of Engineers, 47p.
EHRHART, L.M. and ROBERTS, K.A., 2001. Marine Turtle Nesting and Reproductive Success at Patrick Air Force Base; Summer, 2001. Orlando, Florida: University of Central Florida, Final Report to US Air Force Eastern Space and Missile Center; Patrick Air Force Base, Florida, 58p.
ELE INTERNATIONAL, 2004. Operating Instructions, Proving Ring Penetrometer, Model 29-3739 (CN-970). Loveland, Colorado: ELE International, Inc., 8p.
FLETEMEYER, J., 1981. Sea turtle monitoring project. Fort Lauderdale, Florida: Report to Broward County Environmental Quality Control Board, 82p.
HANSON, J.; WIBBELS, T., and MARTIN, R.E., 1998. Predicted female bias in sex ratios of hatchling loggerhead sea turtles from a Florida nesting beach. Canadian Journal of Zoology, 76, 1850-1861.
HAYS, G.C. and SPEAKMAN, J.R., 1993. Nest placement by loggerhead turtles, Caretta caretta. Animal Behavior, 45(1), 47-53.
HENDRICKSON, J.R., 1982. Nesting behavior of sea turtles with emphasis on physical and behavioural determinants of nesting success or failure. In: Bjorndal, K.A. (ed.) Biology and Conservation of Sea Turtles. Washington, D.C.: Smithsonian Institution Press, pp. 53-57.
66
HUGHES, G.R., 1974. The sea turtles of southeast Africa. 1. Status, morphology, and distribution. Oceanographic Research Institution Investigative Republic of Durban, 35, 1-144.
JOHANNES, R.E. and RIMMER, D.W., 1984. Some distinguishing characteristics of nesting beaches of the green turtle Chelonia mydas on North West Cape Peninsula, Western Australia. Marine Biology, 83, 149-154.
JONES, S.R. and MANGUN, W.R., 2001. Beach Nourishment and Public Policy after Hurricane Floyd: Where do we go from here? Ocean & Coastal Management, 44 (2001), 207-220.
KRIEBEL, D.L., WEGGEL, J.R.J., and DALRYMPLE, R.A., 2003. Independent Coastal Engineering Study of Canaveral Harbor and the Brevard County Shore Protection Project. In: Tait, L.S. (compiler), Proceedings of the Sixteenth Annual National Conference on Beach Preservation Technology, Tallahassee, Florida.
LIMPUS, C.J., MILLER, J.D., PARMENTER, C.J., REIMER, D., MCLACHLAN, N., and WEBB, R., 1992. Migration of green (Chelonia mydas) and loggerhead (Caretta caretta) turtles to and from eastern Australian rookeries. Wildlife Research 19:347-358.
LUCAS, L. and PARKINSON, R., 2002. Rationale for evaluation the design and function of monitoring programs undertaken in association with the nourishment of Florida’s marine turtle nesting beaches. In: Mosier, A., Foley, A., and Brost, B. (compilers). Proceedings of the Twentieth Annual Symposium on Sea Turtle Biology and Conservation. Orlando, Florida: NOAA Technical Memorandum NMFS-SEFSC-477, 77-79.
MAKOWSKI, C. and RUSENKO, K., 2007. Recycled glass cullet as an alternative beach fill material: results of biological and chemical analyses. Journal of Coastal Research. 23(3) 545-552.
MANN, T.M., 1978. Impacts of developed coastline on nesting and hatchling sea turtles in southeastern Florida. Florida Marine Research Publication, 33, 53-55.
MARTIN, T.E., 1988. Nest placement: implications for selected life-history traits, with special reference to clutch size. American Naturalist, 132, 900-910.
MCGEHEE, M.A., 1979. Factors affecting the hatching success of loggerhead sea turtle eggs: (Caretta caretta caretta). Orlando, Florida: University of Centeral Florida, Master’s thesis, 252p.
MILLER, J.D., LIMPUS C.J., and GODFREY M.H., 2003. Nest site selection, oviposition, eggs, development, hatching, and emergence of loggerhead turtles. In: BOLTEN, A.B. and WITHERINGTON, B.E. (eds.), 2003. Loggerhead Sea Turtles. Washington, D.C.: Smithsonian Books, pp.125-143.
MILTON, S.L., SHULMAN, A.A., and LUTZ, P.L., 1997. The effect of beach renourishment with aragonite versus silicate sand on beach temperature and loggerhead sea turtle nesting success. Journal of Coastal Research, 13, 904-915.

67
MIZZI, J., 2005. Hurricane Ivan Emergency Beach Restoration. Panama City, Florida: Federal Emergency Management Agency.
MORREALE, S.J., RUIZ, G.J., SPOTILA, J.R., and STANDORA, E.A., 1982. Temperature dependent sex determination: current practices threaten conservation of sea turtles. Science, 216, 1245-1247.
MORTIMER, J.A., 1982. Factors influencing beach selection by nesting sea turtles. In: Bjorndal, K.A. (ed.) Biology and Conservation of Sea Turtles. Washington, D.C.: Smithsonian Institution Press, pp. 45-51.
MORTIMER, J.A., 1990. The influence of beach sand characteristics on the nesting behavior and clutch survival of green turtles (Chelonia mydas). Copeia, 1990, 802-817.
MROSOVSKY, N. and PROVANCHA, J., 1989. Sex ratio of hatchling loggerhead sea turtles hatching on a Florida beach. Canadian Journal of Zoology, 67, 2533-2539.
MROSOVSKY, N. and PROVANCHA, J., 1992. Sex ratio of hatchling loggerhead sea turtles: data and estimates from a 5-year study. Canadian Journal of Zoology, 70, 530-538.
MROSOVSKY, N. and YNTEMA, C.L., 1980. Temperature dependence of sexual differentiation in sea turtles: implications for conservation practices. Biological Conservation, 18, 271-280.
MROSOVSKY, N., BAPTISTOTTE, C., and GODFREY, M.H., 1998. Validation of incubation duration as an index of the sex ratio of hatchling sea turtles. Canadian Journal of Zoology, 77, 831-834.
MURPHY, T.M., and HOPKINS, S.R., 1984. Aerial and ground surveys of marine turtle nesting beaches in the southeast region. Miami, Florida: Report to U.S. National Marine Fisheries Service, NOAA.
NELSON, D.A. and DICKERSON, D.D., 1989. Comparison of loggerhead sea turtles nesting times on nourished and natural beaches. Vicksburg, Mississippi: U.S. Army Corps of Engineers Waterways Experiment Station.
NELSON, D.A., MAUCK, K.A., and FLETEMYER, J., 1987. Physical effects of beach nourishment on sea turtle nesting, Delray Beach, Florida. Vicksburg, Mississippi: USACE Waterways Experimental Station, Technical Report EL-87-15, 56p.
NEW ZEALAND GEOTECHNICAL SOCIETY, 2001. Guidelines for hand held shear vane test. New Zealand: New Zealand Geotechnical Society, 10p.
OLSEN, E.J. and BODGE, K.R., 1991. The use of aragonite as an alternate source of beach fill in southeast Florida. In: Proceedings of Coastal Sediments ’91, American Society of Civil Engineers (Seattle, Washington), pp. 2130-2145.

68
OWENS, D.W., GRASSMAN, M.A., and HENDRICKSON, J.R., 1982. The imprinting hypothesis and sea turtle reproduction. Herpetologica, 38, 124-135.
PACKARD, G.C. and PACKARD, M.J., 1988. The physiological ecology of reptilian eggs and embryos. In: Gans, C. and Huey, R.B. (eds.), Biology of the Reptilia. Vol. 16, Ecology B. Defense and Life History. New York, New York: Alan R. Liss, pp. 523-605.
PARKINSON, R.W. and BRANTLY, R., 2000. Physical monitoring workshop: survey results and summary. Marine Turtle Newsletter, 89, 17-20.
PEARCE, A.F., 2001. Contrasting population structure of the loggerhead turtle (Caretta caretta) using mitochondrial and nuclear DNA markers. Gainesville, Florida: University of Florida, Master’s Thesis, 72p.
PIATKOWSKI, D., 2002. Effects of beach nourishment on the nesting environment of loggerhead sea turtles (Caretta caretta). Wilmington, North Carolina: University of North Carolina Wilmington, Master’s Thesis, 56p.
PILKEY, O.H., 1991. Coastal erosion. Episodes, 14(1), 46-51.
PRITCHARD, P.C.H., 1997. Evolution, phylogeny, and current status. In: LUTZ, P.L. and MUSICK, J.A. (eds), The Biology of Sea Turtles. Boca Raton, Florida: CRC Press, Inc., pp. 1-28.
PROVANCHA, J.A. and EHRHART, L.M., 1987. Sea turtle nesting trends at Kennedy Space Center and Cape Canaveral Air Force Station, Florida, and relationships with factors influencing nest site selection. In: WITZELL, W.N. (ed.), Ecology of East Florida Sea Turtles, Proceedings of the Cape Canaveral, Florida Sea Turtle Workshop Miami, Florida. 26-27 February 1985, NOAA Technical Report NMFS 53, 33-44.
RAYMOND, P.W., 1984. Effects of beach restoration on marine turtle nesting in south Brevard County, Florida. Orlando, Florida: University of Central Florida, Master’s thesis, 121p.
SOUTHWICK, C.H., 1996. Global ecology in human perspective. New York, New York: Oxford University Press, 392p.
SALMON, M., REINERS, R., LAVIN, C., and WYNEKEN, J., 1995. Behavior of loggerhead sea turtle on an urban beach. I. Correlates of nest placement. Journal of Herpetology, 29, 560-567.
SCHMITT, M.A. and HAINES, A.C., 2003. Beach Nourishment: The Magic Bullet for Georgia's Shore? In: Hatcher, K.J. (ed.), Proceedings of the 2003 Georgia Water Resources Conference. Athens, Georgia: University of Georgia, Institute of Ecology.
SOUTHWICK, C.H., 1996. Global ecology in human perspective. New York, New York: Oxford University Press, 392p.
69
STANYCK, S.E. and ROSS, J.P., 1978. An analysis of sand from green turtle nesting beaches on Ascension Island. Copeia, 1978, 93-99.
STEINITZ, M.J., SALMON M., and WYNEKEN, J., 1998. Beach renourishment and loggerhead turtle reproduction: a seven year study at Jupiter Island, Florida. Journal of Coastal Research, 14, 1000-1013.
STONEBURNER, D.L. and RICHARDSON, J.I., 1981. Observation on the role of temperature in loggerhead turtle nest site selection. Copeia, 1981, 233-241.
WALTON, T.L., 1978. Coastal erosion-some causes and some consequences (with special emphasis on the state of Florida). Marine Technology Society Journal, 12(4), 29-33.
WEISHAMPEL, J.F., BAGLEY, D.A., EHRHART, L.M., and RODENBECK, B.L., 2003. Spatiotemporal patterns of annual sea turtle nesting behaviors along an east central Florida beach. Biological Conservation, 110, 295-303.
WIBBELS, T., MARTIN, R.E., OWENS, D.W., and AMOSS, M.S., 1991. Female-biased sex ratio of immature loggerhead sea turtles inhabiting the Atlantic coastal waters of Florida. Canadian Journal of Zoology, 69, 2973-2977.
WILLIAMS-WALLS, N., O’HARA, J., GALLAGHER, R.M., WORTH, D.F., PEARY, B.D., and WILCOX, J.R., 1983. Spatial and temporal trends of sea turtle nesting on Hutchinson Island, Florida, 1971-1979. Bulletin of Marine Science, 23, 55-66.
WITHERINGTON, B.E., 1986. Human and natural causes of marine turtle clutch and hatchling mortality and their relationship to hatchling production on an important Florida nesting beach. Orlando, Florida: University of Central Florida, Master’s thesis, 141p.
WITHERINGTON, B.E. 1992. Behavioral responses of nesting sea turtles to artificial lighting. Herpetologica, 48, 31-39.
WOLF, R.E., SHOUP, L.P., and PYLES, W.T., 1986. 1986 sea turtle protection and nest monitoring program report. Boca Raton, Florida: City of Boca Raton Monitoring Report, 33p.
WOOD, D. and BJORNDAL, K.A., 2000. Relation of temperature, moisture, salinity, and slope to nest site selection in loggerhead sea turtles. Copeia, 2000, 119-128.
70
BIOGRAPHICAL SKETCH
As a child, Lori always had a deep appreciation for the beauty and uniqueness of the
world’s oceans. At age 12, she became a certified scuba diver with her dad, and over the years
she has become passionate about conserving the underwater environment and its inhabitants. In
2004, Lori was a sea turtle intern for the Bald Head Island Conservancy in North Carolina. That
same year, Dr. Dean Hesterberg, a soil scientist at N.C. State University, allowed her to work in
his lab on an undergraduate research project and subsequently helped her develop a second
project aimed at examining effects of beach nourishment on sea turtles. His efforts were
probably the driving force behind Lori’s desire to pursue a career in science. Lori received
undergraduate degrees in biological sciences and botany from North Carolina State University in
2005 and began applying to graduate schools with the hope of landing a sea turtle project. Dr.
Ray Carthy responded to her request and has provided outstanding mentoring and guidance
throughout her tenure at the University of Florida. Upon graduation, Lori will be seeking
employment in her field and hopes to make a positive difference in the future of our natural
resources.