assessment of current standards for evaluation of shear frp
TRANSCRIPT

Assessment of current standards for evaluation of shear FRP strengthening of concrete beams
Erasmus Mundus Programme
ADVANCED MASTERS IN STRUCTURAL ANALYSIS OF MONUMENTS AND HISTORICAL CONSTRUCTIONS i
DECLARATION
Name: Jaime Hernán González Libreros
Email: [email protected]
Title of the
Msc Dissertation:
Assessment of current standards for evaluation of FRP Strengthening of
concrete beams
Supervisor(s): Prof. Carlo Pellegrino
Year: 2010
I hereby declare that all information in this document has been obtained and presented in accordance
with academic rules and ethical conduct. I also declare that, as required by these rules and conduct, I
have fully cited and referenced all material and results that are not original to this work.
I hereby declare that the MSc Consortium responsible for the Advanced Masters in Structural Analysis
of Monuments and Historical Constructions is allowed to store and make available electronically the
present MSc Dissertation.
University: University of Padova
Date: July 21st, 2010
Signature:
___________________________

Assessment of current standards for evaluation of shear FRP strengthening of concrete beams
Erasmus Mundus Programme
ii ADVANCED MASTERS IN STRUCTURAL ANALYSIS OF MONUMENTS AND HISTORICAL CONSTRUCTIONS
This page is left blank on purpose.

Assessment of current standards for evaluation of shear FRP strengthening of concrete beams
Erasmus Mundus Programme
ADVANCED MASTERS IN STRUCTURAL ANALYSIS OF MONUMENTS AND HISTORICAL CONSTRUCTIONS iii
ACKNOWLEDGEMENTS
I would like to acknowledge the financial support of the European Commission to carry on this Master.
I also would like to express my gratitude to my thesis supervisor Professor Carlo Pellegrino for his help
and advice during the execution of this document. I want to thank to the academic and administrative
staff at the Czech University in Prague, the University of Minho and at the University of Padua.
I want to thank my classmates for all the great memories and for making this year so interesting.
Finally, I have to highlight the importance of the support giving by my family during my stay abroad.

Assessment of current standards for evaluation of shear FRP strengthening of concrete beams
Erasmus Mundus Programme
iv ADVANCED MASTERS IN STRUCTURAL ANALYSIS OF MONUMENTS AND HISTORICAL CONSTRUCTIONS
This page is left blank on purpose.

Assessment of current standards for evaluation of shear FRP strengthening of concrete beams
Erasmus Mundus Programme
ADVANCED MASTERS IN STRUCTURAL ANALYSIS OF MONUMENTS AND HISTORICAL CONSTRUCTIONS v
ABSTRACT
The strengthening of structures with FRP composites has become an important alternative for the
retrofitting of structures. However, it has been shown that the equations proposed by current
standards still need to be validated in order to obtain more reliable formulations for the design. In this
paper, the improvement of an existing database of experimental data for beams strengthened with
externally bonded FRP for shear is carried out in order to compare those results with the ones
predicted by the recommendations given by the ACI 440, the fib BULLETIN 14 and the CNR-DT 200.
The evaluation of these codes is made based on the correlation between the experimental and the
theoretical data and the structural level of safety obtained by the use of the codes. In addition, the
model proposed by Pellegrino and Modena (2008) is assessed, comparing its performance to the
selected codes. The evaluation of the codes showed that their recommendations should be improved
and updated, especially for beams including shear steel reinforcement. The Pellegrino and Modena
model proved to usually have a better behavior than the codes for beams with and with shear steel
reinforcement.
Keywords: FRP composites, shear strengthening, concrete beams, design codes, safety factor,
correlation factor.

Assessment of current standards for evaluation of shear FRP strengthening of concrete beams
Erasmus Mundus Programme
vi ADVANCED MASTERS IN STRUCTURAL ANALYSIS OF MONUMENTS AND HISTORICAL CONSTRUCTIONS
This page is left blank on purpose.
Assessment of current standards for evaluation of shear FRP strengthening of concrete beams
Erasmus Mundus Programme
ADVANCED MASTERS IN STRUCTURAL ANALYSIS OF MONUMENTS AND HISTORICAL CONSTRUCTIONS vii
RIASSUNTO
“Analisi delle normative vigenti per la valutazione del rinforzo a taglio di travi in calcestruzzo mediante
FRP”
Il rinforzo delle strutture con materiali compositi FRP è diventata una importante alternativa per
l'adeguamento delle strutture. E’ stato, tuttavia, dimostrato che le equazioni proposte dalle normative
vigenti devono ancora essere convalidate in modo da ottenere formulazioni più affidabili per la
progettazione. In questa relazione viene effettuato il miglioramento di un database esistente
contenente dati sperimentali riguardanti travi rinforzate a taglio mediante FRP applicati esternamente,
al fine di confrontare tali risultati con quelli previsti dalle indicazioni fornite dall’ACI 440, dal fib
BULLETIN n.14 e dalle istruzioni CNR-DT 200. La valutazione di queste normative è effettuata sulla
base della correlazione tra i dati sperimentali e quelli teorici e del livello di sicurezza strutturale
ottenuto con l'uso delle normative. Viene, inoltre, valutato il modello proposto da Pellegrino e Modena
(2008), confrontando le sue prestazioni alle norme selezionate. La valutazione delle norme ha
dimostrato che le loro indicazioni dovrebbero essere migliorate e aggiornate, soprattutto per le travi
che contengono armatura a taglio in acciaio. Il modello di Pellegrino e Modena ha dimostrato di avere
solitamente un comportamento migliore di quello delle normative per travi con o senza armatura a
taglio in acciaio.
Parole chiave: materiali compositi FRP, rinforzo a taglio, travi di cemento, norme per la progettazione,
fattore di sicurezza, fattore di correlazione.

Assessment of current standards for evaluation of shear FRP strengthening of concrete beams
Erasmus Mundus Programme
viii ADVANCED MASTERS IN STRUCTURAL ANALYSIS OF MONUMENTS AND HISTORICAL CONSTRUCTIONS
This page is left blank on purpose.

Assessment of current standards for evaluation of shear FRP strengthening of concrete beams
Erasmus Mundus Programme
ADVANCED MASTERS IN STRUCTURAL ANALYSIS OF MONUMENTS AND HISTORICAL CONSTRUCTIONS ix
RESUMEN
“Estudio de códigos utilizados para la evaluación del reforzamiento a cortante de vigas de concreto
utilizando FRP”
El reforzamiento de estructuras con materiales compuestos tipo FRP se ha convertido en una
alternativa importante para el mejoramiento de las estructuras. Sin embargo, se ha demostrado que
las ecuaciones propuestas por los códigos actuales necesitan ser validadas para obtener
formulaciones más confiables para el diseño. En este documento, el mejoramiento de una base de
datos experimentales de vigas de concreto reforzadas a cortante con materiales FPR se llevo a cabo
con el fin de comparar estos resultados con los que se obtienen con las recomendaciones de los
códigos ACI 440, el fib BULLETIN 14 y el CNR-DT 200. La evaluación de estos códigos se hizo con
base a la correlación entre los datos experimentales y teóricos además del nivel de seguridad
alcanzado con su uso. Adicionalmente, el modelo propuesto por Pellegrino y Modena (2008) es
evaluado y su desempeño es comparado con los códigos seleccionados. La evaluación de los
códigos muestra que sus recomendaciones deberían ser actualizadas y mejoradas, especialmente
para vigas que presentan refuerzo de acero a cortante. El modelo de Pellegrino y Modena, por su
parte, mostro generalmente un mejor comportamiento que los códigos, tanto para vigas con refuerzo
de acero a cortante como para aquellas sin refuerzo.
Palabras clave: Compuestos FRP, reforzamiento a cortante, vigas de concreto, códigos de diseño,
factor de seguridad, factor de correlación.

Assessment of current standards for evaluation of shear FRP strengthening of concrete beams
Erasmus Mundus Programme
x ADVANCED MASTERS IN STRUCTURAL ANALYSIS OF MONUMENTS AND HISTORICAL CONSTRUCTIONS
This page is left blank on purpose.

Assesment of current standards for evaluation of shear FRP strengthening of concrete beams
Erasmus Mundus Programme
ADVANCED MASTERS IN STRUCTURAL ANALYSIS OF MONUMENTS AND HISTORICAL CONSTRUCTIONS xi
Table of Contents
Assessment of current standards for evaluation of shear FRP strengthening of concrete beams
Erasmus Mundus Programme
xii ADVANCED MASTERS IN STRUCTURAL ANALYSIS OF MONUMENTS AND HISTORICAL CONSTRUCTIONS

Assesment of current standards for evaluation of shear FRP strengthening of concrete beams
Erasmus Mundus Programme
ADVANCED MASTERS IN STRUCTURAL ANALYSIS OF MONUMENTS AND HISTORICAL CONSTRUCTIONS xiii
List of Figures
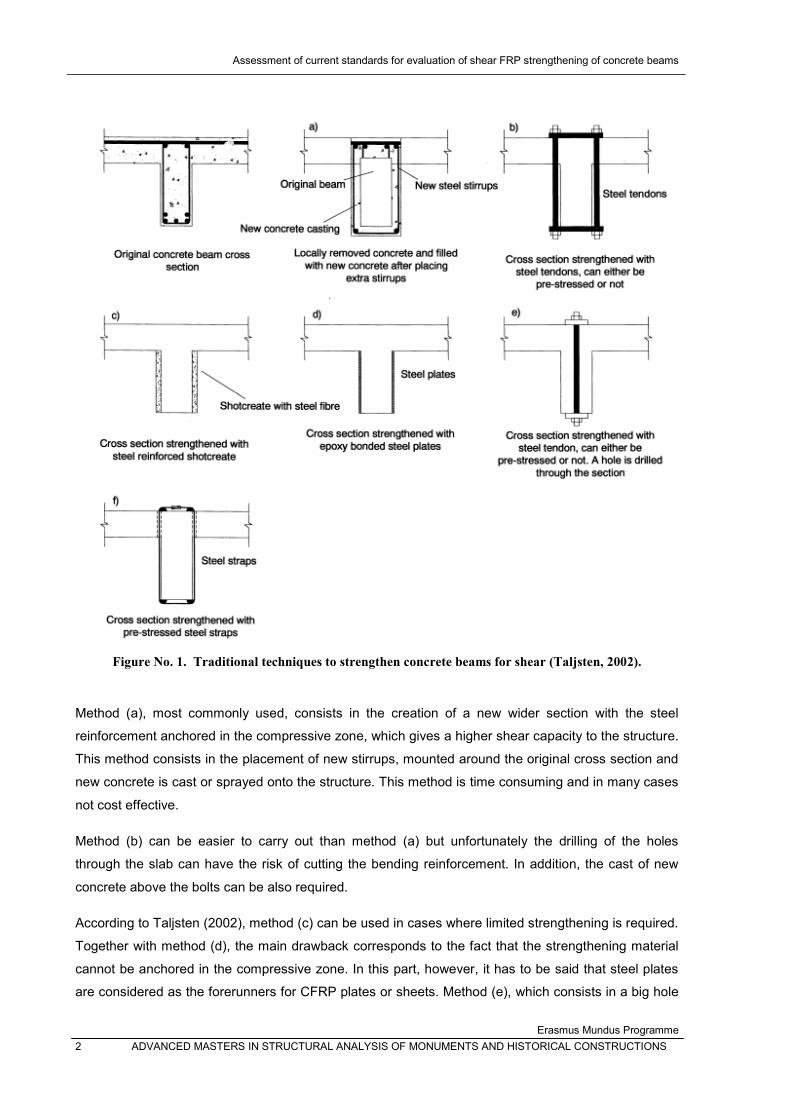
Figure No. 1. Traditional techniques to strengthen concrete beams for shear (Taljsten, 2002). ............2
Figure No. 2. Common externally bonded FRP strengthening configurations (Lima et al, 2007). ..........3
Figure No. 3. Possible arrangements for externally bonded FRP strengthening (Lima et al, 2007). ......4
Figure No. 4. Typical uniaxial tension stress-strain diagrams for different fibers and comparison with
steel. ...................................................................................................................................................... 11
Figure No. 5. Stress-strain relationship for fibers, matrix and FRP. ...................................................... 17
Figure No. 6. Ratio of fe/ fu in terms of fEf according to Khalifa et al (1998). ................................... 23
Figure No. 7. Effective width of FRP for a) U-Jacket and b) Bonded only on two beam sides (Khalifa et
al., 1998). ............................................................................................................................................... 25
Figure No. 8. Comparison of experimental results to the results using the ACI 440 procedure. ......... 27
Figure No. 9. Comparison of experimental results to the equations proposed by Triantafillou and
Antonopoulos (2000). ............................................................................................................................ 30
Figure No. 10. Triantafillou (1998) and Triantafillou and Antonopoulos (2000) model comparisons
(taken from Sas et al (2009)). ................................................................................................................ 32
Figure No. 11. Triantafillou (1998) and Triantafillou and Antonopoulos (2000) model comparisons
(taken from Sas et al (2009)). ................................................................................................................ 33
Figure No. 12. Comparison of experimental and theoretical values for the evaluated codes. ............ 40
Figure No. 13. Comparison of experimental and theoretical values for ACI318M-05 + ACI 440. ....... 40
Figure No. 14. Comparison of experimental and theoretical values for EC2 + FIB Bulletin 14. .......... 41
Figure No. 15. Comparison of experimental and theoretical values for IBC + CNR-DT 200. .............. 41
Figure No. 16. Selection of optimal : Left: Inside range. Right: Outside range. ................................. 44
Figure No. 17. Comparison of experimental and theoretical values for EC2 + FIB Bulletin 14 (optimal
). ........................................................................................................................................................... 44
Figure No. 18. Comparison of experimental and theoretical values for CNR-DT 200 + EC2 or + IBC.
............................................................................................................................................................... 46

Assessment of current standards for evaluation of shear FRP strengthening of concrete beams
Erasmus Mundus Programme
xiv ADVANCED MASTERS IN STRUCTURAL ANALYSIS OF MONUMENTS AND HISTORICAL CONSTRUCTIONS
Figure No. 19. Comparison of experimental and theoretical values for EC2 + CNR-DT 200. ............. 46
Figure No. 20. Comparison of experimental and theoretical values for EC2 + CNR-DT 200 (optimal ).
............................................................................................................................................................... 47
Figure No. 21. Comparison of experimental and theoretical FRP contribution. ................................... 48
Figure No. 22. Comparison of experimental and theoretical values for ACI 440. ................................ 49
Figure No. 23. Comparison of experimental and theoretical values for fib Bulletin 14. ....................... 50
Figure No. 24. Comparison of experimental and theoretical values for CNR-DT 200. ........................ 50
Figure No. 25. Comparison of experimental and theoretical FRP contribution for U-jacket
configuration. ......................................................................................................................................... 52
Figure No. 26. Comparison of experimental and theoretical values for ACI 440. ................................ 52
Figure No. 27. Comparison of experimental and theoretical values for fib BULLETIN 14. .................. 53
Figure No. 28. Comparison of experimental and theoretical values for CNR-DT 200. ........................ 53
Figure No. 29. Comparison of experimental and theoretical FRP contribution for Side bonded
configuration. ......................................................................................................................................... 55
Figure No. 30. Comparison of experimental and theoretical values for ACI 440. ................................ 56
Figure No. 31. Comparison of experimental and theoretical values for fib BULLETIN 14. .................. 56
Figure No. 32. Comparison of experimental and theoretical values for CNR-DT 200. ........................ 57
Figure No. 33. Comparison of experimental and theoretical values for ACI 440 without shear steel
reinforcement. ........................................................................................................................................ 58
Figure No. 34. Comparison of experimental and theoretical values for fib bulletin 14 without shear
steel reinforcement. ............................................................................................................................... 59
Figure No. 35. Comparison of experimental and theoretical values for CNR-DT 200 without shear
steel reinforcement. ............................................................................................................................... 59
Figure No. 36. Comparison of experimental and theoretical values for ACI 440 with and without shear
steel reinforcement. ............................................................................................................................... 60
Figure No. 37. Comparison of experimental and theoretical values for fib bulletin 14 with and without
shear steel reinforcement. ..................................................................................................................... 60

Assesment of current standards for evaluation of shear FRP strengthening of concrete beams
Erasmus Mundus Programme
ADVANCED MASTERS IN STRUCTURAL ANALYSIS OF MONUMENTS AND HISTORICAL CONSTRUCTIONS xv
Figure No. 38. Comparison of experimental and theoretical values for CNR-DT 200 with and without
shear steel reinforcement. ..................................................................................................................... 61
Figure No. 39. Comparison of experimental and theoretical values for ACI 440 without shear steel
reinforcement......................................................................................................................................... 62
Figure No. 40. Comparison of experimental and theoretical values for fib bulletin 14 without shear
steel reinforcement. ............................................................................................................................... 62
Figure No. 41. Comparison of experimental and theoretical values for CNR-DT 200 without shear
steel reinforcement. ............................................................................................................................... 63
Figure No. 42. Comparison of experimental and theoretical values for ACI 440 with and without shear
steel reinforcement. ............................................................................................................................... 64
Figure No. 43. Comparison of experimental and theoretical values for fib bulletin 14 with and without
shear steel reinforcement. ..................................................................................................................... 64
Figure No. 44. Comparison of experimental and theoretical values for CNR-DT 200 with and without
shear steel reinforcement. ..................................................................................................................... 65
Figure No. 45. Typical failure of: Left: U-jacketed and Right: side-bonded beams (Pellegrino and
Modena, 2008). ..................................................................................................................................... 69
Figure No. 46. Forces acting in the cross section of Left: U-jacketed and Right: side-bonded beams
(Pellegrino and Modena, 2008). ............................................................................................................ 69
Figure No. 47. Comparison of experimental and theoretical values for Pellegrino and Modena Model –
Total Shear Strength. ............................................................................................................................ 71
Figure No. 48. Comparison of experimental and theoretical values for Pellegrino and Modena Model –
Vfrp contribution. ..................................................................................................................................... 72
Figure No. 49. Comparison of experimental and theoretical values for Pellegrino and Modena Model
for U-jacket scheme– Vfrp contribution. .................................................................................................. 73
Figure No. 50. Comparison of experimental and theoretical values for Pellegrino and Modena Model
for Side bonded scheme– Vfrp contribution. .......................................................................................... 73

Assessment of current standards for evaluation of shear FRP strengthening of concrete beams
Erasmus Mundus Programme
xvi ADVANCED MASTERS IN STRUCTURAL ANALYSIS OF MONUMENTS AND HISTORICAL CONSTRUCTIONS
List of Tables
Table No. 1. Properties of different types of Matrices. .......................................................................... 10
Table No. 2. Typical properties of fibers. ............................................................................................... 11
Table No. 3. Reduction factors for FRP Shear reinforcement. .............................................................. 21
Table No. 4. Summary of tests used by Khalifa et al (1998). ................................................................ 22
Table No. 5. Summary of tests used by Triantafillou and Antonopoulos (2000). .................................. 29
Table No. 6. Partial safety factors proposed by the fib BULLETIN 14. ................................................. 31
Table No. 7. Comparison of codes based on structural safety. ............................................................ 39
Table No. 8. Comparison of codes based on structural safety. ............................................................ 43
Table No. 9. Comparison of EC2 + fib BULLETIN with constant or varying . ..................................... 45
Table No. 10. Comparison of CNR-DT 200 with IBC or EC2. ............................................................... 47
Table No. 11. Comparison of EC2 + CNR-DT 200 with constant or varying . ..................................... 48
Table No. 12. Comparison of codes for FRP shear contribution based on structural safety. ............... 51
Table No. 13. Comparison of codes for FRP shear contribution for U-jacket configuration. ................ 54
Table No. 14. Comparison of codes for FRP shear contribution for Side bonded configuration. ......... 57
Table No. 15. Comparison of codes for FRP shear contribution with and without shear steel
reinforcement (U-jacket configuration). ................................................................................................. 61
Table No. 16. Comparison of codes for FRP shear contribution with and without shear steel
reinforcement (Side bonded configuration). .......................................................................................... 65
Table No. 17. Overall comparison of the codes. ................................................................................... 66
Table No. 18. Assessment of Pellegrino and Modena Model for Total Shear Strength. ....................... 71
Table No. 19. Assessment of Pellegrino and Modena Model for Vfrp Contribution. ............................... 74

Assesment of current standards for evaluation of shear FRP strengthening of concrete beams
Erasmus Mundus Programme
ADVANCED MASTERS IN STRUCTURAL ANALYSIS OF MONUMENTS AND HISTORICAL CONSTRUCTIONS 1
1. INTRODUCTION
The retrofit of existing reinforced and prestressed concrete structures has always been a crucial field
where Civil engineering has to give solutions. Despite of the natural aging and damage of structures
and materials, there are many other reasons that make necessary the structural intervention such as:
To eliminate structural problems or distress which result from unusual loading or exposure
conditions, inadequate design or poor construction practice.
To be conform to current codes and standards.
To allow the feasibility of changing the use of a structure to accommodate a different use from
the present one.
Environmental effects.
Lack of preservation of the structure.
Random loading or fire and impact effects.
This need for renovation and rehabilitation of structures has lead to seek of a new generation of
materials which can make the intervention easier and more effective. Fiber reinforced polymers (FRP)
belong to this new generation of materials. The ways of retrofitting with those materials can be divided
into categories. The first is related to the externally bonded FRP (EBR) usually in the form of laminated
or roving and second the near surface mounted (NSM), into superficial structural members’ grooves,
FRPs in the form of bars or laminates.
The use of externally bonded fiber reinforced polymer reinforcement to strengthen reinforced concrete
structures is becoming an increasingly popular retrofit technique. The light weight and formability of
FRP reinforcement makes the system easy to install. In addition, these materials are an excellent
option for external reinforcement due to properties that make them noncorrosive, nonmagnetic and,
generally, resistant to chemicals.
The strengthening with externally bonded FRP sheets has been applied to many types of reinforced
concrete elements or structures such as columns, beams, slabs, walls, chimneys, tunnels and silos.
The use of FRP reinforcement is generally divided as flexural strengthening, improving the
confinement and ductility of compression members, and shear strengthening.
1.1. Types of traditional shear strenghtening
In general, as presented by Taljsten (2002), six different traditional methods to strengthen concrete
beams for shear can be recognized as shown in Figure No. 1.
Assessment of current standards for evaluation of shear FRP strengthening of concrete beams
Erasmus Mundus Programme
2 ADVANCED MASTERS IN STRUCTURAL ANALYSIS OF MONUMENTS AND HISTORICAL CONSTRUCTIONS
Figure �o. 1. Traditional techniques to strengthen concrete beams for shear (Taljsten, 2002).
Method (a), most commonly used, consists in the creation of a new wider section with the steel
reinforcement anchored in the compressive zone, which gives a higher shear capacity to the structure.
This method consists in the placement of new stirrups, mounted around the original cross section and
new concrete is cast or sprayed onto the structure. This method is time consuming and in many cases
not cost effective.
Method (b) can be easier to carry out than method (a) but unfortunately the drilling of the holes
through the slab can have the risk of cutting the bending reinforcement. In addition, the cast of new
concrete above the bolts can be also required.
According to Taljsten (2002), method (c) can be used in cases where limited strengthening is required.
Together with method (d), the main drawback corresponds to the fact that the strengthening material
cannot be anchored in the compressive zone. In this part, however, it has to be said that steel plates
are considered as the forerunners for CFRP plates or sheets. Method (e), which consists in a big hole

Assesment of current standards for evaluation of shear FRP strengthening of concrete beams
Erasmus Mundus Programme
ADVANCED MASTERS IN STRUCTURAL ANALYSIS OF MONUMENTS AND HISTORICAL CONSTRUCTIONS 3
is drilled through the cross section and then a steel tendon, pre-stressed or not, is cast. The main
drawbacks correspond to the ones exposed for method (b).
Method (f) consists in steel straps wrapped around the section. This method requires small damage in
the cross section but the straps are sensitive to impact loads or vandalism.
1.2. Strengthening with FRP
Up to now, FRP has been used for strengthening of reinforced concrete structures in thousands of
applications worldwide. If compared to the adoption of steel jackets or epoxy bonded steel plate, the
FRP strengthening shows several advantages: the work with heavy steel parts is avoided, such as all
the risks related to the corrosion. Compared to the adoption of the concrete jackets, the FRP systems
avoid effects such as an undesirable increase of stiffness and weight.
For elements with shear resistance deficiencies, a higher load carrying capacity can be achieved by
bonding the FRP reinforcement systems with the fibers as orthogonal as practically possible to the
critical shear crack plane for an optimal configuration, or with the fibers perpendicular to the beam axis
for a more practical setting. Common configurations of strengthening are shown in Figure No. 2 (Lima
et al, 2007). They include full wrapping of the cross section (a, W) which corresponds to the most
efficient scheme but it is most commonly used in columns where access to all four sides of the column
is usually available. In beams applications, where an integral slab makes it impractical to completely
wrap the member the shear strength can be improved by wrapping the FRP system around three
sides of the member (U jacketing, U), b) or bonding to the two sides of the member (side bonding, S,
c). Additional mechanical anchorage systems can be provided to enhance the behavior of U jacketing
or side bonded configurations where the available bond length is short (d and e). Although all the three
techniques have been shown to improve the shear strength of a member, completely wrapping the
section is the most efficient followed by the U-jacketing (ACI 440). It is important to highlight that for U-
jacketing of rectangular or T-section beam, delamination of the end portions of the FRP reinforcement
can be avoided by using laminates/sheets and/or bars installed in the direction of the member
longitudinal axis. In such case, the behavior or the U-wrap strengthening can be considered as
equivalent to that of a completely wrapped member, provided that the effectiveness offer by these
devices is proven (CNR-DT 200).
Figure �o. 2. Common externally bonded FRP strengthening configurations (Lima et al, 2007).
Assessment of current standards for evaluation of shear FRP strengthening of concrete beams
Erasmus Mundus Programme
4 ADVANCED MASTERS IN STRUCTURAL ANALYSIS OF MONUMENTS AND HISTORICAL CONSTRUCTIONS
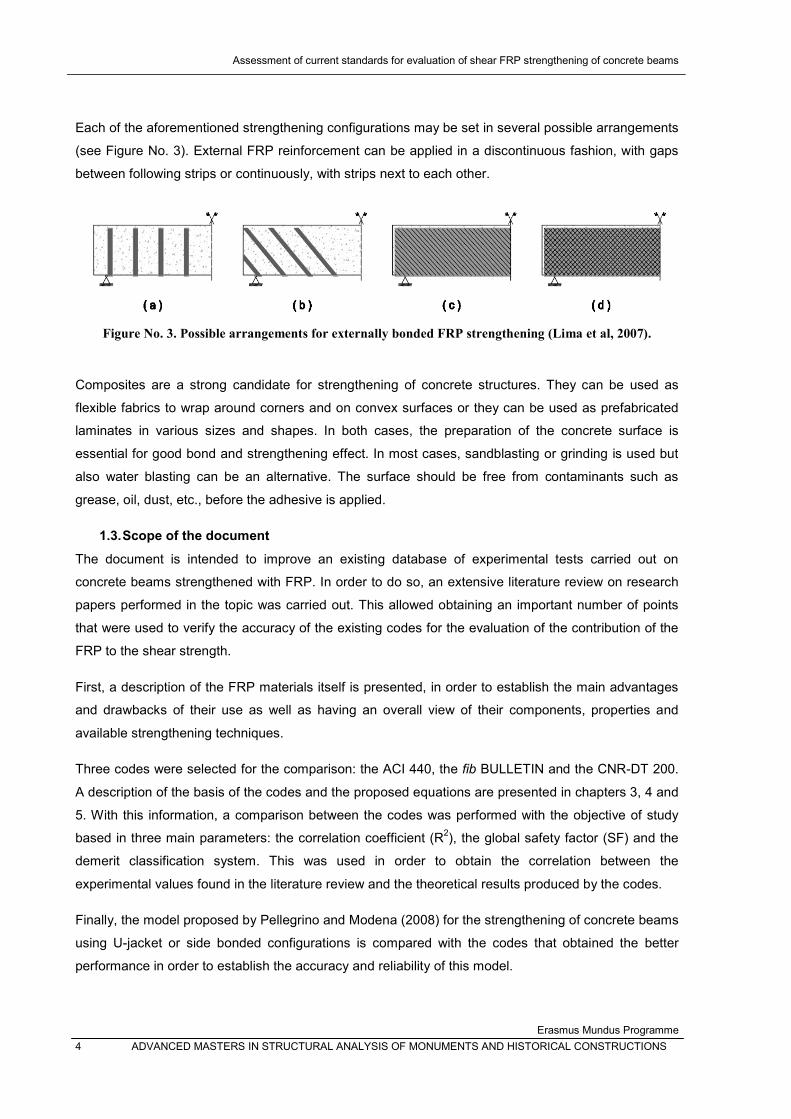
Each of the aforementioned strengthening configurations may be set in several possible arrangements
(see Figure No. 3). External FRP reinforcement can be applied in a discontinuous fashion, with gaps
between following strips or continuously, with strips next to each other.
Figure �o. 3. Possible arrangements for externally bonded FRP strengthening (Lima et al, 2007).
Composites are a strong candidate for strengthening of concrete structures. They can be used as
flexible fabrics to wrap around corners and on convex surfaces or they can be used as prefabricated
laminates in various sizes and shapes. In both cases, the preparation of the concrete surface is
essential for good bond and strengthening effect. In most cases, sandblasting or grinding is used but
also water blasting can be an alternative. The surface should be free from contaminants such as
grease, oil, dust, etc., before the adhesive is applied.
1.3. Scope of the document
The document is intended to improve an existing database of experimental tests carried out on
concrete beams strengthened with FRP. In order to do so, an extensive literature review on research
papers performed in the topic was carried out. This allowed obtaining an important number of points
that were used to verify the accuracy of the existing codes for the evaluation of the contribution of the
FRP to the shear strength.
First, a description of the FRP materials itself is presented, in order to establish the main advantages
and drawbacks of their use as well as having an overall view of their components, properties and
available strengthening techniques.
Three codes were selected for the comparison: the ACI 440, the fib BULLETIN and the CNR-DT 200.
A description of the basis of the codes and the proposed equations are presented in chapters 3, 4 and
5. With this information, a comparison between the codes was performed with the objective of study
based in three main parameters: the correlation coefficient (R2), the global safety factor (SF) and the
demerit classification system. This was used in order to obtain the correlation between the
experimental values found in the literature review and the theoretical results produced by the codes.
Finally, the model proposed by Pellegrino and Modena (2008) for the strengthening of concrete beams
using U-jacket or side bonded configurations is compared with the codes that obtained the better
performance in order to establish the accuracy and reliability of this model.
Assesment of current standards for evaluation of shear FRP strengthening of concrete beams
Erasmus Mundus Programme
ADVANCED MASTERS IN STRUCTURAL ANALYSIS OF MONUMENTS AND HISTORICAL CONSTRUCTIONS 5
As final remark, it has to be said that the equations are presented in the units of the codes, unless
otherwise specified. The name and symbols of the variables used correspond to the ones used in the
codes or articles investigated but in the required cases, the correspondence with the variables of the
other codes is introduced.

Assessment of current standards for evaluation of shear FRP strengthening of concrete beams
Erasmus Mundus Programme
6 ADVANCED MASTERS IN STRUCTURAL ANALYSIS OF MONUMENTS AND HISTORICAL CONSTRUCTIONS

Assesment of current standards for evaluation of shear FRP strengthening of concrete beams
Erasmus Mundus Programme
ADVANCED MASTERS IN STRUCTURAL ANALYSIS OF MONUMENTS AND HISTORICAL CONSTRUCTIONS 7
2. FIBER REINFORCED POLYMERS (FRP)
FRP is a composite material generally consisting of carbon (CFRP), aramid (AFRP) or glass (GFRP)
fibers with a sufficient aspect ratio (length to thickness) to provide a reinforcing function in one or more
directions when combined with a polymeric matrix (either thermosetting or thermoplastic). One of the
main differences of FRP with traditional materials as steel or aluminum is its anisotropy, understood as
uniform properties in the direction of the applied load. This means that FRP composite properties are
directional, implying that the best performance of the fibers is achieved in the direction of the
placement. Taking this is into account, composites can be assumed as similar to reinforced concrete
where the rebar is embedded in an isotropic matrix called concrete (Megalooikonomou, 2007).
In this part, it is important to notice that the FRPs are made at least of two materials than can be easily
distinguishable which present different physical and mechanical properties. As consequence, the FRP
produced will exhibit different properties from those of its constituents (see 2.6). Besides the resins
(matrices) and reinforcements (fibers), FRP can contain fillers and additives. Each of these constituent
materials or ingredients plays an important role in the processing and final performance of the end
product. The resin or polymer (matrix) is the glue that holds the composite together and influences the
physical properties of the end product. The reinforcement provides the mechanical strength; the fillers
and additives are used during the process as performance aids to impart special properties to the end
product.
For the strengthening of civil structures, FRPs are available mainly in form of thin unidirectional strips
made by pultrusion and flexible sheets or fabrics, made of fibers respectively in one or at least two
directions.
The selection of the materials to use is a critical step in the FRP realization. Fibres and resins have to
be studied so that they can work properly together. It has to be taken into account that a good resin for
a kind of fiber will not be necessary good for another and even though the fiber and resin work well
together, the bonding to the concrete is not automatically guarantied.
The main advantages that FRPs offer when they are compared to traditional strengthening techniques
are summarized here:
High tensile strength.
Low weight and high strength-to-weight ratio.
Directional strength.
High impact strength.
Low maintenance.
Easy installation procedures.

Assessment of current standards for evaluation of shear FRP strengthening of concrete beams
Erasmus Mundus Programme
8 ADVANCED MASTERS IN STRUCTURAL ANALYSIS OF MONUMENTS AND HISTORICAL CONSTRUCTIONS
High durability (no corrosion) and tensile strength.
Electromagnetic permeability
Practically unlimited availability in terms of geometry and size.
Easy application in confined space, due to the small thickness of the fibers.
However the composites also present disadvantages that can be neglected such as:
Need of protection against fire and ultraviolet rays.
Need of specialized technicians.
Cannot be anchored.
Linear elastic behavior (material without ductility).
The cost of materials for retrofitting can be several times higher than that for traditional
methods.
Some FRP materials have incompatible thermal expansion coefficients with concrete and
masonry.
Reduction of tensile strength and Young modulus when they are under continuous drench or
alkaline environment.
Bonding problems which can lead to premature fragile collapse of the retrofitted member due
to a mechanism known as debonding.
In addition to the limitations listed before, the thermal expansion coefficient represents an important
factor that has to be taken into account. For standard FRP materials this value is very low and,
although this characteristic can be positive when the polymers are used alone, it can become a
problem when FRP and RC are incompatible and their exposure to high temperature, such a fire
event, can result in a premature deterioration of the materials, detachments and possible collapse.
2.1. Matrices
As it was said before, for a structural composite material, the matrix is usually a polymer which can be
either thermosetting type or thermoplastic type, with the first being the most common one (Caicedo,
2007). The main functions of the matrices consist in protecting the fibers against abrasion or
environmental corrosion, to bind the fibers and to distribute the load. The matrix has an important
influence in some mechanical properties of the composite such as the transverse modulus and
strength, and the shear and compression properties. Physical and chemical characteristics of the
matrix such as melting or curing temperatures, viscosity and reactivity with fibres influence the choice
of the fabrication process. Hence, proper selection of the matrix material for a composite system
requires that all these factors be taken into account.

Assesment of current standards for evaluation of shear FRP strengthening of concrete beams
Erasmus Mundus Programme
ADVANCED MASTERS IN STRUCTURAL ANALYSIS OF MONUMENTS AND HISTORICAL CONSTRUCTIONS 9
The main advantages of thermosetting resins include low viscosity that allows for a relative easy fiber
impregnation, good adhesive properties, room temperature, etc. the drawbacks, in the other hand, are
a limited range of operating temperatures, with the upper bound limit given by the glass transition
temperature, poor toughness with respect to fracture and sensitivity to moisture during field
applications.
Epoxy resins, polyester and vinyl ester are the most common polymeric matrix materials used with
high performance reinforcing fibers. A description of their main features is given below.
2.1.1. Epoxy resins
Epoxy resins have a well-established record in a wide range of composite parts, structures and
concrete repair. A major benefit of epoxy resins over unsaturated polyester resins is their lower
shrinkage but also have an outstanding durability but are in general more expensive. In order to
achieve specific performance features, epoxy resins can be formulated with different materials or
blended with other epoxy resins. Different hardeners, used to controlled the cure rates in order to
match process requirements, give different properties to the finished composite.
Epoxies are used primarily for fabricating high performance composites with superior mechanical
properties, resistance to corrosive liquids and environments, superior electrical properties, good
performance at elevated temperatures, good adhesion to a substrate, or a combination of those
benefits (Megalooikonomou, 2007). However, they don’t have particularly good UV resistance. For
operating temperatures higher than 60°C, the resin should be suitably selected by taking into account
the variations of its mechanical properties. There are usually no significant restrictions for the minimum
operating temperature.
2.1.2. Polyester resins
Polyester resins have a lower viscosity compared to epoxy resins, are very versatile, and highly re-
active. Their mechanical strength and adhesive properties are typically lower than those of epoxy
resins.
The family of polyester resins for composite materials is typically composed of isophthalic,
orhophthalic and bisphenolic resins. For both high temperatures and chemically aggressive aggressive
environment applications, vinylester resins are often used; they represent a compromise between the
performance of traditional polyester resins and that of epoxy resins.
2.1.3. Vinyl ester
Vinyl esters were developed to combine the advantages of epoxy resins with the better handling/faster
cure, which are typical for unsaturated polyester resins. These resins are produced by reacting epoxy
resin with acrylic or methacrylic acid. Vynil esters offer mechanical toughness and excellent corrosion
resistance. These enhanced properties are obtained without complex processing, handling or special
shop fabricating practices that are typical epoxy resins.

Assessment of current standards for evaluation of shear FRP strengthening of concrete beams
Erasmus Mundus Programme
10 ADVANCED MASTERS IN STRUCTURAL ANALYSIS OF MONUMENTS AND HISTORICAL CONSTRUCTIONS
Table No. 1 presents a summary of the mechanical properties of the epoxy , polyester and vinyl ester
matrices.
Table �o. 1. Properties of different types of Matrices.
Matrices Density
Tensile Strenght
Young’s Modulus
Failure Strain
(Kg/m3) (Mpa) (Gpa) (%)
Epoxy 1200-1300 55-130 2.8-4.1 3.0-10.0
Polyester 1100-1460 35-104 2.1-4.1 <5.0
Vinyl ester 1120-1320 73-81 3.0-5.5 3.5-5.5
As final remark, it has to be said that recently, polymer-modified cement-based mortars have also
become available in some applications. It is expected that these mortars will be used more and more
in the near future, due to the benefits in application that come from their inorganic nature.
2.2. Fibers
The primary function of fibers or reinforcements is to carry load along the length of the fibers to provide
strength and stiffness in one direction. Reinforcements can be oriented to provide tailored properties in
the direction of the loads imparted on the end product. Reinforcements can be both natural and man-
made. Many materials are capable of reinforcing polymers. Some materials, such as the cellulose in
wood, are naturally occurring products. Most commercial reinforcements, however, are man-made
such as glass, carbon or aramid fibers. The fibers volume fraction is equal to about 50-70% for the
strips and about 25-35% for the sheets (Peloso, 2003)
Most reinforcements for either thermosetting or thermoplastic resins receive some form of surface
treatments, either during fiber manufacture or as a subsequent treatment. Other materials applied to
fibers as they are produced include resinous binders to hold fibers together in bundles and lubricants
to protect fibers from degradation caused by process abrasion.
As it is possible to note from Figure No. 4, the fibers used for strengthening exhibit higher strength
than steel and a linear elastic behavior up to failure without the yield plateau characteristic of the steel.
It is important to notice that for each material, a range is presented which depends on the high or low
elastic modulus available for the different fibers.
Differently from the steel, the fibers have a high degree of anisotropy, due to the particular, highly
oriented, microstructure involving different behavior changing with the direction of the actions. Table
No. 2 summarizes the principal characteristics, relative to the longitudinal direction for the most
commonly used fibers. It is important to highlight that these values are only indicative of static strength
of unexposed fibers. The design values must account both for the presence of resin in the mixtures
and for the reduction due to long-term loading or environmental exposure.

Assesment of current standards for evaluation of shear FRP strengthening of concrete beams
Erasmus Mundus Programme
ADVANCED MASTERS IN STRUCTURAL ANALYSIS OF MONUMENTS AND HISTORICAL CONSTRUCTIONS 11
Figure �o. 4. Typical uniaxial tension stress-strain diagrams for different fibers and comparison with
steel.
Table �o. 2. Typical properties of fibers.
Material
Elastic Modulus
Tensile strength
Ultimate tensile strain
(kN/mm2) (N/mm2) (%)
Carbon
High strength 215-235 3500-4800 1.4-2.0
Ultra high strength 215-235 3500-6000 1.5-2.3
High modulus 350-500 2500-3100 0.5-0.9
Ultra high modulus 500-700 2100-2400 0.2-0.4
Glass
E 70-75 1900-3000 3.0-4.5
AR 70-75 1900-3000 3.0-4.5
S 85-90 3500-4800 4.5-5.5
Aramid
Low modulus 70-80 3500-4100 4.3-5.5
High modulus 115-130 3500-4000 2.5-3.5
From the previous graphic and table, it is possible to see that the elastic Young modulus varies with
the raw material, particularly it has to be noted that for glass and aramid fibers, the modulus is lower
than for steel. This can involve problems in reinforcing of structures, leading to high value of
deformation.
2.2.1. Carbon fibers
They are used mainly for their high performance and are characterized by high Young Modulus as well
as high strength. In general, the tensile strength is equal to glass while its modulus is about three to
four times higher. However, they have a high degree of variation with the raw material. It is possible to

Assessment of current standards for evaluation of shear FRP strengthening of concrete beams
Erasmus Mundus Programme
12 ADVANCED MASTERS IN STRUCTURAL ANALYSIS OF MONUMENTS AND HISTORICAL CONSTRUCTIONS
distinguish among several types of carbon fibers classified with respect to the elastic modulus referred
to as high and ultrahigh elastic modulus or to the tensile strength.
They are more expensive than glass fibers but offer an excellent combination of strength, low weight
and high modulus. They are less sensitive to creep rupture and fatigue and show a slight reduction of
the long-term tensile strength. Among other characteristics, it is important to point out their low thermal
dilatation coefficients (both transversal and longitudinal), good resistance to the fatigue and excellent
behavior against chemical agents and moisture.
Carbon fiber composites have more brittle behavior than glass or aramid fibers but their failure
strengths are larger. Other deficiencies are that they can cause galvanic corrosion when used next to
metals and their low strength against impacts.
Carbon fibers are supplied in a number of different forms, from continuous filament tows to chopped
fibers and mats. The highest strength and modulus are obtained by using unidirectional continuous
reinforcement. Twist-free tows of continous filament carbon contain 1000 to 75000 individual filaments
which can be woven or knitted into woven roving and hybrid fabrics with glass fibers and aramid fibers.
2.2.2. Glass fibers
They are the cheapest and the most widely used for their good performance to cost ratio. They are
obtained by extrusion of silicon material through holes with decreasing diameter with a final value that
ranges from 20 to 3 m. They are considered the predominant reinforcement for polymer matrix
composites due to their high electrical insulating properties, low susceptibility to moisture and high
mechanical properties. Other commercial compositions include “S” glass, with higher strength, heat
resistance and modulus, as well as some specialized glass reinforcements with improved chemical
resistance, such as AR glass (alkali resistant).
Glass is generally a good impact resistant fiber but weighs more than carbon or aramid. Glass fibers
have excellent characteristics, equal to or better than steel in certain forms.. Composites made from
this material exhibit very good electrical and thermal insulation properties.
The lower modulus requires special design treatment where stiffness is critical. Besides this problem,
corrosion, low resistance to abrasion, moisture and to long term or cyclic loads are the greatest
shortcomings.
2.2.3. Aramid fibers
These fibers are in production since 1972: first, the American society Du Pont, using as raw material a
polymer, the aromatic polyamide or aramid, produced and commercialized them as Kevlartm
.
Aramid fibers offer good mechanical properties at a low density with the added advantage of
toughness and damage/impact resistance, i.e. damage tolerance, fatigue and thermal actions.. They
are characterized as having reasonably high tensile strength, a medium modulus and a very low
Assesment of current standards for evaluation of shear FRP strengthening of concrete beams
Erasmus Mundus Programme
ADVANCED MASTERS IN STRUCTURAL ANALYSIS OF MONUMENTS AND HISTORICAL CONSTRUCTIONS 13
density as compared to glass and carbon. The tensile strength of aramid fibers is higher than glass
fibers and the modulus is about 50% higher than glass. These fibers increase the impact resistance of
composites and provide products with higher tensile strengths. Aramid fibers are insulators of both
electricity and heat. They are resistant to organic solvents, fuels and lubricants.
Limitations of use are involved by the exposure to moisture and ultraviolet rays: the humidity increases
the shrinkage due to the interaction between the water and the fiber molecular structure, while the sun
light reduces the strength of the aramid to half in 200 days but, fortunately, this problem can be
overcame using a specific protective resins that has to be applied to the FRP just after placing.
Regardless of the material, reinforcements are available in forms to serve a wide range of processes
and end-product requirements. Materials supplied as reinforcement include roving, milled fiber,
chopped strands, continuous, chopped or thermo formable mat but also bars. Reinforcement materials
can be designed with unique fiber architectures and be performed (shaped) depending on the product
requirements and manufacturing process.
2.2.4. Other types of fibers
Fibers can be obtained from the polyethylene, showing good strength, low electric conductibility, high
resistance to water, chemical products, abrasion and impact loads. The problem is that these fibers do
not work well with heat and suffer slow deformation, due to the shrinkage and relaxation, more than
this the resin impregnates them with some difficulty.
Another possibility is to use ceramic material, although this type of fibers exhibit very interesting
characteristics (tensile strength between 0.5 and 2. GPa, even with temperatures of about 1200°C),
they are not used for the high cost and because their characteristics would not be in any case used.
2.3. Fillers
Use of inorganic fillers in composites is increasing. The inorganic filler materials that can be used with
composites include calcium carbonate, kaolin, alumina trihydrate and calcium sulfate. Fillers not only
reduce the cost of composites, but also frequently impart performance improvements that might not
otherwise be achieved by the reinforcement and resin ingredients alone. Fillers can improve
mechanical properties including fire and smoke performance by reducing organic content in composite
laminates. Also, filled resins shrink lees than unfilled ones, thereby improving the dimensional control
of molded parts. Important properties, including water resistance, weathering, surface smoothness,
stiffness, dimensional stability and temperature resistance, can all be improved through the proper
user of fillers.
The thermosetting resin segment of the composite industry has taken advantage of the properties of
fillers for many years. More recently, the thermoplastic industry has begun to make widespread use of
inorganic fillers. Breakthroughs in chemical treatment of fillers that can provide higher filler loadings
and improved laminate performance are accelerating this trend.

Assessment of current standards for evaluation of shear FRP strengthening of concrete beams
Erasmus Mundus Programme
14 ADVANCED MASTERS IN STRUCTURAL ANALYSIS OF MONUMENTS AND HISTORICAL CONSTRUCTIONS
When used in composite laminates, inorganic fillers can account for 40 to 65% by weight. They
perform a function similar to silica fume in concrete. In comparison to resins and reinforcements, fillers
are the least expensive of the major ingredients. These materials are nevertheless very important in
establishing the performance of the composite laminate for the following reasons:
Reduce the shrinkage of the composite part.
Influence the fire resistance of laminates.
Lower compound cost.
Serve to transfer stresses between the primary structural components of the laminate.
Help maintaining fiber-loading uniformity by carrying reinforcing fibers along with the flow as
resin is moved on the mold during compression molding.
Improve crack resistance, particularly in sharp corners.
Some fillers are chemically modified by treating the surface area of the particles with a coupling agent.
These coupling agents help to improve the chemical bond between the resin and filler and can reduce
the resin demand.
2.4. Additives and modifiers
A wide variety of additives are used in composites to modify materials properties and tailor the
laminates’s performance. Although these materials are generally used in relatively low quantity by
weight compared to resins, reinforcements or fillers, they perform critical functions.
Additives used in thermosetting and thermoplastic composites include the following:
Low shrink/ low profile
Fire resistance
Air release
Emission control
Viscosity control
Electrical conductivity
Toughness
Antioxidants
Antistatic agents
Foaming agents
Plasticizers

Assesment of current standards for evaluation of shear FRP strengthening of concrete beams
Erasmus Mundus Programme
ADVANCED MASTERS IN STRUCTURAL ANALYSIS OF MONUMENTS AND HISTORICAL CONSTRUCTIONS 15
Slip and blocking agents
Heat stabilizers
Ultraviolet stabilizers
2.5. Adhesives
Adhesives are used to attach composites to themselves as well as to other surfaces. Adhesive
bonding is the method of choice for bonding thermosetting composites and is sometimes used for
thermoplastic composites. There are several considerations involved in applying adhesives effectively.
The joint or interface connection must be engineered to select the proper adhesive and application
method to ensure bond strength. Careful surface preparation and cure are critical to bond
performance.
Adhesives should be used in joint design where the maximum load is transferred into the component
using the loading characteristics of the adhesive and the composite material. The most common
adhesives are acrylics, epoxies and urethanes. A high-strength bond with high-temperature resistance
would indicate the use of an epoxy, whereas a moderate temperature resistance with good strength
and rapid cure might use an acrylic. For applications where toughness is needed, urethane might me
selected.
2.6. Properties of FRP strengthening systems
The first general consideration about the physical characteristic of the FRP is that they are different in
longitudinal and transversal directions, referring to the fiber disposition, due to the heterogeneity and
the anisotropy involved from the particular structure of the material. Heterogeneity derives from the
fact that FRP is an ensamble of different materials with different characteristics. Anisotropy is due both
to micro- and macrostructure; the fibers themselves exhibit anisotropy due to the particular molecular
structure.
The mechanical properties and composition of FRP composites can be tailored for their intended use.
The type and quantity of materials selected in addition to the manufacturing process to fabricate the
product, will affect the mechanical properties and performance. Important considerations for the
design of composite products include:
Geometry: shape and dimensions
Fiber orientation: the orientation with respect to the symmetry axes of the material; when
random, the composite characteristics are similar to an isotropic material. In all other cases,
the composite can be considered as an anisotropic material.
Fiber concentration: volume fraction, distribution (dispersion).
Type of fiber reinforcement
Percentage of fiber or fiber volume
Type of resin

Assessment of current standards for evaluation of shear FRP strengthening of concrete beams
Erasmus Mundus Programme
16 ADVANCED MASTERS IN STRUCTURAL ANALYSIS OF MONUMENTS AND HISTORICAL CONSTRUCTIONS
Volume of production (to help determine the best manufacturing method)
Manufacturing process
Service conditions.
2.6.1. Thermal expansion coefficient
Due to the anisotropy, two different coefficients are needed in order to characterize the FRP
(longitudinal and transversal). Thermal behavior is very important when the FRP is used together with
concrete or steel, because the different expansion of these materials can lead to high stresses at the
interface between them increasing the risk of debonding.
The two expansion coefficients can be evaluated starting from the ones relative to the constituent
materials, their elastic modulus and their volume fraction in the compound:
)(
1mmmfff
L
L EvEvE
(1)
LTLmmmfffT vvvv )1()1( (2)
Where is the thermal expansion coefficient, is the poisson modulus, E is the Young modulus and v
is the volume fractions. The subscripts L and T stand for longitudinal and transversal direction with
respect to the fibers direction respectively. LT is the maximum between the two directions, finally the
subscripts m and f indicate the material which the parameter refers to: matrix or fibers.
2.6.2. Mechanical properties
As it was said before, in FRP materials, fibers provide both loading carrying capacity and stiffness to
the composite while the matrix is necessary to guarantee the sharing of the load among fibers and to
protect them from the environment. Most FRP materials are made of fibers with high strength and
stiffness, while their strain at failure is lower than that of the matrix.
Although FRP is a non homogenous material, when working with its mechanical properties is better to
consider it like such referring in this way to the classical continuum mechanic schematization.
Unfortunately, the anisotropy cannot be neglected, leading to a higher number of strictly necessary
parameters to characterize the behavior (transversal and longitudinal values of normal and shear
elastic modulus, Poisson modulus and bulk modulus).
All the required coefficients are often evaluated starting from the characteristics of the FRP
components and their volume fraction, instead of testing the FRP itself, obviously the problem
becomes to determinate the characteristics of the fibers and matrix. All the formulations in literature
involve critics but also clear advantages: for instance, it is possible to reduce the testing time when
some materials are used to produce different FRP compounds varying the percentage of fibers and
Assesment of current standards for evaluation of shear FRP strengthening of concrete beams
Erasmus Mundus Programme
ADVANCED MASTERS IN STRUCTURAL ANALYSIS OF MONUMENTS AND HISTORICAL CONSTRUCTIONS 17
resin involved in the manufacturing. This may be accomplished by applying the so call “rule of
mixtures” simplification as follows:
mmff vEvEE (3)
mmff vv (4)
It remains clear that with the equations above, just an approximation of the desired value can be
obtained. A more detailed prediction should be achieved through tensile testing which allows taking
into account all the fibers and matrix characteristics as well as micro-structural aspects such as fiber
diameter, distribution and parallelism of fibers, volume fractions and the fiber-matrix interfacial
properties.
Due to the fact that the stiffness and strength of the fibers are much larger than the respectively values
of the matrix, the properties of the FRP are highly governed by the properties and the cross sectional
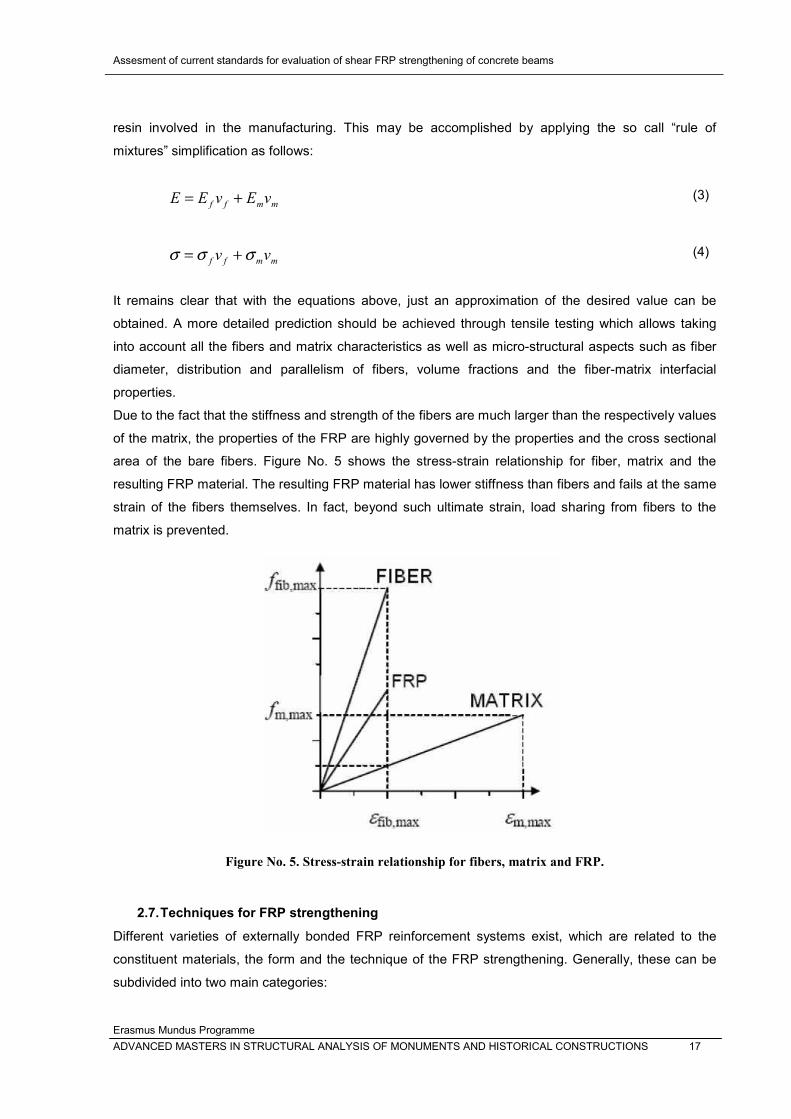
area of the bare fibers. Figure No. 5 shows the stress-strain relationship for fiber, matrix and the
resulting FRP material. The resulting FRP material has lower stiffness than fibers and fails at the same
strain of the fibers themselves. In fact, beyond such ultimate strain, load sharing from fibers to the
matrix is prevented.
Figure �o. 5. Stress-strain relationship for fibers, matrix and FRP.
2.7. Techniques for FRP strengthening
Different varieties of externally bonded FRP reinforcement systems exist, which are related to the
constituent materials, the form and the technique of the FRP strengthening. Generally, these can be
subdivided into two main categories:

Assessment of current standards for evaluation of shear FRP strengthening of concrete beams
Erasmus Mundus Programme
18 ADVANCED MASTERS IN STRUCTURAL ANALYSIS OF MONUMENTS AND HISTORICAL CONSTRUCTIONS
Wet lay up (or cured in-situ) systems
Prefab (or pre-cured) systems.
Prepreg systems.
The suitability of each system depends on the type of structure that shall be strengthened. For
example, prefabricated strips are generally best suited for plane and straight surfaces, whereas sheets
or fabrics are more flexible and can be used to plane as well as to convex surfaces.
These techniques involve the application of the FRP external reinforcement to the concrete element
surface with the fibers as parallel as possible to the direction of the principal tensile stress. Several
layers of fibers are superposed until the desired thickness is reached; when dry fibers are used the
resin has to be applied both to the structure that need the reinforcement and to the fibers after their
positioning.
All the required operation can be done automatically using a special machine, particularly helpful when
the fibers must be applied on great areas. This automated technique involves the wrapping with
continuous wet fibers placed with a slight angle around the element calling for retrofit. Although this
technique involves good quality control and velocity of installation, it needs elements with circular
cross section to be applied.
When hand lay up is used, to achieve a better final product some options are available, unfortunately
implying higher costs. To provide a better elimination of the eventual entrapped air, a roller can be
passed on the fibers, after the application of the epoxy resin. Otherwise, as well as for the moulding,
the vacuum bat can be used for the improvement of the longitudinal reinforcement. To obtain in-situ
fast curing or good bonding in those regions where the temperature is too low to allow cold curing, a
hearing device can be used.
2.7.1. Wet lay-up systems
Installation on the substrate requires saturating resin usually after a primer has been applied. Two
different process can be used to apply the fabric. In the first one, the fabric can be applied directly into
the resin which has been applied uniformly onto the substrate. In the second process, the fabric can
be impregnated with the resin in a saturator machine and then applied wet to the sealed substrate.
For this case, the final thickness of the FRP laminate cannot be estimated in a deterministic fashion.
Therefore, it is recommended to refer to both mechanical and geometrical properties of dry fabric
according to the technical data sheets provided by the FRP manufacturer in order to establish the
properties of the composite.
2.7.2. Pre-cured elements
Manufactured in various shapes, by pultrusion or lamination, pre-cured systems are directly bonded to
the structural member to be strengthened. Pre-cured composites are characterized by a unidirectional

Assesment of current standards for evaluation of shear FRP strengthening of concrete beams
Erasmus Mundus Programme
ADVANCED MASTERS IN STRUCTURAL ANALYSIS OF MONUMENTS AND HISTORICAL CONSTRUCTIONS 19
disposition of fibers. For this case, manufactures typically provide mechanical characteristics referred
to the laminate cross-section having a well specified size.
2.7.3. Prepreg systems
Manufactured with unidirectional or multidirectional fiber sheets or fabrics preimpregnated at the
manufacturing plant with partially polymerized resin and delivered in rolls. They may be bonded to the
member to be strengthened with (or without) the use of additional resins. The resins may receive pre-
polymerization treatments.
Assessment of current standards for evaluation of shear FRP strengthening of concrete beams
Erasmus Mundus Programme
20 ADVANCED MASTERS IN STRUCTURAL ANALYSIS OF MONUMENTS AND HISTORICAL CONSTRUCTIONS

Assesment of current standards for evaluation of shear FRP strengthening of concrete beams
Erasmus Mundus Programme
ADVANCED MASTERS IN STRUCTURAL ANALYSIS OF MONUMENTS AND HISTORICAL CONSTRUCTIONS 21
3. ACI 440 : GUIDE FOR THE DESIGN AND CONSTRUCTION OF EXTERNALLY BONDED FRP SYSTEMS FOR STRENGTHENING CONCRETE STRUCTURES
The nominal shear strength of a concrete member strengthened with an FRP system should exceed
the required strength as shown in the equation No. 5:
un VV (5)
According to the ACI 440, the nominal shear strength (Equation No. 6) can be computed by adding the
contribution of the FRP reinforcing (Vf) to the contributions of the concrete (Vc) and the shear steel
reinforcement (stirrups, ties or spirals, Vs). It also states that the value of Vf should be modified by the
reduction factor f that depends on the type of wrapping scheme as shown in Table No. 3:
)( ffscn VVVV (6)
Table �o. 3. Reduction factors for FRP Shear reinforcement.
f =0.95 Completely wrapped members
f =0.85 Three-sided U-wraps or bonded face
plies
The formulation proposed by the ACI 440 in order to obtain the contribution of the FRP reinforcement
to the total shear capacity of concrete beams (Vf) is based mainly in the work carried out by Khalifa et
at (1998).
He considers a design approach where the fracture of the FRP sheet is quite similar to the approach
used to compute the contribution of steel shear reinforcement, taking into account the rupture point of
the FRP sheets instead of the yield point of steel for the ultimate condition. However, based on the
work done by Triantafillou (1998), it was considered that the rupture of the FRP sheets rupture
happens at values lower than their ultimate strength due to stress concentration. Khalifa proposes that
the contribution of the externally bonded FRP sheets to the shear capacity of an RC beam may be
computed as:
f
ffefv
fs
dfAV
)cos(sin
(7)
Where Af is the area of shear reinforcement, ffe is the effective tensile stress in FRP sheet in direction
of principal fibers, is the angle between the orientation of the fibers in the sheet and the longitudinal
axis of the beam. In order to compute the tensile stress in the FRP shear reinforcement at ultimate

Assessment of current standards for evaluation of shear FRP strengthening of concrete beams
Erasmus Mundus Programme
22 ADVANCED MASTERS IN STRUCTURAL ANALYSIS OF MONUMENTS AND HISTORICAL CONSTRUCTIONS
(ffe), which corresponds to the only unkown in the previous equation, the level of strain that can be
developed in the FRP shear reinforcement at ultimate has to be computed:
ffefe Ef (8)
The value of fe depends on the failure modes of the FRP and of the strengthened reinforced concrete
member. As guidance, the ACI 440 provides about the determination of the effective strain for different
configurations of FRP laminates and failure modes, based on the work of Khalife, as it was said
before, specially for U-jacket or two-sided bonded beams. Taking this into account a brief description
of the design approach by Khalifa is presented before introducing the equations and recommendations
found within the ACI 440 Standard.
3.1. Khalifa et al model (1998)
For Khaliya, ffe can be computed as:
ufe Rff (9)
Where R is the ratio between the effective strain ( fe) and the ultimate strain ( fu). In his work, Khalifa
proposed two equations for R in order to represent two possible failure modes: FRP rupture and
delamination of the FRP from the concrete surface.
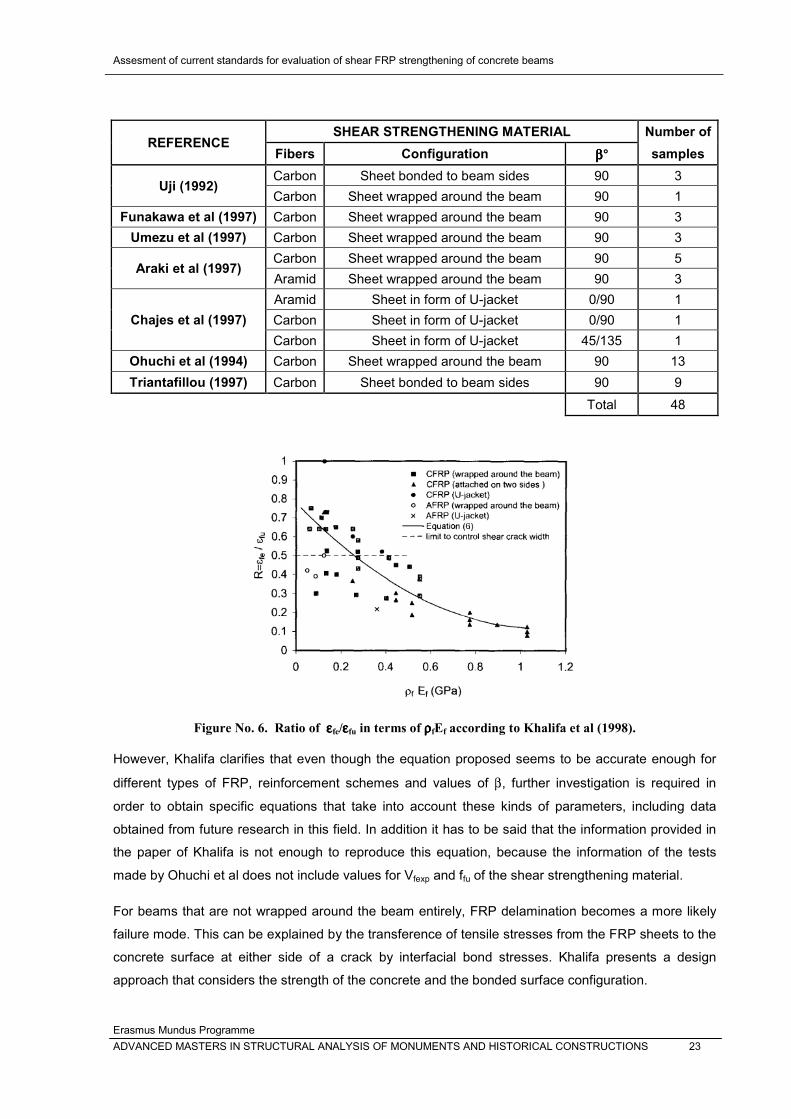
For rupture, Khalifa used the results of 48 beams tested with different kinds of FRP and schemes of
reinforcement, which main features are summarized in the Table No. 4. The approach used consisted
in compute the values of fe for the different beams using equation No. 7 and the values of Vf
experimentally founded. The values computed in this fashion were then plotted against the respective
axial rigidities ( fEf) of the FRP sheets. Equation No. 10 was then computed by regression of the
experimental data (Figure No. 6). It has to be noticed that the researchers also proposed an upper
limit of R equal to 0.5 when found by 10 in order to maintain the shear integrity of the concrete
because for higher levels of strains, the width of the shear cracks would imply lost of aggregate
interlock with the subsequent reduction of the concrete shear capacity.
50.0778.0)(2188.1)(5622.0 2
ffff EER (10)
Table �o. 4. Summary of tests used by Khalifa et al (1998).
REFERENCE SHEAR STRENGTHENING MATERIAL Number of
Fibers Configuration ° samples
Sato et al (1996) Carbon Sheet bonded to beam sides 90 2
Carbon Sheet in form of U-jacket 90 2
Sato et al (1997) Carbon Sheet in form of U-jacket 90 1
Assesment of current standards for evaluation of shear FRP strengthening of concrete beams
Erasmus Mundus Programme
ADVANCED MASTERS IN STRUCTURAL ANALYSIS OF MONUMENTS AND HISTORICAL CONSTRUCTIONS 23
REFERENCE SHEAR STRENGTHENING MATERIAL Number of
Fibers Configuration ° samples
Uji (1992) Carbon Sheet bonded to beam sides 90 3
Carbon Sheet wrapped around the beam 90 1
Funakawa et al (1997) Carbon Sheet wrapped around the beam 90 3
Umezu et al (1997) Carbon Sheet wrapped around the beam 90 3
Araki et al (1997) Carbon Sheet wrapped around the beam 90 5
Aramid Sheet wrapped around the beam 90 3
Chajes et al (1997)
Aramid Sheet in form of U-jacket 0/90 1
Carbon Sheet in form of U-jacket 0/90 1
Carbon Sheet in form of U-jacket 45/135 1
Ohuchi et al (1994) Carbon Sheet wrapped around the beam 90 13
Triantafillou (1997) Carbon Sheet bonded to beam sides 90 9
Total 48
Figure �o. 6. Ratio of fe/ fu in terms of fEf according to Khalifa et al (1998).
However, Khalifa clarifies that even though the equation proposed seems to be accurate enough for
different types of FRP, reinforcement schemes and values of , further investigation is required in
order to obtain specific equations that take into account these kinds of parameters, including data
obtained from future research in this field. In addition it has to be said that the information provided in
the paper of Khalifa is not enough to reproduce this equation, because the information of the tests
made by Ohuchi et al does not include values for Vfexp and ffu of the shear strengthening material.
For beams that are not wrapped around the beam entirely, FRP delamination becomes a more likely
failure mode. This can be explained by the transference of tensile stresses from the FRP sheets to the
concrete surface at either side of a crack by interfacial bond stresses. Khalifa presents a design
approach that considers the strength of the concrete and the bonded surface configuration.
Assessment of current standards for evaluation of shear FRP strengthening of concrete beams
Erasmus Mundus Programme
24 ADVANCED MASTERS IN STRUCTURAL ANALYSIS OF MONUMENTS AND HISTORICAL CONSTRUCTIONS
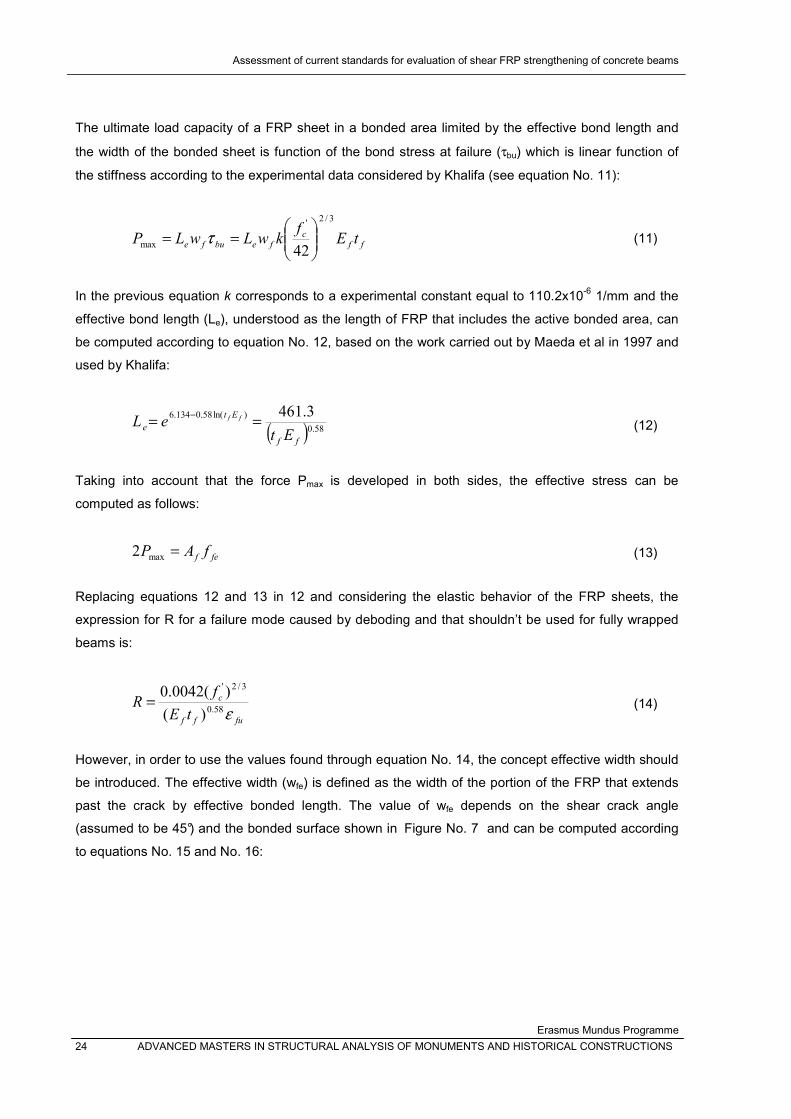
The ultimate load capacity of a FRP sheet in a bonded area limited by the effective bond length and
the width of the bonded sheet is function of the bond stress at failure ( bu) which is linear function of
the stiffness according to the experimental data considered by Khalifa (see equation No. 11):
ffc
febufe tEf
kwLwLP
3/2'
max42
(11)
In the previous equation k corresponds to a experimental constant equal to 110.2x10⁻⁶
1/mm and the
effective bond length (Le), understood as the length of FRP that includes the active bonded area, can
be computed according to equation No. 12, based on the work carried out by Maeda et al in 1997 and
used by Khalifa:
58.0
)ln(58.0134.6 3.461
ff
Et
eEt
eL ff (12)
Taking into account that the force Pmax is developed in both sides, the effective stress can be
computed as follows:
fef fAPmax2 (13)
Replacing equations 12 and 13 in 12 and considering the elastic behavior of the FRP sheets, the
expression for R for a failure mode caused by deboding and that shouldn’t be used for fully wrapped
beams is:
fuff
c
tE
fR
58.0
3/2'
)(
)(0042.0 (14)
However, in order to use the values found through equation No. 14, the concept effective width should
be introduced. The effective width (wfe) is defined as the width of the portion of the FRP that extends
past the crack by effective bonded length. The value of wfe depends on the shear crack angle
(assumed to be 45°) and the bonded surface shown in Figure No. 7 and can be computed according
to equations No. 15 and No. 16:

Assesment of current standards for evaluation of shear FRP strengthening of concrete beams
Erasmus Mundus Programme
ADVANCED MASTERS IN STRUCTURAL ANALYSIS OF MONUMENTS AND HISTORICAL CONSTRUCTIONS 25
Figure �o. 7. Effective width of FRP for a) U-Jacket and b) Bonded only on two beam sides (Khalifa et
al., 1998).
jacketUforLdw effe (15)
sheetsbondedsidedtwoforLdw effe 2 (16)
The final expression for R for this type of failure mode is obtained by multiplying equation No. 14 by
the ratio of wfe/df:
ffuff
fec
dtE
wfR
58.0
3/2'
)(
)(0042.0 (17)
As pointed out by Sas et al (2009), the main limitation of this model corresponds to the limited data
available at the moment of the model’s derivation. This derivation is based mainly on test made using
CFRP and =90° but the authors recommend its use for any kind of sheets and orientation of the
sheets which, again, implies that the model should be revised in order to obtain more specific
equations.
It also has to be considered that even though it is stated that fully wrapped beams are more likely to
have a failure mode governed by FRP delamination, the data of the test for these kind of beams,
which actually corresponds to an important part of the database, were considered in order to obtain
equation No. 10.
As long as the formulation for fully wrapped beams, the paper presented by Khalifa doesn’t give much
information about the database used in order to find the equations proposed. However, it is clear that

Assessment of current standards for evaluation of shear FRP strengthening of concrete beams
Erasmus Mundus Programme
26 ADVANCED MASTERS IN STRUCTURAL ANALYSIS OF MONUMENTS AND HISTORICAL CONSTRUCTIONS
these equations were also based in a limited database and the same drawbacks explained before,
apply here as well.
3.2. Vf according to ACI 440
For completely wrapped members, the rupture failure must be expected and it is described by the ACI
400 as loss of aggregate interlock of the concrete at fiber strains less than ultimate fiber strain. The
formulation proposed, based on experience and the testing carried out by Priestley et al (1996), is:
fufe 75.0004.0 (18)
It has to be said that even though equations 10 and No. 17 are based in testing, their use will imply
obtaining considerable different results. Another important remark is related to the fact that the
formulation of the ACI 440 neglects the influence of the axial rigidity that has shown to have an
important influence as noticed by different authors (Khalifa et al 1998, Triantafillou 1998). However,
this point will be retaken when the comparison of the theoretical values obtained by the codes and the
experimental ones is performed.
For bonded U-wraps or bonded face plies, the ACI-440 agrees with the fact that the elements
strengthened in this fashion are more likely to present a failure mode based on a mechanism of
delamination of the FRP from the concrete before the loss of aggregate interlock of the section. Taking
this into account, the bond stress becomes relevant in order to compute the ultimate level strain. The
equation proposed by the ACI 440 is as follows:
004.0fuvfe k (19)
Where k is the bond-reduction factor that depends on the concrete strength, the type of wrapping
scheme and the stiffness of the lamínate. The equations presented on ACI-440 that are based on the
investigation carried out by Khalifa (1998) are as follows:
75.0
11900
21
fu
ev
Lkk (20)
58.0
416
ff
eEnt
L (21)
The factors k1 and k2 take into account the concrete strength and the type of wrapping respectively.

Assesment of current standards for evaluation of shear FRP strengthening of concrete beams
Erasmus Mundus Programme
ADVANCED MASTERS IN STRUCTURAL ANALYSIS OF MONUMENTS AND HISTORICAL CONSTRUCTIONS 27
3/2'
127
cfk (22)
wrapsUford
Ldk
f
ef
2 (23)
bondedsidedtwoford
Ldk
f
ef 22 (24)
It is important to notice that in the ACI-440 it is stated that the equation for kv has been validated for
regions with low moments and high shear but it is expected to be conservative for cases where high
moments are presented simultaneously with high shears.
The ACI 440 presents a graph where it is possible to compare the theoretical values of Vf found by the
use of the equations above and the results reported by Khalifa et al (1998). In this graph it is possible
to observe that the methodology proposed seems to be highly conservative for fully wrapped
elements. In addition, based on the data presented in this graph, the data seems to be scarce, mainly
for not fully wrapped specimens.
Figure �o. 8. Comparison of experimental results to the results using the ACI 440 procedure.
However, in this point it has to be noticed that even though, the ACI 440 the work presents as main
reference the work by Khalifa in 1998, the equations of that paper and the ones of the standard, are
not the same. The main differences are found in the experimental coefficients for the bond length and
the factor k1. These differences imply a variation of more or less the 10% of the value of Vf (the factor

Assessment of current standards for evaluation of shear FRP strengthening of concrete beams
Erasmus Mundus Programme
28 ADVANCED MASTERS IN STRUCTURAL ANALYSIS OF MONUMENTS AND HISTORICAL CONSTRUCTIONS
of 0.0042 proposed by Khalifa in the equation No. 17 changes to 0.0038 when computed according to
ACI 440 recommendations). These differences could be explained by the incorporation of new tests to
the database used by Khalifa, but this point is not clarified in the Standard. Furthermore, more recent
investigation carried out by Khalifa (Khalifa et al (2000), Khalifa et al (2002)) has changed the form of
the equation for delamination of the FRP sheets which hasn’t been included in the formulation of the
ACI 440.

Assesment of current standards for evaluation of shear FRP strengthening of concrete beams
Erasmus Mundus Programme
ADVANCED MASTERS IN STRUCTURAL ANALYSIS OF MONUMENTS AND HISTORICAL CONSTRUCTIONS 29
4. FIB BULLETIN 14: EXTERNALLY BONDED FRP REINFORCEMENT FOR RC STRUCTURES
The Fib bulletin is based on the work carried out by Täljsten (1998), Triantafillou (1998) and
Triantafillou and Antonopoulos (2000). In their reports they proposed the use of the effective strain as
the strain level in which the FRP sheet is stressed when the concrete element reaches its shear
capacity. The concept of this effective strain has been used by many researchers, including Khalifa et
al (1998), as shown before.
In his model, Triantafillou (1998) used the classical truss analogy, treating the external FRP
reinforcement as internal steel shear reinforcement, considering that the material develops the
effective strain in the ultimate limit state in shear. The FRP contribution to the shear capacity can then
be computed as:
sin)cot(cot9.0 , dbEV wffuefdfd (25)
In the previous equation the angle is the angle of diagonal crack . This equation is equivalent to
equation No. 7, when the angle is considered to be equal to 45°, which is actuall y a usual
assumption.
In order to compute the value of the effective strain, Triantafillou and Antonopoulos (2000), used the
same methodology followed by Khalifa et al (1998), considering the results provided by different
investigation in the field (see Table No. 5), but including a larger database due to the new results
obtained in the years between the publications.
Table �o. 5. Summary of tests used by Triantafillou and Antonopoulos (2000).
REFERENCE SHEAR STRENGTHENING MATERIAL Number of
Fibers Configuration ° samples
Berset (1992) Glass Sheet bonded to beam sides 45 2
Uji (1992) Carbon Sheet bonded to beam sides 90 3
Carbon Sheet wrapped around the beam 90 1
Al-Sulaimani et al (1994)
Glass Sheet bonded to beam sides 90 2
Ohuchi et al (1994) Carbon Sheet wrapped around the beam 90 13
Chajes et al (1997)
Aramid Sheet in form of U-jacket 90 1
Carbon Sheet in form of U-jacket 90 1
Carbon Sheet in form of U-jacket 45 1
Glass Sheet in form of U-jacket 90 1
Sato et al (1996) Carbon Sheet bonded to beam sides 90 2
Carbon Sheet in form of U-jacket 90 2
Antonopoulos (1996) Carbon Sheet bonded to beam sides 90 3
Carbon Sheet bonded to beam sides 45 1
Myyauchi et al (1997) Carbon Sheet wrapped around the beam 90 3

Assessment of current standards for evaluation of shear FRP strengthening of concrete beams
Erasmus Mundus Programme
30 ADVANCED MASTERS IN STRUCTURAL ANALYSIS OF MONUMENTS AND HISTORICAL CONSTRUCTIONS
REFERENCE SHEAR STRENGTHENING MATERIAL Number of
Fibers Configuration ° samples
Taerwe et al (1997) Carbon Sheet in form of U-jacket 90 3
Carbon Sheet wrapped around the beam 90 1
Funakawa et al (1997) Carbon Sheet wrapped around the beam 90 3
Umezu et al (1997) Carbon Sheet wrapped around the beam 90 3
Aramid Sheet wrapped around the beam 90 12
Araki et al (1997) Carbon Sheet wrapped around the beam 90 5
Aramid Sheet wrapped around the beam 90 3
Sato et al (1997) Carbon Sheet in form of U-jacket 90 2
Ono et al (1997) Carbon Sheet wrapped around the beam 90 5
Taljsten (1997) Carbon Sheet bonded to beam sides 45 3
Total 76
In order to obtain the equations for the effective strain, the researchers took into account that it
depends on the effective bond length which is influenced by the bond conditions, the axial rigidity and
the tensile strength of the concrete. With these considerations in mind, they developed a set of
equations in order to compute the effective strain (see equations No. 26, No. 27 and No. 28). Figure
No. 9 presents the normalized FRP strains in terms of the axial rigidity and the concrete strength for
the database used and it also includes the equations proposed.
Figure �o. 9. Comparison of experimental results to the equations proposed by Triantafillou and
Antonopoulos (2000).

Assesment of current standards for evaluation of shear FRP strengthening of concrete beams
Erasmus Mundus Programme
ADVANCED MASTERS IN STRUCTURAL ANALYSIS OF MONUMENTS AND HISTORICAL CONSTRUCTIONS 31
For Fully wrapped (or properly anchored) CFRP-FRP fracture controls:
fu
ffu
cmef
E
f30.0
3/2
, 17.0 (26)
For side or U-shaped CFRP jackets:
fu
ffu
cm
ffu
cmef
E
fx
E
f30.0
3/23
56.03/2
, 17.0,1065.0min (27)
Fully wrapped AFRP (FRP fracture controls):
fu
ffu
cmef
E
f47.0
3/2
, 048.0 (28)
The value used of effective strain used in the design, fd,e, should be computed from the characteristic
value, fk,e, divided by the partial safety factor. The characteristic value, according to the
recommendations of the fib bulletin should be taken as the 80% of the effective strain computed by the
set of equations presented above. As long as the partial safety factor, the fib bulletin considers
different values, regarding the type of failure mechanism expected:
Table �o. 6. Partial safety factors proposed by the fib BULLETI� 14.
FAILURE FRP APPLICATION TYPE
MECHANISM TYPE A B
FRACTURE
CFRP 1.2 1.35
AFRP 1.25 1.45
GFRP 1.3 1.5
DEBONDING ALL 1.3
In Table No. 6, application type A corresponds to the application of prefab FRB EBR systems where
all the provisions are taken in order to obtain a high degree of quality control. Application type B, in the
other hand, is related to the application of any system under difficult on-site working conditions.
As long as the limit for the effective strain, the fib BULLETIN proposes a value of 0.006 in order to
maintain the integrity of concrete and secure the activation of the aggregate interlock. When this value
if affected by the partial safety factor and multiplied by the 80% corresponding to the characteristic

Assessment of current standards for evaluation of shear FRP strengthening of concrete beams
Erasmus Mundus Programme
32 ADVANCED MASTERS IN STRUCTURAL ANALYSIS OF MONUMENTS AND HISTORICAL CONSTRUCTIONS
value, a limitation approximately equal to 0.004 is achieved, which agrees with the one proposed by
the ACI 440.
The main drawback of this approach pointed out in the Fib bulletin but also by Sas et al (2009), is that
the model does not take into account the FRP bonded length explicitly. However, in the fib it is stated
that this can be justified by:
The effective bond length is typically a small fraction of the RC member’s depth and, therefore,
the partially ineffective FRP turns to be contained in to a small fraction of the total depth.
The effect of short FRP bonded length might have been taken into account through the data
fitting and experimental procedure.
Another drawback of the model is related to the limited data available when it was calibrated which
leads to a inaccuracy in the prediction of the contribution of the FRP reinforcement to the shear
capacity as can be seen in Figure No. 9 and Figure No. 10. However, Sas et al (2009) considered that
the similar distribution around the bisector in Figure No. 10 can point out regression as being an
acceptable method for deriving a viable model.
Figure �o. 10. Triantafillou (1998) and Triantafillou and Antonopoulos (2000) model comparisons (taken
from Sas et al (2009)).

Assesment of current standards for evaluation of shear FRP strengthening of concrete beams
Erasmus Mundus Programme
ADVANCED MASTERS IN STRUCTURAL ANALYSIS OF MONUMENTS AND HISTORICAL CONSTRUCTIONS 33
5. CNR-DT 200/2004: GUIDELINES FOR THE DESIGN AND CONSTRUCTION OF EXTERNALLY BONDED FRP SYSTEMS FOR STRENGTHENING EXISTING STRUCTURES
According to the Italian guidelines, the shear capacity of FRP strengthened member should be
evaluated as:
max,,,, ,min RdfRdsRdctRdRd VVVVV (29)
With VRd,ct and VRd,s are the concrete and steel contribution strength computed according to the
current building code. VRd,f, in the other hand, corresponds to the FRP contribution. However, the
code sets a maximum value of the total shear capacity (VRd,max) that should be evaluated as the
ultimate strength of the concrete strut according, again, to the current building code.
For rectangular concrete members strengthened with a FRP side bonding configuration, the CNR-DT
200 proposes that the shear contribution should be calculated as:
f
f
ffedw
Rd
dfs
wtfhdVsin
sin2,9.0min
1, (30)
In the previous equation, the partial factor ( rd) shall be assumed equal to 1.20, d is the member
effective depth, hw is the stem depth, tf is the thickness of the adopted FRP system, is the fibers
angle with respect to the member longitudinal axis, t represents the angle of shear cracks (to be
assumed equal to 45° unless a more detailed calcula tion is made) and wf and pf are FRP width and
spacing respectively, measured orthogonally to the fiber direction (see Figure No. 11 ). For FRP strips
installed one next to each other the ratio wf/pf shall be set equal to 1.0. The effective FRP design
strength (ffed) for this case should be computed following the next equations:
Figure �o. 11. Triantafillou (1998) and Triantafillou and Antonopoulos (2000) model comparisons (taken
from Sas et al (2009)).

Assessment of current standards for evaluation of shear FRP strengthening of concrete beams
Erasmus Mundus Programme
34 ADVANCED MASTERS IN STRUCTURAL ANALYSIS OF MONUMENTS AND HISTORICAL CONSTRUCTIONS
2
,
,6.01
,9.0min eqred
eq
w
eqred
fddfedz
L
hd
zff (31)
eqredeqred Lzz , (32)
sin,9.0min ewred lhdz (33)
sin/ ffdd
f
eqEf
sL (34)
ctm
ff
ef
tEl
2 (35)
Where le is the effective bond length and sf is the ultimate debonding slip assumed to be equal to 0.2
mm and Ef is the FRP young modulus of elasticity. The variable ffdd represents the ultimate design
strength, to be evaluated according to the next equations:
f
fkf
fd
fddt
GEf
280.0 (36)
ctmckbfk ffkG 03.0 (37)
For U-jacket, the expressions recommended are:
f
f
ffed
Rd
dfs
wtdfV cotcot29.0
1, (38)
w
efddfed
hd
Lff
,9.0min
sin
3
11 (39)
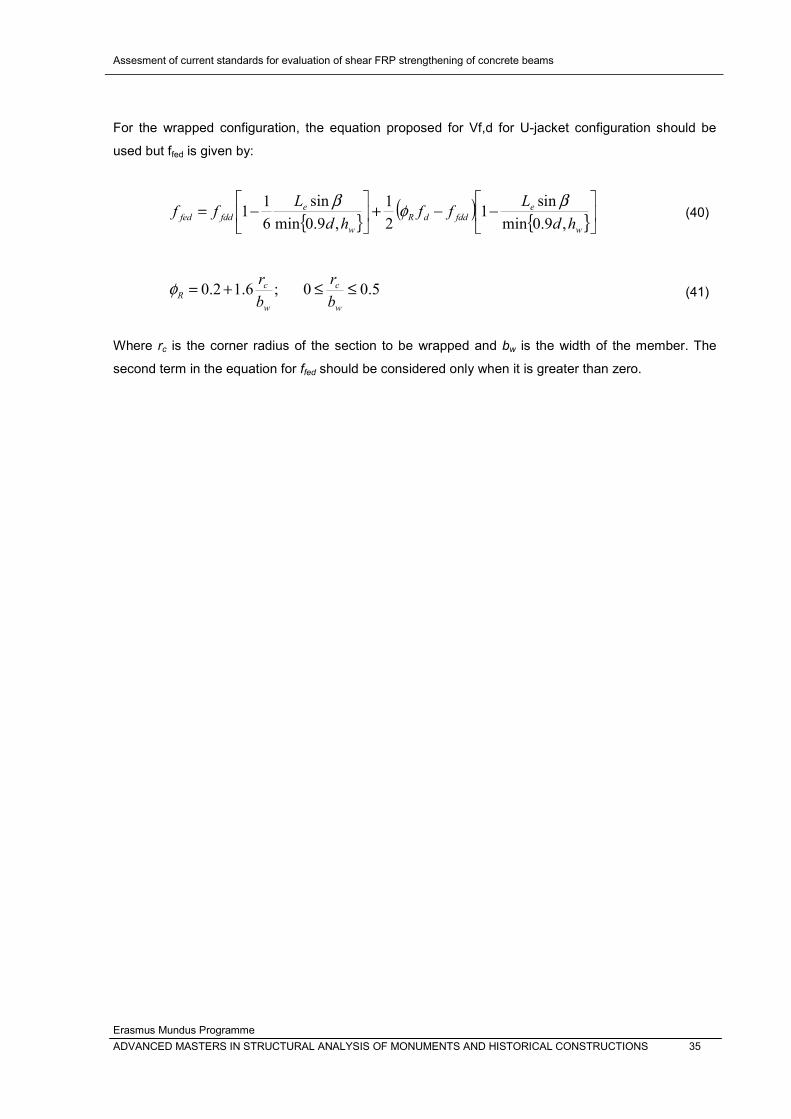
Assesment of current standards for evaluation of shear FRP strengthening of concrete beams
Erasmus Mundus Programme
ADVANCED MASTERS IN STRUCTURAL ANALYSIS OF MONUMENTS AND HISTORICAL CONSTRUCTIONS 35
For the wrapped configuration, the equation proposed for Vf,d for U-jacket configuration should be
used but ffed is given by:
w
efdddR
w
efddfed
hd
Lff
hd
Lff
,9.0min
sin1
2
1
,9.0min
sin
6
11 (40)
5.00;6.12.0
w
c
w
cR
b
r
b
r (41)
Where rc is the corner radius of the section to be wrapped and bw is the width of the member. The
second term in the equation for ffed should be considered only when it is greater than zero.

Assessment of current standards for evaluation of shear FRP strengthening of concrete beams
Erasmus Mundus Programme
36 ADVANCED MASTERS IN STRUCTURAL ANALYSIS OF MONUMENTS AND HISTORICAL CONSTRUCTIONS
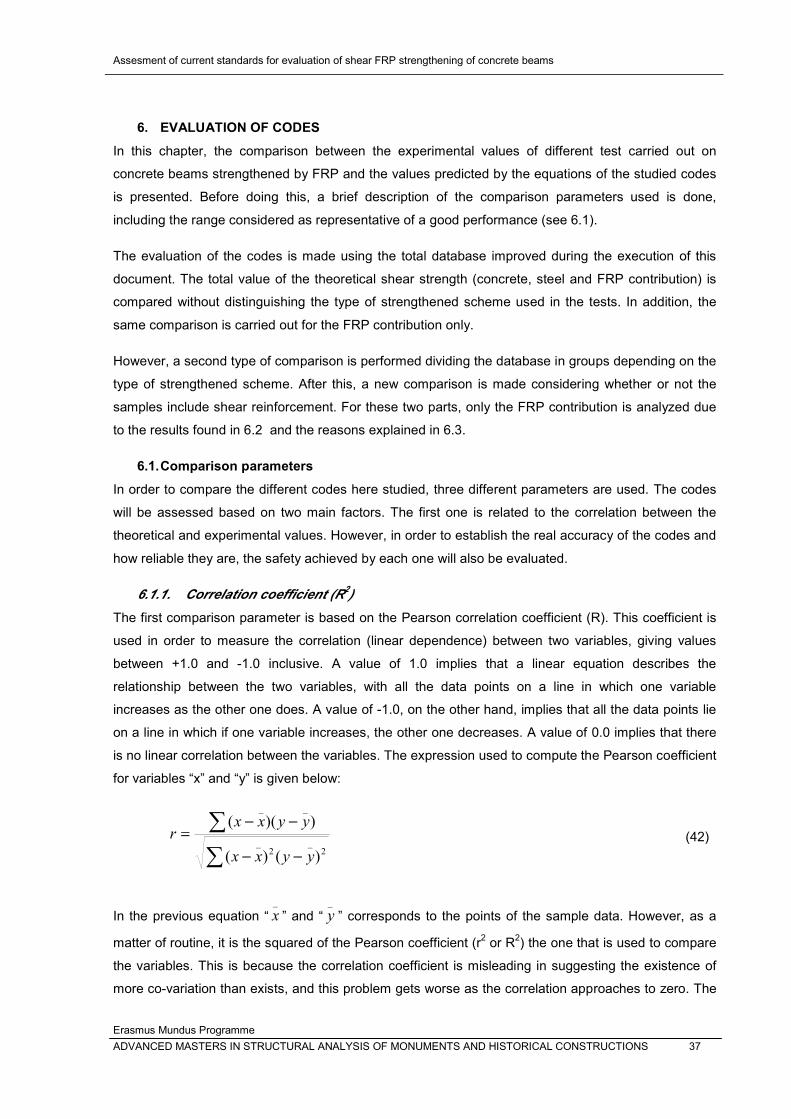
Assesment of current standards for evaluation of shear FRP strengthening of concrete beams
Erasmus Mundus Programme
ADVANCED MASTERS IN STRUCTURAL ANALYSIS OF MONUMENTS AND HISTORICAL CONSTRUCTIONS 37
6. EVALUATION OF CODES
In this chapter, the comparison between the experimental values of different test carried out on
concrete beams strengthened by FRP and the values predicted by the equations of the studied codes
is presented. Before doing this, a brief description of the comparison parameters used is done,
including the range considered as representative of a good performance (see 6.1).
The evaluation of the codes is made using the total database improved during the execution of this
document. The total value of the theoretical shear strength (concrete, steel and FRP contribution) is
compared without distinguishing the type of strengthened scheme used in the tests. In addition, the
same comparison is carried out for the FRP contribution only.
However, a second type of comparison is performed dividing the database in groups depending on the
type of strengthened scheme. After this, a new comparison is made considering whether or not the
samples include shear reinforcement. For these two parts, only the FRP contribution is analyzed due
to the results found in 6.2 and the reasons explained in 6.3.
6.1. Comparison parameters
In order to compare the different codes here studied, three different parameters are used. The codes
will be assessed based on two main factors. The first one is related to the correlation between the
theoretical and experimental values. However, in order to establish the real accuracy of the codes and
how reliable they are, the safety achieved by each one will also be evaluated.
6.1.1. Correlation coefficient (R2)
The first comparison parameter is based on the Pearson correlation coefficient (R). This coefficient is
used in order to measure the correlation (linear dependence) between two variables, giving values
between +1.0 and -1.0 inclusive. A value of 1.0 implies that a linear equation describes the
relationship between the two variables, with all the data points on a line in which one variable
increases as the other one does. A value of -1.0, on the other hand, implies that all the data points lie
on a line in which if one variable increases, the other one decreases. A value of 0.0 implies that there
is no linear correlation between the variables. The expression used to compute the Pearson coefficient
for variables “x” and “y” is given below:
2_
2_
__
)()(
)()(
yyxx
yyxxr (42)
In the previous equation “_
x ” and “_
y ” corresponds to the points of the sample data. However, as a
matter of routine, it is the squared of the Pearson coefficient (r2 or R
2) the one that is used to compare
the variables. This is because the correlation coefficient is misleading in suggesting the existence of
more co-variation than exists, and this problem gets worse as the correlation approaches to zero. The

Assessment of current standards for evaluation of shear FRP strengthening of concrete beams
Erasmus Mundus Programme
38 ADVANCED MASTERS IN STRUCTURAL ANALYSIS OF MONUMENTS AND HISTORICAL CONSTRUCTIONS
value of R2 can be understood as the percent of the data that is the closest to the line of best fit. For
example, if r=0.894, then R2=0.800, which means that the 80% of the total variation of variable “y” can
be explained by the linear relationship between “x” and “y” (as described by a linear regression
equation). The other 20% of the total variation of “y” remains unexplained.
Considering the multiple variables involved and the experimental nature of most of the equations used
by the codes, values of R2 higher than 70% can be related to a good performance of the equations
proposed by the guidelines. It is also important to highlight that higher values of R2 just tell information
about the good correlation between the theoretical and experimental values but they don’t give
information about the structural performance that could be achieved using a given code. In order to
have a more clear understanding, it is recommended to see Figure No. 17 in which a value of R2 close
to the one considered as appropriate is obtained. However, in the same graph, it is possible to
observe that all the most of the points fell in the side considered as unsafe, which implies that even
though a reasonable correlation is achieved, the results would lead to a non-conservative design.
6.1.2. Global safety factor (SF)
The second parameter used corresponds to the global safety factor (SF) that is achieved by using a
given code. This value is computed as the inverse of the coefficient of a trend line obtained by
assuming a linear dependence between the theoretical and experimental values. In the figures that will
be presented in this chapter, two straight lines are included. The first one, inclined 45°, represents the
trend line that would be obtained if the theoretical values are equal to the experimental ones. This line
also helps dividing the pairs of point into unsafe or safe. The dashed line, in the other hand,
corresponds to the actual linear regression obtained for the set of data.
It has to be said that the SF factor is computed as the inverse of the linear coefficient because the
graphs are made in a way that implies that the theoretical values are a function of the experimental
ones. This was done considering that most of the equations are based in regressions obtained from
the experimental data found by several researchers. In order to clarify this point, the following equation
is presented:
SF
mmVV ntheon
1exp,, (43)
It is important to notice that the regression line was computed considering a border condition which
takes into consideration that a value of 0.0 in the experimental data (Vn,exp=0.0) should be related to a
prediction of 0.0 by the theoretical equations (Vn,theo=0.0).
As limit of appropriate safety a value of 1.0 is selected taking into account that the theoretical values
were computed with using the load and material safety factors included by the code. It is needed to
point out that even if a value of SF higher than 1.0 is obtained, it doesn’t imply that the code is
completely safe because an important number of points could fell in the unsafe side of the graphs. An

Assesment of current standards for evaluation of shear FRP strengthening of concrete beams
Erasmus Mundus Programme
ADVANCED MASTERS IN STRUCTURAL ANALYSIS OF MONUMENTS AND HISTORICAL CONSTRUCTIONS 39
example of this situation can be seen in Figure No. 15 in which a SF of 1.03 is obtained. Nevertheless,
for that particular case, it is clear that a percentage of points close to the 50% are located in the
unsafe side of the graph. Taking this into account, it is also important to know which percentage of the
predicted values corresponds to unsafe predictions. In order to do so, a third parameter based on a
demerit points classification is also used (see 6.1.3). However, the global safety factor represents a
fast way to compare the different codes and in general. Values higher than 1.00 might be considered
as adequate but a more detailed study of these factors should be made based on the results obtained
using the demerit points classification system.
6.1.3. Demerit points classification
The third comparison parameter was made using the individual safety factors found for each pair of
points. In order to do so, the “Demerit Points Classification” proposed by Lima et al (2007) was used
but a modification in the classification of the safety factors was made in order to considerer the fact
that the theoretical values here computed correspond to real and not characteristic values. This
methodology consists in a weighed penalty evaluation taking into account the security factors. Table
No. 7 presents a description of the classification for the safety factors and the penalty system used:
Table �o. 7. Comparison of codes based on structural safety.
SAFETY FACTOR
CLASIFICATION PEN
<0.60 Extremely Dangerous 10
0.60-0.80 Dangerous 5
0.80-1.00 Reduced Safety 2
1.00-1.40 Appropriate Safety 0
1.40-2.40 Conservative 1
>2.40 Extremely Conservative 2
Summation
The procedure followed consists in multiply the percentage of values that fell inside a category times
the respective penalty. At the end, a summation is made in order to obtain a global value for
comparison. It has to be said that due to the fact that the percentage of points that are inside a
category was used instead of the total number of points used by Lima et al, a comparison between the
total database and the reduced ones can be performed easily, allowing a better assessment of the
evaluated codes.
6.2. Total Shear Strength
Figure No. 12 presents the comparison of the experimental values (horizontal axis) and the theoretical
values (vertical axis) of the total shear strength (concrete, steel and FRP strengthening contribution) of
concrete beams computed following the directions described by the ACI-440, the FIB Bulletin 14 and
the CNR-DT 200 for the total database obtained during the development of this document. In order to
compute the contribution of the concrete and the steel reinforcement, the ACI 318M-05, the Eurocode
2 (EC2) and the IBC – 1996 (Italian building Code) were used and added to the results found by the
ACI 440, FIB bulltin 14 and the CNR-DT 200 respectively. In addition, the Italian Guide for externally

Assessment of current standards for evaluation of shear FRP strengthening of concrete beams
Erasmus Mundus Programme
40 ADVANCED MASTERS IN STRUCTURAL ANALYSIS OF MONUMENTS AND HISTORICAL CONSTRUCTIONS
bonded FRP systems was also used in conjunction with the Eurocode 2. The first conclusion that can
be drawn from Figure No. 12 has to do with the fact that even though there is a considerable scatter
within the three different series, it is possible to see a different tendency in each one of them.
However, a best interpretation of the data can be performed using Figure No. 13, Figure No. 14 and
Figure No. 15 in which the individual data for each code is presented.
Figure �o. 12. Comparison of experimental and theoretical values for the evaluated codes.
Figure �o. 13. Comparison of experimental and theoretical values for ACI318M-05 + ACI 440.
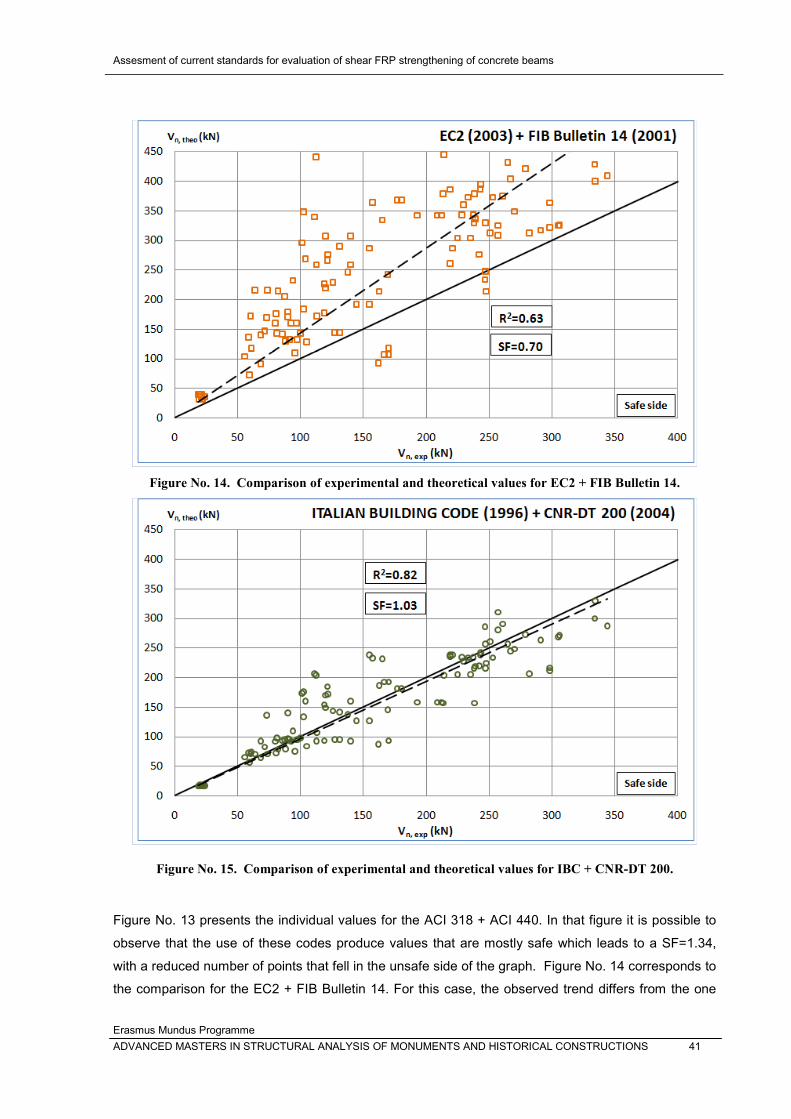
Assesment of current standards for evaluation of shear FRP strengthening of concrete beams
Erasmus Mundus Programme
ADVANCED MASTERS IN STRUCTURAL ANALYSIS OF MONUMENTS AND HISTORICAL CONSTRUCTIONS 41
Figure �o. 14. Comparison of experimental and theoretical values for EC2 + FIB Bulletin 14.
Figure �o. 15. Comparison of experimental and theoretical values for IBC + C�R-DT 200.
Figure No. 13 presents the individual values for the ACI 318 + ACI 440. In that figure it is possible to
observe that the use of these codes produce values that are mostly safe which leads to a SF=1.34,
with a reduced number of points that fell in the unsafe side of the graph. Figure No. 14 corresponds to
the comparison for the EC2 + FIB Bulletin 14. For this case, the observed trend differs from the one

Assessment of current standards for evaluation of shear FRP strengthening of concrete beams
Erasmus Mundus Programme
42 ADVANCED MASTERS IN STRUCTURAL ANALYSIS OF MONUMENTS AND HISTORICAL CONSTRUCTIONS
obtained for the ACI 440 mainly in the fact that this combination predicts values that are mostly unsafe
which leads to a safety factor lower than one (SF = 0.70). Finally, Figure No. 15 shows the behavior
obtained for the IBC + CNR-DT 200. It is seen that for this case there is almost the same probability of
obtaining safe or unsafe results, which agrees with the fact that the safety factor found is almost equal
to 1.0 (SF=1.03).
Taking into account this information, it is possible to conclude that the ACI 318 + ACI 440 is by far the
combination that predicts the safer results. The IBC + CNR-DT 200, even though has a SF higher than
one, shows that there will be the same probability of obtaining safe or unsafe results and, therefore,
are not able to generate an adequate level of safety. The EC2 + FIB Bulletin 14 has the worst
performance of the three codes studied as long as the safety factor is concerned. As a matter of fact,
just a small percentage of the data is located in the safe side of graph which leads to conclude that
these codes are unable to produce not dangerous values and the combination of the equations could
be inappropriate to be used in the design of externally bonded FRP systems for the shear
strengthening of concrete beams.
As long as the dispersion of data is concerned, the value of R2 obtained by the IBC + CNR-DT 200
(R2= 0.82) is the higher one, but it has to be said that it is just 8% higher than the one computed for
the ACI 318 + ACI 440 (R2=0.76). Both of these values are above the limit considered as appropriate
which implicates that the equations of these codes produce results that are correlated enough with the
data of the experimental tests. The EC2 + FIB Bulletin 14, in the other hand, has a R2=0.63 which is
below the limit proposed in this document.
When these results are evaluated in conjunction with the ones obtained for the SF, it is possible to
conclude that the equations of the EC2 + FIB Bulletin 14 fail in predicting safe results that have a low
dispersion with the available experimental data. This behavior is completely opposite to the one found
for the ACI 318 + ACI 440 which shows a good performance as long as these two parameters are
concerned. The IBC + CNR-DT 200, even though have a high value of R2, is not able to predict values
that are mostly safe, which implies that a examination of their equations and hypothesis should be
carried out in order to improve its performance.
After the previous discussion, it is clear that a more detailed evaluation is needed, just as it was stated
in 6.1.2. In order to do so, the results of the “Demerit Points Classification” are presented in Table No.
8. As explained in 6.1.3, this table shows the penalty for each one of the categories included and the
percentage of points that fell in a given category. The summations of these multiplications produce a
number that will be used in order to compare the different codes. However, the table is also useful to
identify which code has the largest percentage of unsafe results, which turns out to be an important
parameter to be evaluated.

Assesment of current standards for evaluation of shear FRP strengthening of concrete beams
Erasmus Mundus Programme
ADVANCED MASTERS IN STRUCTURAL ANALYSIS OF MONUMENTS AND HISTORICAL CONSTRUCTIONS 43
Table �o. 8. Comparison of codes based on structural safety.
SAFETY FACTOR
CLASIFICATION PEN ACI 440 FIB Bulletin 14 CNR-DT 200
<0.60 Extr. Dangerous 10 0.009 0.425 0.044
0.60-0.80 Dangerous 5 0.071 0.354 0.097
0.80-1.00 Reduced Safety 2 0.106 0.168 0.292
1.00-1.40 Appropriate
Safety 0 0.381 0.018 0.513
1.40-2.40 Conservative 1 0.407 0.035 0.054
>2.40 Extr.
Conservative 2 0.027 0.000 0.000
Summation 1.115 6.389 1.566
In Table No. 8 It is possible to observe that the combination of the EC2 with fib Bulletin presents the
poorest performance among the analyzed codes, with a total summation that is almost 6 times the one
obtained for the ACI 440. This result was highly anticipated by the trend and the safety factor found in
Figure No. 14. Looking in detail Table No. 8, it is seen that just the 5.3% of the results predicted by this
code are on the limit assumed for appropriate safety, with most of them found in the range considered
as extremely dangerous. For the ACI 318M-05 + ACI 440 the lower value of summation is computed.
As a matter of fact, less than the 8% of the results is in the range considers as dangerous or extremely
dangerous. The IBC (1996) + CNR-DT 200 presents a better behavior than the fib Bulletin but fells far
behind from the ACI 440. However, it is found that most of the values are still under the level accepted
as safe and it is the code that has the highest percentage located in the appropriate safety range
(51.3%).
6.2.1. Variation of variable in the EC2 + fib BULLETIN
An evaluation was made varying the values of the variable , for the equations of the EC2 and the fib
BULLETIN. This variable is supposed to range between 21.8° and 45° but usually a value of 45° is
used. However, it is possible to obtain an optimal value of which, in theory, would produce more
accurate results. In order to do so, the summation of the contributions of the concrete, the steel and
the FRP is made equal to the maximum of the shear strength permitted by the code (VRD), as shown in
the next equation:
(1) max,,, RdfRdsRd VVV
If a value of that satisfies this equation inside the range is found, this value is used to compute the
shear strength of the element. However, if the value found is not located inside the given range, is
taken as the one of the values in the extremes of the range (21.8° or 45°), depending on the side in
which the condition of equality for the previous equation is achieved. Figure No. 16 is presented in
order to clarify the procedure.

Assessment of current standards for evaluation of shear FRP strengthening of concrete beams
Erasmus Mundus Programme
44 ADVANCED MASTERS IN STRUCTURAL ANALYSIS OF MONUMENTS AND HISTORICAL CONSTRUCTIONS
Figure �o. 16. Selection of optimal : Left: Inside range. Right: Outside range.
When the results of R2 and SF presented in Figure No. 17 are compared with the ones found in Figure
No. 14, it is seen that there is just a slight improvement in both parameters. This result implies that
performing this type of analysis that is supposed to be more accurate but time consuming, doesn’t
lead to an important the enhancement of the performance of the codes.
Figure �o. 17. Comparison of experimental and theoretical values for EC2 + FIB Bulletin 14 (optimal ).
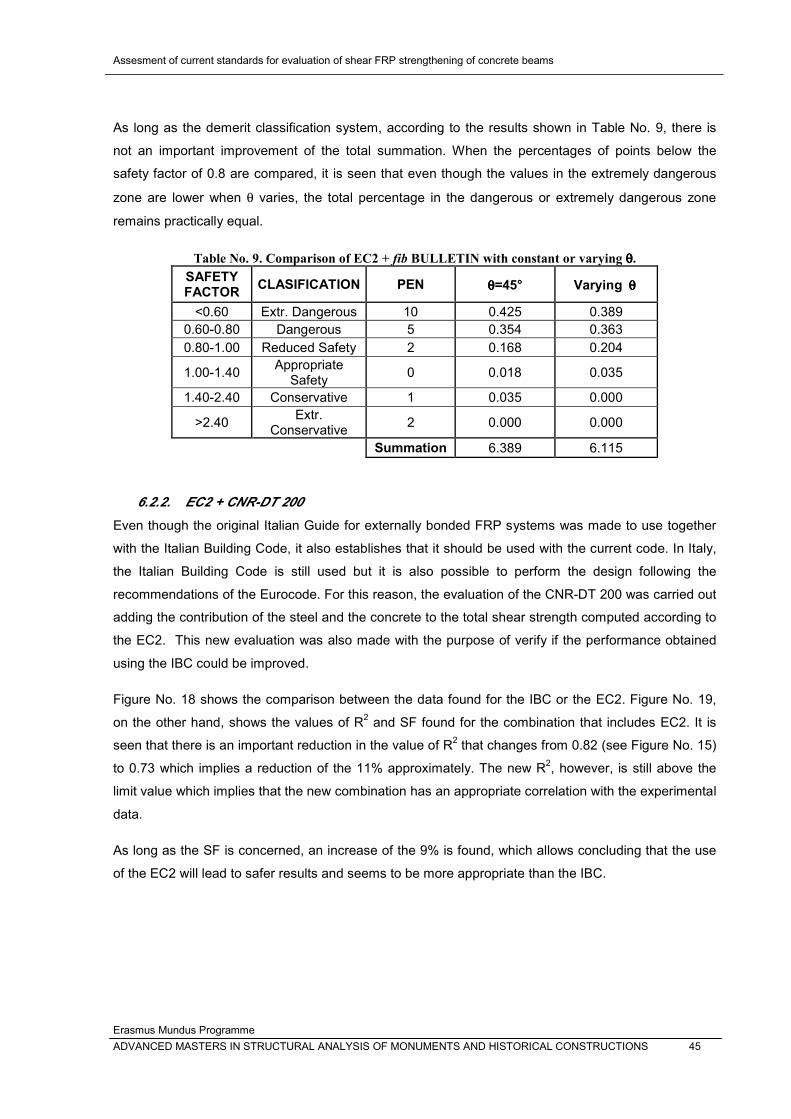
Assesment of current standards for evaluation of shear FRP strengthening of concrete beams
Erasmus Mundus Programme
ADVANCED MASTERS IN STRUCTURAL ANALYSIS OF MONUMENTS AND HISTORICAL CONSTRUCTIONS 45
As long as the demerit classification system, according to the results shown in Table No. 9, there is
not an important improvement of the total summation. When the percentages of points below the
safety factor of 0.8 are compared, it is seen that even though the values in the extremely dangerous
zone are lower when varies, the total percentage in the dangerous or extremely dangerous zone
remains practically equal.
Table �o. 9. Comparison of EC2 + fib BULLETI� with constant or varying .
SAFETY FACTOR
CLASIFICATION PEN =45° Varying
<0.60 Extr. Dangerous 10 0.425 0.389
0.60-0.80 Dangerous 5 0.354 0.363
0.80-1.00 Reduced Safety 2 0.168 0.204
1.00-1.40 Appropriate
Safety 0 0.018 0.035
1.40-2.40 Conservative 1 0.035 0.000
>2.40 Extr.
Conservative 2 0.000 0.000
Summation 6.389 6.115
6.2.2. EC2 + CNR-DT 200
Even though the original Italian Guide for externally bonded FRP systems was made to use together
with the Italian Building Code, it also establishes that it should be used with the current code. In Italy,
the Italian Building Code is still used but it is also possible to perform the design following the
recommendations of the Eurocode. For this reason, the evaluation of the CNR-DT 200 was carried out
adding the contribution of the steel and the concrete to the total shear strength computed according to
the EC2. This new evaluation was also made with the purpose of verify if the performance obtained
using the IBC could be improved.
Figure No. 18 shows the comparison between the data found for the IBC or the EC2. Figure No. 19,
on the other hand, shows the values of R2 and SF found for the combination that includes EC2. It is
seen that there is an important reduction in the value of R2 that changes from 0.82 (see Figure No. 15)
to 0.73 which implies a reduction of the 11% approximately. The new R2, however, is still above the
limit value which implies that the new combination has an appropriate correlation with the experimental
data.
As long as the SF is concerned, an increase of the 9% is found, which allows concluding that the use
of the EC2 will lead to safer results and seems to be more appropriate than the IBC.
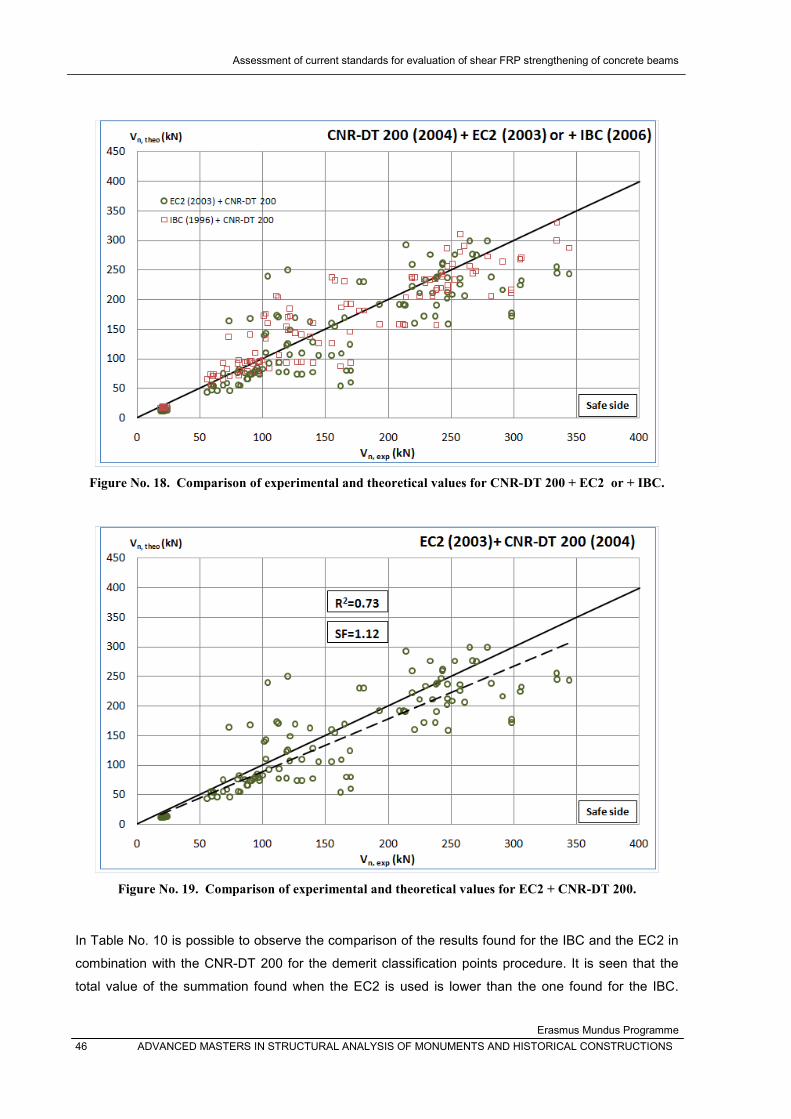
Assessment of current standards for evaluation of shear FRP strengthening of concrete beams
Erasmus Mundus Programme
46 ADVANCED MASTERS IN STRUCTURAL ANALYSIS OF MONUMENTS AND HISTORICAL CONSTRUCTIONS
Figure �o. 18. Comparison of experimental and theoretical values for C�R-DT 200 + EC2 or + IBC.
Figure �o. 19. Comparison of experimental and theoretical values for EC2 + C�R-DT 200.
In Table No. 10 is possible to observe the comparison of the results found for the IBC and the EC2 in
combination with the CNR-DT 200 for the demerit classification points procedure. It is seen that the
total value of the summation found when the EC2 is used is lower than the one found for the IBC.

Assesment of current standards for evaluation of shear FRP strengthening of concrete beams
Erasmus Mundus Programme
ADVANCED MASTERS IN STRUCTURAL ANALYSIS OF MONUMENTS AND HISTORICAL CONSTRUCTIONS 47
However, this value is still significantly higher than the one computed for the ACI 318 + ACI 440
combination (see Table No. 8).
The use of the EC2 has as consequence an important reduction of the data in the range considered
as dangerous or extremely dangerous. When the IBC the percentage in this ranges is 43% but with
the EC2 decreases to the 30%. In addition, with the EC2 most of the values are in the zone
considered as appropriate safety while when the IBC was used, they were located in the reduced
safety area.
Table �o. 10. Comparison of C�R-DT 200 with IBC or EC2.
SAFETY FACTOR
CLASIFICATION PEN IBC EC2
<0.75 Extr. Dangerous 10 0.044 0.035
0.75-1.00 Dangerous 5 0.097 0.071
1.00-1.25 Reduced Safety 2 0.292 0.195
1.25-1.75 Appropriate
Safety 0 0.513 0.469
1.75-3.00 Conservative 1 0.053 0.212
>3.00 Extr.
Conservative 2 0.000 0.018
Summation 1.566 1.345
As it was done for the EC2 + fib BULLETIN (see 6.2.1), the influence of the angle was studied for the
combination of EC2 + CNR-DT 200. Figure No. 20 presents the values of SF and R2 found.
Figure �o. 20. Comparison of experimental and theoretical values for EC2 + C�R-DT 200 (optimal ).
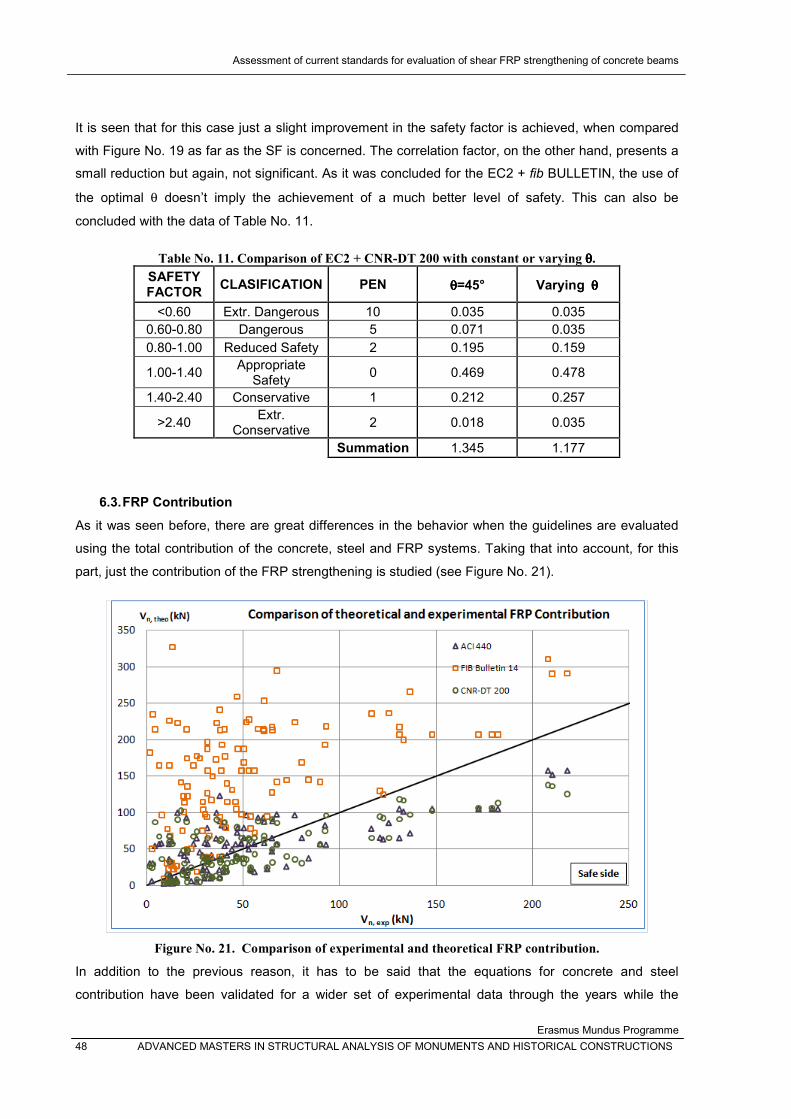
Assessment of current standards for evaluation of shear FRP strengthening of concrete beams
Erasmus Mundus Programme
48 ADVANCED MASTERS IN STRUCTURAL ANALYSIS OF MONUMENTS AND HISTORICAL CONSTRUCTIONS
It is seen that for this case just a slight improvement in the safety factor is achieved, when compared
with Figure No. 19 as far as the SF is concerned. The correlation factor, on the other hand, presents a
small reduction but again, not significant. As it was concluded for the EC2 + fib BULLETIN, the use of
the optimal doesn’t imply the achievement of a much better level of safety. This can also be
concluded with the data of Table No. 11.
Table �o. 11. Comparison of EC2 + C�R-DT 200 with constant or varying .
SAFETY FACTOR
CLASIFICATION PEN =45° Varying
<0.60 Extr. Dangerous 10 0.035 0.035
0.60-0.80 Dangerous 5 0.071 0.035
0.80-1.00 Reduced Safety 2 0.195 0.159
1.00-1.40 Appropriate
Safety 0 0.469 0.478
1.40-2.40 Conservative 1 0.212 0.257
>2.40 Extr.
Conservative 2 0.018 0.035
Summation 1.345 1.177
6.3. FRP Contribution
As it was seen before, there are great differences in the behavior when the guidelines are evaluated
using the total contribution of the concrete, steel and FRP systems. Taking that into account, for this
part, just the contribution of the FRP strengthening is studied (see Figure No. 21).
Figure �o. 21. Comparison of experimental and theoretical FRP contribution.
In addition to the previous reason, it has to be said that the equations for concrete and steel
contribution have been validated for a wider set of experimental data through the years while the

Assesment of current standards for evaluation of shear FRP strengthening of concrete beams
Erasmus Mundus Programme
ADVANCED MASTERS IN STRUCTURAL ANALYSIS OF MONUMENTS AND HISTORICAL CONSTRUCTIONS 49
equations for the FRP systems, as it was pointed out in former chapters, are still in a process of
development. In order to clarify the differences between the particular equations of the codes, the
same procedure made in 6.2 was carried out, including only the results obtained from the ACI 440, the
fib Bulletin and the CNR-DT 200. Figure No. 21 presents the comparison of the theoretical and
experimental values obtained using the codes for the FRP contribution to the shear strength. Figure
No. 22, Figure No. 23 and Figure No. 24 present in an individual fashion the trends for the different
codes. It is seen that the fib bulletin has still the poorest performance as far as the SF is concerned
when contribution of the FRP is studied; the safety factor is approximately 40% lower than the one
presented in Figure No. 14. The ACI 440 presents a reduction in the SF, but it is still in the range of
appropriate safety considered in this document. As far as the Italian guidelines are concerned, a major
improvement in the safety is achieved, varying from a SF of 1.03, shown in Figure No. 15 (or 1.12,
when the EC2 is used) to 1.33. This implies that when only the FRP contribution on the strengthening
is studied, the CNR-DT 200 presents the better performance, as long as the SF is regarded. However,
the ACI 440 is still able to predict values that can be considered as mostly safe. However, even though
there is an improvement in the SF for the Italian Guideline, it also can be seen an important reduction
in the correlation factor R2. This behavior is also observed for the other two codes. As a matter of fact,
when the FRP contribution is studied alone, neither of the codes reaches the target value selected as
appropriate (R2=0.70). The ACI 440 and the CNR-DT 200 have similar values of this factor (0.49 and
0.51, respectively) but the fib BULLETIN fells, again, far behind with an R2=0.26, which could be
anticipated just observing the high dispersion of the data presented in Figure No. 23.
Figure �o. 22. Comparison of experimental and theoretical values for ACI 440.

Assessment of current standards for evaluation of shear FRP strengthening of concrete beams
Erasmus Mundus Programme
50 ADVANCED MASTERS IN STRUCTURAL ANALYSIS OF MONUMENTS AND HISTORICAL CONSTRUCTIONS
Figure �o. 23. Comparison of experimental and theoretical values for fib Bulletin 14.
Figure �o. 24. Comparison of experimental and theoretical values for C�R-DT 200.
Table No. 12 presents the results found for the Demerit Points Classification. It is seen that the Fib
bulletin has, again, the poorest performance. It is also observed that for this code almost all the values
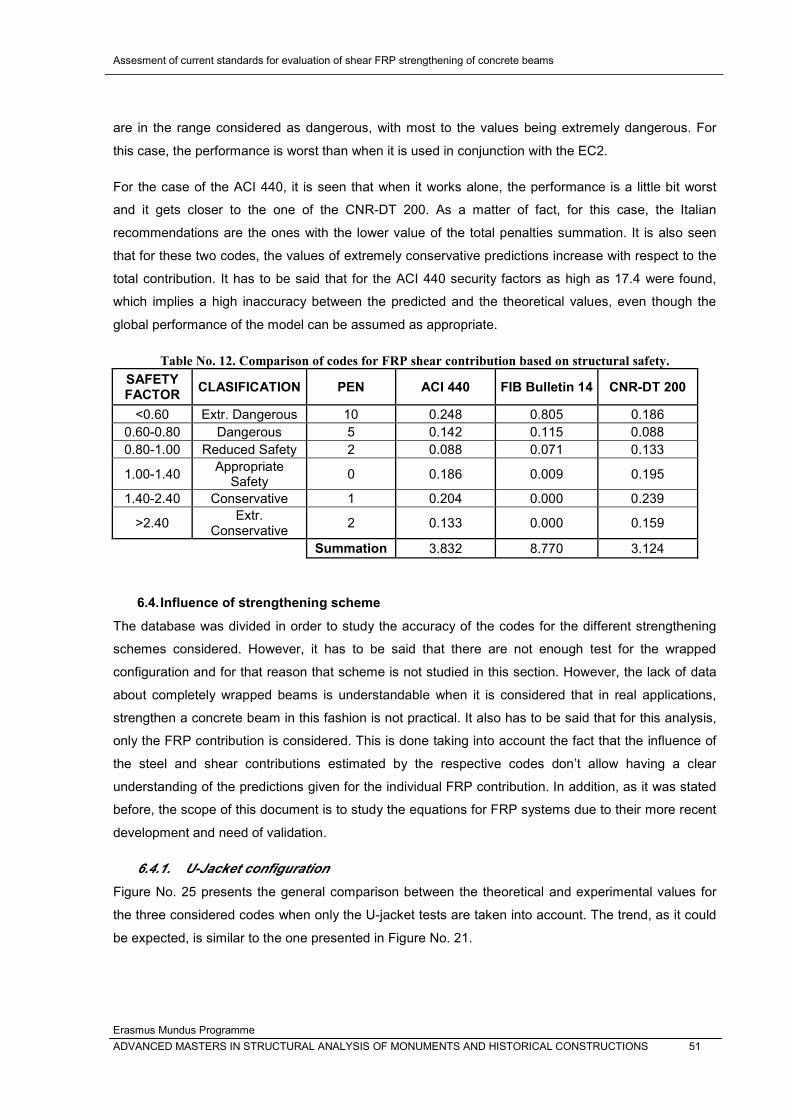
Assesment of current standards for evaluation of shear FRP strengthening of concrete beams
Erasmus Mundus Programme
ADVANCED MASTERS IN STRUCTURAL ANALYSIS OF MONUMENTS AND HISTORICAL CONSTRUCTIONS 51
are in the range considered as dangerous, with most to the values being extremely dangerous. For
this case, the performance is worst than when it is used in conjunction with the EC2.
For the case of the ACI 440, it is seen that when it works alone, the performance is a little bit worst
and it gets closer to the one of the CNR-DT 200. As a matter of fact, for this case, the Italian
recommendations are the ones with the lower value of the total penalties summation. It is also seen
that for these two codes, the values of extremely conservative predictions increase with respect to the
total contribution. It has to be said that for the ACI 440 security factors as high as 17.4 were found,
which implies a high inaccuracy between the predicted and the theoretical values, even though the
global performance of the model can be assumed as appropriate.
Table �o. 12. Comparison of codes for FRP shear contribution based on structural safety.
SAFETY FACTOR
CLASIFICATION PEN ACI 440 FIB Bulletin 14 CNR-DT 200
<0.60 Extr. Dangerous 10 0.248 0.805 0.186
0.60-0.80 Dangerous 5 0.142 0.115 0.088
0.80-1.00 Reduced Safety 2 0.088 0.071 0.133
1.00-1.40 Appropriate
Safety 0 0.186 0.009 0.195
1.40-2.40 Conservative 1 0.204 0.000 0.239
>2.40 Extr.
Conservative 2 0.133 0.000 0.159
Summation 3.832 8.770 3.124
6.4. Influence of strengthening scheme
The database was divided in order to study the accuracy of the codes for the different strengthening
schemes considered. However, it has to be said that there are not enough test for the wrapped
configuration and for that reason that scheme is not studied in this section. However, the lack of data
about completely wrapped beams is understandable when it is considered that in real applications,
strengthen a concrete beam in this fashion is not practical. It also has to be said that for this analysis,
only the FRP contribution is considered. This is done taking into account the fact that the influence of
the steel and shear contributions estimated by the respective codes don’t allow having a clear
understanding of the predictions given for the individual FRP contribution. In addition, as it was stated
before, the scope of this document is to study the equations for FRP systems due to their more recent
development and need of validation.
6.4.1. U-Jacket configuration
Figure No. 25 presents the general comparison between the theoretical and experimental values for
the three considered codes when only the U-jacket tests are taken into account. The trend, as it could
be expected, is similar to the one presented in Figure No. 21.

Assessment of current standards for evaluation of shear FRP strengthening of concrete beams
Erasmus Mundus Programme
52 ADVANCED MASTERS IN STRUCTURAL ANALYSIS OF MONUMENTS AND HISTORICAL CONSTRUCTIONS
Figure �o. 25. Comparison of experimental and theoretical FRP contribution for U-jacket configuration.
Figure �o. 26. Comparison of experimental and theoretical values for ACI 440.

Assesment of current standards for evaluation of shear FRP strengthening of concrete beams
Erasmus Mundus Programme
ADVANCED MASTERS IN STRUCTURAL ANALYSIS OF MONUMENTS AND HISTORICAL CONSTRUCTIONS 53
Figure �o. 27. Comparison of experimental and theoretical values for fib BULLETI� 14.
Figure �o. 28. Comparison of experimental and theoretical values for C�R-DT 200.
Figure No. 26 presents the results according to the ACI 440. For this case, the safety factor found
(1.20) is lower than the one found when all kind of tests were included. The reduction is not important
and the achieved safety level is still on the appropriate safety range. However, there are an important
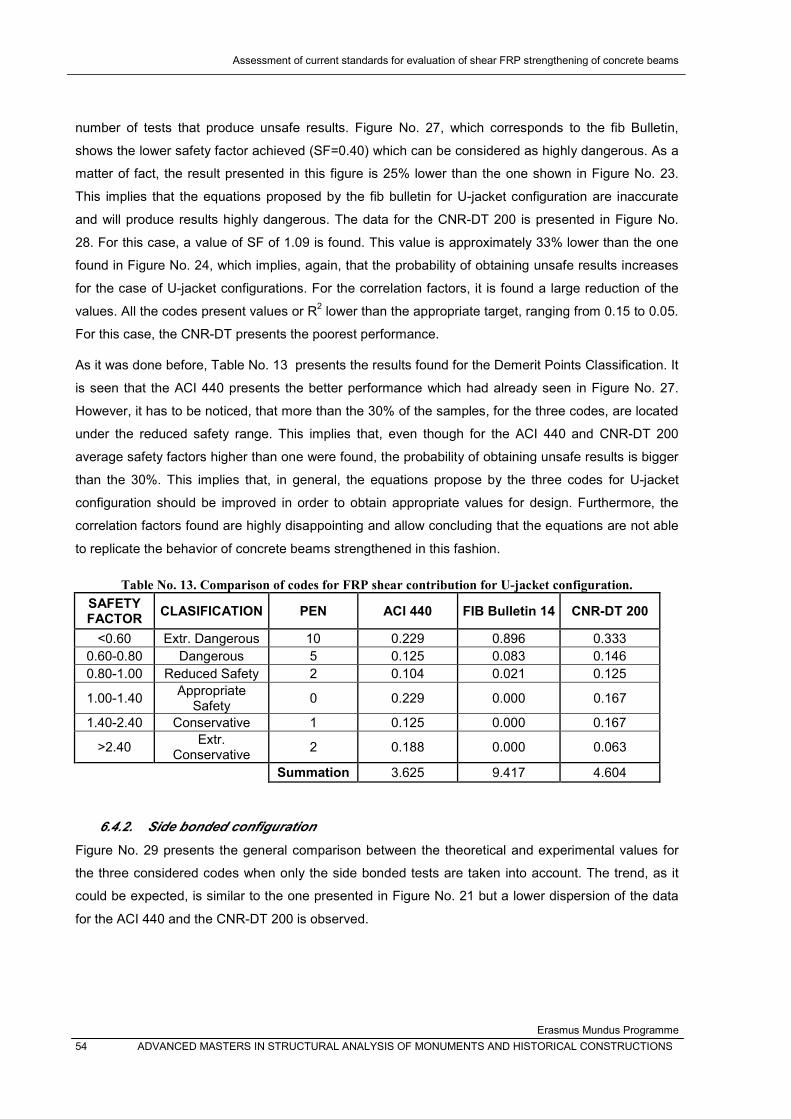
Assessment of current standards for evaluation of shear FRP strengthening of concrete beams
Erasmus Mundus Programme
54 ADVANCED MASTERS IN STRUCTURAL ANALYSIS OF MONUMENTS AND HISTORICAL CONSTRUCTIONS
number of tests that produce unsafe results. Figure No. 27, which corresponds to the fib Bulletin,
shows the lower safety factor achieved (SF=0.40) which can be considered as highly dangerous. As a
matter of fact, the result presented in this figure is 25% lower than the one shown in Figure No. 23.
This implies that the equations proposed by the fib bulletin for U-jacket configuration are inaccurate
and will produce results highly dangerous. The data for the CNR-DT 200 is presented in Figure No.
28. For this case, a value of SF of 1.09 is found. This value is approximately 33% lower than the one
found in Figure No. 24, which implies, again, that the probability of obtaining unsafe results increases
for the case of U-jacket configurations. For the correlation factors, it is found a large reduction of the
values. All the codes present values or R2 lower than the appropriate target, ranging from 0.15 to 0.05.
For this case, the CNR-DT presents the poorest performance.
As it was done before, Table No. 13 presents the results found for the Demerit Points Classification. It
is seen that the ACI 440 presents the better performance which had already seen in Figure No. 27.
However, it has to be noticed, that more than the 30% of the samples, for the three codes, are located
under the reduced safety range. This implies that, even though for the ACI 440 and CNR-DT 200
average safety factors higher than one were found, the probability of obtaining unsafe results is bigger
than the 30%. This implies that, in general, the equations propose by the three codes for U-jacket
configuration should be improved in order to obtain appropriate values for design. Furthermore, the
correlation factors found are highly disappointing and allow concluding that the equations are not able
to replicate the behavior of concrete beams strengthened in this fashion.
Table �o. 13. Comparison of codes for FRP shear contribution for U-jacket configuration.
SAFETY FACTOR
CLASIFICATION PEN ACI 440 FIB Bulletin 14 CNR-DT 200
<0.60 Extr. Dangerous 10 0.229 0.896 0.333
0.60-0.80 Dangerous 5 0.125 0.083 0.146
0.80-1.00 Reduced Safety 2 0.104 0.021 0.125
1.00-1.40 Appropriate
Safety 0 0.229 0.000 0.167
1.40-2.40 Conservative 1 0.125 0.000 0.167
>2.40 Extr.
Conservative 2 0.188 0.000 0.063
Summation 3.625 9.417 4.604
6.4.2. Side bonded configuration
Figure No. 29 presents the general comparison between the theoretical and experimental values for
the three considered codes when only the side bonded tests are taken into account. The trend, as it
could be expected, is similar to the one presented in Figure No. 21 but a lower dispersion of the data
for the ACI 440 and the CNR-DT 200 is observed.

Assesment of current standards for evaluation of shear FRP strengthening of concrete beams
Erasmus Mundus Programme
ADVANCED MASTERS IN STRUCTURAL ANALYSIS OF MONUMENTS AND HISTORICAL CONSTRUCTIONS 55
Figure �o. 29. Comparison of experimental and theoretical FRP contribution for Side bonded
configuration.
The data for the ACI 440 is presented in Figure No. 30. In this graph, it is possible to see that the
safety factor found is approximately 6% higher than the one found for the U-jacket configuration (see
Figure No. 26). The fib Bulletin, presents again a low safety factor, as can be seen in Figure No. 31.
However, it is 35% higher than the one found for the U-jacket configuration. Unfortunately, the value
found for the side bonded configuration is still in the extremely dangerous range proposed in this
document. This implies that the use of this code should be avoided in order to obtain safe results.
When the data for the CNR-DT is observed (see Figure No. 32), it can be seen that this presents the
highest value of the safety factor found (SF=1.47). As a matter of fact, this value is the highest found
for the side bonded or U-jacket configuration. When this result is compared with the one presented in
Figure No. 28, it is easily seen that that the equations presented in the code for side bonded
configuration are safer than the ones presented for the U-jacket configuration. The CNR-DT 200 also
exhibits the higher value of the correlation coefficient (R2=0.87) that is a sign of the accurate results
that can be achieved by the use of this code for the strengthening of concrete beams using a side
bonded configuration. The ACI 440 and the fib BULLETIN show, again, a poor performance as long as
correlation is concerned. As a matter of fact, the values of R2 obtained for these two codes are
noteworthy, especially in the case of the European guideline.
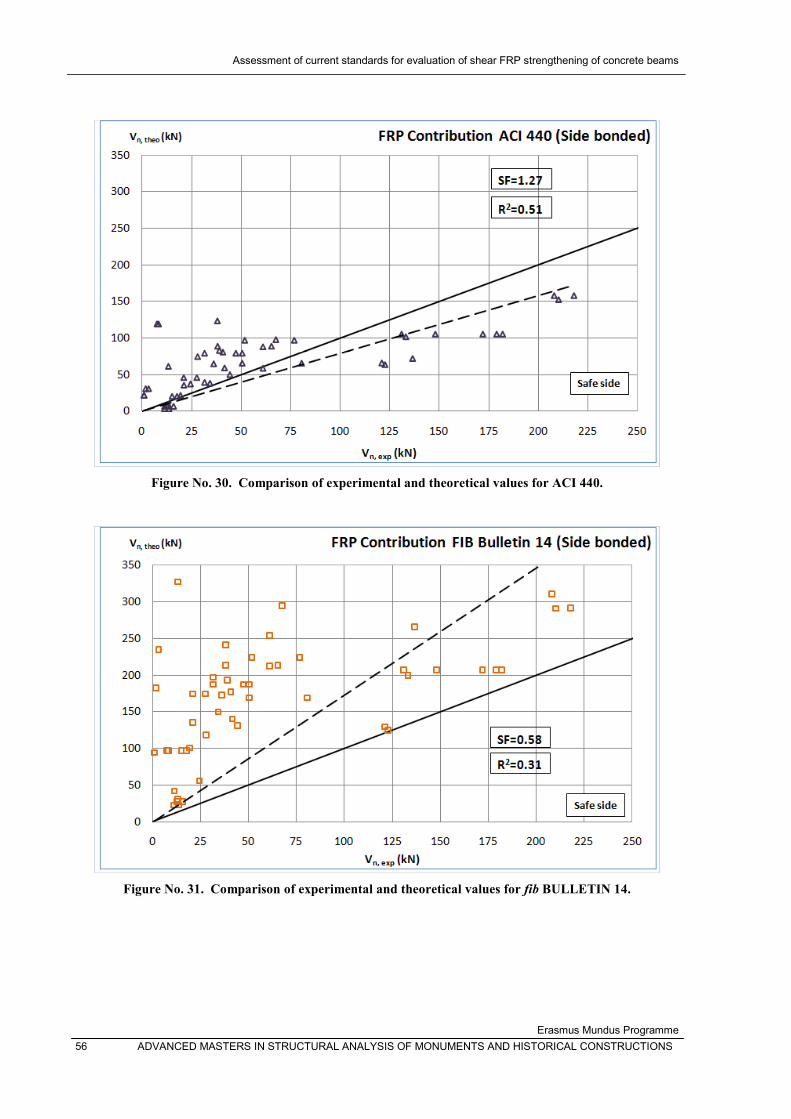
Assessment of current standards for evaluation of shear FRP strengthening of concrete beams
Erasmus Mundus Programme
56 ADVANCED MASTERS IN STRUCTURAL ANALYSIS OF MONUMENTS AND HISTORICAL CONSTRUCTIONS
Figure �o. 30. Comparison of experimental and theoretical values for ACI 440.
Figure �o. 31. Comparison of experimental and theoretical values for fib BULLETI� 14.
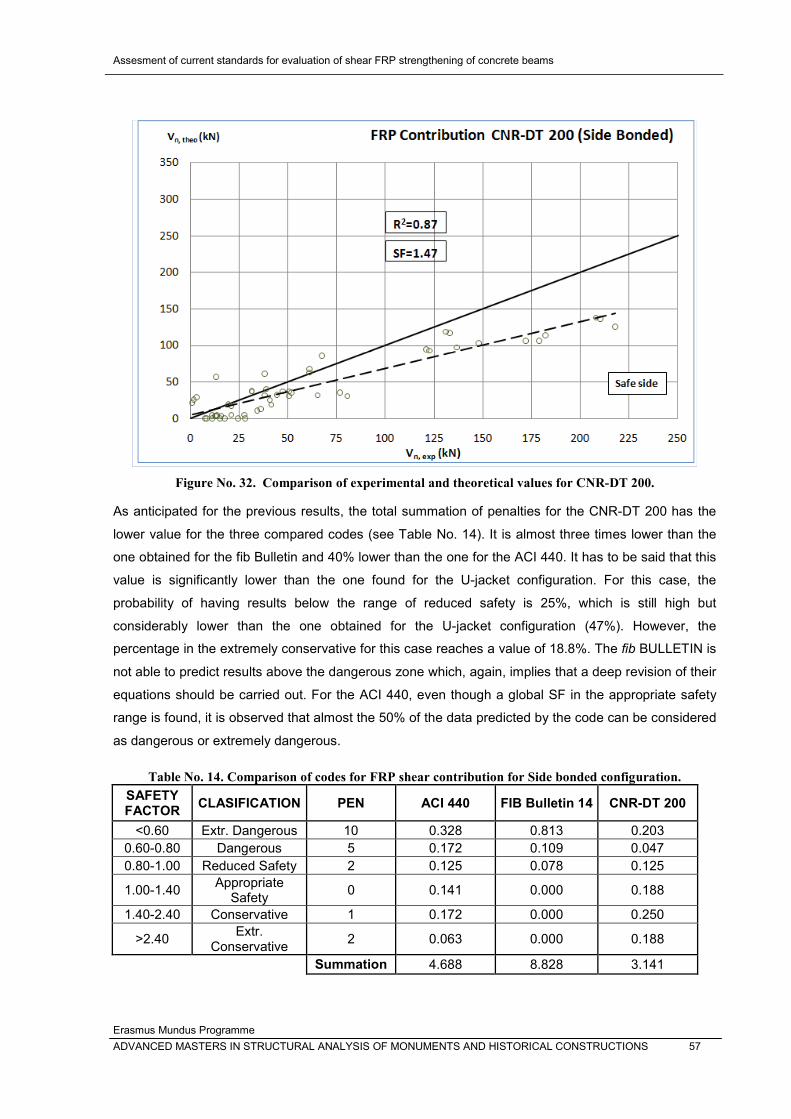
Assesment of current standards for evaluation of shear FRP strengthening of concrete beams
Erasmus Mundus Programme
ADVANCED MASTERS IN STRUCTURAL ANALYSIS OF MONUMENTS AND HISTORICAL CONSTRUCTIONS 57
Figure �o. 32. Comparison of experimental and theoretical values for C�R-DT 200.
As anticipated for the previous results, the total summation of penalties for the CNR-DT 200 has the
lower value for the three compared codes (see Table No. 14). It is almost three times lower than the
one obtained for the fib Bulletin and 40% lower than the one for the ACI 440. It has to be said that this
value is significantly lower than the one found for the U-jacket configuration. For this case, the
probability of having results below the range of reduced safety is 25%, which is still high but
considerably lower than the one obtained for the U-jacket configuration (47%). However, the
percentage in the extremely conservative for this case reaches a value of 18.8%. The fib BULLETIN is
not able to predict results above the dangerous zone which, again, implies that a deep revision of their
equations should be carried out. For the ACI 440, even though a global SF in the appropriate safety
range is found, it is observed that almost the 50% of the data predicted by the code can be considered
as dangerous or extremely dangerous.
Table �o. 14. Comparison of codes for FRP shear contribution for Side bonded configuration.
SAFETY FACTOR
CLASIFICATION PEN ACI 440 FIB Bulletin 14 CNR-DT 200
<0.60 Extr. Dangerous 10 0.328 0.813 0.203
0.60-0.80 Dangerous 5 0.172 0.109 0.047
0.80-1.00 Reduced Safety 2 0.125 0.078 0.125
1.00-1.40 Appropriate
Safety 0 0.141 0.000 0.188
1.40-2.40 Conservative 1 0.172 0.000 0.250
>2.40 Extr.
Conservative 2 0.063 0.000 0.188
Summation 4.688 8.828 3.141

Assessment of current standards for evaluation of shear FRP strengthening of concrete beams
Erasmus Mundus Programme
58 ADVANCED MASTERS IN STRUCTURAL ANALYSIS OF MONUMENTS AND HISTORICAL CONSTRUCTIONS
6.5. Influence of steel shear reinforcement
As pointed out for some researches (Pellegrino and Modena, 2002), the influence of the amount of
existing transverse steel reinforcement on the shear capacity a beam strengthened in shear with FRP
is still not totally understood and its worth clarifying.
In order to study, the influence of the shear steel reinforcement, the database a reduced database was
created, including the data for the samples made with and without shear steel reinforcement (SSR and
NSSR). The comparison was made for the U-jacket and side bonding configuration separately
because, as it was seen in 6.4, the performance of the test is highly influenced by the type of
strengthening scheme.
6.5.1. U-Jackets configuration
In Figure No. 33, Figure No. 34 and Figure No. 35, it is possible to observe the evaluation of the three
studied codes. For this case, it is seen that the ACI 440 presents the higher value of the safety factor
(SF=1.47) which is in the conservative category. This value is 22.5% higher than the one presented in
Figure No. 26. This code also presents the higher value of the correlation coefficient, which is again,
significantly higher than the one computed when the data with and without shear steel reinforcement
was studied. This behavior implies that for the case of the equations proposed by the ACI 440, the
influence of the transverse reinforcement should be studied in order to improve the performance of the
code. For the fib BULLETIN and the CNR-DT 200, the same behavior is observed, this is an
improvement in the correlation and safety factors but It is worth notice that the three codes still have
correlation factors behind the set limit.
Figure �o. 33. Comparison of experimental and theoretical values for ACI 440 without shear steel
reinforcement.
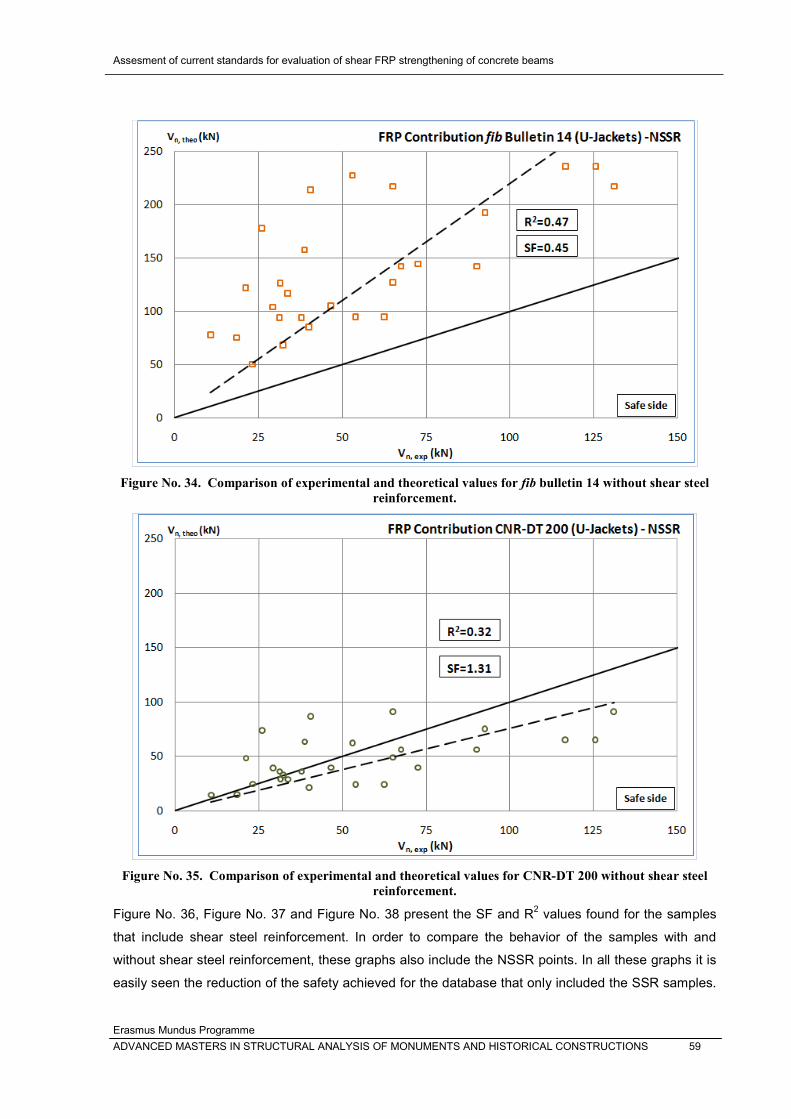
Assesment of current standards for evaluation of shear FRP strengthening of concrete beams
Erasmus Mundus Programme
ADVANCED MASTERS IN STRUCTURAL ANALYSIS OF MONUMENTS AND HISTORICAL CONSTRUCTIONS 59
Figure �o. 34. Comparison of experimental and theoretical values for fib bulletin 14 without shear steel
reinforcement.
Figure �o. 35. Comparison of experimental and theoretical values for C�R-DT 200 without shear steel
reinforcement.
Figure No. 36, Figure No. 37 and Figure No. 38 present the SF and R2 values found for the samples
that include shear steel reinforcement. In order to compare the behavior of the samples with and
without shear steel reinforcement, these graphs also include the NSSR points. In all these graphs it is
easily seen the reduction of the safety achieved for the database that only included the SSR samples.

Assessment of current standards for evaluation of shear FRP strengthening of concrete beams
Erasmus Mundus Programme
60 ADVANCED MASTERS IN STRUCTURAL ANALYSIS OF MONUMENTS AND HISTORICAL CONSTRUCTIONS
As matter of fact, for the SSR, all the codes produce SF lower than the reduced safety range. When
the correlation factors are compared, also a significant reduction is observed.
Figure �o. 36. Comparison of experimental and theoretical values for ACI 440 with and without shear
steel reinforcement.
Figure �o. 37. Comparison of experimental and theoretical values for fib bulletin 14 with and without
shear steel reinforcement.

Assesment of current standards for evaluation of shear FRP strengthening of concrete beams
Erasmus Mundus Programme
ADVANCED MASTERS IN STRUCTURAL ANALYSIS OF MONUMENTS AND HISTORICAL CONSTRUCTIONS 61
Figure �o. 38. Comparison of experimental and theoretical values for C�R-DT 200 with and without
shear steel reinforcement.
Table No. 15 presents a comparison of the results found using the demerit classification points for the
database including shear steel reinforcement and for the one with only the samples with NSSR. It is
seen that only the fib bulletin presents a worst performance for the NSSR condition, but it has to be
noticed that for this particular case, the change in behavior is not significant due to the fact that the
predictions of this code for both cases are mostly in the extremely dangerous zone. On the other hand,
the ACI 440 and the CNR-DT 200 present a significant improvement in the total penalties summation,
but this change is more important for the American code. For this case, only there is 11% probability of
getting results under the reduced safety range. This allows concluding that the equations of this code
are appropriate for concrete beams without shear reinforcement but should be improved for concrete
elements that include transverse steel.
Table �o. 15. Comparison of codes for FRP shear contribution with and without shear steel reinforcement
(U-jacket configuration).
SAFETY FACTOR
ACI 440 FIB Bulletin 14 CNR-DT 200
TOTAL NSSR SSR TOTAL NSSR SSR TOTAL NSSR SSR
<0.60 0.229 0.037 0.524 0.896 0.889 0.905 0.333 0.111 0.619
0.60-0.80 0.125 0.074 0.143 0.083 0.111 0.048 0.146 0.148 0.143
0.80-1.00 0.104 0.185 0.190 0.021 0.000 0.048 0.125 0.148 0.095
1.00-1.40 0.229 0.259 0.000 0.000 0.000 0.000 0.167 0.296 0.000
1.40-2.40 0.125 0.333 0.048 0.000 0.000 0.000 0.167 0.259 0.048
>2.40 0.188 0.111 0.095 0.000 0.000 0.000 0.063 0.037 0.000
3.625 1.667 6.571 9.417 9.444 9.381 4.604 2.481 7.143

Assessment of current standards for evaluation of shear FRP strengthening of concrete beams
Erasmus Mundus Programme
62 ADVANCED MASTERS IN STRUCTURAL ANALYSIS OF MONUMENTS AND HISTORICAL CONSTRUCTIONS
6.5.2. Side bonded configuration
In Figure No. 39, Figure No. 40 and Figure No. 41, it is possible to observe the evaluation of the three
studied codes for side bonded configuration without shear steel reinforcement.
Figure �o. 39. Comparison of experimental and theoretical values for ACI 440 without shear steel
reinforcement.
Figure �o. 40. Comparison of experimental and theoretical values for fib bulletin 14 without shear steel
reinforcement.
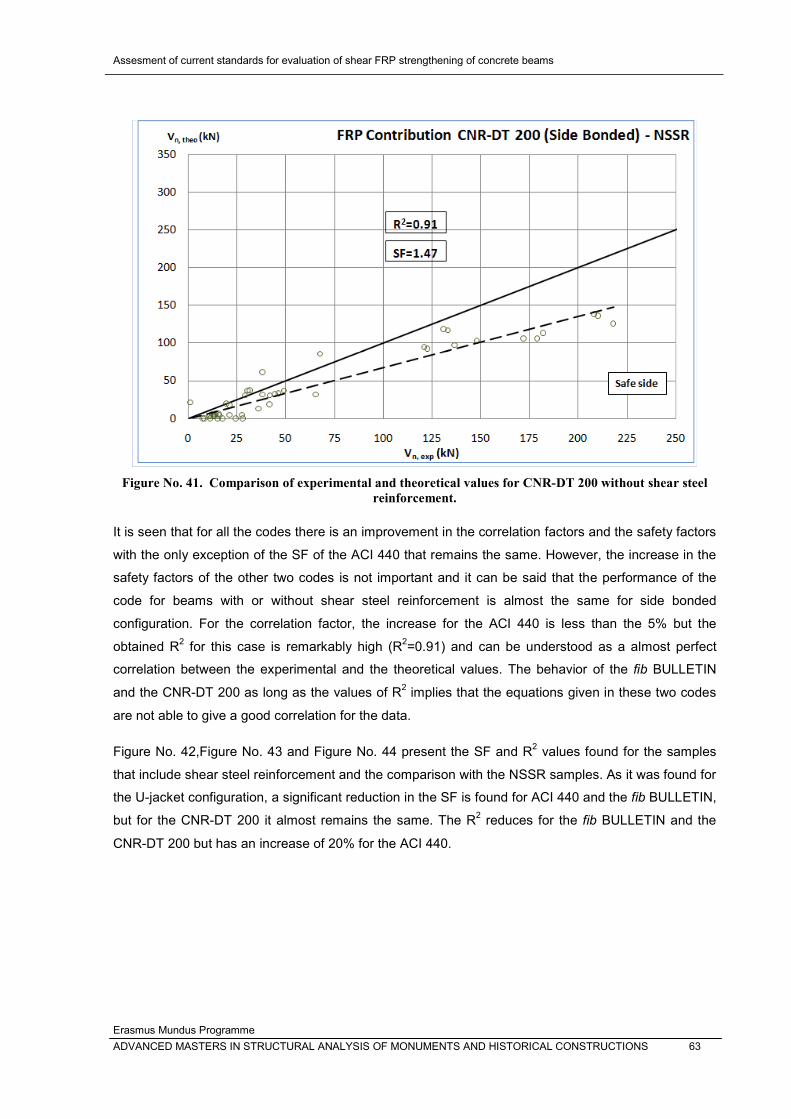
Assesment of current standards for evaluation of shear FRP strengthening of concrete beams
Erasmus Mundus Programme
ADVANCED MASTERS IN STRUCTURAL ANALYSIS OF MONUMENTS AND HISTORICAL CONSTRUCTIONS 63
Figure �o. 41. Comparison of experimental and theoretical values for C�R-DT 200 without shear steel
reinforcement.
It is seen that for all the codes there is an improvement in the correlation factors and the safety factors
with the only exception of the SF of the ACI 440 that remains the same. However, the increase in the
safety factors of the other two codes is not important and it can be said that the performance of the
code for beams with or without shear steel reinforcement is almost the same for side bonded
configuration. For the correlation factor, the increase for the ACI 440 is less than the 5% but the
obtained R2 for this case is remarkably high (R
2=0.91) and can be understood as a almost perfect
correlation between the experimental and the theoretical values. The behavior of the fib BULLETIN
and the CNR-DT 200 as long as the values of R2 implies that the equations given in these two codes
are not able to give a good correlation for the data.
Figure No. 42,Figure No. 43 and Figure No. 44 present the SF and R2 values found for the samples
that include shear steel reinforcement and the comparison with the NSSR samples. As it was found for
the U-jacket configuration, a significant reduction in the SF is found for ACI 440 and the fib BULLETIN,
but for the CNR-DT 200 it almost remains the same. The R2 reduces for the fib BULLETIN and the
CNR-DT 200 but has an increase of 20% for the ACI 440.

Assessment of current standards for evaluation of shear FRP strengthening of concrete beams
Erasmus Mundus Programme
64 ADVANCED MASTERS IN STRUCTURAL ANALYSIS OF MONUMENTS AND HISTORICAL CONSTRUCTIONS
Figure �o. 42. Comparison of experimental and theoretical values for ACI 440 with and without shear
steel reinforcement.
Figure �o. 43. Comparison of experimental and theoretical values for fib bulletin 14 with and without
shear steel reinforcement.

Assesment of current standards for evaluation of shear FRP strengthening of concrete beams
Erasmus Mundus Programme
ADVANCED MASTERS IN STRUCTURAL ANALYSIS OF MONUMENTS AND HISTORICAL CONSTRUCTIONS 65
Figure �o. 44. Comparison of experimental and theoretical values for C�R-DT 200 with and without
shear steel reinforcement.
In Table No. 16, it is seen that there is an important reduction in the total summation for NSSR
according to the fib BULLETIN which actually corresponds to best behavior obtained with this code.
For the ACI 440, the improvement is more important, passing from 7.176 to 3.787. For the CNR-DT
200 the results remain almost the same. The change is principally due to the augment of the
percentage under the reduced safety level. However, this code still remains the one with the lowest
summation and when this is added to that fact that it also presents the higher R2, it is clear that the
Italian Guideline corresponds to the code with the best performance for the NSSR.
Table �o. 16. Comparison of codes for FRP shear contribution with and without shear steel reinforcement
(Side bonded configuration).
SAFETY FACTOR
ACI 440 FIB Bulletin 14 CNR-DT 200
TOTAL NSSR SSR TOTAL NSSR SSR TOTAL NSSR SSR
<0.60 0.328 0.234 0.588 0.813 0.745 1.000 0.203 0.191 0.235
0.60-0.80 0.172 0.149 0.235 0.109 0.149 0.000 0.047 0.106 0.059
0.80-1.00 0.125 0.149 0.059 0.078 0.106 0.000 0.125 0.085 0.235
1.00-1.40 0.141 0.149 0.118 0.000 0.000 0.000 0.188 0.191 0.118
1.40-2.40 0.172 0.234 0.000 0.000 0.000 0.000 0.250 0.234 0.235
>2.40 0.063 0.085 0.000 0.000 0.000 0.000 0.188 0.191 0.118
4.688 3.787 7.176 8.828 8.404 10.000 3.141 3.234 3.588
6.6. Overall comparison
Table No. 17 shows a global comparison of the codes according to the parameters
studied in this chapter. It presents the values of R2, SF, the summation of penalties and the
percentage of unsafe results. In this table it is possible to observe the codes that present the best and

Assessment of current standards for evaluation of shear FRP strengthening of concrete beams
Erasmus Mundus Programme
66 ADVANCED MASTERS IN STRUCTURAL ANALYSIS OF MONUMENTS AND HISTORICAL CONSTRUCTIONS
the global behavior for the different set of databases studied. It is also highlighted the highest and
lowest values for each one of the comparison studied which represents the best and worst global
achieved behavior.
Table �o. 17. Overall comparison of the codes.

Assesment of current standards for evaluation of shear FRP strengthening of concrete beams
Erasmus Mundus Programme
ADVANCED MASTERS IN STRUCTURAL ANALYSIS OF MONUMENTS AND HISTORICAL CONSTRUCTIONS 67
First of all, it is seen that the fib BULLETIN 14 has the worst behavior in all the parameters evaluated
with the exception of the correlation coefficient achieved by the CNR-DT 200 in the Vfrp contribution for
the U-jacket configuration. It is remarkable how the BULLETIN is not able to predict an acceptable
percentage of safe values. As a matter of fact, all the results found for the Vfrp contribution for the U-
jacket and side bonded configuration schemes are unsafe. However, it has to be said that at the
moment the recommendations of the fib BULLETIN 14 are going under revision which is understood
after analyzing the results found in this document.
As long as the ACI 440 and the CNR-DT 200, both show a similar behavior but still aren’t able to
predict an appropriate percentage of safer values, especially for the case of Vfrp contribution for the U-
jacket configuration. For this case, it is remarkable how the behavior of these codes is worst for the
case of beams with SSR, which implies that the equations provided for these guidelines should be
improved for the case of concrete beams with the presence of steel reinforcement for shear.
For the side bonded configuration, it is seen how the CNR-DT 200 has the best behavior and that the
equations are good enough for SSR and NSSR beams. As a matter of fact, the behavior is almost the
same but there is a remarkable reduction in the correlation coefficient for the SSR case. It is also seen
that for the case of the NSSR CNR-DT 200 for side bonded scheme, a correlation factor of 0.91 is
found which corresponds to an almost perfect match between the theoretical and experimental values.

Assessment of current standards for evaluation of shear FRP strengthening of concrete beams
Erasmus Mundus Programme
68 ADVANCED MASTERS IN STRUCTURAL ANALYSIS OF MONUMENTS AND HISTORICAL CONSTRUCTIONS
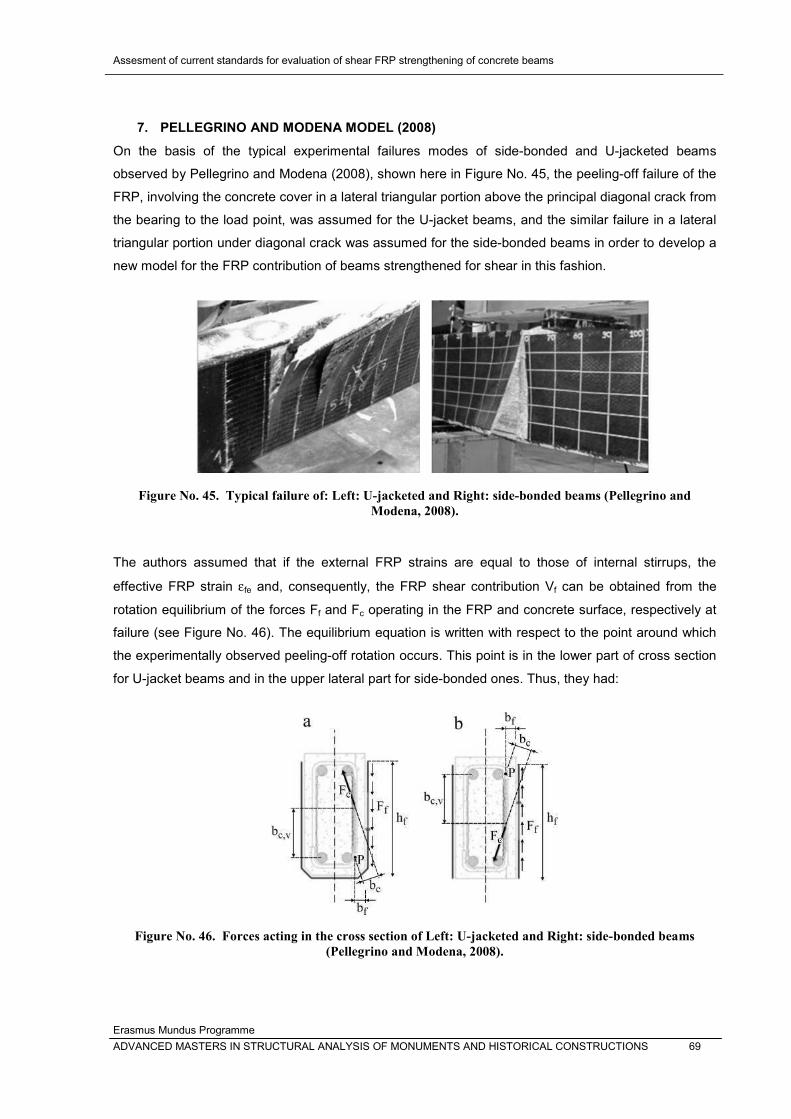
Assesment of current standards for evaluation of shear FRP strengthening of concrete beams
Erasmus Mundus Programme
ADVANCED MASTERS IN STRUCTURAL ANALYSIS OF MONUMENTS AND HISTORICAL CONSTRUCTIONS 69
7. PELLEGRINO AND MODENA MODEL (2008)
On the basis of the typical experimental failures modes of side-bonded and U-jacketed beams
observed by Pellegrino and Modena (2008), shown here in Figure No. 45, the peeling-off failure of the
FRP, involving the concrete cover in a lateral triangular portion above the principal diagonal crack from
the bearing to the load point, was assumed for the U-jacket beams, and the similar failure in a lateral
triangular portion under diagonal crack was assumed for the side-bonded beams in order to develop a
new model for the FRP contribution of beams strengthened for shear in this fashion.
Figure �o. 45. Typical failure of: Left: U-jacketed and Right: side-bonded beams (Pellegrino and
Modena, 2008).
The authors assumed that if the external FRP strains are equal to those of internal stirrups, the
effective FRP strain fe and, consequently, the FRP shear contribution Vf can be obtained from the
rotation equilibrium of the forces Ff and Fc operating in the FRP and concrete surface, respectively at
failure (see Figure No. 46). The equilibrium equation is written with respect to the point around which
the experimentally observed peeling-off rotation occurs. This point is in the lower part of cross section
for U-jacket beams and in the upper lateral part for side-bonded ones. Thus, they had:
Figure �o. 46. Forces acting in the cross section of Left: U-jacketed and Right: side-bonded beams
(Pellegrino and Modena, 2008).
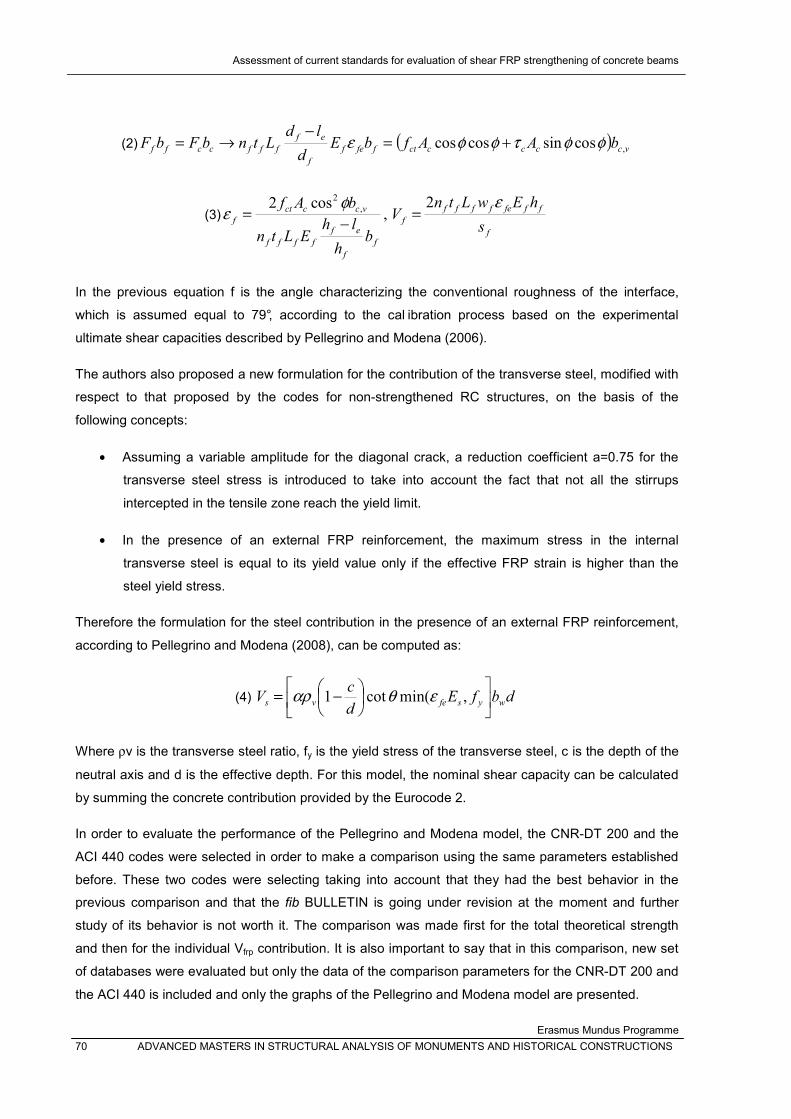
Assessment of current standards for evaluation of shear FRP strengthening of concrete beams
Erasmus Mundus Programme
70 ADVANCED MASTERS IN STRUCTURAL ANALYSIS OF MONUMENTS AND HISTORICAL CONSTRUCTIONS
(2) vccccctffef
f
ef
fffccff bAAfbEd
ldLtnbFbF ,cossincoscos
(3)
f
fffeffff
f
f
f
ef
ffff
vccct
fs
hEwLtnV
bh
lhELtn
bAf 2,
cos2 ,
2
In the previous equation f is the angle characterizing the conventional roughness of the interface,
which is assumed equal to 79°, according to the cal ibration process based on the experimental
ultimate shear capacities described by Pellegrino and Modena (2006).
The authors also proposed a new formulation for the contribution of the transverse steel, modified with
respect to that proposed by the codes for non-strengthened RC structures, on the basis of the
following concepts:
Assuming a variable amplitude for the diagonal crack, a reduction coefficient a=0.75 for the
transverse steel stress is introduced to take into account the fact that not all the stirrups
intercepted in the tensile zone reach the yield limit.
In the presence of an external FRP reinforcement, the maximum stress in the internal
transverse steel is equal to its yield value only if the effective FRP strain is higher than the
steel yield stress.
Therefore the formulation for the steel contribution in the presence of an external FRP reinforcement,
according to Pellegrino and Modena (2008), can be computed as:
(4) dbfEd
cV wysfevs ,min(cot1
Where v is the transverse steel ratio, fy is the yield stress of the transverse steel, c is the depth of the
neutral axis and d is the effective depth. For this model, the nominal shear capacity can be calculated
by summing the concrete contribution provided by the Eurocode 2.
In order to evaluate the performance of the Pellegrino and Modena model, the CNR-DT 200 and the
ACI 440 codes were selected in order to make a comparison using the same parameters established
before. These two codes were selecting taking into account that they had the best behavior in the
previous comparison and that the fib BULLETIN is going under revision at the moment and further
study of its behavior is not worth it. The comparison was made first for the total theoretical strength
and then for the individual Vfrp contribution. It is also important to say that in this comparison, new set
of databases were evaluated but only the data of the comparison parameters for the CNR-DT 200 and
the ACI 440 is included and only the graphs of the Pellegrino and Modena model are presented.

Assesment of current standards for evaluation of shear FRP strengthening of concrete beams
Erasmus Mundus Programme
ADVANCED MASTERS IN STRUCTURAL ANALYSIS OF MONUMENTS AND HISTORICAL CONSTRUCTIONS 71
7.1. Total Shear Strength
Figure No. 47 show the data obtained for the Pellegrino and Modena model for the total shear strength
(concrete, steel and FRP contribution) and it includes the values of SF and R2. Table No. 18, in the
other hand, shows the comparison with the selected codes. It is worth notice that in that table, it has
been included the evaluation of the codes for NSSR and SSR elements.
Figure �o. 47. Comparison of experimental and theoretical values for Pellegrino and Modena Model –
Total Shear Strength.
Table �o. 18. Assessment of Pellegrino and Modena Model for Total Shear Strength.

Assessment of current standards for evaluation of shear FRP strengthening of concrete beams
Erasmus Mundus Programme
72 ADVANCED MASTERS IN STRUCTURAL ANALYSIS OF MONUMENTS AND HISTORICAL CONSTRUCTIONS
From the previous table, it is possible to see how the Pellegrino and Modena presents in general a
better behavior than the selected codes, especially as the percentage of unsafe results is concerned.
As a matter of fact, for NSSR concrete beams, the use of this model would imply obtaining results that
are mostly safe. In addition to that, for SSR elements a value of unsafe results of 2.6% is found, which
is considerably low than the one obtained for the ACI 440 and the CNR-DT 200. For that case, also
the Pellegrino and Modena presents the higher value of correlation factor (R2=0.67) that is a little bit
lower than the accepted value but it is still much higher than the obtained with the other codes.
The previous table also allows concluding that the behavior of the concrete beams with shear steel
reinforcement is different from the ones without this kind of reinforcement. This aspect should be
studied more in detail in order to improve and update the equations given by the codes.
7.2. FRP Contribution
The comparison of the codes for the Vfrp contribution is presented here. In Figure No. 48, the data for
the U-jacket and side bonded configurations predicted by the Pellegrino and Modena model is
included. For Figure No. 49 and Figure No. 50, the database was divided according to the
configuration scheme. In these graphs, it is possible to see that there is reduction of the correlation
factor when it is compared with the one presented in Figure No. 47. This difference is explained by the
fact that the R2 found for the U-jacket configuration is significantly lower than the one found for the
side bonded scheme.
Figure �o. 48. Comparison of experimental and theoretical values for Pellegrino and Modena Model –
Vfrp contribution.

Assesment of current standards for evaluation of shear FRP strengthening of concrete beams
Erasmus Mundus Programme
ADVANCED MASTERS IN STRUCTURAL ANALYSIS OF MONUMENTS AND HISTORICAL CONSTRUCTIONS 73
Figure �o. 49. Comparison of experimental and theoretical values for Pellegrino and Modena Model for
U-jacket scheme– Vfrp contribution.
Figure �o. 50. Comparison of experimental and theoretical values for Pellegrino and Modena Model for
Side bonded scheme– Vfrp contribution.
In Table No. 19, the comparison of the codes with the model of Pellegrino and Modena (2008) is
presented.

Assessment of current standards for evaluation of shear FRP strengthening of concrete beams
Erasmus Mundus Programme
74 ADVANCED MASTERS IN STRUCTURAL ANALYSIS OF MONUMENTS AND HISTORICAL CONSTRUCTIONS
Table �o. 19. Assessment of Pellegrino and Modena Model for Vfrp Contribution.
In the previous table, it is seen that the model of Pellegrino and Modena has in general the best
behavior. However, it has to be said that all the codes and the model seem to have problems to
predict the behavior of beams with shear steel reinforcement.
Assesment of current standards for evaluation of shear FRP strengthening of concrete beams
Erasmus Mundus Programme
ADVANCED MASTERS IN STRUCTURAL ANALYSIS OF MONUMENTS AND HISTORICAL CONSTRUCTIONS 75
8. CONCLUSIONS
The comparison procedure based on the parameters introduced in this document showed to
be adequate for assessing the codes. With this procedure, it was possible to evaluate the
correlation between the experimental and theoretical data as well as the level of safety
achieved by the use of the given codes.
The fib BULLETIN 14 presents, in general, the worst behavior of the studied codes for the
comparison parameters included in this document. As a matter of fact, according to the
evaluation carried out here, its use would lead to a high probability of getting an unsafe result.
However, it has to be said that the provisions of this code are being evaluated and an update
is supposed to be release soon.
It was observed that the codes have a better behavior when the contribution of the concrete
and of the steel is added to the FRP contribution. As example, the CNR-DT 200 and the ACI
440, when used in conjunction with their respective codes, show a performance with adequate
levels of safety, including percentage of unsafe results of 14.2% and 8%. This values
increase to 27.4% and 38.9% respectively when only the FRP contribution is analyzed.
More than the 35% of the values predicted by the three codes for the U-jacket configuration
are located under the reduced safety zone (SF lower than one) which implies that the
probability of obtaining safe results is lower than the 35%. Taking this into account, it is highly
recommended that a critical review of the equations given in the codes for the strengthening of
concrete beams in this fashion is carried out. This is even clearer when the correlation factors
are considered. All the three codes show a poor performance as long as the values of R2 are
concerned with a higher value of 0.15 when the target value in this document was set to 0.70.
This disappointing behavior shows, again, that the proposed recommendations are not able to
replicate the actual behavior of concrete beams strengthened by externally bonded FRP
systems in a U-jacket configuration. For this case, it is seen that the equations are more
reliable for the case of NSSR beams.
The equations proposed by the CNR-DT 200 for the FRP contribution of concrete beams
strengthened by a side bonding configuration, present a good agreement between the
experimental data and the predicted values as can be concluded from the value of the
correlation factor (R2=0.87). For this configuration, the Italian Guideline also presents an
adequate value of global safety factor (SF=1.47) but still there is a 25% probability of getting
values under the reduced safety level. However, the performance of the CNR-DT 200 is by far
the best of the studied codes and its use should be recommended to establish the FRP
contribution for this type of strengthening configuration. For the side bonded configuration, it is
seen how the CNR-DT 200 has the best behavior and that the equations are good enough for

Assessment of current standards for evaluation of shear FRP strengthening of concrete beams
Erasmus Mundus Programme
76 ADVANCED MASTERS IN STRUCTURAL ANALYSIS OF MONUMENTS AND HISTORICAL CONSTRUCTIONS
SSR and NSSR beams. As a matter of fact, the behavior is almost the same but there is a
remarkable reduction in the correlation coefficient for the SSR case.
The influence of the shear steel reinforcement is notorious, especially for the case of U-jacket
strength configuration. This allows concluding that this aspect should be studied more in detail
in order to improve and update the equations given by the codes.
The Pellegrino and Modena model showed to have a behavior that in some cases is better
than the one presented by the standards. This is especially noticed for the case of concrete
beams with side bonded configuration. However, it is also seen that some improvements are
still needed in order to evaluate the influence of the presence of shear steel reinforcement.
Assesment of current standards for evaluation of shear FRP strengthening of concrete beams
Erasmus Mundus Programme
ADVANCED MASTERS IN STRUCTURAL ANALYSIS OF MONUMENTS AND HISTORICAL CONSTRUCTIONS 77
9. REFERENCES
ACI “440.2R-02: Guide for the design and construction of externally bonded FRP systems for
strengthening of concrete structures”, 2002, Reported by ACI Committee 440.
fib “Bulletin 14 – Externally Bonded FRP reinforcement for RC structures” Technical report, 2001, Task
Group 9.3 FRP (fiber reinforced polymer) reinforcement for concrete structures.
CNR-DT200 “Guidelines for desing, execution and control of strengthening interventions by means of
fiber reinforced composites”, 2004, National Research Council.
Adhikary, B.B., Mutsuyoshi, H., Behavior of concrete beams strengthened in shear with carbon-fiber
sheets, Journal of Composites for Construction may-june 2004; pp. 258-264.
Adhikary, B.B., Mutsuyoshi, H., Ashraf, M., Effective shear strengthening of concrete beams using
FRP sheets with bonded anchorage, FRPRCS.6: Externally bonded reinforcement for shear 2003: pp.
457-466.
Banerjee, S., Mosallan, A. S., Shear enhancement of reinforced concrete beams strengthened with
FPR composite laminates, Composites Part B 38 2007; pp. 781 – 793.
Barros, J.A.O., Dias, S.J.E., Near surface mounted CFRP laminates for shear strengthening of
concrete beams, Cement & Concrete Composites, Vol. 28 2006; pp. 276-292.
Bousselhan, A., Chaallal, O., Maximum shear strength of RC beams retrofitted in shear with FRP
composites, Journal of Composites for Construction july – august 2009; pp. 302 – 314.
Chaallal, O., Bousselham, A., Behavior of reinforced concrete T-Beams strengthened in shear with
carbon fiber-reinforced polymer. An experimental study, ACI Structural Journal 2006; pp. 339-347.
Chaallal, O., Bousselham, A., Effect of transverse steel and shear span on the performance of RC
beams strengthened in shear with CFRP, Composites: part B (engineering) Vol. 37 2006; pp. 37-46.
Chaallal, O., Nollet, M. J., Perraton, D., Shear strengthening of RC beams by externally bonded side
CFRP strips, Journal of Composites for Construction 1998; pp. 111-113.
Cao, S., Chen, J., Teng, J., Hao, Z., Debonding in RC beams shear strengthened with complete FRP
wraps, Journal of composites construction sept.-oct. 2005; pp. 417-428.
Caicedo, N., Use of FRP and TRM jackets for ductility in reinforced concrete columns, Rose School
Master’s thesis, 2007.
Deniaud, C., Cheng, J.J.R., Reinforced concrete T-beams strengthened in shear with fiber reinforced
polymers sheets, Journal of Composites for Construction 2003; pp. 302-310.
Fico, R., Prota, A., Manfredi, G., Assesment of Eurocode-like design equations for the shear capacity
of FRP RC members, Composites: Part B 39 2008; pp. 792-806.

Assessment of current standards for evaluation of shear FRP strengthening of concrete beams
Erasmus Mundus Programme
78 ADVANCED MASTERS IN STRUCTURAL ANALYSIS OF MONUMENTS AND HISTORICAL CONSTRUCTIONS
Guadagnini, M., Pilakoutas, K., Waldron, P., Shear resistance of FRP RC beams: Experimental study,
Journal of Composites for Construction nov. – dec. 2006; pp. 464 – 473.
Godat, A., Neale, K. W., Labossiere, P., Numerical modeling of FRP shear-strengthened reinforced
concrete beams, Journal of Composites for Construction nov. – dec. 2007; pp. 640 – 649.
Ianniruberto, U., Imbimbo, M., Role of fiber reinforced concrete beams using carbón fiber reinforced
polymers laminates, Journal of Composites for Construction sept.-oct. 2004; pp. 415-424.
Islam, R., Inventory of FRP strengthening methods in masonry structures, MSC-SAHC Master’s
thesis, 2008.
Khalifa, A, Nanni, A., Rehabilitation of rectangular simply supported RC beams with shear deficiencies
using CFRP composites, Construction & Building vol. 16 2002; pp. 135-146.
Khalifa, A, Nanni, A., Improving shear capacity of existing RC T-section beams using CFRP
composites, Cement & Concrete Composites vol. 22 2000; pp. 165-174.
Khalifa, A., Nanni, A., Belarbi, A., Tumialan, G., Shear strengthening of continuous reinforced concrete
beams using externally bonded carbón fiber reinforced polymer sheets, FRPRCS-4:Externally bonded
reinforcement for shear 1999; pp. 995-1008.
Leung, K. Y. L., Chen, Z., Lee, S., Ng, M., Xu, M., Tang, J., Effect of size on the failure of
geometrically similar concrete beams strengthened in shear with FRP strips, Journal of Composites for
Construction 2007; pp. 487-496.
Lima, J.L.T., Barros, J.A.O., Desing models for shear strengthening of reinforced concrete beams with
externally bonded FRP composites: A statistical versus reliability approach, FRPRCS-8 2007.
Megalooikonomou, K., Modelling of FRP-confinement of rectangular RC sections, Rose School
Master’s thesis, 2007.
Monti, G., Liotta, M., Test and desing equations for FRP-strengthening in shear, Construction &
Building Materials 21 2007; pp. 799-809.
Pellegrino, C., Modena, C., An experimentally based analytical model for the shear capacity of FRP-
strengthened reinforced concrete beams, Mechanics of Composite Materials Vol. 44 No. 3 2008; pp.
231-244.
Pellegrino, C., Modena, C., Fiber reinforced polymer shear strengthening of reinforced concrete
beams with transverse steel reinforcement, Journal of Composites for Construction 2002; pp. 104-111.
Peloso, S., FRP seismic retrofit of square hollow section bridge piers, Rose School Maters’s thesis,
2003.

Assesment of current standards for evaluation of shear FRP strengthening of concrete beams
Erasmus Mundus Programme
ADVANCED MASTERS IN STRUCTURAL ANALYSIS OF MONUMENTS AND HISTORICAL CONSTRUCTIONS 79
Sas, G., Taljsten, B., Barros, J., Lima, J., Carolin, A., Are available models reliable for predicting the
FRP contribution to shear resistance of RC beams?, Journal of Composites for Construction nov.-dec.
2009; pp. 514-534.
Sas, G., Carolin, A., Taljsten, B., A model for predicting the shear bearing capacity of FRP-
strengthened beams, Mechanics of Composite Materials, Vol. 44 No. 3 2008; pp. 245 – 256.
Taljsten, B., Carolin, A., Experimental study of strengthening for increased shear bearing capacity,
Journal of composites construction nov.- dec. 2005; pp. 488-496.
Taerwe, L, Khalil, H., Matthys, S., Behaviour or RC beams strengthening in shear by external CFRP
sheets, FRPRCS-3: Non metallic (FRP) reinforcement for concrete structures 1997.
Taljsten, B., Strengthening concrete beams for shear with CFRP sheets, Construction & Building
Materials vol. 17 2003, pp. 15-23.
Teng, J. G., Chen, G. M., Chen, J. F., Rosenboom, O. A., Lam, L. Behavior of RC beams shear
strengthened with bonded or unbounded FRP wraps, Journal of Composites for Construction Sept.-
Oct. 2009; pp. 394-404.
Triantafillou, T., Shear strengthening or reinforced concrete beams using epoxy-bonded FRP
composites, ACI Structural Journal march-april 1998; pp. 107-115.
Triantafillou, T., Antonopoulos, C., Desing of concrete flexural members strengthened in shear with
FRP, Journal of Composites for Construction Nov. 2000; pp. 198-205.
Yalim, B., Kalayci, A. S., Mirmiran, A., Performance of FRP-Strengthened RC beams with different
concrete surface profiles, Journal of Composites for Construction nov.- dec. 2008; pp. 626-638.
Zhang, Z., Hsu, C., Shear strengthening of reinforced concrete beams using carbon fiber reinforced
polymer laminates”, Journal of composites for construction march-april 2005; pp. 158-169.