assessment of contributing factors to the reduction of diarrhea in rural communities of para, brazil
TRANSCRIPT
ASSESSMENT OF CONTRIBUTING FACTORS TO THE REDUCTION OF DIARRHEA IN
RURAL COMMUNITIES OF PARA, BRAZIL
Lee Voth-GaeddertPhD Student
Environmental Systems Engineering Dr. Daniel Oerther
AdviserMissouri University of Science and Technology

Overview
• The Problem• The Biosand Filter• The Hypothesis• Previous Work• Location• Structural Equation Modeling• Confirmatory Analysis• Results• Conclusion
The Problem
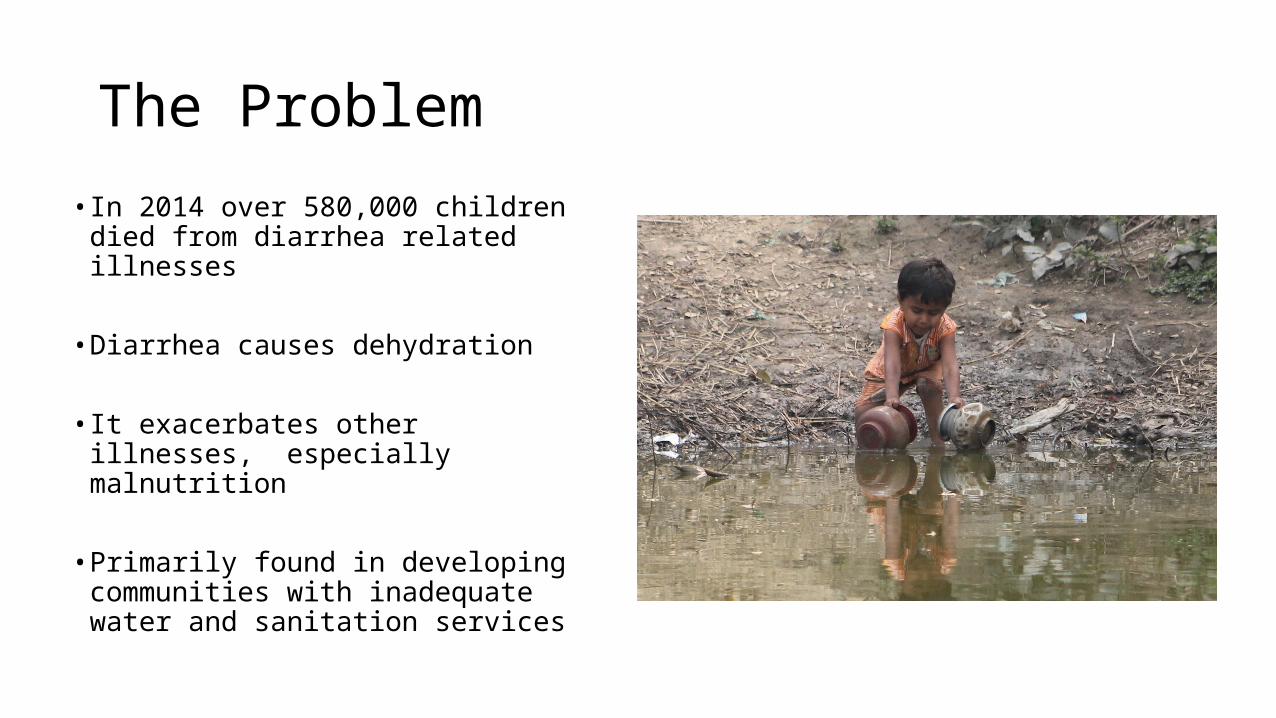
• In 2014 over 580,000 children died from diarrhea related illnesses
• Diarrhea causes dehydration
• It exacerbates other illnesses, especially malnutrition
• Primarily found in developing communities with inadequate water and sanitation services
The Problem
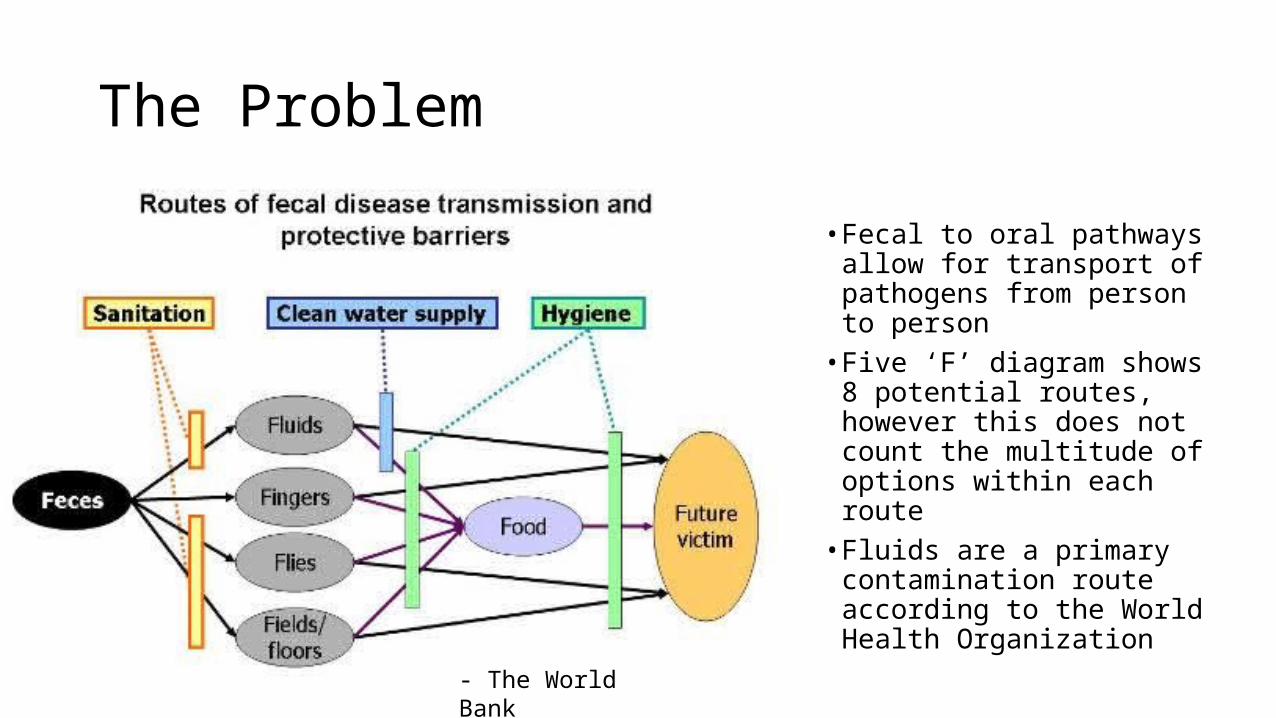
• Fecal to oral pathways allow for transport of pathogens from person to person• Five ‘F’ diagram shows 8
potential routes, however this does not count the multitude of options within each route• Fluids are a primary
contamination route according to the World Health Organization
- The World Bank
The Biosand Filter
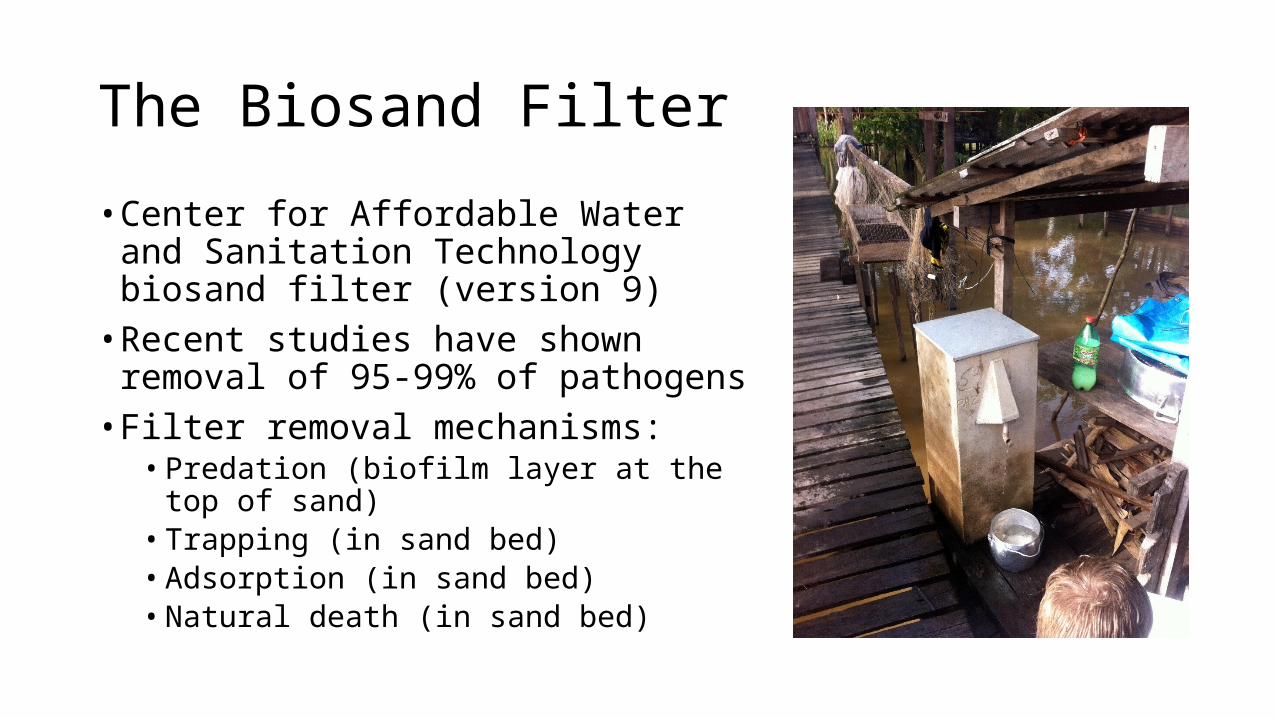
• Center for Affordable Water and Sanitation Technology biosand filter (version 9)• Recent studies have shown removal of 95-
99% of pathogens• Filter removal mechanisms:• Predation (biofilm layer at the top of sand)• Trapping (in sand bed)• Adsorption (in sand bed)• Natural death (in sand bed)
The Biosand Filter
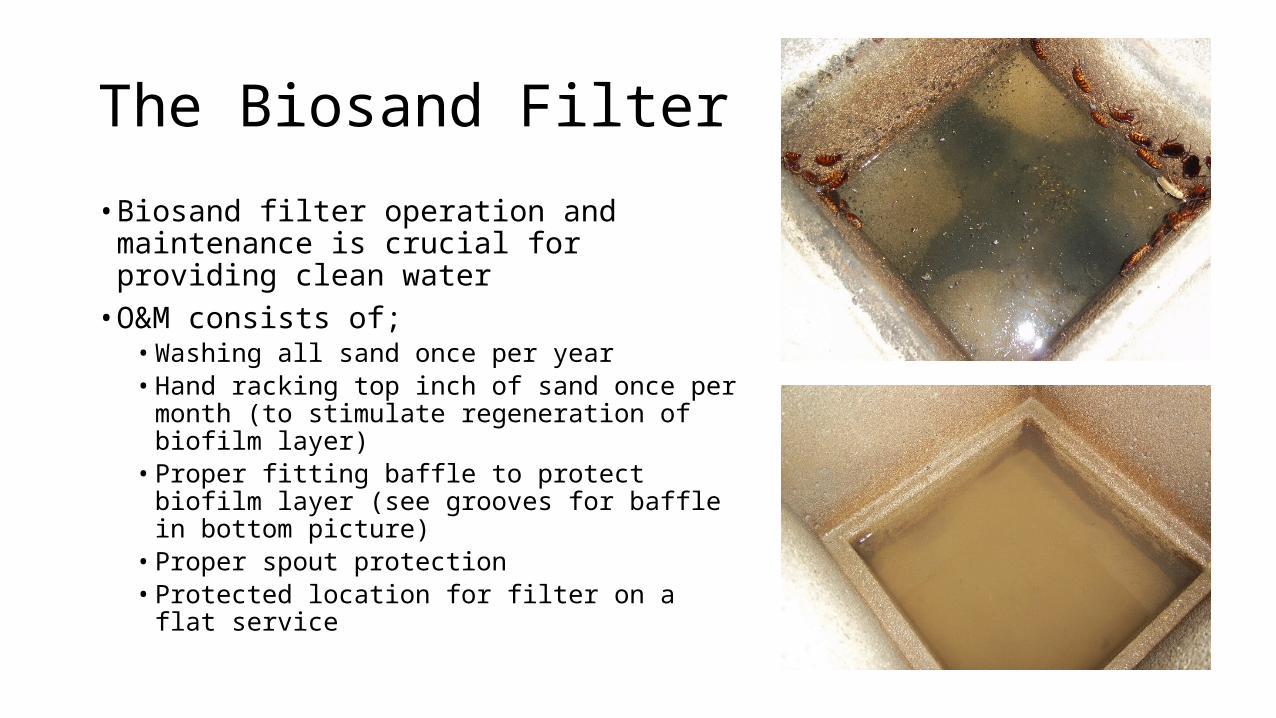
• Biosand filter operation and maintenance is crucial for providing clean water• O&M consists of;• Washing all sand once per year• Hand racking top inch of sand once per
month (to stimulate regeneration of biofilm layer)• Proper fitting baffle to protect biofilm layer
(see grooves for baffle in bottom picture)• Proper spout protection• Protected location for filter on a flat service

The Hypothesis
• Is the operation of the biosand filter the most significant factor in reducing diarrheal occurrences?
• Other factors:• Household Education Level (HEL)• Socio-Economic Status (SES)• Improved Water Treatment (IWT)*• Improved Water Source (IWS)*• Improved Water Storage (IWSt)*• Improved Sanitation (IMS)*
*Defined by the World Health Organization

Previous Work - Guatemala
• Rural communities in the northern highlands in Quiche, Guatemala• Previously displaced villages,
subsistence farming communities, very poor• Biosand filters were utilized within
households to provide clean water• Divelbiss et al. 2013 found education
and water source were the most important factors for reducing diarrheal occurrences
- www.flickriver.com

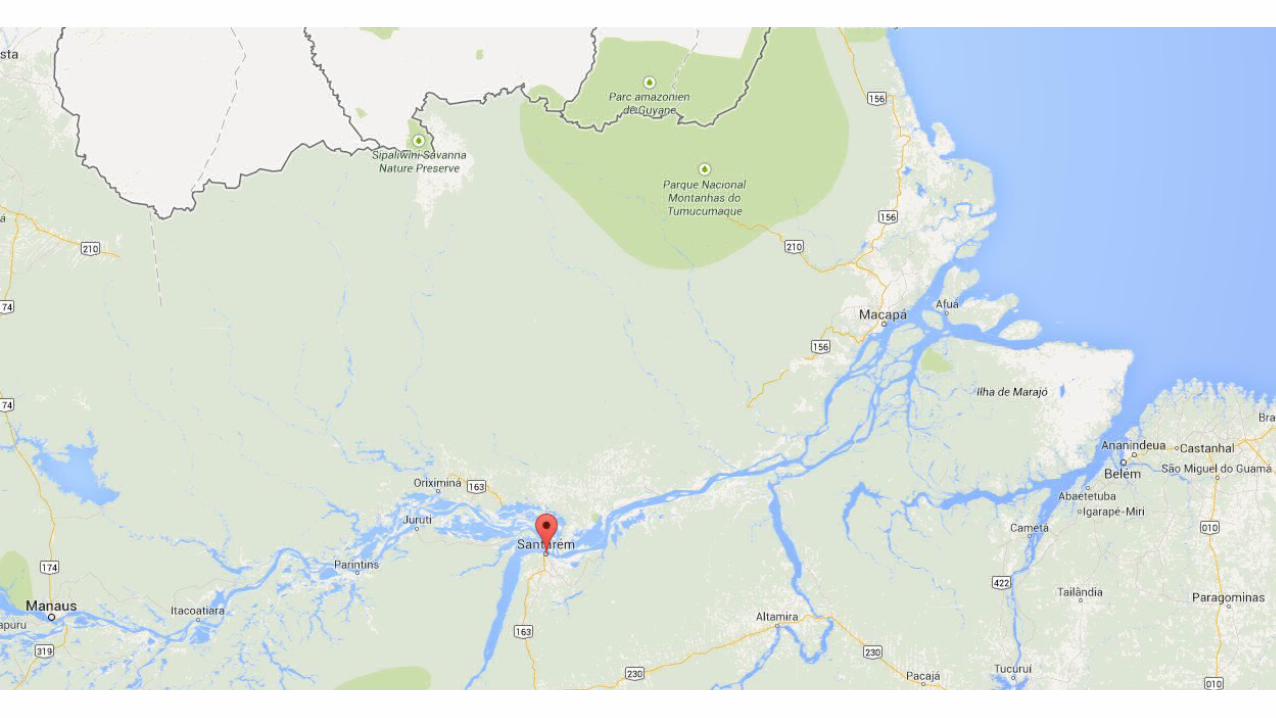
Location – northwest of Santarem, Para, Brazil
• Project Amazon distributed over 10,000 biosand filters in Para, Brazil• Villages located along the Amazon
River flood 2-5 months each year• The Amazon River is the primary
water source within the region• Adapted the Guatemalan statistical
model and survey for use in Brazil• Survey validated through multiple
translators, local practitioners and field observations
Structural Equation Modeling
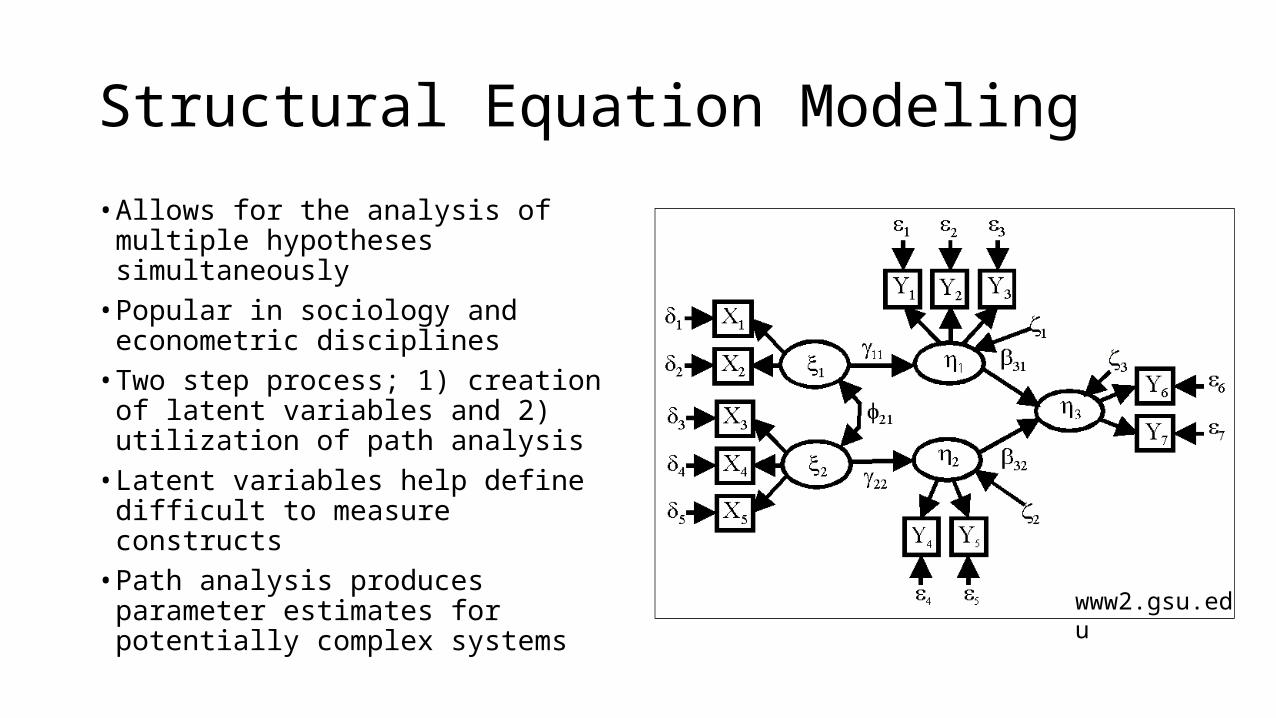
• Allows for the analysis of multiple hypotheses simultaneously • Popular in sociology and econometric
disciplines• Two step process; 1) creation of
latent variables and 2) utilization of path analysis • Latent variables help define difficult
to measure constructs• Path analysis produces parameter
estimates for potentially complex systems
www2.gsu.edu
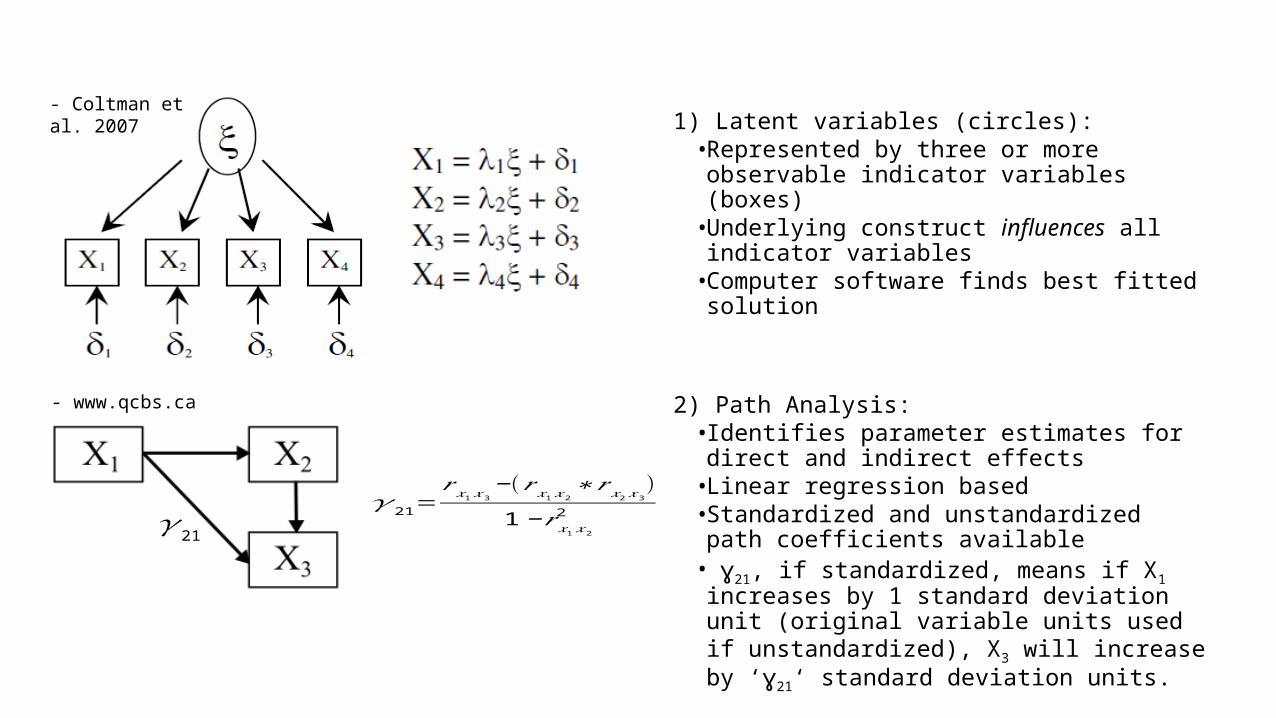
1) Latent variables (circles):• Represented by three or more observable
indicator variables (boxes) • Underlying construct influences all indicator
variables• Computer software finds best fitted solution
2) Path Analysis:• Identifies parameter estimates for direct and
indirect effects• Linear regression based• Standardized and unstandardized path
coefficients available • ɣ21, if standardized, means if X1 increases by
1 standard deviation unit (original variable units used if unstandardized), X3 will increase by ‘ɣ21‘ standard deviation units.
- www.qcbs.ca
- Coltman et al. 2007
𝛾 21=𝑟 𝑥1𝑥3
−(𝑟𝑥1𝑥2∗𝑟 𝑥2𝑥3)
1−𝑟 𝑥1 𝑥2
2𝛾 21

• Example of SEM model
Divelbiss et al. 2013 SEM model used in Guatemala
• This was the originally hypothesized model for villages in Guatemala
• Circles represent latent variables, boxes represent observable variables, ‘e’ represents measurement error, arrows represent hypothesized effects
• A data driven model is compared to the hypothesized model
• Finding three of four tests of model fit successful indicates good fit

Confirmatory Analysis
• Acquired secondary survey data from the Demographic and Health Survey program for Guatemala and Brazil• Aggregated region and demographic specific population within
data sets to compliment locations of SEM analyses• A set of health variables were compared with a set of
demographic and environmental variables• Statistical techniques used:• Mahalanobis-Taguchi Strategy • Canonical Correlation Analysis• Latent Factor Regression

Confirmatory Analysis
• Mahalanobis-Taguchi Strategy is a pattern recognition technique that uses the Mahalanobis Distance to identify similarities between data sets• Canonical Correlation Analysis identifies
linear combinations of two data sets by maximizing the correlation between outcome variables for both data sets• Latent Factor Regression creates a latent
variable out of the health data set (Y) and then regresses that latent variable on the non health data set (X)

Results
• Two trips taken; feasibility study (n=24) and pilot study (n=41)
• Literature review of Brazilian studies confirmed transferability of model between countries • HEL, SES, DHB, IWT, IMS• IWS and IWSt varied
• Indicator variables of latent constructs did vary in applicability• HEL, SES, and diarrhea indicators varied• Local expertise and field observations informed
selection of indicators through an iterative collection process
• Interviews were administered through a professional translator
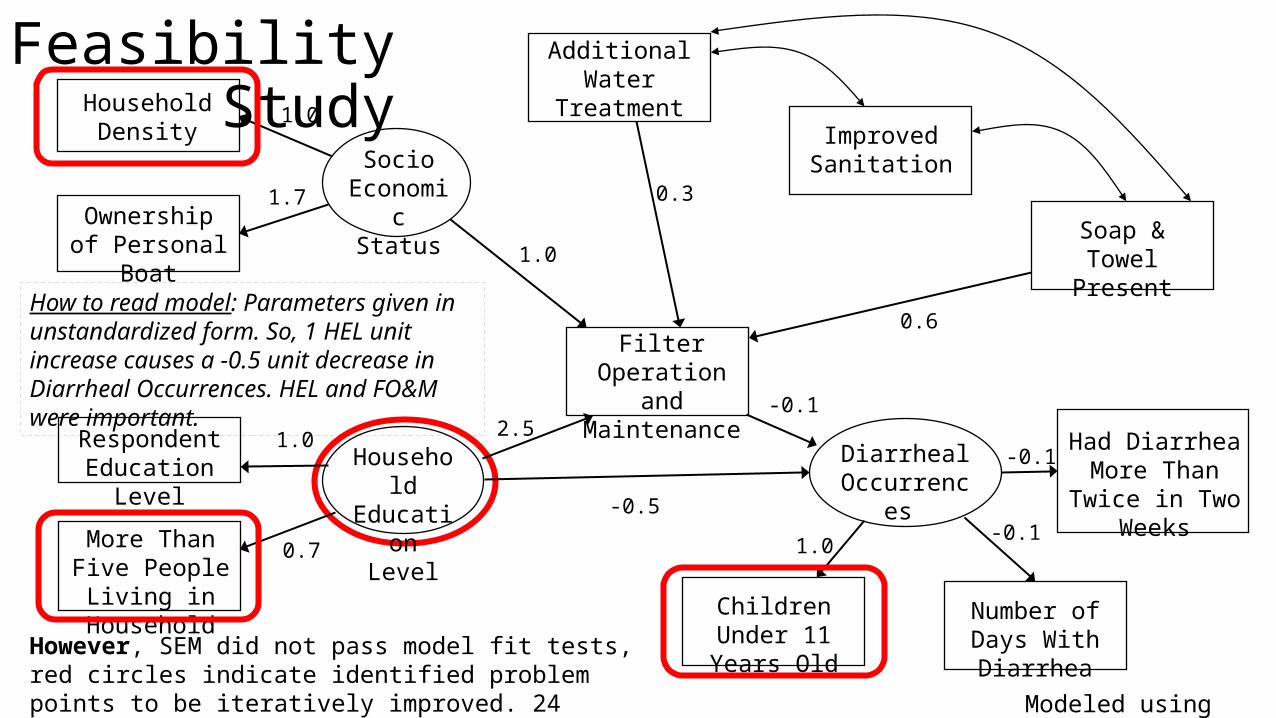
Feasibility Study
However, SEM did not pass model fit tests, red circles indicate identified problem points to be iteratively improved. 24 Households, bootstrapped to 100, frequency distribution n=60
Household Education
Level
Socio Economic
Status
Additional Water
Treatment
Soap & Towel Present
Ownership of Personal Boat
Respondent Education Level
Household Density
2.51.0
0.7
0.3
1.0
0.6
Improved Sanitation
Filter Operation and
Maintenance
More Than Five People Living in
Household
1.7
1.0
Diarrheal Occurrences
-0.5
-0.1
Children Under 11 Years Old
Had Diarrhea More Than Twice
in Two Weeks
Number of Days With Diarrhea
-0.1
-0.11.0
How to read model: Parameters given in unstandardized form. So, 1 HEL unit increase causes a -0.5 unit decrease in Diarrheal Occurrences. HEL and FO&M were important.
Modeled using Mplus 7.2

Below is the correlation matrix from raw data. Green is the latent variable HEL, orange is the latent variable SES, and brown is diarrhea. Bright green boxes show relationships with high correlation. The black box in the middle displays all relationships between diarrhea and wealth indicators. 16 of 18 of these relationships were negatively correlated. This helped to inform improvements to the structural equation model.
Feasibility Study
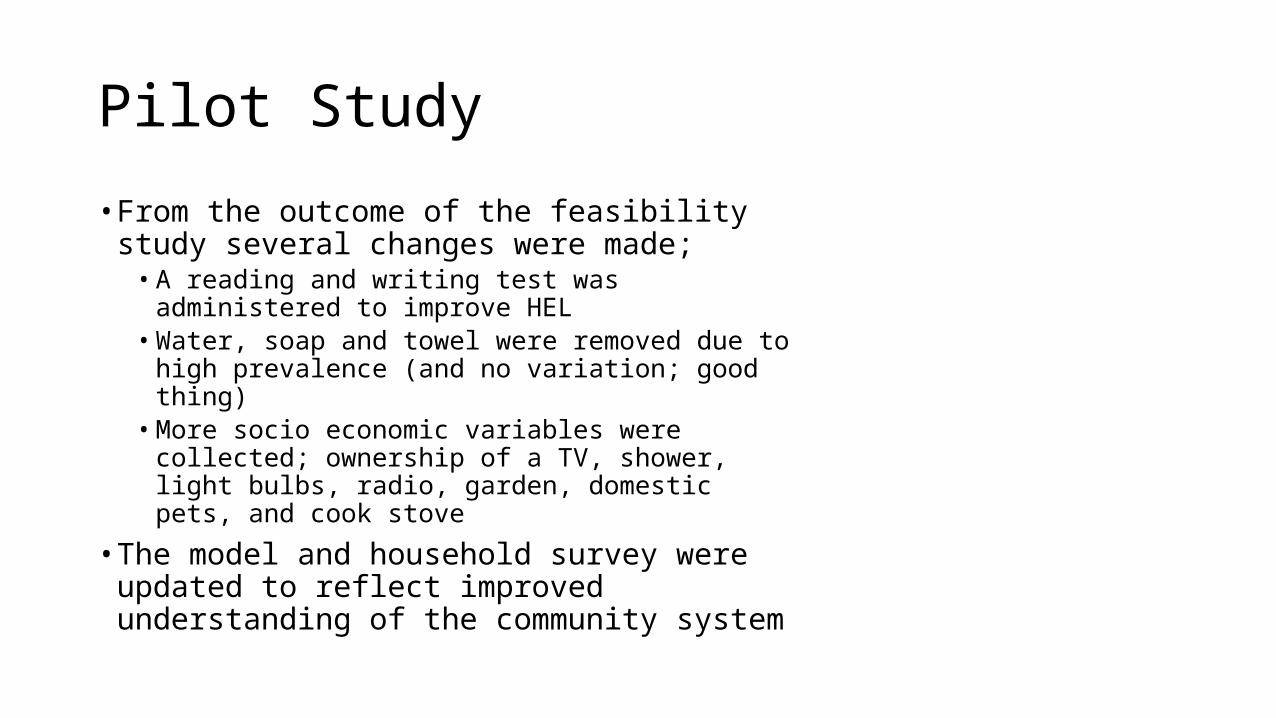
Pilot Study
• From the outcome of the feasibility study several changes were made;• A reading and writing test was administered to
improve HEL• Water, soap and towel were removed due to high
prevalence (and no variation; good thing) • More socio economic variables were collected;
ownership of a TV, shower, light bulbs, radio, garden, domestic pets, and cook stove
• The model and household survey were updated to reflect improved understanding of the community system
Improved Water Source
Socio- economic
Status
Household Education
Level
Additional Water
Treatment
Improved Water Storage
Read and Writing Test
Ownership of Shower or TV
Material of Water Storage
Container
Maternal Education Level
Paternal Education Level
-0.071(-0.093)
0.820
0.614
0.564
0.856
0.8030.729
0.353(0.996)
0.401(0.761)
-0.200(-0.158) 0.144
(0.232)
0.277(0.325)
0.256(0.758)
-0.344(-1.611)
-0.278(-0.554)
Diarrheal Occurrences
Improved Sanitation
Filter Operation and
Maintenance
Number of Light Bulbs in House
0.094(0.063)
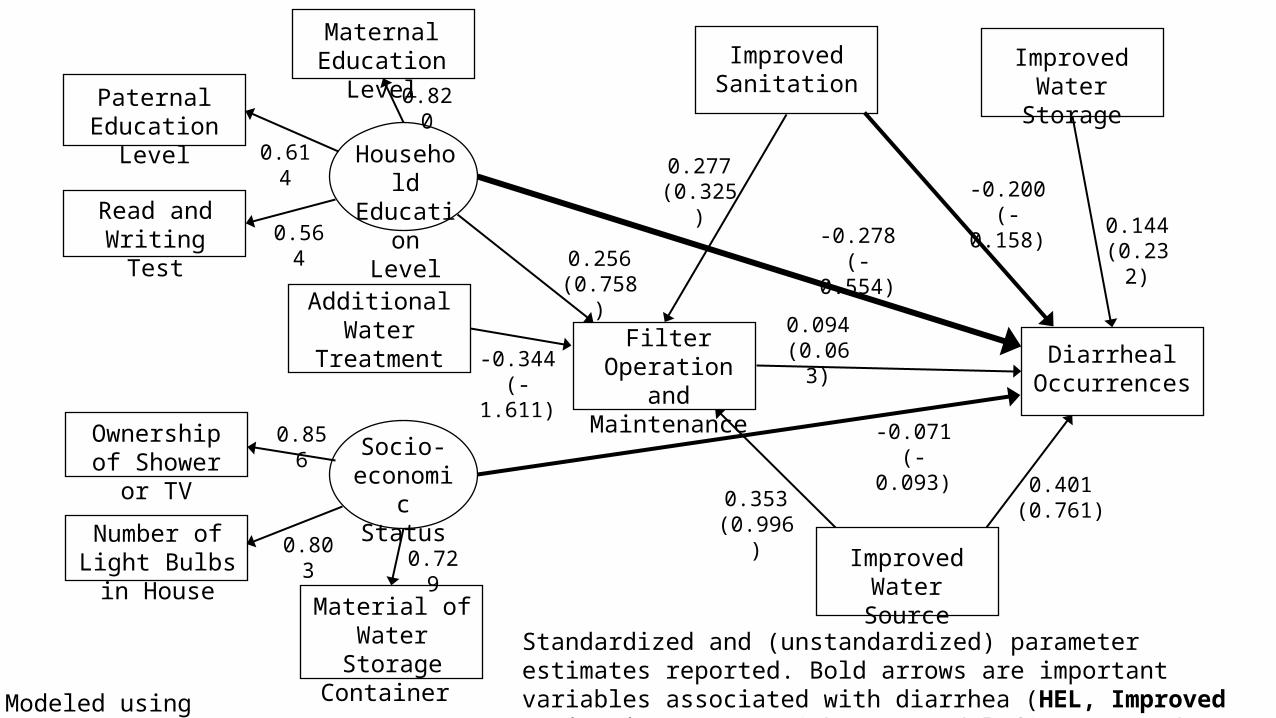
Standardized and (unstandardized) parameter estimates reported. Bold arrows are important variables associated with diarrhea (HEL, Improved Sanitation, SES). With n=41 model fit was good (Voth-Gaeddert et al. 2015b).Modeled using Mplus 7.2

Confirmatory Analysis
• Utilized a secondary data set and a different set of statistical tools to 1) confirm SEM findings and 2) identify other potential contributing variables for both study sites in Brazil and Guatemala• A set of 7 health variables* were compared to a set of demographic and
environmental variables (Brazil p=40, Guat. p=60). Sample size n=807 and n=1038 for Brazil and Guatemala study regions respectively • Results were reported as gains, correlations and parameter estimates for
Mahalanobis-Taguchi Strategy, Canonical Correlation Analysis, and Latent Factor Regression, respectively. Listed in order of importance. See Voth-Gaeddert et al. 2015a
* Diarrhea was one of several other variables that depicted a healthy or unhealthy household. See Voth-Gaeddert et al. 2015a for further discussion.

Confirmatory Analysis - Brazil
Latent Factor Regression important variables: • Mother’s education• Number of color TVs• Age of mother• Total rooms in
household
Canonical Correlation Analysis important variables:• Mother’s education• Improved sanitation • Good quality
household wall material• Age of mother
Mahalanobis-Taguchi Strategy important variables:• Number of women
age 15-49 in house • Size of village or town• Mother’s literacy • Parents living
together
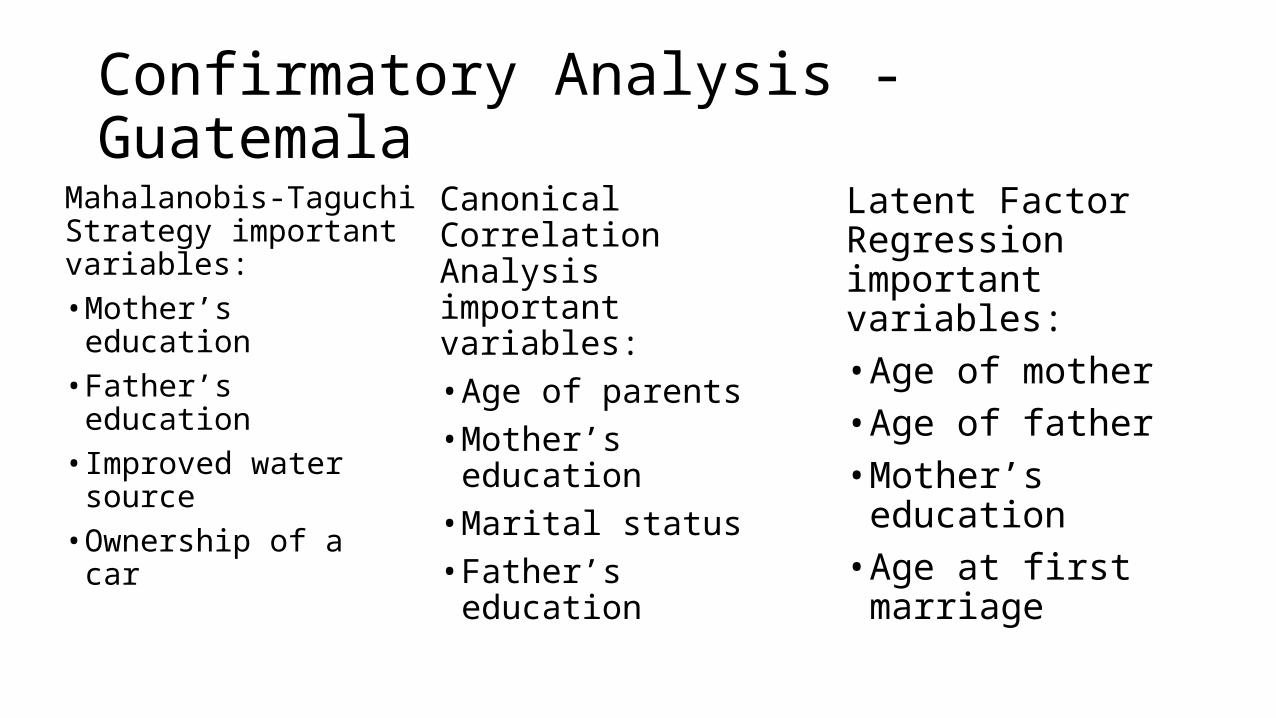
Confirmatory Analysis - Guatemala
Latent Factor Regression important variables: • Age of mother• Age of father• Mother’s education • Age at first marriage
Canonical Correlation Analysis important variables:• Age of parents• Mother’s education• Marital status• Father’s education
Mahalanobis-Taguchi Strategy important variables:• Mother’s education • Father’s education• Improved water
source• Ownership of a car

Conclusion
• Culminating the studies from Brazil and Guatemala we found that the biosand filter was not the most important factor in reducing diarrhea• From the SEM for Brazil, Household Education Level, Improved
Sanitation, and Socio-Economic Status were the most significant factors, respectively• From the SEM for Guatemala, Household Education Level, Improved
Water Source, and the biosand filter were the most significant factors, respectively• The confirmatory analysis 1) identified similar trends as the SEMs and 2)
also identified parental age and family structure as potential contributing factors to a healthy household

Conclusion
• The larger hypothesis for the applicability of the biosand filter is that it is highly dependent on the socio economic level of the community• Brazil was too rich, while Guatemala was too poor for the filter to be effective
• In Brazil, families lived comfortably, where many families could acquire easier water treatment technologies (hence AWT was negative on FOM). Education (knowledge) and sanitation practices (knowledge into practice) were still important as not all transmission pathways were blocked
• In Guatemala, families were much poorer and could possibly only handle one treatment technique (AWT negative on FOM). Education helped to block all pathways, improved water source blocked two pathways (fluids and foods), while the biosand filter could only block one (fluids)
• The big picture that this study contributes to is the importance of systemic methodologies to assessing micro and meso level systems in development

Joe the Missouri Miner says, thank you!
• John A. and Susan Mathis Grant• Gil Serique
References
Divelbiss, D. W., Boccelli, D. L., Succop, P. A., & Oerther, D. B. (2013). Environmental health and household demographics impacting biosand filter maintenance and diarrhea in Guatemala: an application of structural equation modeling. Environmental Science & Technology, 47(3), 1638–45.Voth-Gaeddert, L.E., Oerther, D.B. (2015a). Measuring Multidimensional Poverty in a Complex Environmental. Humanitarian Technology, Elsevier, in pressVoth-Gaeddert, L.E., Oerther, D.B. (2015b). Utilizing Structural Equation Modeling as an Evaluation Tool for Critical Parameters of the Biosand Filter in a Pilot Study in Para, Brazil. Water Science; Water Supply, in review