assessment of automated crowd behaviour analysis based...
TRANSCRIPT

MASTER THESIS
ASSESSMENT OF
AUTOMATED CROWD
BEHAVIOUR ANALYSIS
BASED ON
OPTICAL FLOW
Ingo Stijntjes
FACULTY OF ELECTRICAL ENGINEERING, MATHEMATICS AND COMPUTER SCIENCE SERVICES, CYBERSECURITY AND SAFETY
EXAMINATION COMMITTEE
Prof.Dr.Ir. R.N.J. Veldhuis Dr.Ir. L.J. Spreeuwers Prof.dr.ir. C.H. Slump C.G. Zeinstra MSc.
DOCUMENT NUMBER
SCS - 19
10-1-14

Assessment of Automated Crowd Behaviour Analysis Based onOptical Flow
Ingo Stijntjes1∗
Abstract—In visual surveillance, camera streams are often usedto keep an eye on dense crowds. The examination of this datais mostly done manually by observers. When analysing multiplecameras some assistance is desirable. Computer vision methodscan be used to assist observers in detecting crowd behaviours.5
Methods based on optical flow are particularly interesting sincethey can examine high density crowds with cluttering and(partial) occlusion without increasing computing costs. Not manymethods can detect specific behaviour of dense crowds withoutthe need of a learning stage. One promising method by Solmaz10
et al. uses the Jacobian stability of the optical flow field in thescene to detect five behaviour patterns viz. blocking, bottlenecks,fountainheads, rings and lanes. The method is implementedand a demo program is written with which experiments areperformed on several datasets. The detection of three out of five15
behaviour patterns turn out to be promising, for the latter twoimprovements are proposed.
I. INTRODUCTION
Everywhere crowds gather there is an increase in potentiallydangerous situations, which clearly described by S. A. Velastin20
et al. [11], ”do not per se constitute an uncontrollablecondition (an ”incident”), but could become so with anunexpected event”. One can see big crowds as entities havinga high inertia; difficult to direct or to stop.
There is a trend of organising many events in western25
Europe, some of them attracting several thousands of people.At these big events crowds are monitored through video feedsby one or more observers. If needed security services can bedeployed efficiently or crowds can be redirected to other areas.There are numerous incidents in the past where stampede or30
panic in dense crowds led to casualties, see [15] for a shortlist.The analysis of crowds is a complex problem and it is very
much dependent on the experience and concentration of theobserver or simply on the observer to camera ratio. Since thereis much data from the video feeds, computer vision methods35
are being used to assist an observer in doing his or her task.It should be kept in mind that some computer vision methodsthat are proven in scenes with individuals are likely to fail inhigh density situations due to cluttering, (partial) occlusion,computing costs or other factors. Analysis based on optical40
flow is particularly interesting, since this is a feature tacklingthese problems.
With respect to public safety, interesting behaviour patternsto detect are blocking, bottlenecks and panic. Blocking be
*This work is part of the author’s Msc project1I. Stijntjes is with Faculty of Electrical Engineering, Mathematics and
Computer Science, University of Twente, 7500 AE Enschede, The Netherlandsistijntjes at gmail.com
2Special thanks to my committee: Prof.Dr.Ir. R.N.J. Veldhuis, Dr.Ir. L.J.Spreeuwers, C.G. Zeinstra MSc. and external committee: Prof.dr.ir. C.H.Slump
caused by a stumbling person and bottlenecks by doorways 45
exceeding their capacity. The method proposed by Solmazet al. is able to detect behaviour patterns closely related tothese.
The goal of this research is to develop a method that assists 50
crowd observers by detecting the aforementioned behaviourpatterns and extracting crowd features that are relevant foran observer. This is done by assessing current methods incrowd behaviour identification, use this assessment as base topropose a method that suits the needs of a crowd observer, 55
implement the proposed method and perform experiments.
B. Zhan et al.[7] introduce a set of applications of interestfor automated crowd analysis, for which this research can bevaluable. These, non-disjunct applications are: 60
Crowd management - Where big crowds gather therewill be an increased risk of potentially dangerous situations.Oppression and stampede in big crowds can easily lead tocasualties or even death. It is valuable to analyse the crowd 65
to develop crowd management tactics.Public space design - When designing a public space itshould be able to withstand the crowds that are expected tobe there. Understanding crowd behaviour in several situationsis a very important step in the final design. 70
Virtual environments - Having good crowd models can aidin simulating crowd behaviour in for example video gamesor animations.Visual surveillance - The (autonomous) detection ofanomalous behaviour or even specific crowd behaviours in 75
crowds can aid for example public safety enforcers.Intelligent environments - In intelligent environments thecharacteristics of a crowd can help in decisions to direct (partof) the crowd to a different place.
80
In this paper a short survey of relevant literature is presentedin Section II. In Section III a promising optical flow basedmethod is discussed and improvements to it are proposed.The implementation of this proposed method is presented inSection IV, after which experiments are defined and performed 85
in Section V. The results of the implementation turn out to bepromising for some of the behaviour patterns. During imple-mentation and experiments possibilities for improvements areidentified, some of which supported by an initial experiment.These additions can be found in Section VI. This work will 90
close with conclusions and ideas for further work in SectionVII.
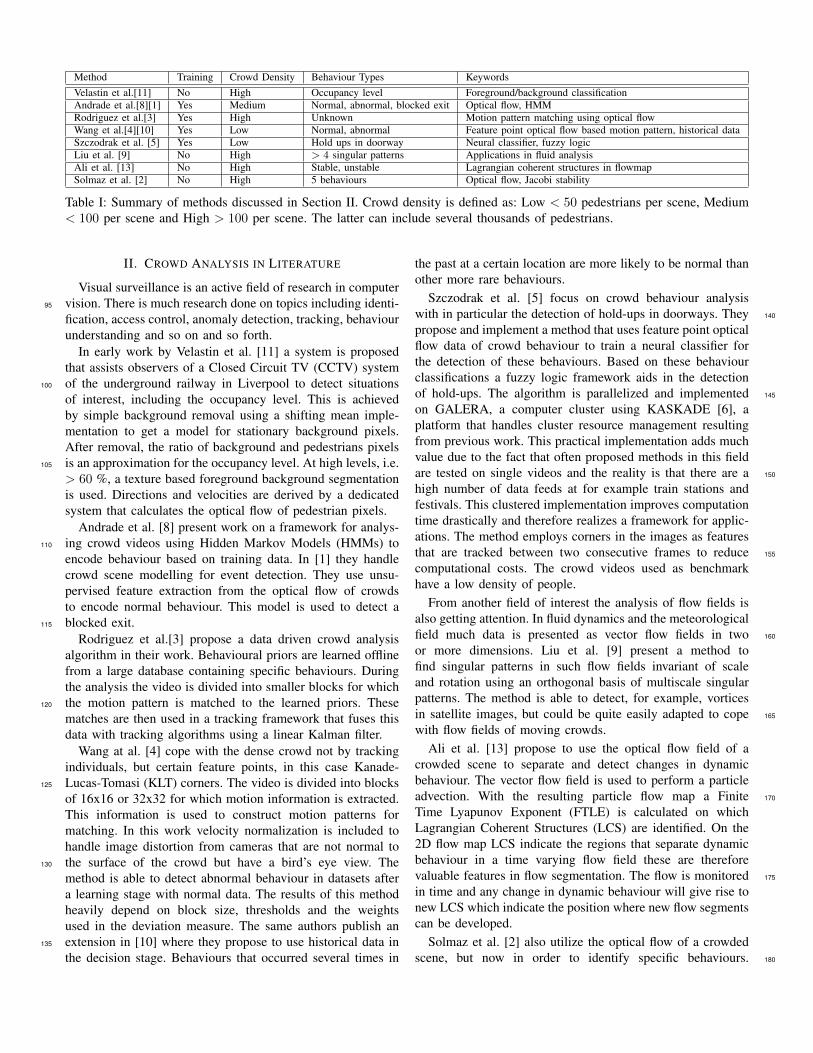
Method Training Crowd Density Behaviour Types KeywordsVelastin et al.[11] No High Occupancy level Foreground/background classificationAndrade et al.[8][1] Yes Medium Normal, abnormal, blocked exit Optical flow, HMMRodriguez et al.[3] Yes High Unknown Motion pattern matching using optical flowWang et al.[4][10] Yes Low Normal, abnormal Feature point optical flow based motion pattern, historical dataSzczodrak et al. [5] Yes Low Hold ups in doorway Neural classifier, fuzzy logicLiu et al. [9] No High > 4 singular patterns Applications in fluid analysisAli et al. [13] No High Stable, unstable Lagrangian coherent structures in flowmapSolmaz et al. [2] No High 5 behaviours Optical flow, Jacobi stability
Table I: Summary of methods discussed in Section II. Crowd density is defined as: Low < 50 pedestrians per scene, Medium< 100 per scene and High > 100 per scene. The latter can include several thousands of pedestrians.
II. CROWD ANALYSIS IN LITERATURE
Visual surveillance is an active field of research in computervision. There is much research done on topics including identi-95
fication, access control, anomaly detection, tracking, behaviourunderstanding and so on and so forth.
In early work by Velastin et al. [11] a system is proposedthat assists observers of a Closed Circuit TV (CCTV) systemof the underground railway in Liverpool to detect situations100
of interest, including the occupancy level. This is achievedby simple background removal using a shifting mean imple-mentation to get a model for stationary background pixels.After removal, the ratio of background and pedestrians pixelsis an approximation for the occupancy level. At high levels, i.e.105
> 60 %, a texture based foreground background segmentationis used. Directions and velocities are derived by a dedicatedsystem that calculates the optical flow of pedestrian pixels.
Andrade et al. [8] present work on a framework for analys-ing crowd videos using Hidden Markov Models (HMMs) to110
encode behaviour based on training data. In [1] they handlecrowd scene modelling for event detection. They use unsu-pervised feature extraction from the optical flow of crowdsto encode normal behaviour. This model is used to detect ablocked exit.115
Rodriguez et al.[3] propose a data driven crowd analysisalgorithm in their work. Behavioural priors are learned offlinefrom a large database containing specific behaviours. Duringthe analysis the video is divided into smaller blocks for whichthe motion pattern is matched to the learned priors. These120
matches are then used in a tracking framework that fuses thisdata with tracking algorithms using a linear Kalman filter.
Wang at al. [4] cope with the dense crowd not by trackingindividuals, but certain feature points, in this case Kanade-Lucas-Tomasi (KLT) corners. The video is divided into blocks125
of 16x16 or 32x32 for which motion information is extracted.This information is used to construct motion patterns formatching. In this work velocity normalization is included tohandle image distortion from cameras that are not normal tothe surface of the crowd but have a bird’s eye view. The130
method is able to detect abnormal behaviour in datasets aftera learning stage with normal data. The results of this methodheavily depend on block size, thresholds and the weightsused in the deviation measure. The same authors publish anextension in [10] where they propose to use historical data in135
the decision stage. Behaviours that occurred several times in
the past at a certain location are more likely to be normal thanother more rare behaviours.
Szczodrak et al. [5] focus on crowd behaviour analysiswith in particular the detection of hold-ups in doorways. They 140
propose and implement a method that uses feature point opticalflow data of crowd behaviour to train a neural classifier forthe detection of these behaviours. Based on these behaviourclassifications a fuzzy logic framework aids in the detectionof hold-ups. The algorithm is parallelized and implemented 145
on GALERA, a computer cluster using KASKADE [6], aplatform that handles cluster resource management resultingfrom previous work. This practical implementation adds muchvalue due to the fact that often proposed methods in this fieldare tested on single videos and the reality is that there are a 150
high number of data feeds at for example train stations andfestivals. This clustered implementation improves computationtime drastically and therefore realizes a framework for applic-ations. The method employs corners in the images as featuresthat are tracked between two consecutive frames to reduce 155
computational costs. The crowd videos used as benchmarkhave a low density of people.
From another field of interest the analysis of flow fields isalso getting attention. In fluid dynamics and the meteorologicalfield much data is presented as vector flow fields in two 160
or more dimensions. Liu et al. [9] present a method tofind singular patterns in such flow fields invariant of scaleand rotation using an orthogonal basis of multiscale singularpatterns. The method is able to detect, for example, vorticesin satellite images, but could be quite easily adapted to cope 165
with flow fields of moving crowds.Ali et al. [13] propose to use the optical flow field of a
crowded scene to separate and detect changes in dynamicbehaviour. The vector flow field is used to perform a particleadvection. With the resulting particle flow map a Finite 170
Time Lyapunov Exponent (FTLE) is calculated on whichLagrangian Coherent Structures (LCS) are identified. On the2D flow map LCS indicate the regions that separate dynamicbehaviour in a time varying flow field these are thereforevaluable features in flow segmentation. The flow is monitored 175
in time and any change in dynamic behaviour will give rise tonew LCS which indicate the position where new flow segmentscan be developed.
Solmaz et al. [2] also utilize the optical flow of a crowdedscene, but now in order to identify specific behaviours. 180

Figure 1: Behaviour types definitions, based on the stability analysis proposed in Solmaz et al. [2]. Each column is a specificbehaviour. The first row represents the general behaviour from which variants are derived showed in the second row. Mostvariants are components of the general behaviour, except for some ring variants, these can flow inwards or outwards whilerotating.
The method also performs a particle advection, where theparticles can evolve towards accumulation points but can alsocontribute to regions of higher or lower particle density. Allthese points and regions are analysed based on some featuresof the trajectories and particles involved. Candidate points185
follow and the Jacobi stability is assessed in the region ofthose points, resulting in a possible detection of one of fivebasic behaviours; viz. bottlenecks, fountainheads, blocking,lanes and rings.
190
Methods based on optical flow have the advantage thatcomputational costs will not increase when the number ofpeople in the frame increases, which would be the casewhen using, for example, face detection to find crowd mo-tion. Proposals that require learning will need an extensive195
training set and data acquisition is much work, especially forbig crowds demonstrating a characteristic behaviour pattern.Because the behaviours detected by Solmaz et al. well matchthe goal of this research and the method relies on optical flowcomputations this approach is selected to be assessed in more200
detail. In Table I an overview of the literature study is given.
III. OPTICAL FLOW BASED METHOD
The approach proposed by Solmaz et al. is designed todetect five different kinds of behaviours in video clips showingcrowds of varying density. The behaviours are based on the205
influence of different stability features of the flow field. Thesefeatures are defined by different eigenvalues, see Table II, andall cases represent a specific flow field. For example, in TableIII it can be seen that a fountainhead behaviour depends onlabel R and A. These labels represent a source and outgoing210
swirl in the flow field respectively. When combining thesepatterns fountainheads are formed. The result of this procedurecan be seen in Figure 1. These behaviour patterns definitions
are slightly different from Solmaz et al., where only the toprow is used. The names are adopted from Solmaz et al., but 215
it can be debated whether the patterns are consistent with theexpectations of the name.The proposed algorithm here is inspired by Solmaz et al.and is based on defining a dynamical system by the opticalflow of a crowd scene and checking the Jacobi stability at 220
candidate points. It can be divided into three parts. The firstpart includes the definition of a dynamical system using theoptical flow of the crowded scene. The second part handlesthe search of candidate points in the flow field, and the lastpart is assessing the stability at regions specified by these 225
points through the eigenvalues of the Jacobian of the flowfield linearized around a candidate. The method considers theinfluence of the candidate points on its surroundings.
A. Dynamical System
Since this method heavily relies on the optical flow of acrowd scene, defining a dynamic system based on this featureis the first step in the algorithm. Optical flow is the apparentmovement of pixels in the video and is calculated using twoconsecutive frames. Using optical flow for the determinationof motion makes it possible to analyse very dense crowdswith high occlusion due to the fact that the crowd flows aretreated as entities rather than individuals, this is sometimesreferred to as a holistic approach. Furthermore, methods basedon face recognition or texture analysis for example, will eitherfail or be too computational expensive. Another advantageof considering the optical flow instead of individual motiontracking is the inherent privacy of the individual. The opticalflow of a video clip is integrated in time to construct asingle vector flow field. The approach considers the continuousdynamical system:
w = F (w) (1)
Eigenvalues Conditions Label Count
Real, λ1 > 0, λ2 < 0 ∆ < −ε2 Green G
Real, positiveτ < −2ετ2 > 4∆
Red R
Real, negativeτ > 2ετ2 > 4∆
Yellow Y
Complex, positive real partτ > 2ετ2 < 4∆
Magenta A
Complex, negative real partτ < −2ετ2 < 4∆
Cyan C
Purely imaginary |τ | < 2ε White Wat least one zero |∆| < ε2 Blue B
all zero JF = 0 Black K
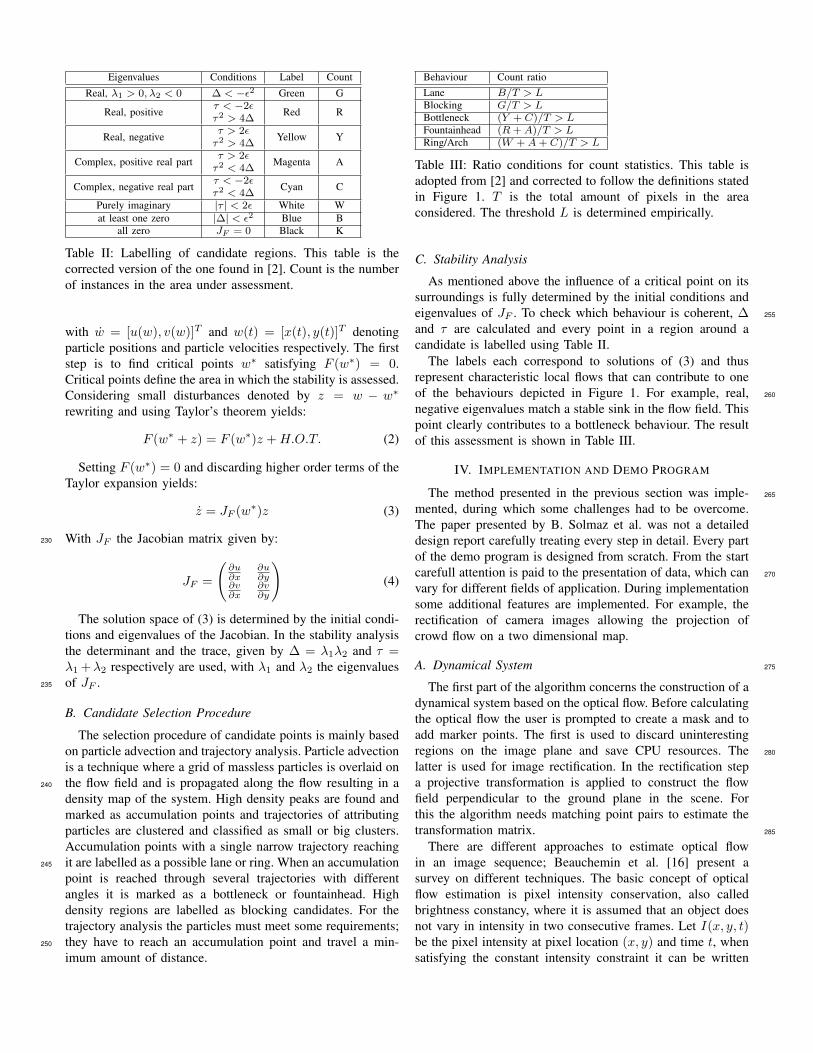
Table II: Labelling of candidate regions. This table is thecorrected version of the one found in [2]. Count is the numberof instances in the area under assessment.
with w = [u(w), v(w)]T and w(t) = [x(t), y(t)]T denotingparticle positions and particle velocities respectively. The firststep is to find critical points w∗ satisfying F (w∗) = 0.Critical points define the area in which the stability is assessed.Considering small disturbances denoted by z = w − w∗
rewriting and using Taylor’s theorem yields:
F (w∗ + z) = F (w∗)z +H.O.T. (2)
Setting F (w∗) = 0 and discarding higher order terms of theTaylor expansion yields:
z = JF (w∗)z (3)
With JF the Jacobian matrix given by:230
JF =
(∂u∂x
∂u∂y
∂v∂x
∂v∂y
)(4)
The solution space of (3) is determined by the initial condi-tions and eigenvalues of the Jacobian. In the stability analysisthe determinant and the trace, given by ∆ = λ1λ2 and τ =λ1 +λ2 respectively are used, with λ1 and λ2 the eigenvaluesof JF .235
B. Candidate Selection Procedure
The selection procedure of candidate points is mainly basedon particle advection and trajectory analysis. Particle advectionis a technique where a grid of massless particles is overlaid onthe flow field and is propagated along the flow resulting in a240
density map of the system. High density peaks are found andmarked as accumulation points and trajectories of attributingparticles are clustered and classified as small or big clusters.Accumulation points with a single narrow trajectory reachingit are labelled as a possible lane or ring. When an accumulation245
point is reached through several trajectories with differentangles it is marked as a bottleneck or fountainhead. Highdensity regions are labelled as blocking candidates. For thetrajectory analysis the particles must meet some requirements;they have to reach an accumulation point and travel a min-250
imum amount of distance.
Behaviour Count ratioLane B/T > LBlocking G/T > LBottleneck (Y + C)/T > LFountainhead (R+A)/T > LRing/Arch (W +A+ C)/T > L
Table III: Ratio conditions for count statistics. This table isadopted from [2] and corrected to follow the definitions statedin Figure 1. T is the total amount of pixels in the areaconsidered. The threshold L is determined empirically.
C. Stability Analysis
As mentioned above the influence of a critical point on itssurroundings is fully determined by the initial conditions andeigenvalues of JF . To check which behaviour is coherent, ∆ 255
and τ are calculated and every point in a region around acandidate is labelled using Table II.
The labels each correspond to solutions of (3) and thusrepresent characteristic local flows that can contribute to oneof the behaviours depicted in Figure 1. For example, real, 260
negative eigenvalues match a stable sink in the flow field. Thispoint clearly contributes to a bottleneck behaviour. The resultof this assessment is shown in Table III.
IV. IMPLEMENTATION AND DEMO PROGRAM
The method presented in the previous section was imple- 265
mented, during which some challenges had to be overcome.The paper presented by B. Solmaz et al. was not a detaileddesign report carefully treating every step in detail. Every partof the demo program is designed from scratch. From the startcarefull attention is paid to the presentation of data, which can 270
vary for different fields of application. During implementationsome additional features are implemented. For example, therectification of camera images allowing the projection ofcrowd flow on a two dimensional map.
A. Dynamical System 275
The first part of the algorithm concerns the construction of adynamical system based on the optical flow. Before calculatingthe optical flow the user is prompted to create a mask and toadd marker points. The first is used to discard uninterestingregions on the image plane and save CPU resources. The 280
latter is used for image rectification. In the rectification stepa projective transformation is applied to construct the flowfield perpendicular to the ground plane in the scene. Forthis the algorithm needs matching point pairs to estimate thetransformation matrix. 285
There are different approaches to estimate optical flowin an image sequence; Beauchemin et al. [16] present asurvey on different techniques. The basic concept of opticalflow estimation is pixel intensity conservation, also calledbrightness constancy, where it is assumed that an object doesnot vary in intensity in two consecutive frames. Let I(x, y, t)be the pixel intensity at pixel location (x, y) and time t, whensatisfying the constant intensity constraint it can be written

that:I(x, y, t) = I(x+ δx, y + δy, t+ δt) (5)
With δx and δy denoting the spatial displacement and δtthe temporal displacement. The left hand side of (5) can bedeveloped by a Taylor expansion, ignoring higher order termsand rewriting yields:
∂I
∂xu+
∂I
∂yv +
∂I
∂t= 0 (6)
With u and v the pixel velocities that represent the optical flow.Equation (6) is known as the optical flow constraint [16]. Thisis an equation with two unknowns and needs an additionalconstraint to be solved. It is this additional constraint inwhich the different methods vary. In [16] various methods290
are described and Barron et al. [17] assess the performanceof several methods. The fundamental problem in image basedvelocity approximation is that the images contain informationfrom the optical domain; intensities, which are depended onillumination. The velocity, however, is a geometric quantity295
independent of lightning conditions thus making the method anestimation. However, acceptable results can be obtained whenconsidering small motions, see [17] for a detailed performanceanalysis of different optical flow techniques. The appropriatemethod in this paper is chosen to be the Horn and Schunck300
method [14] due to its dense optical flow field generation,acceptable error and availability of implementations. The Hornand Schunck method applies as extra constraint a global ve-locity smoothness assumption, combining the two constraintsin an error function yields:305
E(u, v) =
∫D
((∂I
∂xu+
∂I
∂yv +
∂I
∂t)2
+ (λ(||∂u∂x
+∂u
∂y||2 + ||∂v
∂x+∂v
∂y||2)
)dxdy
(7)
This is a least square minimization problem, solved iteratively,with u and v the velocities, x and y the components of theimage plane D and λ the weight of the smoothness term. Theoptical flow is calculated over a video clip and is integratedin time to obtain a single vector flow field demonstrating the310
behaviour of the total clip. This field can be used to constructthe Jacobian depicted in equation (4).
B. Candidate Selection
Selecting candidates is very important in this method; thisprocedure generates some points with a high likelihood ofexposing one of the five behaviours. Without this pre-selectionhigher misclassification rates will occur due to false interpret-ation of the flow field, leading to the stability assessment ofregions that had insufficient influence on the particle field. Thisparticle field is a key feature in this pre-classification phaseand is the result of a simple particle advection as depicted by:
w(t+ 1) = w(t) + F (w(t)) (8)
Basically, the implementations looks for three different fea-tures from the particle advection, viz. accumulation points, 315
high dense areas and trajectories.1) Accumulation Points: After some advection time a dens-
ity plot is generated by replacing each particle with a Gaussianfunction. This map is used to find local maxima. These pointscorrespond to high density points that might be accumulation 320
points depending on the advection time and the size of theGaussian producing the density map. An increased advectiontime will lead to efficient sink seeking, since many particlesfind their equilibrium in an accumulation point, opposed toshorter advection times that will more likely reveal high 325
density areas of particles before they reach an accumulationpoint. There are several local maxima found in the densitymap which are filtered on height relative to the highest peak,resulting in strong accumulation points. Accumulation pointsare used in finding ring and lane candidates. Detecting lanes 330
can be very valuable for observers to get insight in thepreferred paths of people. This data is, for example, especiallyimportant in the event of a train station; the civil engineersinvolved in developing the structure can use this info in theirdesign choice. 335
2) High Density Areas: High dense areas are found in asimilar way to the previous feature, except with a decreasedadvection time. This way regions are revealed with, for ex-ample, due to blocking, temporal higher particle density whichwould be invisible in a saturated advected field. Furthermore, 340
the size of the Gaussian is slightly increased to find highdensity regions rather than high density points. Due to thesimilarity of these regions and accumulation points it isexpected that they are also found near each other. In thiscase, both of the points are taken into account; one labelled 345
as accumulation point and the second as high density region.3) Trajectories: Among other particle features, the traject-
ories are observed. The length of the trajectories determineswhether a particle and its trajectory is taken into accountin the selection. When an advected particle is close to its 350
starting point it does not belong to a characteristic behaviour.This length limit is empirically set to 40 pixels, but it hasto be taken into account that this number is highly dependedon, for example, video resolution and the scale of the scene.Another check is the endpoint of a particle. When particles 355
end up isolated after being evolved on the flow field it is anindication that this particle does not belong to a dominatingflow. Particles are of interest when their end point lies near anaccumulation point, the limit is experimentally set to 50 pixels,but again this number greatly depends on the resolution and 360
should be related to scene properties, i.e. a distance in meters.The directions of particles reaching accumulation points areclustered and used to separate unidirectional accumulationpoints from omnidirectional accumulation points.
4) Selection: The features described in the previous sec- 365
tions are used to label located candidates. This labellingprocess is described in Figure 3. With the clustering of traject-ories by their angles a distinction between an omnidirectionaland unidirectional accumulation point is made. The first case

Figure 2: Front panel of demo tool. The left view is used to visualize the flow field and particle advection, the upper rightfigure shows the method results and the lower right the stability features of each candidate.
occurs when several small and big clusters are contributing to370
the accumulation point, the latter case when there is only asingle cluster.
C. Stability Analysis
The last features that are used in the classification aregiven by the stability analysis of the area of a candidate375
point. At every position where a behaviour is expected anarea around this point is evaluated. For all pixels in this areathe Jacobian is constructed, the eigenvalues considered anda label assigned following Table II and III. This results in ascore for each behaviour in the area under consideration, this380
score has to exceed a given threshold and in combination withprevious features a behaviour is assigned. The threshold levelis empirically defined to be 0.3.
D. Graphical User Interface
In order to maintain and demonstrate the program a Graph-385
ical User Interface (GUI) is designed and programmed. It isbuild modular to be of use for testing. The GUI consists oftwo figures embedded in one window with its controls at thelower side, see Figure 2, the left figure plots mainly end resultsof algorithms while the smaller right plots show intermediate390
results of the algorithm. The demo program is used for testingparts of the implementation and for demonstrating purposes.Since the flow fields are very dense, one vector per pixel,the field is divided into blocks in which the flow is averaged,threshold filtered, scaled and plotted in its centre resulting in395
a user friendly flow view. Besides the main application, alsosome debug tools are developed. For example a graphical toolthat allows manual inspection of the flow field stability.
V. EXPERIMENTS AND RESULTS
The goal of the experiments is to tune the parameters in 400
the method and to assess if detected behaviour patterns matchthe definitions from Figure 1. Some video material of crowdsis acquired to perform the experiments. These videos have tomeet some requirements involving an appropriate resolution,some characteristic behaviour and a steady camera. The first 405
two are evident, the necessity of a steady camera is due to thefact no optical flow correction is implemented to compensatefor camera movements, since this lies outside the scope of thisresearch. With these requirements five datasets are selected andused to assess the performance of the implementation. Since 410
the experiments are done on different datasets than the resultspresented in [2], the results can only be compared to a groundtruth generated by hand obeying the definitions in Figure 1.The results of the method will be assessed by answeringthe following two questions: Are the resulting behaviours to 415
be expected at that position? and Are additional behavioursexpected in the dataset? Of course when answering the firstquestion a position error can be obtained by measuring thedistance between the ground truth and the found behaviours,due to the different scales of the data, common sense is used 420
to determine if an error is too high.
A. Datasets
When dealing with behaviour patterns in dense crowds it isdifficult to obtain much data satisfying the condition depictedabove. There are some datasets containing crowds that depict 425
several normal behaviour but when dealing with abnormal or

Advection
Accumulation
Omni
Fountainhead Bottleneck
Uni
Lane Ring
Density
Blocking
Figure 3: Decision tree for candidate selection.
extreme situations data is scarce. In this paper three differentground truth sources are used to verify the method viz.:
• Real data, publicly available, e.g. panic at the memorialservice 2010 in Amsterdam, The Netherlands;430
• Synthesized data, e.g. instructed evacuation of a sta-dium;
• Computer generated data, e.g. computer animations ofcrowds evacuating a building.
This data is retrieved from public sources and from non435
public sources with courtesy of other researchers in this andrelated fields. In Table IV the used data is enumerated with ashort description.
B. Parameter Tuning
The results of the method are highly dependent on some440
user defined parameters. The threshold value L, for example,is dominant in detecting the behaviour since the score of thebehaviour has to exceed it. This value has to be determinedby means of experiments. In the conducted experiments athreshold of L = 0.3 is maintained. The size of the area445
in which the stability will be assessed will be dependent onthe scale of the video. It would make no sense to makethis region a great deal smaller than, for example, the sizeof one person. The method is designed to cope with globalbehaviour rather than individual behaviour. The area should450
be scaled likewise. What these sizes should be has to bedetermined empirically. In the conducted experiments an areaof several people is used. Also noticeable are the steps takenin the advection phase, the maximum distance parameter andtravel limit. When advecting too many steps, saturating the455
particle field, temporal higher density regions are missed,but accumulation points are more clear. This effect yieldsa multi stage advection where the flow field is advected in
Dataset Description Type DensityStadium[18] Staged evacuation stadium S 292Damschreeuwer [19] Panic in dense crowd R >60kComplex [20] Evacuation of building C >1800Bottleneck [21] Escalator entrance at station R >300Stampede [22] Evacuation of room C 186
Table IV: Some datasets used in experiments. Types: R =Real, S = Synthesized, C = Computer generated. Density ismeasured in people and in some cases approximated
several stages. Each stage represents an advection length andeach stage should be assessed by the method and results 460
should be fused. An informal experiment conducted on theComplex dataset illustrates some promising results leading tothe detection of some more ground truth bottlenecks. Themaximum distance and travel limit parameters define thedistance between a particle and an accumulation point after 465
advection and minimum travelled distance of every particlerespectively. This way particles that end up alone or resideclose to their starting position, stating a weak characteristicflow, will be discarded and have no influence on the candidateselection. These parameters heavily depend on the scale of the 470
video and could be related to a real world measure, so insteadof using pixels one can use meters. Overall the tuning ofthese parameters is complex and moreover dependend on theobserver’s need. Beside some parameters that mainly dependon video and location properties, there will be a trade-off 475
between a missed detection and misclassifications. It dependson the application which one should be appointed a higherweight.
C. Results
All these datasets are processed by the above mentioned 480
method. Only the Damschreeuwer and the Complex datasetsare rectified. The processing results are shown in Figure 4. Toanswer the first of the aforementioned questions with regardto all the datasets, the location of detected behaviours isassessed. It is found that these behaviours are at reasonable 485
positions. It can be debated whether some of the bottlenecksin the complex dataset are at the right positions, especiallythe top two can be expected to be closer to the doorway.The second question is more difficult to answer. There areclearly formed lanes in the complex dataset, it is expected 490
the method finds them. However, this is not the case. Thisis mostly due to the selection of the candidates for which,in the next section, some alternative selection algorithms arediscussed. Although data is scarce, the results are evaluatedand published in Table V. Since parameters had to be tuned 495
on the data the Stampede dataset was left outside this scopeto verify the obtained parameter values. The scale is roughlycomparable to the Stadium and the parameter values from thetuning on this set are adopted. The result of this test is givenin Figure 5 500
1) Bottleneck: In the case of bottleneck detection theimplementation yields a relative high misclassification. Whenlooking closer to the results it can be seen that instead offinding one bottleneck, as the ground truth states, severalbottlenecks are found at the vanishing line of the people. Two 505
of them fairly close to the ground truth, the others are labelledas misclassifications, since their distance to the ground truthis significant. When taking a closer look at the flow field itcan be debated whether the ground truth obeys the definitions,different streams can be appointed that lead to a bottleneck. 510
Taking this all into account the detection of bottlenecks israther strong. On the other hand there are some misseddetections. There are some parameters that have significant

Figure 4: Results of the implementation, each column is one of the datasets depicted in Table IV. From left to right: Stadium,Damschreeuwer, Complex and Bottleneck. The first row is a frame of the video. In the second row the advection trajectoriesare plotted. The third row is the output of the candidate selection stage for blocking, lanes, rings and bottlenecks. The fourthrow are the final results; with bottlenecks marked with ?, blocking with ∗ and fountainhead with 5.
influence on the output of the method, in this case the amountof advection steps taken is of great influence. Depending on515
the application, the user can tune this and other parametersto get an acceptable balance between misclassifications andmissed detections.
2) Blocking: The blocking detection has detected theground truth blocking accurately. However, two misclassific-520
ations are generated. These can be attributed to the eventwhere particles are following a flow to the end of the image.The particles are slightly drifting at that position, due tonoise and small flows, as though they are blocked. It istherefore not unexpected to find this behaviour, but it still525
leads to a misclassification. This effect should be detected andcompensated for.
3) Fountainhead: From the two fountainheads in theground truth data both are detected. However, there is a relativehigh misclassification. This all occurs in the stadium dataset.530
The positions may not be surprising since they all are positionswhere people come from. However, in the definition of themethod it is stated that a fountainhead is a single point fromwhich particles, in this case people, diverge. It can be debatedwhether the candidate selection or the ground truth is correct, 535
but overall the result is promising.
4) Lane and Ring: Taking a closer look at Table V willreveal the weak performance of the lane and ring detection.The two positions where rings are to be expected by the groundtruth are assessed by hand and indeed the stability of this area 540
is showing a majority of ring features. This misclassificationcan be attributed to a weak candidate selection. For the lanesthis is not exactly the case. Even manual inspection of thepaths does not result in a convincing majority in stabilityfeatures yielding a lane. This can mean that there is a definition 545
mismatch between the ground truth and the method; it can alsomean that the stability features are weak for the classification

Figure 5: Results of the method with tuned parameters on anew dataset provided with courtesy of I. Farkas [22]. Thisdataset illustrates panic behaviour when exiting a room. Theresults are comparable to the Stadium dataset.
of lanes. Stronger lane features are proposed in the nextsection.
VI. IMPROVEMENTS550
The defined behaviours in Figure 1 can be valuable to anobserver, however other types of behaviour like stumblingcould be too. The five behaviours can be used to define evenmore complex behaviours, this is discussed in Section VI-A.While doing experiments it became apparent that lane and555
ring behaviours are missed frequently by the method. Thisis mostly caused by the candidate selection. Improvementsto detect lanes are proposed in Section VI-B. To make themethod usable for application in the field a higher-level viewof the results is preferred, this high level observer is described560
in Section VI-C. The last improvement on this work, SectionVI-D is the visualization of some flow features besides thedetected behaviours. This is an open discussion that can beused by professionals in the field of crowd management.
A. Behaviour Definition565
The method described in Section III defines five differentbehaviours. With respect to public safety, the most interestingbehaviours are blocking, bottleneck and fountainhead. The firstindicates objects that block the flow (stumbling of people,blocked exits and so on), the second indicates high risk areas570
for crushing and trampling of people due to increased densityand pressure and the latter can indicate panic or a run foremergency exits. Behaviours that can be relevant to detectare: panic, fights, emergency exit, stumbling/trampling, exit
Behaviour Total Correct Missed MisclassificationBottleneck 10 7 3 4Blocking 1 1 0 2Fountainhead 2 2 0 5Lane 2 0 2 0Ring 2 0 2 0
Table V: The analysis of the result with respect to the totalbehaviours in the manually generated ground truth.
blockage. These behaviours might be defined by one or more 575
of the behaviours proposed in Figure 1. See Table VI for somepossible combinations of basic behaviour.
B. Lane Detection
Since lane detection is a potentially important behaviourto detect some alternative candidate selection features are 580
proposed.1) Trajectory Smoothness: There are two types of lanes;
lanes that are forced by the environment and lanes that formspontaneously. The latter case would be of interest to detect.The spontaneous lane formation can best be explained by the 585
least-effort hypothesis proposed in G.K. Still [15], in short: ittakes less effort for an individual to follow a path. This worksuggests some other parameters that could be responsible forlane formations, i.e. focal routes, routes defined by the fieldof view of the individual, and the dynamical (and maybe even 590
social) attractiveness of a cue. It makes sense that the majorityof lanes formed are rather smooth in principal. A step-shapedlane would probably not obey the least-effort hypothesis ingeneral. It should be noted that not the instantaneous lane isconsidered but an equilibrium state of a lane. This smoothness 595
can be exploited to detect paths evaluating particle trajectoriesresulting from the particle advection. Lanes should not onlyobey the smoothness constraint, but there should also be someparallel trajectories, since not every path of an individualshould be labelled as a lane. 600
2) Hough Transform: It could be useful to detect straightlanes, or the straight parts of a lane in the trajectories ofparticles after advection. One way to implement this is usingthe Hough transform [23]. This technique projects points ona Hough space representing all possible lines through that 605
point defined by the angle and the shortest distance fromthe line to a constant origin. This transformation, yielding asine form in the Hough space for every point, representingall possible straight lines through that point, can be easilyintegrated in a voting framework. In the Hough space of 610
two points there will be two sine forms present that differin phase and amplitude. The intersection of these two sinewaves represent lines passing through both points, since eachintersection corresponds to a line passing through both points.There are two intersection since the 180 degrees rotated 615
version is also a valid solution in the framework. Whenadditional points are processed this method generates a densitymap where at high densities many intersections occur. Thesepoints correspond to strong lines in the initial point cloud.In the case of considering points of advection trajectories, this 620
Behaviour Pseudo DefinitionPanic Instantaneous fountainheadFighting Blocking/fountainheadEmergency exit Bottlenecks/sudden lane formingStumbling/trampling (Instantaneous) blockingExit blockage Blocking/bottlenecks
Table VI: Some interesting behaviours and their possiblerepresentation in terms of behaviours defined by Figure 1.

Figure 6: Results of the trajectory stability algorithm per-formed on four datasets, see Section VI-B3. The likelihoodthreshold used in this experiments varies between 0.3 and 0.5.The length threshold of a trajectory varies between 75 and 300pixels, depending on scale and flow velocity.
method can output pieces of straight trajectories. Additionally,in the Hough space parallel lines are easily identified, sincethey appear as intersections on an imaginary vertical line. Thisinformation can be combined to find lanes.
3) Trajectory Stabililty: Let every trajectory, neglecting625
the ones which travelled insufficient distance, be a candidatelane. The stability theory as depicted in Section III-C canbe applied to every pixel of these trajectories, treating thetotal amount of pixels of the path as the area assessed. Pixelscorresponding to a trajectory should demonstrate a high score630
for the lane behaviour. This process is implemented and aninitial experiment is performed. The results are shown inFigure 6. The likelihood is calculated by labelling every pixelof the trajectory according to Table II and III, with L in TableIII the total amount of pixels in the trajectory. The resulting635
lanes of this algorithm are actually quite near where one wouldexpect them.
4) Angular Segmentation: The method by B. Solmaz et al.is limited in the usage of angular information of the flow field,despite the fact that this can possibly contain some helpful640
details for lane detection. In lane forming it is evident thatparticipants of the lane are heading the same way. By findingwide paths through assessment of the optical flow directionat every pixel lanes can be indicated. When two lanes areparallel, but opposite, this method can produce some sharp645
edges in the angular plot, resulting in clear boundaries.
C. High Level Observer
This concept involves an algorithm that uses the detectedbehaviours in a higher level. While the proposed method willprocess small pieces of video to retrieve behavioural data, a650
high level observer will continuously monitor these results,this way it is able to detect changes in both time and space. Forexample, the aforementioned sudden velocity change possibly
indicating stumbling of a person is an application that shouldbe implemented at this level. This approach also enables 655
the prediction of behaviour especially when this high levelobserver has access to multiple simultaneous feeds evaluatedby the method. This observer will have to detect relationsbetween different features of the flow field. Testing an ini-tial implementation of this observer requires some correlated 660
datasets. The datasets processed in this work demonstrate atmost two behaviours at a time, are not correlated and are thusnot suited to test such an observer.
D. Data Representation
The different features of the flow field can be represented 665
using different approaches. Since it is not possible to demon-strate the results to professionals working in the field of crowdmanagement and surveillance an open discussion is presented.
It might be valuable for an observer to see the flow of thecrowd represented by arrows, but others could prefer a colour 670
scheme, where the colour is depended on the direction and theintensity of the colour on the velocity.
Most of the field of interest is monitored by numerouscameras. It would be valuable to fuse this data from multiplecameras to one flow field which is processed with the method. 675
To facilitate this every camera needs to be calibrated; they haveto provide a synchronized image stream and their real worldposition and pose should be known. An intuitive presentationof flows in big crowds is proposed in the form of a top viewtwo dimensional map. 680
To show the detection of behaviour markers are used, eachcorresponding to a certain behaviour. This way it is easyto recognize the algorithm results. It is also possible to usetransparent colours and overlay them on the video feed. Theobserver should be able to choose the behaviours he would 685
like to see.A feature that can give much insight in the crowd is the
velocity of the flow. From the optical flow a velocity mapis easily created and can be overlaid, with or without colourmap, on the video feed or optical flow field. It might also 690
be meaningful to calculate some contour lines of this velocityrepresenting matching velocities in the crowd.
VII. CONCLUSIONS
he goal of this research is to develop a method usable foraiding a crowd observer. This is accomplished by evaluating a 695
state of the art method in the field of crowd analysis. Methodshandling dense crowds that are based on optical flow are inter-esting since computational cost does not increase drasticallywhen crowd density is increasing. Furthermore, cluttering andocclusion are not an issue as this technique regards the crowd 700
as an entity rather than a group of individuals. The method pro-posed and implemented in this work is inspired by Solmaz etal., because of the fact that no learning stage is required and themethod enables specific behaviour identification. Behaviourdefinitions are derived from the stability features proposed by 705
Solmaz et al., but the method proposed here contains morevariations of behaviour patterns.

Experiments are performed to validate the implementationand asses performance. In addition some improvements areproposed to the candidate selection stage for finding lanes and710
rings.The discussion about which features would be important to
an observer is left open, since professionals in the field shouldattribute in this conversation. Velocity, direction and densityof a crowd and especially variations of these properties in715
time are very interesting to an observer. The results obtainedthroughout this paper are very promising in the light ofaiding an observer. Not all defined behaviours can be detectedwith the same confidence, but bottleneck and blocking, bothobviously valuable to an observer, score very well. It should720
be noted that more data has to be processed to concludethe experiments. Data is scarce and the data found variessignificantly, making it hard to compare the results. This workhowever has led to a framework that can be used to processnew data efficiently.725
A. Future Work
As mentioned before more data has to be acquired to makethe data more reliable. The proposals made in Section VIare only initially tested, a thorough evaluation requires adetailed implementation accompanied by experiments. In most730
practical applications it is expected to have more than onecamera on the terrain. It would be valuable to fuse this dataand plot it on a two dimensional map of the field. Groundworkfor a modular framework that allows this fusion is presentedby the rectification step described earlier. The resulting flow735
maps can easily be stitched together to acquire a flow mapof the whole location. To facilitate this implementation somesort of calibration of each camera should be performed. Thiscalibration can also facilitate the tuning of location dependedparameters. It should be noted that when rectifying cameras740
some areas of the video can be stretched out resulting in largeflows caused by little noise. Therefore, it is recommended toaccompany the rectification with a masking step discardingerror prone regions. It is mentioned that stable camera feedsare preferred, however in practice there can be vibrations from745
the crowd, music or wind that make the camera drift. One canmake the camera fixture more stable, but it is also possible tocompensate these movements by post processing the opticalflow. This also enables the use of moving cameras, whichare not uncommon in field observation. As extra input of750
the optical flow compensation encoder readouts can be used.The edge effects caused by the advection of particles to theedge of the flow field can be detected and compensated for.It is also possible to replace the massless particles in theflow field with particles incorporating some inertia. This will755
make the particles move outside the flow field where theywill not drift anymore due to zero flow. It is also interestingto evaluate the influence on the total advection since inertiaenabled particles are a better model for people. A feature thatis not used in the method, but can be important as feature760
for both the method and the observer, is the velocity of theflow field and in particular the change in velocity. Sudden
changes in velocity can imply specific events; it can mean,for example, blocking by a stumbled person. But it can alsosimply give an overview of the lane velocity to the observer, 765
assisting in, for example, deciding which exit to open or close.This method does not require a learning stage, however theflow features can be used to learn a classifier. This will beparticularly interesting when deploying the method as part ofa permanent system, like in a train station. Classifiers can be 770
trained to predict characteristic crowd flows. In Section VI-B2the Hough transform is suggested to assist in lane detection,there are variations on this methods proposed to find circlesand arcs, which could be promising in detecting (part of) rings.
REFERENCES 775
[1] Andrade E. L., Blunsden S. and Fisher R. B., ”Modelling CrowdScenes for Event Detection”, IPAB, School of Informatics, Universityof Edinburg, IEEE ICPR’06.
[2] Solmaz B., Moore B., and Shah M., ”Identifying Behaviors in CrowdScenes Using Stability Analysis for Dynamical Systems”, IEEE Trans- 780
actions on Pattern Analysis and Machine Intelligence (PAMI), 2012.[3] Rodriguez M., Sivic J., Laptev I. and Audibert J., ”Data-driven Crowd
Analysis in Videos”,Proceedings of the IEEE International Conferenceon Computer Vision (2011), Oral.
[4] Wang S., Miao Z., ”Anomaly Detection in Crowd Scene”, Institute of 785
Information Science, Beijing Jiaotong University, IEEE ICSP2010.[5] Szczodrak M., Kotus J., Kopaczewski K., Lopatka K. and Czyzewski A.,
”Behavior analysis and dynamic crowd management in video surveil-lance system”, Multimedia Systems Department, Gdansk University ofTechnology, Gdansk, Poland, IEEE 2011 22nd International Workshop 790
on Database and Expert Systems Applications.[6] Krawczyk H., Proficz J., ”KASKADA - multimedia processing platform
architecture”, Proceedings of the International Conference on SignalProcessing and Multimedia Applications, SIGMAP 2010 page 26-31.
[7] Zhan B., Monekosso D. N., Remagnino P., Velastin S. A. and Xu L., 795
”Crowd analysis: a survey” Digital Imaging Research Centre, KingstonUniversity, Kingston upon Thames, UK, Machine Vision and Applica-tions 2008, Spinger-Verlag.
[8] Andrade E. L., Scott Blunsden and Robert B. Fisher, ”Hidden MarkovModels for Optical Flow Analysis in Crowds”, IPAB, School of Inform- 800
atics, University of Edinburg, IEEE ICPR’06.[9] Liu W. and Ribeiro E., ”Scale and Rotation Invariant Detection of
Singular Patterns in Vector Flow Fields”, Computer Vision and Bio-Inspired Computing Laboratory, Department of Computer Sciences,Florida Institute of Technology. 805
[10] Wang S., Miao Z., ”Anomaly Detection in Crowd Scene Using HistoricalInformation”, Institute of Information Science, Beijing Jiaotong Univer-sity, IEEE International Symposium on Intelligent Signal Processing andCommunication Systems, December 6-8, 2010.
[11] Velastin S. A., Boghossian B. A. and Lazzarato A.,”Detection of poten- 810
tially dangerous situations involving crowds using image processing”,Department of Electronic Engineering, King’s College London, Intelli-gent Industrial Automation June 1999.
[12] Narain R., Golas A., Curtis S., and Lin M. C., 2009. ”AggregateDynamics for Dense Crowd Simulation”, In ACM Transactions on 815
Graphics (Proceedings of SIGGRAPH Asia), vol. 28, no. 5, pp. 122:1-122:8.
[13] Ali S. and Shah M., ”A Lagrangian Particle Dynamics Approach forCrowd Flow Segmentation and Stability Analysis”, IEEE InternationalConference on Computer Vision and Pattern Recognition (CVPR), 2007. 820
[14] Horn B. K. P. and Schunck B. G., ”Determing Optical Flow”, Mas-sachusetts Institue of Technology Artificial Intelligence Laboratory, A.I.Memo No. 572.
[15] Still G. K., ”Crowd Dynamics”, PhD Thesis, University of Warwick,August 2000. 825
[16] Beauchemin S.S. and Barron J.L., ”The Computation of Optical Flow”,ACM Computing Surveys, Vol 27. No. 3, September 1995.
[17] Barron J. L., Feet D.J.,Beauchemin S. S. and Burkitt T. A., ”Performanceof Optical Flow Techniques”, 0-8186-2855-3/92 IEEE, 1992.
[18] Vitracom.de, ”Staged Stadium Evacuation”, Permission requested. 830
[19] NOS, Dutch news station, ”Damschreeuwer”, 2010.

[20] Berkeley University, ”Aggregate Dynamics for Dense Crowd Simula-tion”, Permission requested.
[21] UCF dataset, Saad Ali and Mubarak Shah, ”A Lagrangian ParticleDynamics Approach for Crowd Flow Segmentation and Stability Ana-835
lysis”, IEEE International Conference on Computer Vision and PatternRecognition (CVPR), 2007.
[22] Helbing D., Farkas I., and Vicsek T., ”Simulating dynamical features ofescape panic”, Nature 2000
[23] Herout A., Havel J. and Dubska M., ”Real-Time Detection of Lines and840
Grids”, SpringerBriefs in Computer Science.