assessment analysis statistical analysis and unit improvement plan book pgs. 65 - 71 classroom...
TRANSCRIPT
Assessment Analysis Statistical Analysis and Unit Improvement Plan
Book pgs. 65 - 71
Classroom CurriculumContinuous Improvement
Data-Based Decision Making

The Information of Statistics
• Statistics• Identify the central tendencies of the class• Identify achievement among different groups
of students
• Teachers benefit from information about• Classroom Summative Assessments (TT & PAs)• Standardized Test Results
Classroom CurriculumContinuous Improvement
Data-Based Decision Making

Toward Continuous ImprovementAssessment Analysis
Data-based Decision Making (DBDM) LEADING TO Continuous Improvement
involves three steps:
1. Calculating the Descriptive Statistics
2. Analyzing Student Achievement from the Statistics
3. Using the analysis to construct an Improvement Plan for Future Instruction and Planning
Classroom CurriculumContinuous Improvement
Data-Based Decision Making

Toward Continuous Improvement1. Calculating the Descriptive Statistics
• Measures of Central Tendency• Mean• Median
• Measures of Distribution• Upper Quartile Score• Lower Quartile Score
• Note: It is important to report the grading scale and number of students taking the assessment – context matters!
Classroom CurriculumContinuous Improvement
Data-Based Decision Making

Free Excel statistical analysis package available at: http://ace.nd.edu/downloads/planning-resources/
The Benefits of Statistical Analysis1. Calculating the Descriptive Statistics

Toward Continuous Improvement1. Calculating the Descriptive Statistics
• Central Tendency - MEAN• Definition: The average value in a data set. • This value gives a general sense for how average
students in the class achieved.
Example:• A class’s test scores are: {70, 71, 73, 75, 79, 80, 82, 84, 87, 89, 90, 92, 94, 95, 96, 99}• Mean = (1356)/(16) = 84.75
Classroom CurriculumContinuous Improvement
Data-Based Decision Making
Toward Continuous Improvement1. Calculating the Descriptive Statistics
• Why might the mean not be the only useful measure of central tendency? Could it ever be misleading?
Classroom CurriculumContinuous Improvement
Data-Based Decision Making
Toward Continuous Improvement1. Calculating the Descriptive Statistics
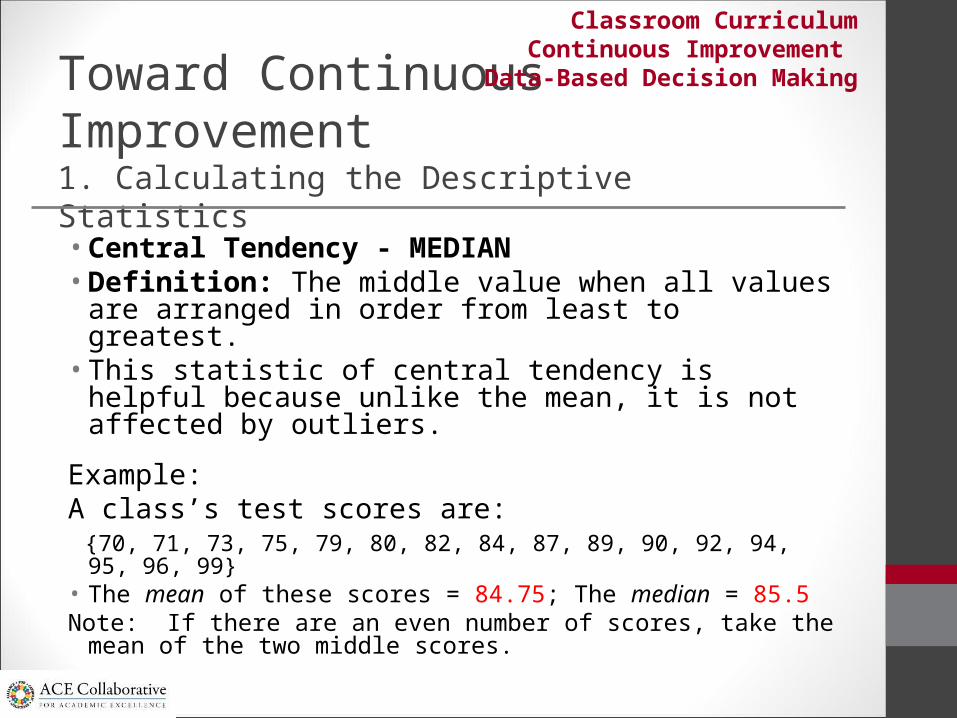
• Central Tendency - MEDIAN• Definition: The middle value when all values are
arranged in order from least to greatest.• This statistic of central tendency is helpful because
unlike the mean, it is not affected by outliers.
Example: A class’s test scores are: {70, 71, 73, 75, 79, 80, 82, 84, 87, 89, 90, 92, 94, 95, 96, 99}• The mean of these scores = 84.75; The median = 85.5Note: If there are an even number of scores, take the mean of the
two middle scores.
Classroom CurriculumContinuous Improvement
Data-Based Decision Making

Toward Continuous Improvement1. Calculating the Descriptive Statistics
• UPPER QUARTILE• Definition– The scores that occur in the highest 25%
of a data set or class. The score is often reported as the lowest value in the highest 25%.
• Example:• A class’s test scores are: {70, 71, 73, 75, 79, 80, 82, 84, 87, 89, 90, 92, 94, 95, 96, 99}• The upper quartile = (94, 95, 96, 99). The upper quartile
would be indicated by the lowest score in that quartile = 94.
Classroom CurriculumContinuous Improvement
Data-Based Decision Making

Toward Continuous Improvement1. Calculating the Descriptive Statistics
• LOWER QUARTILE• Definition– The scores that occur in the lowest 25% of a data
set or class. The score is often reported as the highest value in the lowest 25%.
• Example:• A class’s test scores are: {70, 71, 73, 75, 79, 80, 82, 84, 87, 89, 90, 92, 94, 95,
96, 99}• The lower quartile = (70, 71, 73, 75). The lower
quartile would be indicated by the highest score in that quartile = 75.
Continuous Improvement Data-Based Decision Making

Statistics Activity1. Calculating the Descriptive Statistics
In small groups, discuss the statistics and focus questions that are in your folder on the handout titled, “Statistics Activity.”
Classroom CurriculumContinuous Improvement
Data-Based Decision Making

Toward Continuous Improvement2. Analyzing Student Achievement
Data-based Decision Making (DBDM) LEADING TO Continuous Improvement
involves three steps:
1. Calculating the Descriptive Statistics
2. Analyzing Student Achievement from the Statistics
3. Using the analysis to construct an Improvement Plan for Future Instruction and Planning
Classroom CurriculumContinuous Improvement
Data-Based Decision Making

Toward Continuous Improvement2. Analyzing Student Achievement
• Measures of Central Tendency – Average Students• Mean• Median
• Measures of Distribution• Upper Quartile Score - Succeeding Students• Lower Quartile Score - Struggling Students
• Grading Scale
Classroom CurriculumContinuous Improvement
Data-Based Decision Making
Toward Continuous Improvement2. Analyzing Student Achievement
• If the MEAN and MEDIAN are close, we know the achievement of AVERAGE students on the test.
• Central Tendency - MEAN• Definition: The average value in a data set.
• Central Tendency - MEDIAN• Definition: The middle value when all values are
arranged in order from least to greatest.
Classroom CurriculumContinuous Improvement
Data-Based Decision Making

Toward Continuous Improvement2. Analyzing Student Achievement
From the UPPER QUARTILE we know the lowest achievement of SUCCEEDING students on the test.
Classroom CurriculumContinuous Improvement
Data-Based Decision Making

Toward Continuous Improvement2. Analyzing Student Achievement
From the LOWER QUARTILE
we know the highest achievement
of STRUGGLING students on the test.
Classroom CurriculumContinuous Improvement
Data-Based Decision Making
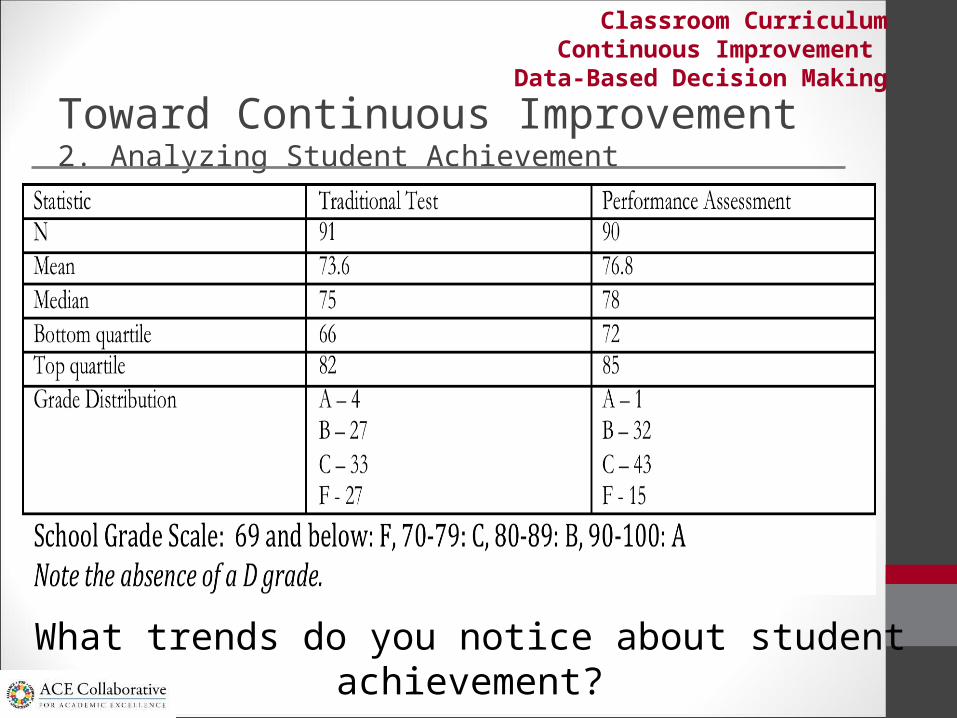
Toward Continuous Improvement2. Analyzing Student Achievement
What trends do you notice about student achievement?
Classroom CurriculumContinuous Improvement
Data-Based Decision Making

Toward Continuous Improvement3. Improvement Plan
Continuous Improvement Data-Based Decision Making

Toward Continuous Improvement3. Improvement Plan
Classroom CurriculumContinuous Improvement
Data-Based Decision Making

Toward Continuous Improvement3. Improvement Plan
Classroom CurriculumContinuous Improvement
Data-Based Decision Making

Toward Continuous Improvement3. Improvement Plan
Classroom CurriculumContinuous Improvement
Data-Based Decision Making

Toward Continuous Improvement3. Improvement Plan
Data-based Decision Making (DBDM) LEADING TO Continuous Improvement
involves three steps:
1. Calculating the Descriptive Statistics
2. Analyzing Student Achievement from the Statistics
3. Using analysis to construct an Improvement Plan for Future Instruction and Planning
Classroom CurriculumContinuous Improvement
Data-Based Decision Making

Toward Continuous Improvement3. Constructing an Improvement Plan
Classroom CurriculumContinuous Improvement
Data-Based Decision Making