assessing the quality of child care using longitudinal...
TRANSCRIPT

Assessing the Quality of Child Care Using Longitudinal, Administrative Data: What Can It Tell Us and How Can It Be Used?
Part I: The Report
By
Ann Dryden Witte, Ph.D.
Magaly Queralt, Ph.D.
Department of Economics, Wellesley College
and
National Bureau of Economic Research
June 2005
©Wellesley Child Care Research Partnership
2
Assessing the Quality of Child Care Using Longitudinal, Administrative
Data: What Can It Tell Us and How Can It Be Used?
Abstract
In this paper, we use a wide array of administrative data that covers the welfare reform period (1996-2001) to assess how the quality of child care changed as a result of welfare reform and concurrent social, political and economic changes. We compare the group care of children receiving child care subsidies, children living in poverty neighborhoods and children that neither received subsidies nor lived in poverty neighborhoods. Our study area is Miami-Dade County, Florida.
We find many differences between providers that participate in the CCDF child
care subsidy program (CCDF providers) and those that do not participate. CCDF providers more frequently violate minimum-standards regulations than other providers. Further, their minimum-standards violations tend to be more serious (including numerous instances of child-staff ratios in excess of minimum-standards requirements) than the violations of other providers. CCDF providers also have substantially more complaints filed against them than other providers, including other providers in poverty neighborhoods. CCDF providers have a larger proportion of unfilled (vacant) child care slots than other providers. However, CCDF providers report a smaller proportion of their staff with low levels of education (high school or less) than other providers, and CCDF providers are more likely to report use of a curriculum than other providers. CCDF providers are both more likely to be accredited and more likely to be profit-seeking firms than other providers. During the course of our study, we find a large increase in the proportion of faith-based providers. This trend is particularly strong for CCDF providers. We believe that this reflects Florida Governor Bush’s faith-base initiatives.
A composite measure of quality helps to address many policy, administrative and
research questions. We develop such a composite measure using principal components analysis (PCA) and multiple quality variables. The results of the PCA analysis are reasonable (e.g., they identify quality factors that are associated with various important aspects of child care quality). Specifically, the single composite indicator of quality that we develop using PCA reflects 80% of the total variation in our array of quality measures. This composite indicator could be used to develop a quality rating system that is based on multiple quality measures rather than on a single quality measure, such as accreditation, as is commonly done. The composite quality indicator also could be used to identify a group of very low-quality providers that administrators might want to target for quality-enhancing interventions. Finally, both the cross-sectional and time series variation in the composite indicator could be used to evaluate the impact of quality interventions. For example, using our composite indicator, we find an increase in the median overall quality of CCDF providers relative to providers that do not participate in the CCDF program after responsibility for the CCDF program was shifted to a local

3
not-for-profit agency with strong leadership, quality-enhancement initiatives and a school-readiness focus. This finding provides evidence that CCDF providers are responsive to quality initiatives.

4
Acknowledgements
The work reported in this paper was supported by grant #90YE0032 from the
Child Care Bureau, Administration for Children and Families (ACF), U.S. Department of
Health and Human Services (DHHS). The grant was awarded to the Wellesley Child Care
Research Partnership through the National Bureau of Economic Research. The support
of DHHS for this work does not indicate their concurrence with our results, nor is DHHS
in any way responsible for errors that we may have made.
This longitudinal project would not have been possible without the support of
many people in Miami-Dade County, Florida, throughout the years of our study.
From the Miami-Dade Department of Human Services, Division of Child
Development Services (CDS), we wish to thank Mr. Richard Signori, Mrs. Marie
Woodson, Mr. Sam King, and Mrs. Sara Morales. Also we would like to thank Mrs. Pilar
Feldman from Miami-Dade’s Information Technology Department. They provided the
monthly Resource & Referral (R&R) data and observational assessment scores for the
providers in Miami-Dade County participating in the child care subsidy program in the
areas served by CDS during the years of our study.
From Family Central, Inc. we wish to thank Dr. Barbara Weinstein, Mrs. Ann Stith
de las Pozas, Mrs. Anita Platt and Mrs. Beth Bonow. They provided R&R data and
observational assessment scores for the providers in Miami-Dade participating in the
child care subsidy program in the areas served by Family Central during the years of our
study.
From the District XI (covering Miami-Dade and Monroe counties) licensing
enforcement office of the Florida Department of Children and Families (DCF), we wish to

5
express our appreciation to Mrs. Coleen Mauer, Mrs. Dolores Naranjo, and Mrs. Felicita
Torres. They made us feel welcome at their office for the many months during which
we collected their data on provider non-compliances, complaints, and fines.
From the Florida DCF in Tallahassee, we take this opportunity to thank Mrs.
Sheila Reed who sent us the Gold Seal provider lists, and Mrs. Beverly Arnold, Mrs.
Diana Wood and Mrs. Carolyn Williams who made available to us the provider licensing
lists.
This study would not have been possible without the assistance provided by Ms.
Claudia Wehbe, who, at the time of our licensing enforcement data collection was a
doctoral student in the Department of Economics at Florida International University. For
over a year, Claudia worked at the District XI Licensing Enforcement office collecting and
computerizing their 1996 to 2001 paper-and-pencil data on provider non-compliances
and complaints.
The cooperation and support of our sponsors and of these individuals and
organizations in no way indicates their concurrence with our analyses or conclusions.
We alone are responsible for the views and opinions expressed in this paper and for all
errors and omissions.

6
Assessing the Quality of Child Care Using Longitudinal, Administrative
Data: What Can It Tell Us and How Can It Be Used?
Providing young children with quality child care makes good economic sense.
Quality child care and early education foster the intellectual, social, and emotional
development of children, gets them ready for school, and puts them on the right path
toward healthy and productive citizenship. There is evidence that quality early
interventions reduce later public expenditures for special education, grade repetitions,
public assistance, delinquency and crime. Further, recent research indicates that early
interventions are more cost effective than interventions later in life (e.g. in elementary
and secondary school) (Carneiro and Heckman, 2003) .
While there is considerable research on the quality of child care, many studies
are based on single sources of information--typically observations of process quality--
and on one-time rather than repeated measures. Very few studies have tracked the
quality of publicly subsidized child care available in low-income communities for a
number of years following welfare reform and how it has changed. Most lacking of all
are large-scale longitudinal assessments of the quality of child care based on multiple
sources of information.
In this paper, we examine the quality of child care providers in a large
metropolitan area, including providers caring for children receiving public child care
subsidies and providers located in low-income neighborhoods. We assess quality
longitudinally over a period of several years rather than on a one-time basis, and we use
multiple sources of data. We use common sources of data (e.g., accreditation lists) as
well as data sources rarely utilized to study child care quality. Some of the under-
7
utilized sources we employ include: (a) minimum-standards inspection records; (b)
records of complaints filed against providers; (c) child care Resource & Referral (R&R)
agency records; and (d) observational assessments of providers participating in the Child
Care and Development Fund (CCDF) subsidized child care program.
Our study takes place in Miami-Dade County, FL, a large and highly diverse area
with one of the largest concentrations of poor and low-income families in the U.S. The
study spans the period from the first quarter of 1996 to the third quarter of 2001, thus
covering the time immediately before and after welfare reform in Florida, which started
in October 1996.
We find many differences between providers that participate in the CCDF child
care subsidy program (CCDF providers) and those that do not participate.1 CCDF
providers more frequently violate minimum-standards regulations than other providers.
Further, their minimum-standards violations tend to be more serious (including
numerous instances of child-staff ratios in excess of minimum-standards requirements)
than the violations of other providers. CCDF providers also have substantially more
complaints filed against them than other providers, including other providers in poverty
neighborhoods. CCDF providers have a larger proportion of unfilled (vacant) child care
slots than other providers. However, CCDF providers report a smaller proportion of their
staff with low levels of education (a high school education or less) than other providers,
and CCDF providers are more likely to report use of a curriculum than other providers.
CCDF providers are both more likely to be accredited and more likely to be profit-
seeking firms than other providers. During the course of our study, we find a large
increase in the proportion of faith-based providers. This trend is particularly strong for
1 A provider was classified as participating in the CCDF-subsidized program during any period for
which the provider received assessment scores by the program.

8
CCDF providers. We believe that this reflects Florida Governor Bush’s faith-base
initiatives.
In this study we demonstrate how, by using multiple sources of data on child
care quality, it is possible to develop a composite measure that allows providers to be
rated on the quality of care they provide and how it changes across time. Such a quality
indicator tool could be of use to policy makers, administrators interested in measuring
and improving the quality of child care for low-income children.
To develop such a composite measure we submit our array of quality variables to
a principal components analysis (PCA). The results of the PCA are reasonable (i.e., they
identify quality factors that are associated with various important aspects of child care
quality). Specifically, the single composite indicator of quality that we develop using
PCA reflects 80% of the total variation in our array of quality measures. This composite
indicator could be used to rate providers on a continuum of quality for a tiered
reimbursement program or other incentive program aimed at improving the quality of
child care. Generally, rating quality on the basis of multiple measures is more valid and
reliable than rating quality based on a single measure, such as whether or not the
provider is accredited, as is commonly done.
Our composite quality indicator also could be used to identify a group of very
low-quality providers that administrators might want to target for quality-enhancing
interventions. Finally, both the cross-sectional and time series variation in the composite
indicator could be used to evaluate the impact of quality interventions. For example,
using our composite indicator, we find an increase in the median overall quality of CCDF
providers relative to providers that do not participate in the CCDF program after
responsibility for the CCDF program was shifted to a local not-for-profit agency with

9
strong leadership, quality-enhancement initiatives and a school-readiness focus. This
provides evidence that CCDF providers respond to quality initiatives.
The outline of this paper is as follows. In the next section we briefly summarize
some of the highlights of the literature on child care quality. We then describe our
study area, our data sources and the quality measures we constructed from our data.
Following this we present our descriptive findings and our analytic findings, followed by
our conclusions.
The Literature on Child Care Quality: Some Highlights
Three important dimensions of child care quality are generally discussed in the
literature--structural quality, process quality, and outcome quality. The Early Childhood
Education community refers to structural quality as the quality of the resources or inputs
used in the production of child care services. These are generally observable,
measurable quantitatively and relatively easy to regulate by licensing bodies. They
include such things as caregiver-to-child ratios, group sizes, and education and training
of the staff. Process quality generally refers to the quality of the social environment and
social relations between teachers or caregivers and children, the emotional tone of the
classroom, the level of stimulation children receive, and the quality of the activities in
which children engage while in care. These things are usually measured by direct
observation. Outcome quality refers to the effects of the care received by children in
terms of developmental outcomes, such as the children’s ability to understand and use
language, their pre-academic skills such as ability to count and recognize letters, their
later academic performance, and the presence or absence of problem behaviors such as
aggression, dependency, sad or angry feelings, and so on. To measure outcome quality
it is necessary to follow up children over a period of time.

10
In this report we do not provide a comprehensive review of the literature on
child care quality. Such reviews are readily available elsewhere (see, for example,
Vandell and Wolfe, 2000).
To briefly summarize the child care quality literature, many studies have found
high positive correlations between process quality and structural quality (including
caregiver characteristics and health and safety practices). That is to say, when child-care
programs get high marks on process quality measures, they also tend to get high scores
on measures of structural quality, caregiver characteristics, and health and safety
practices.
Much of the available research on child care quality also has reported significant
and positive associations between process measures of quality and measures of
outcome such as concurrent child functioning--cognitive, emotional, behavioral, and
social. In addition, there is some evidence, although somewhat less strong and
consistent, of a positive association between process and structural measures of quality,
caregiver characteristics and outcome measures such as children’s development (e.g.,
academic, cognitive, behavioral, and social) over a somewhat longer time period. A few
classic studies of intensive and high-quality early-childhood interventions such as the
Carolina Abecedarian Project and the Perry Preschool Project have followed children into
adulthood and have found some evidence of long-term benefits of quality care and early
education in terms of such things as level of involvement in criminal activities, earnings,
and use of public cash assistance.
While there is a considerable body of research on the quality of child care and
early education, many studies are of limited usefulness. For example, some are based
on a small sample of providers. When a small sample is used, the group of providers

11
included in the study may be unrepresentative of the providers in a given area, such as
a metropolitan area, particularly if the sample was not drawn scientifically. Even if a
small sample were drawn scientifically, it might not be representative if a significant
number of the providers originally selected later dropped out of the study for one reason
or another. Another drawback of some studies is that they utilize a single source of
information, for example, observations of process quality. Studies that are based
exclusively on observation may lack validity if they are based on assessments made at
officially announced visits for which providers were able to prepare in advance. Still
another shortcoming of some studies is that they are based on point-in-time rather than
repeated measures. Without repeated observations, the reliability of such studies might
be low.
A limited number of studies have examined the quality of child care in low-
income areas. Some have found that children from low-income families do not get
good-quality care. Other studies have reported a curvilinear relationship between family
income and quality of childcare, with children in the middle (i.e., working-class and
lower-middle class) receiving the lowest quality of care.
At present there is little systematic knowledge about the quality of publicly
subsidized child care available in low-income communities in the years since welfare
reform. Particularly, there is a dearth of longitudinal assessments of the quality of
subsidized versus unsubsidized child care in poverty and non-poverty areas utilizing
multiple sources of information and based on large samples.
This study aims to address the limitations noted above. We assess the quality of
child care providers, including those receiving child care subsidies and those not
receiving subsidies as well as those located in poverty areas and those located in non-

12
poverty areas. We follow providers longitudinally over a period of several years utilizing
a large database that includes repeated measures for each provider from multiple
sources of data.
Our Study Area
We use data collected in Miami-Dade County (MDC), Florida (FL)--a metropolitan
area with a population of 2,289,683. MDC is the largest and most racially and ethnically
diverse county in FL. It includes the state’s largest concentration of low-income families
and approximately 28% of FL’s welfare (i.e., cash assistance) population (Florida
Department of Children and Families, October 2003). The city of Miami, which is the
largest in the county, had a higher percentage of people in poverty than any other
American city of 250,000 or more, according to Census 2000 figures. MDC also includes
areas of concentrated wealth, such as Fisher Island, which is the wealthiest census place
in the U.S. The county has a density of 1,158 persons per square mile. Compared to the
state of FL as a whole, which has a population density of 296 persons per square mile,
the area is very densely populated (US Bureau of the Census, 2003).
The population in MDC is predominantly (51%) composed of foreign-born
persons. Sixty-eight percent of the population speaks a language other than English at
home. The racial/ethnic breakdown of the population is 57% Hispanic, 21% non-
Hispanic white, 20% black, and less than 2% Asian. Hispanics in MDC, although
predominantly of Cuban origin, come from all over the Spanish-speaking world,
particularly Latin America and the Caribbean. Most numerous among non-Cuban
Hispanics in Miami-Dade are Puerto Ricans, Colombians, and Nicaraguans (US Bureau of
the Census, 2003). The non-Hispanic white population in the county has been
decreasing steadily, particularly after Hurricane Andrew, in large part due to the

13
continuous arrival of waves of immigrants from Latin America and the Caribbean. The
black population is split between Afro-Americans and Caribbean blacks. Haitians are the
poorest and largest segment of the county’s Caribbean black population.
The median household income for MDC in 1999, according to the 2000 Census,
was $35,966, compared to $38,819 for the state of FL. This summary figure for income
masks vast differences in a metro area where the super rich and the dirt poor live in
relatively close proximity.2
According to the 2000 Census, the average poverty rate in MDC is 18%,
compared to the state’s poverty rate of 12.5%. Several cities and census places within
MDC have poverty rates exceeding 30%.3 For related children under the age of 18, the
average poverty rate in the county is 23%, but quite a few areas have child poverty
rates exceeding 30%.4
Sixty-eight percent of those in MDC age 25 and over have a high school degree,
compared to 80% for the state of FL. Same as for the state, 22% of those in MDC age
25 and over have a bachelor’s degree. The county population is fairly stable
geographically, relative to the state’s population; specifically, 50% were living in the
same house in 1995 and 2000, compared to 49% for FL.
Our Data Sources
2 For example, some areas in MDC, such as Coral Gables, Cutler, Key Biscayne, Fisher
Island, Golden Beach, and Pinecrest, have median household incomes well above $80,000; yet, some other areas, such as Brownsville, Florida City, Gladeview, Goulds and Naranja, have median household incomes below $20,000.
3 Cities and census places in MDC with population poverty rates exceeding 30% include Gladeview (53%), Naranja (50%), Goulds (44%), Florida City (43%), Brownsville (43%), Opa-Locka City (35%), West Perrine (34%), Pinewood (33%), Homestead (32%-65%) and the City of Miami (31%).
4 Cities and census places in MDC with child poverty rates exceeding 30% include Gladeview (65%), Naranja (63%), Goulds (57%), Florida City (57%), Brownsville (55%), West Perrine (52%), Pinewood (46%), Opa-Locka City (42%), Homestead (39%-54%), Leisure City (32%-42%), West Little River (39%), Bunche Park (38%), the City of Miami (38%) and Princeton (33%).

14
We assess longitudinally over several years the quality of child care providers in
MDC, including those receiving child care subsidies as well as those not receiving child
care subsidies and including those located in poverty areas as well as those located in
non-poverty areas. For the purposes of this study we classify areas with child poverty
rates exceeding 30% as poverty areas.
We use multiple sources of data. Several of our data sources have been under-
utilized in previous child care quality studies. These data sources are described in the
following paragraph and include the following: (1) minimum-standards inspection
reports of licensed child care centers and after-school providers; (2) data on complaints
filed against providers; (3) provider records maintained by the two Resource and
Referral (R&R) agencies serving MDC; (4) observational assessment scores of providers
participating in the CCDF-subsidized child care program, (5) Gold Seal accreditation
records, and (6) state licensing lists.
Data sources (1) and (2). The provider inspection and complaint data sources
that we use are from the FL Department of Children and Families (DCF), Licensing
Enforcement Division, District XI (Miami-Dade and Monroe counties). The data we use
cover all licensed child care centers, Head Start providers, and after-school providers in
MDC for the period January 1996 through August 2001.5
During the period of our study, FL required all licensed providers (i.e., child care
centers, public and private before- and after-school programs, Head Start programs, and
family child-care homes) to undergo inspections three or four times per year. The
required inspections, designed to verify child-care provider compliance with state and
5 Because our study includes only licensed providers, all the faith-based providers included are
licensed. However, the reader should know that faith-based providers are not required to be licensed in Florida and that they can participate in the CCDF child care subsidy program regardless of whether they are licensed or not.

15
locally mandated minimum standards, are rarely used sources of information on provider
quality. Yet, these inspection records have important advantages. For example,
inspectors must observe and assess all licensed providers, not just a sample of them,
and they must conduct their observations on an unannounced basis. Inspectors observe
all aspects of the physical environment, health, food and nutrition, child discipline and
supervision, and record keeping. Their reports contain data that can be used to develop
multiple measures of quality, for example, compliance with minimum standards for staff-
to-child ratios and compliance with minimum standards as to the maximum allowable
number of children in care at the facility. The complaint records maintained by the
Licensing Enforcement Division are also useful sources of information on provider quality
observed by different sets of eyes, such as parents.
Data source (3). Since January 1996 we have been collecting monthly
snapshots of the R&R provider databases maintained by Child Development Services
(CDS), as well as yearly snapshots of the R&R provider databases maintained by Family
Central, Inc. These are the two community child care coordinating (4C) agencies
serving MDC. The main function of R&R databases maintained by the 4C agencies is to
regularly collect and disseminate information on all child-care providers in the district,
including detailed information about many aspects of the care that is offered and about
staff credentials.
The R&R provider data we use includes information on all licensed non-family
providers, including centers, non-exempt schools/preschools, Head Start programs and
public and private after-school programs in the county. We do not analyze data on
licensed family child care homes or license-exempt programs.6 Our data covers the
6 We decided to exclude license-exempt programs (e.g., private schools) and family child care
homes (a very small group of providers in Miami-Dade) because our data on some of the measures of

16
period from the first quarter of 1996 to the third quarter of 2001, and it includes
information on provider capacities, vacancies, hours, days and months of operation,
ages of children served, and characteristics of care, including such things as prices
charged, caregiver education and training and accreditation status.
Data source (4). For MDC providers participating in the CCDF-subsidized child-
care program, we also use annual or bi-annual observational scores on the DCF Child
Care Assessment Tool for the period 1997 through 2001. All FL providers receiving
child-care subsidies from the CCDF are observationally assessed at least once annually7
by the 4C agency in their area. These agencies-- CDS and Family Central -- administer
the CCDF-subsidized child care program. Six different assessment tools were used
during the period of our study, one for each age group (i.e., infants, two-year-olds,
toddlers, preschoolers and school-age children) plus a “generic” tool covering areas such
as program management and staff development. (Sample assessment tool forms are
included in the Appendix of Queralt, Witte & Griesinger, 2000a). These tools
observationally assess the quality of care received by children and cover things such as
physical environment (indoor and outdoor space), learning environment, caregiver-child
interactions, developmental program, parent involvement, and health and nutrition.
Such assessments of providers receiving child-care subsidies provide an excellent source
of data on process quality.
quality for these providers was not as complete as for licensed group providers. For this same reason, of the faith-based providers we included only those that were licensed.
7 During the period of our study, providers that scored less than 95% on the CCPA were visited and assessed twice per year.

17
Data source (5). We also use annual provider accreditation lists, for the period
1996-2001, from the National Association for the Education of Young Children (NAEYC)
and from the FL Gold Seal Quality Care Program.8
Data source (6). In addition, we use, for the period ranging from 1996 to 2001,
annual licensing lists from the FL DCF. These lists provide basic information on all
licensed/registered/certified group child-care providers.
Quality Measures
In order to construct a composite index of provider quality, we started with the
diverse and rich measures of quality to be described in this section. We derived these
quality measures from minimum-standards inspections and complaint reports, from R&R
data, from CCDF-subsidized provider assessments and from accreditation records.
Some indicators reflect observational measures of the quality of care received by
children. Such measures are often called process measures, for example, accreditation
status of the provider, DCF Child Care Assessment scores received by facilities
participating in the CCDF-subsidized child care program, and complaints filed against
providers. Other indicators reflect structural measures, for example, staff credentials.
We provide a major addition to structural measures because we have measures of
actual compliance with all prescribed minimum standards, for example, compliance with
required staff-to-child ratios, and we also have information on various sanctions applied
to providers for non-compliance with prescribed minimum standards.
By using a composite quality index, one can arrange providers in a given
geographic area (including those receiving and not receiving CCDF subsidies and those
8 The FL Gold Seal Quality Care program, which was established in 1998, qualifies providers accredited by nationally recognized accrediting associations whose standards substantially meet or exceed the National Association for the Education of Young Children (NAEYC), the National Association for Family Child Care, or the National Early Childhood Program Accreditation Commission to receive up to 20% higher reimbursement rates when they participate in the subsidized child care program.

18
located and not located in poverty areas) on a quality spectrum ranging from the
highest quality settings (highest quartile of quality) to the lowest quality settings (lowest
quartile of quality). Such a quality indicator tool would allow policy makers and
administrators to identify high quality and low quality providers and to estimate the
number and proportion of children, particularly low-income children, receiving care in
the highest and lowest quality settings as child-care policies and administrative practices
change. In addition, a quality index would be useful to rate providers in a tiered
reimbursement program, or to rate providers on a continuum of quality as part of an
incentive program aimed at improving the quality of child care. This approach would
also make it possible to examine how process measures of quality relate to (correlate
with) structural measures.
The following are the quality measures we developed:
Accreditation:
Using data from NAEYC and from the FL Gold Seal Quality program reports, we
use a binary variable to classify providers on the basis of whether or not they are
accredited by nationally recognized organizations.
Staff Credentials:
Using R&R data, we classify providers on the basis of the credentials of their
staff, as reported by the providers in response to routine telephone inquiries made by
the R&R agencies. For descriptive purposes, we use the following categories: a) staff
have a high school diploma or less education; b) some staff have a CDA (Child
Development Associate credential); c) some staff have an associate degree (AA); d) all

19
staff have the CDA; e) some staff have a bachelor’s degree (BA); f) all staff have an AA
degree; g) all staff have a BA degree.9
For analytic purposes, we develop a 3-point scale: 0) staff have high school or
less education; 1) at least some staff have the CDA; 2) at least some staff have a higher
educational credential (i.e., the AA or BA degree).10
Curriculum:
Using R&R data, we classify providers on the basis of the curriculum they offer,
as reported by providers to the R&R agency.
For descriptive purposes, we classify providers on the basis of their curricular
offerings, as follows: a) no evidence of any type of curriculum; b) child development
curriculum; c) academic curriculum11; d) both child development and academic curricula.
For analytic purposes, we develop a binary variable to classify providers
according to whether or not they report any type of curriculum (academic, child
development or both).
Scores on DCF Child Care Assessment Tool
(only available for providers receiving CCDF-child-care subsidies)
For this quality indicator we use provider observational assessments made by the
two 4C agencies (CDS and Family Central) in the Miami-Dade area during the period of
our study. As described in the section on data sources, the 4C agencies use five
assessment tools to rate each provider participating in the CCDF subsidy program in
9When questions are asked only about terminal degrees (e.g., high school, CDA, AA, BA), one
misses training and personal and professional development some staff may have that did not culminate in a degree. Such additional information is generally not collected and was not available in Miami-Dade.
10 We use as many categories as necessary to richly describe our data on the quality measures. However, for the analysis, we were forced to collapse a number of these descriptive categories into fewer categories in order to avoid the statistical problems associated with having too many small cells. When it became necessary, we tried to collapse categories as meaningfully as possible.
11 Includes providers that describe their curriculum as either academic or Montessori.

20
terms of its age-group programs and an additional generic tool to rate program
management and staff development.
As a quality indicator, we average for each CCDF-subsidized provider the
“overall” scores they received during each year. The overall score, which is computed
and recorded by the 4C agencies, is simply the average of the individual scores received
by the providers across the five assessment tools.
Number of Inspection Visits:
From inspection reports by the Licensing Enforcement Division of DCF, we
classify providers on the basis of the yearly total number of inspection visits they have
had. Our reasoning for including this measure among our quality measures is that
inspectors more frequently re-visit providers needing follow-up after various non-
compliances have been noted during regular inspections.
Non-compliances:
To rate each provider’s level of compliance with child care minimum standards,
we create three separate measures. These are derived from data recorded in inspection
reports issued by the Licensing Enforcement Division of DCF. Inspection reports cover
many different aspects of quality, such as compliance with required caregiver-to-child
ratios and measures of health and safety (e.g., level of sanitation and cleanliness,
proper hand washing before meals and after diapering, staff tested for infectious
diseases, outdoor environment properly fenced and so on). (Samples of recent
inspection reports filed by inspectors in MDC may be viewed online by visiting the FL
DCF website dedicated to child care provider searches. This site includes, for each
provider, several recent inspection reports. The site is located at

21
http://199.250.30.131/childcare/provider/). The three quality measures we create from
these data are:
(1) Total number of provider non-compliances per year.
(2) Number of provider non-compliances per year specifically for violations of
caregiver-to-child ratio requirements.
(3) Severity of provider non-compliances:
For descriptive purposes, we classify each provider non-compliance, as recorded
in each inspection report, on a yearly basis, as follows: a) no non-compliance reported;
b) the reported non-compliance is not of a serious nature; c) the reported non-
compliance is serious; d) the reported non-compliance is very serious. We use a panel
of judges (two licensing enforcement directors from two districts in FL and two academic
researchers) to classify all non-compliances in the standard inspection report in terms of
their severity. A copy of the judges’ combined ratings on the severity of non-compliance
scale is included in the Appendix (Part II of this report).
For analytic purposes we develop a 3-point scale to classify the results of
provider inspections, on a yearly basis, as follows: 0) no non-compliance found; 1) the
non-compliance is less serious; 2) the non-compliance is more serious.
Complaints:
To rate providers in terms of complaints against them, we create two separate
measures from the data compiled by the Licensing Enforcement Division of DCF:
(1) Total number of complaints filed against the provider per year.
(2) Seriousness of complaint:
For descriptive purposes we classify providers yearly on the basis of the
seriousness of each complaint filed against them, as follows: a) no complaints on

22
record; b) complaint is not of a serious nature; c) complaint is serious; d) complaint is
very serious. We use a panel of judges (two academic researchers and two research
assistants) to classify all the complaints filed against providers during the period of our
study into the categories delineated above.
For analytic purposes we create a yearly binary that flags providers against
whom serious and very serious complaints have been filed.
Sanctions:
For descriptive purposes, from information gathered from the Licensing
Enforcement Division of DCF, we classify providers yearly on the basis of the level of
sanctions applied against them due to various violations, as follows: a) no sanction was
applied; b) provider received a warning or citation or was fined less than $500; c)
provider was fined $500 or more, was told that the facility would be closed unless
problem was resolved or that no children would be allowed at the premises until the
problem was resolved.
For analytic purposes, we develop a binary variable to flag sanctioned providers
on a yearly basis.
Vacancy Rates:
Using R&R data we classify providers in terms of their capacity, that is, the
number of children they are licensed to care for. Then we compute the vacancies they
report to the R&R agency as a percent of their total capacity. (Provider capacities and
vacancies are collected by the R&R agencies on a monthly or bi-monthly basis.) While
vacancy rates have not traditionally been used as measures of provider quality, they do
provide an indication as to whether or not a provider’s services are attractive to parents.
By placing their children with certain providers, parents reveal their preferences for the

23
services of these providers and such providers will have low vacancy rates. Economists
say that such providers have met the “market test.” By way of contrast, providers with
high vacancy rates have failed to meet the market test.
Descriptive Findings
In this section we start by describing and briefly summarizing the characteristics
of the providers in our database and then we focus our descriptions more specifically on
the quality measures we developed.
We studied a total of 1,276 licensed child care providers in MDC over a six year
period (1996 to 2001). The providers we studied include ALL the centers, Head Start
programs and public and non-public after-school programs located in MDC that were
both in the records of the local R&R agency and in the records of the Licensing
Enforcement Division. Forty-seven percent of the providers (n=528) had participated at
least for one of the years of our study in the CCDF-subsidized child care program. The
remaining providers (53%) did not receive CCDF subsidies during the period of our
study. Forty percent of the providers (n=510) were located in a poverty area,12 and
60% were not located in a poverty area.
Types of Providers
Figures 1 and 14 describe the types of providers we studied in terms of their
CCDF-subsidized status and whether or not they were located in a poverty area. 13 As
can be seen in Figure 1, the majority (69% to 83%) of the providers, across the years
and regardless of subsidy status, were centers. The figure also shows that the
proportion of centers (vis-à-vis the other types of licensed non-family providers in our
12 For the purposes of our study we classified a zip code area as a poverty area if at least 30% of
the children under the age of 18 in the area were living in poverty, according to the 2000 U.S. Census. 13 The year 1996 is not included in Figure 1 because we did not receive provider assessment scores
from the CCDF subsidy program for this year.

24
database) among the CCDF-subsidized providers grew from 73% to 83% during the
years of our study, while the proportion of centers among the providers not receiving
CCDF subsidies slightly decreased during the same period. The second largest group of
providers we studied was public-school after-school programs. Figure 1 shows a
substantial decrease in the proportion of public after-school programs receiving CCDF
subsidies during the years of our study. A small proportion of the licensed providers in
our database, ranging from 3% to 10%, were Head Start programs. Most of the Head
Start programs were not receiving CCDF subsidies. There were only a few private after-
school programs in our database.
Figure 14 describes the providers in terms of their location in poverty and non-
poverty areas. It is interesting to note the increase, over the years, in the proportion of
centers in both poverty and non-poverty areas, as well as the decline in the proportion
of Head Start programs (particularly in poverty areas). Also worth mentioning is the
decline in the proportion of public after-schools, both in poverty and non-poverty areas.
This decline in after-school care may be related to the state of FL’s increasing emphasis
on preschool care, particularly in recent years.
Religious Status
Figures 2 and 15 describe the licensed providers we studied in terms of their
religious status (faith-based versus not faith-based), as reported by the providers to the
R&R agencies. Both figures show a dramatic increase in the proportion of faith-based
providers over the years. This major increase in the proportion of faith-based providers
was more pronounced among those receiving CCDF subsidies (from 5% in 1997 to 49%
in 2001) than among those not receiving subsidies (from 19% in 1997 to 44% in 2001).
Figure 15 shows that the substantial increase in the proportion of faith-based providers

25
over the years extended to both poverty and non-poverty areas, although the increase
was more dramatic in poverty areas (from 13% in 1966 to 47% in 2001) than in non-
poverty areas (from 17% in 1996 to 45% in 2001). We believe that the remarkable
increase in the representation of this category of child care providers is related to
Florida’s emphasis in recent years on faith-based providers.14
Profit Status
Figures 3 and 16 summarize the profit status of the providers and show that
non-profit providers still dominate the MDC market, but they are losing momentum as
the for-profits gain market share. As can be seen in Figure 3, the proportion of non-
profit providers is higher among providers not receiving CCDF subsidies than among
those receiving subsidies, and it has been increasing over the years (from 67% in 1997
to 70% in 2001). In contrast, the proportion of for-profit providers is higher among
those receiving CCDF subsidies, and this proportion has been increasing through the
years (from 39% in 1997 to 47% in 2001). Figure 16 shows, as would be expected,
that the proportion of non-profit providers is greater in poverty areas than in non-
poverty areas. However, it also shows that the proportion of non-profit providers (as
compared to those for profit) has been decreasing somewhat in poverty and non-
poverty areas.
Subsidy Status and Location
Figure 4 describes how the providers vary in terms of whether they receive or do
not receive CCDF subsidies, depending on whether or not they are located in poverty
14 For example, under Governor Bush faith-based providers have had a special seat on the state’s
Early Learning Council and on the State Partnership Board. Also, Governor Bush has opened a separate program office for faith-based providers.

26
areas.15 As would be expected, the proportion of providers receiving CCDF subsidies is
greater in poverty areas than in non-poverty areas, but it is not as large a proportion as
one might have expected. In fact, the data shows that roughly half of providers in
poverty areas do not participate in the subsidized child care program. In non-poverty
areas roughly two-thirds to three-fourths of providers do not participate in the
subsidized child care program.16 Figure 4 also shows that the proportion of providers
taking CCDF subsidies has been growing, in non-poverty areas from 24% in 1997 to
31% in 2001 and in poverty areas from 46% in 1997 to 52% in 2001.
Accreditation
The national accreditation status of the providers is summarized in Figures 5 and
17. Although the vast majority of the providers were unaccredited during the period of
our study, Figure 5 shows a substantial increase in the proportion accredited through
the years, particularly among CCDF-subsidized providers (from 2.6% in 1997 to 7.1% in
2001). The increase in accreditation was less substantial among providers who were
not participating in the program (from 2.8% in 1997 to 4.2% in 2001).17 The difference
in the increase in accreditation among CCDF-subsidized providers is not surprising, given
the substantially higher reimbursement rates received by providers participating in the
15 We classified providers for each year of our study as receiving CCDF subsidies if, for that year,
they had been assessed by either of the two 4C agencies. Those providers that had not been assessed by either of the two 4C agencies during a particular year were classified as not receiving CCDF subsidies.
16 Requirements for participation, while not very onerous are not negligible. To participate in the subsidized child care program in MDC providers must sign a rate agreement, agree to be audited in accordance with Federal guidelines, and be willing to offer paid holidays for the staff. Also subsidized providers must agree to be observationally assessed at least once yearly by the 4C agency in their area. These providers must also be willing to keep attendance records on the children with child care subsidies they are caring for, to regularly submit these records to the 4C agency for reimbursement and to regularly collect co-payments from parents. We are not aware of any additional requirements. To be sure, subsidized providers do not have to maintain more stringent ratios or group sizes than unsubsidized providers and they do not have to participate in the USDA food program.
17 Providers accredited by nationally recognized accrediting associations receive up to 20% higher reimbursement rates through the Gold Seal program when they participate in the subsidized child care program.

27
CCDF subsidy program and accredited by the FL Gold Seal Program. Interestingly,
Figure 17 shows more substantial increases in the proportion of Gold Seal accredited
providers in non-poverty areas (from 2.3% in 1996 to 6.1% in 2001) than in poverty
areas (from 1.7% in 1996 to 4.3% in 2001).
Staff Credentials
Figures 6 and 18 describe the situation with respect to staff credentials, as
reported by providers to the R&R agency. Both figures show that the largest proportion
of staff members at child care facilities in MDC have a high school education or less.
Figure 6 shows that, across the years of our study, the proportion of staff with high
school or less was somewhat higher at facilities not receiving CCDF subsidies, as
compared to facilities receiving subsidies. Figure 18 shows that the proportion of staff
with high school or less increased substantially in poverty areas (from 28% in 1996 to
39% in 2001), while in non-poverty areas, the proportion of staff with high school or
less decreased slightly over the years we studied (from 34% in 1996 to 33% in 2001).
Figure 6 shows that facilities not receiving CCDF subsidies had a somewhat higher
proportion of staff with BA degrees and a somewhat lower proportion of staff with the
CDA credential, as compared to facilities receiving CCDF subsidies. Figure 18 shows that
while facilities in poverty areas experienced a decrease in the proportion of staff with BA
degrees in the years from 1996 to 2001, facilities in non-poverty areas experienced an
increase in the proportion of staff with BA degrees. This figure also shows, through the
years of our study, a decreasing proportion of staff with CDAs, both in poverty and non-
poverty areas.
Curriculum

28
Figures 7 and 19 describe the curriculum situation, according to R&R records. As
can be seen in these figures, a substantial proportion of providers report that they do
not offer any curriculum for the children. Figure 7 shows that the proportion of
providers not receiving CCDF subsidies reporting that they do not have any curriculum
increased from 29% in 1997 to 37% in 2001. In contrast, for providers receiving CCDF
subsidies, the proportion reporting no curriculum has decreased from 27% in 1997 to
18% in 2001. In terms of geographic areas, the proportion of providers reporting no
curriculum has remained stable in non-poverty areas (28% in 1996 and 29% in 2001),
but it has increased in poverty areas (from 26% in 1996 to 30% in 2001).
It is encouraging to note, however, that the proportion of both subsidized and
unsubsidized providers in poverty and non-poverty areas offering an academic
curriculum increased during our study period. Specifically, as shown in Figure 7, the
proportion offering an academic curriculum increased among unsubsidized providers
from 19% in 1997 to 21% in 2001, while it increased more substantially among CCDF-
subsidized providers, from 13% in 1997 to 21% in 2001. As per Figure 19, the
proportion of providers offering an academic curriculum increased in non-poverty areas
from 18% in 1996 to 22% in 2001, and it increased in poverty areas from 15% in 1996
to 20% in 2001.
Number of Inspection Visits
Figures 8 and 20 provide information about the yearly number of CDF inspection
visits to provider facilities to enforce compliance with child care standards. Both figures
show a decline in the number of provider inspection visits per year, from a median of 4
visits in 1997 down to a median of 3 visits in 1999 and 2000. The decline affected all
providers, subsidized and unsubsidized in poverty and non-poverty areas. It is our
29
understanding that this change reflects a reduction in the number of required provider
inspection visits per year.
Non-compliances
Figures 9 and 21 summarize our findings with respect to provider non-
compliances with child care minimum standards. (Please refer to the section on Quality
Measures for a discussion of how our measures were created.) Figure 9 shows, across
the years of our study, that providers not receiving CCDF subsidies were substantially
more likely to be found to be in compliance with child care standards (i.e., to have no
non-compliances), compared to providers participating in the subsidy program.18 Figure
9 also shows a small increase through the years in the proportion of providers in
compliance (i.e., with no non-compliances for a given year), with the increase being
slightly greater for providers who were not participating in the CCDF subsidy program
(34% in 1997 to 36% in 2000) than for subsidized providers (26% in 1997 to 27% in
2000). Figure 21 shows, through the years 1996 to 2000, a substantially larger and
growing proportion of providers found to be in compliance with standards in poverty
areas (from 30% in 1996 to 38% in 2000), compared to non-poverty areas, but no
change in the proportion of providers in compliance in non-poverty areas (29% both in
1996 and in 2000).
Figures 9 and 21 show that a large proportion of providers (36% to 58%)
committed what our panel of judges deemed to be very serious violations of the child
care standards. Very serious violations of the standards include, among others, things
such as lacking adequate supervision of children, presence in the facility of toxic or
18 It should be noted that subsidized providers are observationally assessed by the 4C agencies at least once yearly and that, if the assessors observe any licensing violation or some other infraction while they are observing the program, they are required to alert licensing or the abuse line depending on the nature of the problem observed. This may result in higher numbers of licensing non-compliances noted for subsidized providers than for unsubsidized providers.

30
hazardous materials, exits not clearly marked, lack of an operable phone, medicines not
properly labeled or stored, or children released to unauthorized individuals.19 It appears
that serious non-compliances are becoming less common than they used to be.
Specifically, Figure 9 shows a reduction in the proportion of providers who had
committed one or more very serious violations. This may be due to the decrease in the
number of inspections per year or may indicate that compliance with minimum
standards has improved through time. For unsubsidized providers the reduction was
from 47% in 1997 to 39% in 2000, and for CCDF subsidized providers the reduction was
from 58% in 1997 to 47% in 2000. Figure 21 shows the most dramatic decrease in the
incidence of serious non-compliances taking place in poverty areas; specifically, in
poverty areas serious violations went down from 50% in 1996 to 36% in 1997).
Unexpectedly, however, the proportion of serious violations remained static in non-
poverty areas (47% in both 1996 and 2000).
Figures 10 and 22 use box plots to provide information about the yearly number
of provider non-compliances. The line in the middle of the box is the median number of
non-compliances. The top of the box is the 75th percentile of the number of non-
compliances and the bottom of the box is the 25th percentile of the number of non-
compliances. The length of the box is the inter-quartile range (75th percentile-25th
percentile), and it is a measure of how much providers vary in number of non-
compliances. Fifty percent of providers will have a number of non-compliances that fall
within the box. The lines extending out from the top and the bottom of one of the boxes
are often called the whiskers. The whiskers extend 1.5 times the inter-quartile range.
19 To view the judges’ combined ratings on the severity of non-compliance scale, please refer to
the Appendix in Part II of this report.
31
Providers with scores falling in the upper whiskers have large numbers of failures to
comply with minimum standards.
Figure 10 shows that CCDF-subsidized providers had a substantially wider range
of yearly non-compliances (i.e., from 0 to 17), compared to providers not receiving
subsidies (from 0 to 12). CCDF-subsidized providers also had a higher median number
of yearly non-compliances than unsubsidized providers in 1997 and 1998 (3 non-
compliances in 1997 and 4 in 1998 for subsidized providers versus 2 non-compliances
both in 1997 and 1998 for unsubsidized providers).20 However, the median number of
non-compliances for subsidized and unsubsidized providers became equal in 1999 and
2000 (2 non-compliances per year in 1999 and 2000 for both subsidized and
unsubsidized providers). Figure 22 shows that the decline in the median yearly number
of provider non-compliances after 1998 was more pronounced in poverty areas (from 3
non-compliances per year to 1) than in non-poverty areas (from 3 non-compliances per
year to 2).
Compliance with required staff-to-child ratios is also an important indicator of
quality, and minimum-standards inspections provide unique information on failures to
meet required ratios. According to the FL child care standards, providers are required to
stay within certain prescribed limits in terms of how many staff members must be
present at the facility to care for children of different ages.21 When inspectors visit the
providers, they observe the actual ratios and are supposed to issue non-compliances
when providers exceed the prescribed ratios. Figures 23 and 24 summarize our findings
20 It is possible that the difference between subsidized and unsubsidized providers is at least partly
attributable to the fact that, on average, subsidized providers are observationally assessed more frequently than unsubsidized providers and that assessors from the 4C agencies are required to report to the licensing office or to the abuse line any violations observed during their visits.
21 During the years of study one staff member was required for every 4 0-12 month infants, for every 6 one-year-olds, for every 11 two-year-olds, for every 15 three-year-olds, for every 20 four-year-olds, and for every 25 children ages 5 and older.

32
with respect to the mean number of provider non-compliances due to staff-to-child ratio
violations per year.
Figure 23 shows that, through the years of our study, CCDF-subsidized providers
had a higher yearly mean number of staff-to-child ratio violations than unsubsidized
providers, but the gap between the two categories of providers was becoming smaller.
Specifically, in 1997, approximately 6% of unsubsidized providers were found to be in
violation of ratio requirements, while 22% of CCDF-subsidized were found to be in
violation. By the year 2000, approximately 10% of unsubsidized providers had staff-to-
child ratio violations, while approximately 17% of subsidized providers had ratio
violations. While subsidized and unsubsidized providers were coming closer together in
terms of staff-to-child ratio violations, Figure 24 shows a growing gap between providers
in poverty and non-poverty areas, with providers in poverty areas having an inspection
record of fewer staff-to-child ratio violations than those in non-poverty areas.
Specifically, in 1998 approximately 13% of providers in poverty areas had ratio
violations, while it was approximately 17% in non-poverty areas. By 2000, the
proportion of providers in poverty areas with ratio violations had fallen to approximately
7%, but it had increased to 18% in non-poverty areas.
Complaints
Figures 11 and 25 summarize our findings with respect to complaints filed
against providers. As can be seen in these figures, while the vast majority of providers
had no record of complaints, between 10% and 25% did have complaints filed against
them during the years of our study. Figure 11 shows that complaints were less
frequently filed against providers not receiving CCDF subsidies (90-93% had no
complaints), than against CCDF-subsidized providers (75-84% had no complaints).

33
However, the proportion of unsubsidized providers with no record of complaints has
been decreasing somewhat (from 93% in 1997 to 91% in 2000), while the proportion of
CCDF-subsidized providers with no record of complaints has been increasing somewhat
(from 82% in 1997 to 84% in 2000). For all geographic areas, Figure 25 shows a slight
increase in the proportion of providers with no record of complaints (in poverty areas
from 89% in 1996 to 91% in 2000 and in non-poverty areas from 85% in 1996 to 86%
in 2000).
Very serious complaints are very rarely filed against providers. However, Figure
11 shows that the proportion of very serious complaints has been increasing. Among
providers not receiving CCDF subsidies, the incidence of very serious complaints
increased from .39% in 1997 to 1.17% in 2000, and among providers receiving
subsidies it increased from 1.07% in 1997 to 1.41% in 2000). In terms of geographic
areas, Figure 25 shows that the proportion of very serious complaints against providers
has been decreasing in non-poverty areas (from 1.84% in 1996 to 1.3% in 2000), while
it has been increasing in poverty areas (from .35% in 1996 to 1.22% in 2000).
Sanctions
During the years of our study providers were rarely sanctioned or fined for their
non-compliances or misbehaviors. In fact, Figures 12 and 26 show that the vast majority
of providers had a record free of any sanctions imposed by minimum-standards
inspectors. This is true for all categories of providers, subsidized and unsubsidized as
well as for providers in poverty and non-poverty areas. However, sanctions or fines are
becoming more common. As can be seen in Figure 12, the proportion of subsidized
providers who were sanction-free went down from 96% in 1997 to 84% in 2000, and for
unsubsidized providers, the proportion sanction-free decreased from 97% in 1997 to

34
87% in 2000. Figure 26 shows that in poverty areas the proportion sanction-free
decreased from 93% in 1996 to 85% in 2000, and in non-poverty areas the proportion
sanction-free decreased from 93% in 1996 to 87% in 2000.
Major sanctions (i.e., fines of $500 or more, facility closings, or barring children
from the premises until the problem is resolved), in particular, have increased
substantially through the years. As can be seen in Figure 12, the proportion of
providers, both subsidized and unsubsidized, receiving major sanctions has increased
dramatically; specifically the proportion of providers not on CCDF subsidies receiving
major sanctions increased from less than 1% (.2%) in 1997 to 10% in 2000, and the
proportion of CCDF-subsidized providers receiving major sanctions increased from 0% in
1997 to 8.47% in 2000. Figure 26 shows the greatest increase in the proportion of
providers receiving major sanctions in poverty areas (from .69% in 1996 to 12.47% in
2000), while the increase in major sanctions applied to providers in non-poverty areas,
while very substantial, has been the lowest (from 1.15% in 1996 to 7.3% in 2000).
Vacancy Rates
Figures 13 and 27 provide box plots for provider vacancy rates (i.e., their
acancies as a percent of their capacities or number of licensed slots). While vacancy
rates have not traditionally been used to be a measure of provider quality, they do
provide an indication as to whether or not a provider’s services are attractive to parents.
By placing their children with certain providers, parents reveal their preferences for the
services of these providers, and such providers will have lower vacancy rates than other
providers not chosen as frequently. Economists say that such providers have met the
“market test.” By way of contrast, providers with high vacancy rates have failed to meet
the “market test.”

35
Figure 13 shows that, across the years of our data, CCDF-subsidized providers
had higher median vacancy rates than unsubsidized providers (medians are indicated in
the graph by the line in the middle of the boxes). However, the differences in vacancy
rates between subsidized and unsubsidized providers appear to be getting proportionally
somewhat smaller than they used to be. Specifically, in 1997 unsubsidized providers
had a median vacancy rate of 16%, while CCDF-subsidized providers had a median
vacancy rate of 27%. By 2001 median vacancy rates were much lower--the median
vacancy rate of unsubsidized providers was 9%, and it was 13% for subsidized
providers. Figure 27 shows the same trend toward lower vacancy rates in the years we
studied in both poverty and non-poverty areas. This figure also shows that median
vacancy rates in 1997 and 1998 were higher in poverty areas (23% in 1997 and 22% in
1998) than in non-poverty areas (18% in 1997 and 19% in 1998). But the situation
became reversed in 1999, 2000, and 2001, with higher median vacancy rates in non-
poverty areas (17% in 1999, 10% in 2000, and 12% in 2001) than in poverty areas
(14% in 1999, 8% in 2000, and 10% in 2001). The lower vacancy rates in poverty areas
may well reflect the effects of welfare reform.
Analytic Findings
For both analytic and administrative purposes it is desirable to have a composite
index of quality that incorporates many quality measures and reflects the multi-faceted
nature of child care quality. To develop a composite index of quality, we used principal
components analysis (PCA) (see Rencher, 1998). PCA allows one to develop a smaller
set of factors that capture most of the information from a larger number of quality
indicators. PCA also allows one to identify the pattern of association among the multiple

36
measures of quality, that is, it allows us to discern which measures of quality are highly
correlated.
The PCA indicated that six factors explained approximately 80% of the variance
in all of the quality variables available for all providers (all the variables except scores on
the Child Care Assessment observations, which were only available for the CCDF-
subsidized providers). These six factors successfully isolate major indicators for different
aspects of quality.
Factor 1—Minimum-Standards Compliance
The first factor, which explained 28% of the overall variance in the quality
indicators, loaded highly on factors related to minimum-standards compliance. It
specifically reflects the providers’ level of adherence to minimum-standards regulations.
It is interesting that this factor explains such a large proportion of the overall variance in
the data. The finding suggests that there may be substantial benefits gained from
incorporating data from minimum-standards inspections when measuring provider
quality.
Factor 2—Staff Credentials and Curriculum
The second factor, which explains 14% of the overall variance in the quality
indicators, loaded highly on staff credentials and the use of a curriculum. These factors
have traditionally been found to be associated with higher levels of provider quality.
Factor 3—Number and Seriousness of Complaints
The third factor, which explains 11% of the overall variance in the quality
indicators, loaded highly on the absence of complaints about the provider. Complaints
generally come from parents and sometimes from others (e.g., neighbors, police,
firemen, advocates) who observe providers in the course of their own activities. More

37
complaints and complaints that are more serious provide an additional perspective on
provider quality.
Factor 4—Percent Vacancies
The fourth factor, which explains 9% of the overall variance in the quality
indicators, loaded highly on the percent of slots at the provider that were filled (i.e., it
loaded negatively on the vacancy rate). As we had surmised, a provider’s ability to
attract parents is an important and unique aspect of quality. However, note that this
factor is much less important than other commonly used measured of quality such as
the credentials of staff and the use of a curriculum.
Factor 5--Sanctions
The fifth factor, which explains 8% of the overall variance in the quality
indicators, loaded highly on the absence of sanctions (i.e., it was inversely related the
number of sanctions that a provider received). It appears that the sanctioning process
provides yet another look at provider quality.
Factor 6--Accreditation
The final factor, which also explains 8% of the overall variance in the quality
indicators, loaded highly on accreditation. Accreditation, which is used by many quality
rating systems, does appear to be a unique dimension of quality. Typically, to be
accredited, providers need to undergo a self study and observation by a trained
observer every three years or so. Receiving accreditation certifies, by an independent
body, that they provider has achieved a threshold level of quality.
Observational Assessment of Classrooms and of Management
We also carried out a PCA analysis for CCDF-subsidized providers that included,
in addition to the quality variables used in the previous analysis, the overall scores this
set of providers obtained on the observational assessments using the Child Care

38
Assessment Tool. The PCA indicated that five factors explained approximately 70% of
the variance in all of the quality variables available. The factors were approximately the
same as for the PCA analysis that did not contain the observational assessment.
Interestingly, the observational assessment scores loaded heavily on factor 2. This
means that staff credentials and the use of curriculum are highly correlated with
observational assessment of classrooms and of facility management.
The Composite Index of Quality
Using scoring coefficients (i.e., eigenvectors) from the PCA, we next calculated
values for each of the factors for every provider and ranked each of the providers on
each factor. Using the scores on each factor, we can compare how different providers
rank in terms of minimum-standards compliance, curriculum and credentials of staff, the
absence of complaints, the ability to attract clients, sanctions and accreditation.
Finally, weighting each of the factor values by the proportion of variance
explained by the factor, we obtained two composite indexes of quality for providers that
participate in the CCDF child care subsidy program and one composite index of quality
for providers who do not participate in the child care subsidy program. One index used
all variables including the observational assessments and the other used all variables
except the observational assessments. As previously noted, the observational
assessments were only available for CCDF-subsidized providers.
To see the impact of omitting observational assessments, we correlated the two
composite indexes of quality for providers that participated in the child care subsidy
program. The correlation of the two composite indices was .98 (significant at the .0001
level). We concluded that observational assessments add information; however, they, do
39
not add a great deal of information, if a wide array of other quality measures are
available from administrative records.
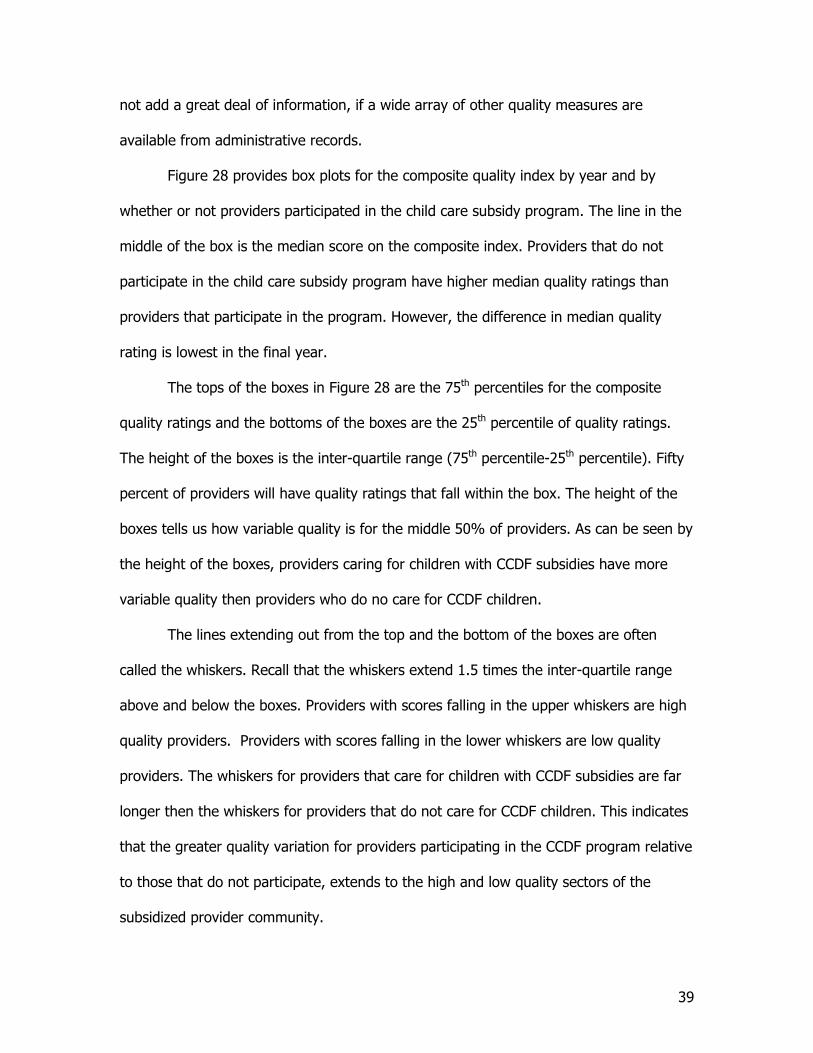
Figure 28 provides box plots for the composite quality index by year and by
whether or not providers participated in the child care subsidy program. The line in the
middle of the box is the median score on the composite index. Providers that do not
participate in the child care subsidy program have higher median quality ratings than
providers that participate in the program. However, the difference in median quality
rating is lowest in the final year.
The tops of the boxes in Figure 28 are the 75th percentiles for the composite
quality ratings and the bottoms of the boxes are the 25th percentile of quality ratings.
The height of the boxes is the inter-quartile range (75th percentile-25th percentile). Fifty
percent of providers will have quality ratings that fall within the box. The height of the
boxes tells us how variable quality is for the middle 50% of providers. As can be seen by
the height of the boxes, providers caring for children with CCDF subsidies have more
variable quality then providers who do no care for CCDF children.
The lines extending out from the top and the bottom of the boxes are often
called the whiskers. Recall that the whiskers extend 1.5 times the inter-quartile range
above and below the boxes. Providers with scores falling in the upper whiskers are high
quality providers. Providers with scores falling in the lower whiskers are low quality
providers. The whiskers for providers that care for children with CCDF subsidies are far
longer then the whiskers for providers that do not care for CCDF children. This indicates
that the greater quality variation for providers participating in the CCDF program relative
to those that do not participate, extends to the high and low quality sectors of the
subsidized provider community.

40
The dots that extend above the upper whiskers and below the lower whiskers
are outliers. The providers associated with the dots above the upper whiskers have the
highest quality ratings, and the providers associated with the dots below the lower
whiskers have the lowest quality ratings. Note that in 1997 through 1999, there were a
number of extremely low quality providers participating in the CCDF program. However,
by 2000, the providers with exceedingly low quality scores had been eliminated for
CCDF providers but not for providers that did not participate in the CCDF program.
Possible Administrative Uses of the Composite Quality Index
The box and whiskers categorization of providers on the composite quality index
could be used in a number of ways. First, such categorization provides a firm foundation
for a quality rating system. Providers represented by the dots at the top of the upper
whisker could receive the highest quality rating and reimbursement rate. Those
receiving scores in the upper whisker could receive the next highest rating. Those
receiving scores that fell in the box could receive an average quality rating. Those
receiving scores falling in the lower whisker could receive below average rating and
those below the lower whisker could receive the lowest available rating.
Second, the box and whiskers categorization of providers allows administrators
and advocates to quickly identify the providers with the lowest quality scores. These
providers could be targeted for interventions. Finally, quality rating scores could be
followed across time to see if quality improves as various quality-related interventions
are put in place.
Significant Differences in Composite Quality Scores?
To discern if the quality scores of providers differed significantly, we compared,
by means of t-tests, the pool of CCDF-subsidized providers versus the pool of

41
unsubsidized providers in terms of their quality scores for each of the years of our study.
We found that for the years 1997, 1998, and 1999, CCDF-subsidized providers had
quality scores that were significantly lower than unsubsidized providers (p<0.0000). In
2000, CCDF-subsidized providers had lower quality index scores than unsubsidized
providers, but the difference was of borderline statistical significance (p<0.054).
We also compared, by means of t-tests, all the providers in non-poverty areas
versus all the providers in poverty areas (both subsidized and unsubsidized). Because
the largest group of providers in poverty areas receives CCDF subsidies, we thought it
was possible that location in a poverty area, rather than subsidized status, might be an
important reason behind the lower quality index scores of subsidized providers.
However, we found that for the years 1997, 1998, and 1999, there was no statistically
significant difference between the quality index scores of providers in poverty and non-
poverty areas. For 2000, we found that providers in poverty areas had very significantly
higher quality index scores than providers in non-poverty areas (p<-.0003). We,
therefore, discarded the notion that providers receiving CCDF-subsidies might have
lower quality index scores as a function of their more frequent location in poverty areas.
Finally, we consider how quality scores vary for providers over time. This is
important. If there is relatively little variation in the quality scores of providers over time,
then quality scores can be recalculated infrequently. If there is a great deal of variation
in provider scores across time, then scores will need to be calculated more frequently.
Somewhat surprisingly, we find a great deal of variation in provider scores across time.
Specifically, for providers that participate in the child care subsidy program, the overall
variation in quality score (the standard deviation) is .64. Given that the mean quality
score is -.07, this represents very substantial variation (coefficient of variation=9). The

42
standard deviation of quality scores across these subsidized providers (i.e., between
variation) is .48, and the variation in provider scores across years (i.e., within variation)
is .40. For providers that do not participate in the child care subsidy program, the
overall variation in quality score (the standard deviation) is .47. Given that the mean
quality score is .06, this also represents substantial variation (coefficient of variation=8),
but much less variation than for providers that participate in the subsidy program. The
standard deviation of quality scores across subsidized providers (i.e., between variation)
is .42, and the variation in provider scores across years (i.e., within variation) is .30. The
substantial variation in quality scores for provides across time suggests that quality
scores need to be recalculated rather frequently.
Summary and Conclusions
In this paper, we demonstrate some of the advantages of compiling a
comprehensive set of quality indicators and following the scores of providers on these
indicators over time. We show how such indicators can be used to track changes in the
child care market and to examine impacts of changes in policies and administration. We
compare and contrast providers operating in poverty and non-poverty neighborhoods
and providers participating and not participating in the CCDF child care subsidy program.
In many cases, trends for child care providers operating in poverty neighborhoods are
quite different from trends for providers that participate in the CCDF subsidy program.
This reflects the fact that many providers that participate in the CCDF subsidy program
operate outside poverty neighborhoods and the fact that not-for-profit providers
unaffiliated with the CCDF program provide much of the care in poverty neighborhoods.
Further, while for-profit firms account for almost half of CCDF-subsidized programs in

43
recent years, for-profit firms account for only about 30% of the providers in poverty
neighborhoods.
Over the period of our study, we find a marked increase in the number of child
care centers and a decline in both Head Start programs and after-school programs in
public schools. We are not aware of any demographic or income changes in the child
and adolescent populations that might help to explain these programmatic changes. The
decrease in after-school programs may reflect a shift of priorities in Florida (the state of
our study area, Miami-Dade County). The increase in child care centers and decline in
Head Start programs may be the result of the emphasis on work under Welfare Reform
in Florida. For working parents, full-time child care centers would likely be more
convenient than Head Start, if the Head Start program near them is not full-day. In our
study area, we find a marked increase in the proportion of licensed providers with
religious affiliations beginning in 2000 (see Figure 2 and Figure 15). Specifically, in 1996,
the first year of our study and the year before welfare reform began, 13% of providers
in more economically advantaged neighborhoods and 17% of providers in poverty
neighborhoods had religious affiliation. By the year 2000, 51% of providers in both
poverty neighborhoods and more economically advantaged areas had religious
affiliation. Similarly, in 1997, only 5% of providers caring for children with CCDF
subsidies had religious affiliation, but by the year 2000 55% of CCDF-providers had
religious affiliation. This increase probably reflects Governor Jeb Bush’s faith-based
initiative, which was well underway by 2000 after his election as Governor in 1998.
During the period of our study, we also find a large increase in the proportion of
providers caring for CCDF-subsidized children that report that they operate for profit
(see Figure 3). Specifically, in 1997, 39% of providers caring for children receiving

44
CCDF subsidies reported that they were operating for profit. By 2001, 47% reported
for-profit status. This contrasts with the trend for providers that did not take care of
children with CCDF subsidies. Among these providers, those claiming for-profit status
declined from 33% in 1997 to 30% in 2001.
We find that accreditation increased particularly for providers caring for children
receiving CCDF subsidies (see Figure 5). However, during the period of our study,
accreditation in Miami-Dade County remained rare. In 1997, 3% of both providers caring
for CCDF subsidized children and those not doing so were accredited. By 2001, 7% of
providers caring for CCDF subsidized children were accredited, while the proportion of
providers without CCDF children who were accredited remained virtually unchanged
since 1997. This reflects the increased reimbursements rates available to accredited
CCDF providers.
We find a worrying increase in the proportion of staff with low levels of
education (i.e., high school or less) at providers located in poverty neighborhoods (see
Figure 18). In 1996, providers in poverty areas reported that 28% of their staff had a
high school education or less, while by 2001 they reported that 39% of their staff had a
high school education or less. In contrast, there was only a slight increase in the
proportion of staff with a high school education or less among providers that cared for
children with CCDF subsidies (see Figure 6).
As can be seen in Figure 7 and Figure 19, providers participating in the CCDF
program were far more likely to report using a curriculum at the end of our study period
than at the beginning. In 1997, 73% of CCDF providers reported using a curriculum,
while in 2001 82% reported using a curriculum. By way of contrast, a smaller proportion
of providers that did not participate in the CCDF program reported using a curriculum

45
(71% in 1997), and the proportion using a curriculum declined over the study period
(63% reported using a curriculum in 2001). We believe that the increased use of a
curriculum by CCDF providers reflects the increased emphasis on school readiness in the
Florida CCDF program over the course of our study period.
One of our work innovations is to use both the results of minimum-standards
inspections and records of complaints about providers as measures of quality. Our work
indicates that these sources of information provide unique and very important measures
of some aspects of quality. We find that providers outside the CCDF subsidy program
are more compliant with minimum-standards regulations than providers that participate
in the program (see Figure 9). For example, in 2001 36% of providers that did not
participate in the CCDF program were found to be fully compliant with minimum
standards, while only 27% of providers participating in the CCDF program were found
fully compliant. As noted earlier, part of the difference may be attributable to the fact
that subsidized providers are observationally assessed at least one extra time per year
(compared to unsubsidized providers) and that assessors from the 4C agencies are
required to alert licensing or the abuse line if they observe any violations.
Another of our work innovations is the development of a method for evaluating
the seriousness of violations of minimum standards and of complaints about providers.
To develop the measures of seriousness, we used an expert panel that included
managers of inspection and compliance offices and researchers. As can be seen in
Figure 9 and Figure 21, the proportion of providers in poverty neighborhoods and the
proportion of providers participating in the CCDF program that had minimum-standards
violations that were judged by the panel of experts to be very serious declined during
the period of our study. For example in 1997, 58% of providers participating in the
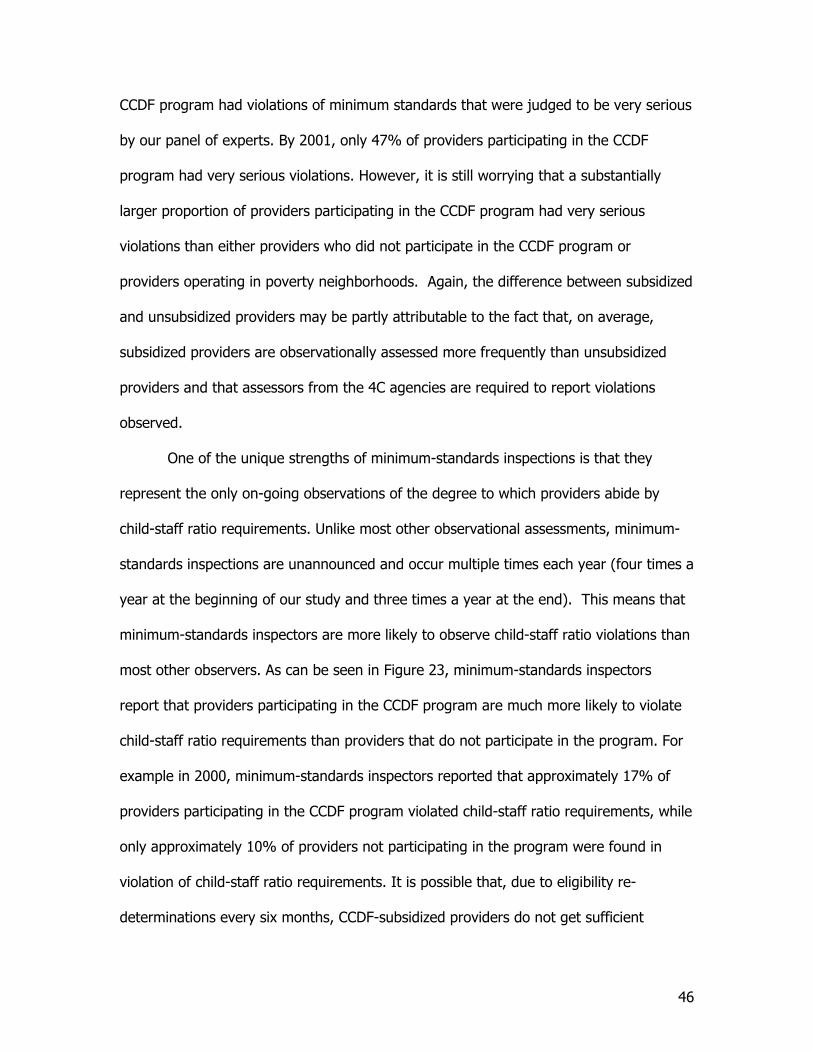
46
CCDF program had violations of minimum standards that were judged to be very serious
by our panel of experts. By 2001, only 47% of providers participating in the CCDF
program had very serious violations. However, it is still worrying that a substantially
larger proportion of providers participating in the CCDF program had very serious
violations than either providers who did not participate in the CCDF program or
providers operating in poverty neighborhoods. Again, the difference between subsidized
and unsubsidized providers may be partly attributable to the fact that, on average,
subsidized providers are observationally assessed more frequently than unsubsidized
providers and that assessors from the 4C agencies are required to report violations
observed.
One of the unique strengths of minimum-standards inspections is that they
represent the only on-going observations of the degree to which providers abide by
child-staff ratio requirements. Unlike most other observational assessments, minimum-
standards inspections are unannounced and occur multiple times each year (four times a
year at the beginning of our study and three times a year at the end). This means that
minimum-standards inspectors are more likely to observe child-staff ratio violations than
most other observers. As can be seen in Figure 23, minimum-standards inspectors
report that providers participating in the CCDF program are much more likely to violate
child-staff ratio requirements than providers that do not participate in the program. For
example in 2000, minimum-standards inspectors reported that approximately 17% of
providers participating in the CCDF program violated child-staff ratio requirements, while
only approximately 10% of providers not participating in the program were found in
violation of child-staff ratio requirements. It is possible that, due to eligibility re-
determinations every six months, CCDF-subsidized providers do not get sufficient

47
advance notice about the number of subsidized children that will continue or will not
continue in the program to make the necessary adjustments in staffing and that this
leads in some cases to temporary ratio violations. The prevalence of for-profit providers
in the CCDF program may also help to explain the large difference in child-staff ratio
violations between subsidized and unsubsidized providers. For-profit firms have strong
pressures to reduce costs to stay in business, and staff costs, which generally are
between 70% and 75% of total provider costs, are by far the largest expense for child
care providers. This issue merits further investigation.
While minimum-standards inspectors provide very important observational
measures of such things as provider health, safety and compliance with standards,
complaints from other individuals observing providers offer a different and also valuable
source of information. Figure 11 and Figure 25 provide information on the frequency
and seriousness of complaints about providers. Providers participating in the CCDF child
care subsidy program received far more complaints, many of which were judged to be
serious, than either providers that did not participate in the child care subsidy program
or providers operating in poverty neighborhoods.
As can be seen in Figure 12 and Figure 26, during the period of our study,
providers were not sanctioned for most violations of minimum standards. Only some of
the more serious violations resulted in sanctions. However, for all provider groups
studied, the proportion of providers receiving sanctions for minimum-standards
violations increased during our study period, and providers in poverty neighborhoods as
well as providers participating in the CCDF program were more likely to be sanctioned
than other providers. The increase in the most serious sanctions (i.e., a fine of more
than $500 or not allowing the provider to care for children) is particularly noteworthy.

48
The quality measures described to this point come either from telephone surveys
of providers carried out by the R&Rs in Miami-Dade or from observations of minimum-
standards inspectors or others interacting with providers. Complaints often come from
parents, particularly very dissatisfied parents.
When parents are choosing a provider to care for their children, they assess the
characteristics and services of various possible providers on whatever criteria they feel
relevant. Research suggests that convenience, in terms of location and hours of
operation, is an important consideration for parents, but that such things as the warmth
of the provider and the way the provider interacts with their children are also important.
Providers that have characteristics and services that parents want will have many
parents willing to place their children in care. Such providers will have a large proportion
of their licensed capacity utilized. By way of contrast, providers with characteristics and
services that are less desired by parents will wind up with a large proportion of their
licensed capacity unutilized. Providers with high capacity utilization “have met the
market test,” (i.e., in the language of economists, they have provided services that
parents want to buy). As can be seen in Figure 13 and Figure 27, over the course of our
study, all provider groups (i.e., those participating and not participating in the child care
subsidy program and those located and not located in poverty areas) experienced an
increase in capacity utilization. This reflects the buoyant US economy during the late
1990s. However, providers participating in the child care subsidy program had the
lowest rate of capacity utilization of any of the provider groups we studied, although
capacity utilization increased much more rapidly for CCDF providers (as well as for
providers in poverty neighborhoods) than for other providers. Extra demand for CCDF
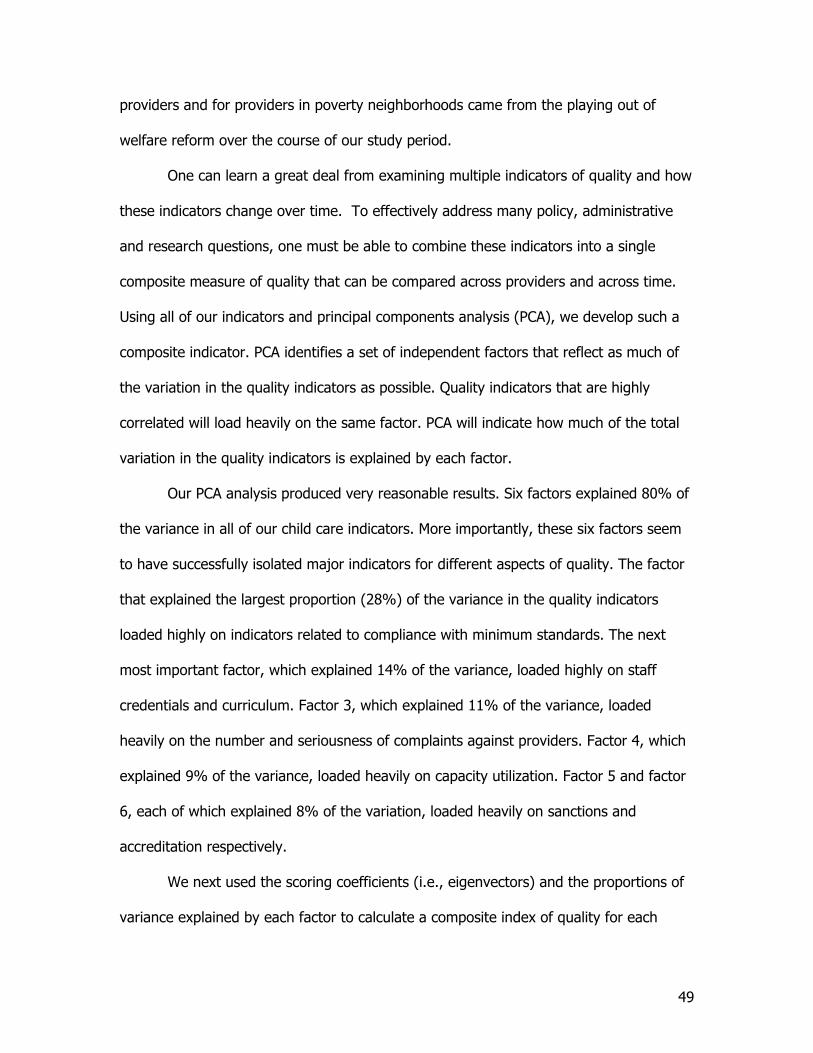
49
providers and for providers in poverty neighborhoods came from the playing out of
welfare reform over the course of our study period.
One can learn a great deal from examining multiple indicators of quality and how
these indicators change over time. To effectively address many policy, administrative
and research questions, one must be able to combine these indicators into a single
composite measure of quality that can be compared across providers and across time.
Using all of our indicators and principal components analysis (PCA), we develop such a
composite indicator. PCA identifies a set of independent factors that reflect as much of
the variation in the quality indicators as possible. Quality indicators that are highly
correlated will load heavily on the same factor. PCA will indicate how much of the total
variation in the quality indicators is explained by each factor.
Our PCA analysis produced very reasonable results. Six factors explained 80% of
the variance in all of our child care indicators. More importantly, these six factors seem
to have successfully isolated major indicators for different aspects of quality. The factor
that explained the largest proportion (28%) of the variance in the quality indicators
loaded highly on indicators related to compliance with minimum standards. The next
most important factor, which explained 14% of the variance, loaded highly on staff
credentials and curriculum. Factor 3, which explained 11% of the variance, loaded
heavily on the number and seriousness of complaints against providers. Factor 4, which
explained 9% of the variance, loaded heavily on capacity utilization. Factor 5 and factor
6, each of which explained 8% of the variation, loaded heavily on sanctions and
accreditation respectively.
We next used the scoring coefficients (i.e., eigenvectors) and the proportions of
variance explained by each factor to calculate a composite index of quality for each

50
provider in each year. Figure 28 contains box plots showing the distribution of these
composite quality scores. The distribution of composite quality scores offers policy,
administrative and research insights. From a policy perspective, composite scores could
be used to classify providers into quality categories (highest quality, high quality,
average quality, low quality and the worst quality) for a quality rating system. From an
administrative perspective, the composite scores allow identification of very low quality
providers that might be improved by concentrated quality interventions. From a research
perspective, composite scores allow us to discern how quality varies both across
providers and across time. Surprisingly, variation in individual provider quality across
time is almost as large as variation of quality across providers. This indicates that
quality evaluation should occur relatively frequently.
Both the time series and cross sectional variation in the composite quality scores
can be used to evaluate the impact of quality interventions. For example, as can be seen
in Figure 28, the median quality score for CCDF providers increased during our study
period, and the number of CCDF providers with exceedingly low quality scores declined.
Such trends were not apparent for providers that did not participate in the child care
subsidy program during our study period. We believe that these time series and cross
sectional differences reflect the transfer of administration of the subsidy program to a
local group and that group’s strong commitment to quality care and to preparing
subsidized children for school.
One commonly used measure of quality missing from the indicators that we used
to create the above composite index is an observational measure of the nature of
interaction between teachers and children in the classroom. Fortunately, such a measure
was available to us for subsidized providers. The instruments used for the prescribed

51
twice yearly classroom observations by the child care subsidy program were developed
on the basis of the most commonly used observational measures, such as the
Infant/Toddler Environment Rating Scale (ITERS), the Early Childhood Environment
Rating Scale (ECERS) and the School-Age Care Environment Rating Scale (SACERS). We
added this measure to our quality indicators, carried out a PCA analysis like the one
described above and developed a composite index of quality for subsidized providers
that incorporated classroom observations. The factors for this PCA were like the factors
for the PCA described above. Ratings on classroom interaction loaded heavily on Factor
2. This indicates that the observational measure of classroom interactions is highly
correlated with staff credentials and with the use of a curriculum. The correlation
between the composite quality measure for subsidized providers that contained
observations of classroom quality and the composite quality measure for these
subsidized providers that did not include classroom observations was .98, which is
significant at the .0001 level of statistical significance. This high correlation suggests
that it may not be necessary for the child care subsidy program to frequently conduct
separate classroom observations, in addition to the frequent minimum-standards
observations by inspectors, if minimum-standards reports are routinely reviewed by the
child care subsidy program and if good information is available on the curriculum and
staff credentials of subsidized providers.

52
References
Carneiro, P & Heckman, J. (2003). Human Capital Policy. NBER working paper 9495.
Available at www.nber.org/papers/w9495. Accessed 7/1/2004.
Florida Department of Children and Families, Economic Self-Sufficiency Program
(released October 23, 2003). Welfare Transition Flashpoints: October 2003.
Harman, H. H. (1976). Modern Factor Analysis. Chicago: University of Chicago Press.
Morrison, D.F. (2005). Multivariate Statistical Methods. 4th Ed. U.S: Brooks/Cole.
Queralt, M., Witte, A.D., & Griesinger, , H. (July, 2000). “Championing our children’:
Changes in quality, price, and availability of child care in the welfare reform era.
Working Paper #2000-07. Wellesley, MA: Department of Economics, Wellesley
College. Available online at the Wellesley College Economics Dept Working
Papers website (http://www.wellesley.edu/Economics/wkpapers/index.html)
Queralt, M. and A. Witte (1998b). Influences on Neighborhood Supply of Child Care in
Massachusetts. Social Service Review, 72, 17-46.
Rencher, A. (1998). Multivariate Statistical Inference and Applications. New York: John
Wiley.
U.S. Census Bureau (2003). American Fact Finder. State, County and Census Place
data derived from Population Estimates, 2000 Census of Population and Housing,
and Small Area Income and Poverty Estimates.
U.S. Census Bureau (2003). American Fact Finder. Zipcode level data derived from
Census 2000 Summary File 3 (SF 3), Sample Data.
Vandell, D. L., and Wolfe, B. (May 2000). Child Care Quality: Does It Matter and Does It
Need to be Improved? Washington, DC: U.S. Department of Health and Human
Services, Office of the Assistant Secretary for Planning and Evaluation.