can schools reduce the indigenous test score gap? evidence...
TRANSCRIPT
Can Schools Reduce the Indigenous TestScore Gap? Evidence from Chile
PATRICK J. MCEWANWellesley College, USA
Final version received March 2007
ABSTRACT In Chile, indigenous students obtain lower test scores, on average, than non-indigenous students. Between two cohorts of eighth-graders in the late 1990s, the test score gapdeclined by 0.1 to 0.2 standard deviations. An Oaxaca decomposition and related descriptiveevidence suggest that the most plausible explanation is related to Chile’s large-scale schoolreforms that were targeted at low-achieving schools and students. The paper evaluates and rulesout alternate explanations such as relative improvements in indigenous socioeconomic status, andsorting of indigenous students between schools. The results highlight a potential lever for reducingearnings gaps between indigenous and nonindigenous adults.
I. Introduction
In 2002, almost 700,000 Chileans – 5 per cent of the population – identified themselvesas indigenous. The majority of this group is Mapuche, one of the largest indigenousgroups in South America (Grinevald, 1998; McEwan, 2004; Layton and Patrinos,2006). A small literature documents that indigenous children in Chile perform worsethan non-indigenous children on tests of academic achievement, with mean test scoresthat are approximately half a standard deviation lower (Herrera Lara, 1999;McEwan,2004). Larger literature documents mean test score gaps between indigenous and non-indigenous students in primary schools throughout the western hemisphere.1
The causes of these gaps, particularly those related to primary schools, haveimportant policy implications. Empirical evidence suggests that one-quarter ofChile’s mean gap is explained by differences in the mean income and schooling ofindigenous and non-indigenous parents (McEwan, 2004). However, more than halfis explained by the differences in the quality of schools that are attended byindigenous and non-indigenous children. The remaining portion of the gap persistswithin schools, even among children with similar family characteristics.2 In sum,cross-sectional evidence suggests that Chilean schools play some role in perpetuatingthe indigenous test score gap.
Correspondence Address: Patrick J. McEwan, Wellesley College, Department of Economics, 106 Central
Street, Wellesley MA 02481, USA. Email: [email protected]
Journal of Development Studies,Vol. 44, No. 10, 1506–1530, November 2008
ISSN 0022-0388 Print/1743-9140 Online/08/101506-25 ª 2008 Taylor & Francis
DOI: 10.1080/00220380802265223
Downloaded By: [Wellesley College] At: 15:38 24 November 2008

Since the resumption of democracy in 1990, education policy in Chilehas emphasised direct investments in education quality by the Ministry ofEducation, often targeted at poor and low-achieving students (Cox, 1997, 2004;Delannoy, 2000; Garcia-Huidobro, 2000).3 There is surprisingly little evidenceon whether such programmes caused test scores to improve, and whetherinequality declined as a result. Evaluations have found that some programmes,including investments in remedial tutoring and a lengthened school day, weresuccessful in increasing mean school test scores (Chay et al., 2005; Valenzuela,2005).
This paper bridges the two literatures, arguing that some primary school reformscontributed to a reduction of the indigenous test score gap across two cohorts ofChilean eighth graders in the late 1990s. The paper first confirms that indigenousstudents have lower mean test scores – by 0.4 to 0.5 standard deviations – than non-indigenous students in the 1997 cohort of eighth graders. In the 2000 cohort of eighthgraders, the mean test score gap between indigenous and non-indigenous eighthgraders declines by 0.2 standard deviations in Spanish, and 0.1 standard deviationsin mathematics. There are two general explanations for the declining test score gapacross cohorts.4
One possibility is that successive cohorts of indigenous families have experiencedrelative improvements in variables, like income or parental schooling, that affectchildren’s test scores. While it is true that indigenous families have, on average, lowerlevels of income and parental schooling, these gaps did not change between 1997 and2000. Using a decomposition procedure based on Cook and Evans (2000), the paperconfirms that changing endowments of observed family variables cannot explain adeclining mean test score gap.
In fact, the largest portion of the decline occurred within primary schools,among students with similar family characteristics, and the remaining balanceoccurred between primary schools. A range of explanations for this result isreviewed. The most plausible is related to the targeting and timing of Chile’slarge-scale school reforms that began in 1990 and rapidly expanded throughoutthe decade.5 Some reforms were targeted towards poor and low-achieving schools.Even within such schools, relatively low-achieving students were more likely toparticipate in some programmes or may have reaped greater benefits fromparticipating than higher-achieving children. The paper shows that, in 1997,indigenous students were more likely than non-indigenous students to attend aschool treated by such reforms. By 2000, however, indigenous students were evenmore likely to have been exposed to such reforms. This divergence in the relativeexposure of each group to school reform provides a plausible explanation fordeclining test score gaps. The conclusions discuss the broader policy implicationsfor reducing inequality between indigenous and non-indigenous adults.
II. The Indigenous Population in Chile
Population Size and Distribution
The 2002 population census asked individuals to indicate whether they belong to oneof eight indigenous groups.6 Overall, 692,192 identified themselves as indigenous,
Can Schools Reduce the Indigenous Test Score Gap? Evidence from Chile 1507
Downloaded By: [Wellesley College] At: 15:38 24 November 2008

constituting 4.6 per cent of Chile’s population. The vast majority identifiedthemselves as Mapuche (87%), with the rest predominantly Aymara (7%) andAtacameno (3%). This population is not evenly dispersed throughout Chile’s 13regional territories (regions 1–12 are arrayed from north to south, while region 13is dominated by Santiago and located in the centre of the country). The Mapuchepopulation is concentrated in the southern region 9, and the country’s capital inregion 13, the latter due to migration.7 In region 9, the epicenter of Mapucheculture, 24 per cent identify themselves as such, representing 29 per cent of thenational Mapuche population. A smaller percentage (3%) identify themselves asMapuche in region 13, but they account for 28 per cent of the nationwidepopulation.Other data confirm these patterns, with one exception.8 In the 1992 census,
998,385 Chileans – 10 per cent of the population – identified themselves asindigenous (INE, 1993; McEwan, 2004).9 The sources of this dramatic disagreementappear related to the much broader wording of the census question applied in 1992,suggesting that this paper’s estimates estimate a lower bound to the truepopulation.10
In other Latin American countries such as Bolivia and Guatemala, it is commonto employ self-reported language competence as an additional indicator ofindigenous status (McEwan, 2004; Layton and Patrinos, 2006; McEwan andTrowbridge, 2007). In Chile, the largest native language is Mapudungu, spoken bysome Mapuche. It is cited by sociolinguists as one of the four largest native languagegroups in South America, with up to half a million speakers (see Grinevald, 1998 andthe citations therein). Even so, these estimates are guesswork, and newer dataindicate that the number may be substantially lower than surmised. The 2003CASEN household survey included an additional question on self-reported languageability. Of the almost 700,000 that self-identify as indigenous, only 16 per cent reportspeaking and understanding an indigenous language, and 14 per cent report justunderstanding.11 The endangered status of Mapudungu, though not the topic of thispaper, is discussed further in a later section.
Population in Schools
The indigenous population in the eighth grade is estimated with parent datacollected in 1997 and 2000. Specifically, parent questionnaires ask whether astudent’s mother identifies herself as indigenous.12 Overall, 5.1 per cent and 4.6per cent of eighth graders have indigenous mothers in 1997 and 2000,respectively. Thus, the proportions in school are generally similar to those inthe overall population.In comparing the achievement of indigenous and non-indigenous students, a
pitfall is sample selection. Suppose that indigenous students are less likely to enterschool or complete primary school, and that non-attendees are lower-achieving, onaverage.13 This would tend to understate the overall test score gap betweenindigenous and non-indigenous children, particularly in the upper grades. In fact,sample selection is not a primary concern in Chilean primary schools. In Chile, over98 per cent of children ages seven to 13 – whether indigenous or non-indigenous –attend primary school, defined as grades 1–8.14
1508 P.J. McEwan
Downloaded By: [Wellesley College] At: 15:38 24 November 2008
III. Education Reform in the 1990s
In the 1980s, Chile’s authoritarian government emphasised the decentralisation andprivatisation of schooling.15 In the 1990s, the democratic government initiated newprogrammes and reforms that were centrally financed and managed (Cox, 1997,2004; Delannoy, 2000; Garcia-Huidobro, 2000). The following paragraphs describethree, in order of their implementation: (1) the 900 Schools Programme, or P-900; (2)the MECE programme (Equity and Quality Improvement in Education); and (3) theFull School Day reform.
P-900 was first implemented in the 1990 school year. The Ministry ranked primaryschools according to their average test scores in 1988, and assigned a package ofinterventions to schools with 1988 scores that fell below region-specific eligibility cut-offs (Chay et al., 2005). The programme was applied in grades 1–4, and includedminor infrastructure, instructional materials such as textbooks, in-service training forteachers in language and mathematics instruction, and intensive tutoring workshopsfor low-achieving children within the school. Some schools ‘graduated’ from P-900,typically after three years, while others were added throughout the decade, basedupon test score performance and the subjective decisions of administrators.
In the 1992 school year, the Ministry initiated the MECE programme in primaryschools. MECE contained multiple subcomponents, some available to all primaryschools and some targeted according to various criteria. First, it distributed a widerange of instructional materials and infrastructure to all publicly-funded schools,including textbooks, classroom libraries, and computers. Second, the Ministryaccepted applications for a diverse array of ‘school improvement projects’ fromprimary schools. It funded a portion of them with one-time grants, based upon theassessed potential of projects to contribute to student learning. Third, a componentdubbed MECE-Rural provided special assistance to publicly-funded primary schoolswith only one or two teachers.
The third major reform, first implemented in the 1997 school year, subsidised anextended school day in publicly-funded schools. In grades three to six, annualinstructional hours were increased by 232 hours, and, in grades seven and eight, by145 hours (Cox, 2004). The reform was nominally available to all publicly-fundedschools. In practice, it expanded first in schools that did not face a bindinginfrastructure constraint, since many schools were forced to move from a two-shiftschedule to a single, longer shift. Many of the initial schools to participate werepublic schools, and those in rural areas (Raczynski et al., 2001; Valenzuela, 2005).
During this period, there were few special accommodations for indigenouspopulations, and indigenous self-identification was not used to target reforms.Herrera Lara (1999) notes that many rural Mapuche schools in southern regions, byvirtue of their location and poverty, ended up participating in P-900 and MECE-Rural, and that some efforts were made to teach Spanish as a second language in P-900 schools. In the late 1990s, a specific programme of bilingual, interculturaleducation was started, but it was limited to small pilot initiatives carried out byregional universities (Gacitua-Mario, 2002; Ministerio de Educacion, 2005). Theprogramme remained small in its coverage and its budget – especially compared toMECE – and it was only established as a national programme after 2000, the lastyear of data analysed in this paper (Ministerio de Educacion, 2005).
Can Schools Reduce the Indigenous Test Score Gap? Evidence from Chile 1509
Downloaded By: [Wellesley College] At: 15:38 24 November 2008

IV. Data
Sample
Chile has administered a national census of student achievement (SIMCE) since1988, with a different grade assessed in each year. For two reasons, this paperemploys data from separate surveys of eighth grade cohorts in 1997 and 2000. First,detailed student-level data, including responses to parent surveys, are only availablebeginning in 1997.16 Second, parents were asked to identify themselves as indigenousin these years, but not in later years. For example, fourth-grade surveys wereadministered in 1999 and 2002, but an indigenous variable is only available in1999.17
The sample size in the original data files for 1997 and 2000 is 228,289 and 242,532,respectively, including all students with at least one test score in Spanish language ormathematics. Students were excluded if their parent did not report indigenous status,leading to the working sample sizes described in Table A1 (sample sizes are differentacross some variables because of missing observations for background variables).
Variables
The key dependent variables are test scores in Spanish language and mathematics.The test scores are standardised, within each subject and year, to a mean of zero anda standard deviation of one. Table A1 reports the descriptive statistics within eachyear. Family variables are derived from parent questionnaires. The essential variableis Indigenous, equal to one if a student’s mother identifies herself as indigenous andzero otherwise. Other background variables include continuous measures of eachparent’s schooling (Mother’s schooling and Father’s schooling), and dummy variablesindicating gender (Female) and four categories of monthly household income,measured in Chilean pesos.18
The data include a limited number of school variables. The percentage ofindigenous students in each school is simply the school-level mean of Indigenous.Average class size is derived from administrative enrolment records. It is the totalnumber of students enrolled in grades one to eight, divided by the total number ofclassroom sections. Finally, three dummy variables indicate three categories ofpublic and private schools. Public schools are managed by more than 300municipalities, but nationally-funded with per-student subsidies. Private subsidisedschools are privately-managed, but receive similar per-student subsidies. Finally,Private tuition schools are privately-managed and receive no public funding.
V. Evidence of Declines in the Test Score Gap
Table 1 (panel A) describes the basic facts regarding mean test score gaps betweenindigenous and non-indigenous students. In the 1997 cohort of eighth graders, thereare large and statistically significant gaps of70.48 and70.41 standard deviations inSpanish and mathematics, respectively.19 In the 2000 cohort of eighth graders, theSpanish and mathematics gaps decline to 70.30 and 70.32, respectively, alsostatistically significant. Overall, the mean difference between indigenous and non-indigenous test scores declines, between the two cohorts, by 0.18 standard deviations
1510 P.J. McEwan
Downloaded By: [Wellesley College] At: 15:38 24 November 2008

Table
1.Variable
means,byindigenousstatusandyear
1997SIM
CE
2000SIM
CE
Difference-in-
differences
Non-
indigenous
Indigenous
Difference
Non-
indigenous
Indigenous
Difference
Panel
A:Testscores
Spanishtest
score
0.025
70.457
70.482**
0.014
70.284
70.298**
0.184**
Mathem
atics
test
score
0.021
70.391
70.412**
0.015
70.310
70.324**
0.087**
Panel
B:Studentand
familyvariables
Fem
ale
0.517
0.502
70.016*
0.507
0.498
70.009
0.007
Mother’sschooling
9.814
7.421
72.392**
10.210
7.761
72.449**
70.056
Father’sschooling
10.242
7.856
72.386**
10.737
8.312
72.425**
70.039
Monthly
income
5100,000pesos
0.270
0.482
0.212**
0.286
0.514
0.228**
0.016
100,000–200,000pesos
0.320
0.316
70.003
0.337
0.317
70.020**
70.017
200,000–300,000pesos
0.150
0.098
70.052**
0.134
0.081
70.053**
70.001
4300,000pesos
0.260
0.104
70.156**
0.243
0.088
70.155**
0.001
Panel
C:Schoolvariables
%indigenousin
school
0.042
0.217
0.174**
0.037
0.234
0.197**
0.023
Averageclass
size
35.413
33.397
72.016**
35.844
33.194
72.650**
70.633*
Publicschool
0.572
0.694
0.122**
0.558
0.650
0.092**
70.030
Private
subsidised
school
0.335
0.296
70.039**
0.355
0.337
70.018
0.021
Private
paid
school
0.094
0.010
70.084**
0.087
0.013
70.074**
0.010
Notes:**and*indicate
statisticalsignificance
at1per
centand5per
cent,respectively.See
Table
A1forsample
sizesin
each
year.See
textfor
detailsofhypothesistests.
Can Schools Reduce the Indigenous Test Score Gap? Evidence from Chile 1511
Downloaded By: [Wellesley College] At: 15:38 24 November 2008

in Spanish and 0.09 in mathematics. Both difference-in-differences estimates arestatistically significant at one per cent.20
Whether the declines are economically significant is a more arbitrary judgment,although magnitudes are comparable to impact estimates of other educationinterventions in Chile. Quasi-experimental evaluations of the P-900 programme andthe Full School Day programme report effect sizes of 0.1 to 0.2 standard deviations(Chay et al., 2005; Valenzuela, 2005). This paper’s regression estimates, reportedbelow, will suggest that increasing the mother’s schooling by one standard deviationis associated with test score increases of around 0.1 standard deviation.The prior estimates refer to differences in means, though test score gaps may be
more or less evident at different points in the test score distribution.21 Table 2reports – in addition to mean differences between indigenous and non-indigenoustest scores – the differences in each group’s test scores at several percentiles of therespective test score distributions. The results suggest that test score gaps tend toincrease at higher percentiles (except, in 1997, at the 90th). For Spanish test scores,the magnitude of declines in the gap is mostly stable across reported percentiles. Formathematics test scores, the magnitude of declines is largest at the 50th and 75thpercentiles (though gaps decline at all percentiles).Before attempting to explain the sources of declines in test score gaps, a caveat to
the subsequent analysis is highlighted. The testing instruments applied in 1997 and2000 are not composed of the same items. Because the difficulty of the tests couldchange across time, changes in the full sample means across years cannot beinterpreted as aggregate changes in the achievement of eighth graders, and this paperdoes not attempt to do so. Similarly, it is not possible to determine whether changesin test score gaps are due to increased achievement among indigenous students,decreased achievement among non-indigenous students, or some combinationthereof.As a reasonable alternative, the author analyses how the relative test scores of
indigenous and non-indigenous students – gauged by mean differences in z-scores –
Table 2. Indigenous test score gaps at various percentiles
Spanish Mathematics
DifferenceDifference-in-differences
DifferenceDifference-in-differences1997 2000 1997 2000
Percentile10 70.38 70.15 0.22 70.26 70.23 0.0325 70.47 70.25 0.22 70.34 70.31 0.0350 70.56 70.34 0.22 70.52 70.34 0.1775 70.56 70.37 0.19 70.60 70.38 0.2390 70.38 70.39 70.02 70.43 70.40 0.03Mean 70.48 70.30 0.18 70.41 70.32 0.09
Note: The difference columns report, for each test score and year, the difference between agiven percentile of the indigenous sample and the same percentile of the nonindigenoussample.
1512 P.J. McEwan
Downloaded By: [Wellesley College] At: 15:38 24 November 2008
change over time. For this approach to be reasonable, it must be assumed that the2000 test did not become relatively easier (or more difficult) for indigenousstudents. If it did, then declining test score gaps could be an artifact of testconstruction. A similar assumption is invoked in recent literature that comparesblack-white test score gaps in the US using non-equivalent tests (Hedges andNowell, 1998, 1999), or analyses a longer panel of school-level mean test scores inChile (Hsieh and Urquiola, 2006). The assumption is bolstered in this study’s databy the apparent duplication of some testing items across the 1997 and 2000 tests.22
Unfortunately, the assumption cannot be further validated without item-level datafrom the Chilean tests (which are not generally available to researchers), and socaution is warranted in assessing the following results, barring additionalpsychometric research.
VI. Explaining Declines in the Test Score Gap
Families or Schools?
There are two broad explanations for declines in the indigenous test score gap. Thefirst is that indigenous families – though possessing smaller endowments of variablesthat improve test scores – narrowed this disadvantage between 1997 and 2000. Topartly explore this hypothesis, Table 1 (panel B) compares non-indigenous andindigenous means of family variables. As with test scores, there are large andstatistically significant gaps within each cross-section. In 1997, for example, the meanschooling of non-indigenous mothers and fathers is more than two years higher. Inthe same year, 27 per cent of non-indigenous families had monthly incomes below100,000 pesos (expressed in nominal terms), compared with 46 per cent of indigenousfamilies.
The substantial gaps may explain a portion of the gap within cross-sections, ifthese variables explain test scores. However, there is little change in the gaps between1997 and 2000, and the difference-in-differences estimates for each family variableare not statistically distinguishable from zero. This suggests that declines in the testscore gap will not be easily explained by shrinking gaps in observed socioeconomicstatus.
The second broad explanation for declines in the test score gap is thatindigenous students experienced relative gains in schooling quality, compared tonon-indigenous students. Table 1 (panel C) summarises the evidence on the fewschool characteristics reported in the data. In 1997, the average indigenousstudent attended a school in which 22 per cent of the other students wereindigenous, while the average non-indigenous student attended a school with 4per cent. This gap increased slightly in 2000 but the difference-in-differences is notstatistically different from zero, suggesting that segregation by indigenous statushas remained relatively stable.
Within each year, indigenous students attend schools with smaller than averageclass sizes, mainly because of schools disproportionate location in rural areas withfew classrooms and smaller enrolments. Between 1997 and 2000, the gap expandedby less than one student. However, a recent quasi-experimental estimate of the effectof class size reduction on test scores in Chile suggests that such a change would
Can Schools Reduce the Indigenous Test Score Gap? Evidence from Chile 1513
Downloaded By: [Wellesley College] At: 15:38 24 November 2008
improve test scores by less than 0.01 standard deviations (McEwan and Urquiola,2005).Finally, indigenous students are less likely to attend private schools in both
years, particularly private tuition-paying schools. However, the change in the gapbetween 1997 and 2000 is not statistically significant, suggesting that movementsbetween the public and private sectors play a small role, if any, in explainingdeclines in the test score gap. In summary, the descriptive evidence does notsuggest that declines in the mean test score gap are the result of either convergencein observed family variables that influence test scores, or in the relatively narrowset of observed school variables.
Empirical Approach
The empirical approach is based upon the Oaxaca decomposition, commonly used toassess the determinants of mean wage gaps between two groups (Oaxaca, 1973).23
Cook and Evans (2000) applied a variant of the method, also used in this paper, toblack-white test score convergence in the US.24 It must address two challengespresented by the Chilean data.First, there are only a few school variables available, described in the last
section. Second, it is likely that regression-based estimates of such variables’ effectson test scores – even when controlling for family variables – will be biased byomitted variables. To provide one of the most common examples, it is likely thatprivate school attendance is correlated with unobserved family variables such aswealth or parental behaviours. If omitted variables are also correlated with testscores, then the effect of private schools will be biased in ordinary least squares(OLS) regressions. This simple concern has spurred a large empirical literature inthe US and Chile (Levin, 1998; McEwan, 2000, 2001). Similarly, other research onChile has raised concerns about omitted variables bias in ordinary least squaresestimates of the test score effects of class size reduction (McEwan and Urquiola,2005), peer-effects (McEwan, 2003) and school reforms (Chay et al., 2005;Valenzuela, 2005).One way of diminishing such concerns is to control for school fixed effects,
facilitated by the availability of multiple student observations, both indigenous andnon-indigenous, within schools. It begins with the estimation of OLS regressionswithin each year’s sample (indicated by superscripts), as in:
T 97ij ¼ b970 þ b971 Indigenous97ij þ b972 X 97
ij þ m97j þ e97ij ð1Þ
The test score (T) of student i in school j is regressed on the dummy variableIndigenous and a vector of family-variables (X) including parental schooling andhousehold income.25 The b’s are coefficients to be estimated, and each school isallowed to have a separate intercept via a series of fixed effects (m). Finally, e is amean-zero error term. The standard errors are adjusted for arbitrary forms ofheteroskedasticity and within-school clustering (Wooldridge, 2002).The main advantage of the specification is that fixed effects control for all
variables, observed and unobserved, that are constant across schools (though itprevents the estimation of separate coefficients for available school variables). Given
1514 P.J. McEwan
Downloaded By: [Wellesley College] At: 15:38 24 November 2008
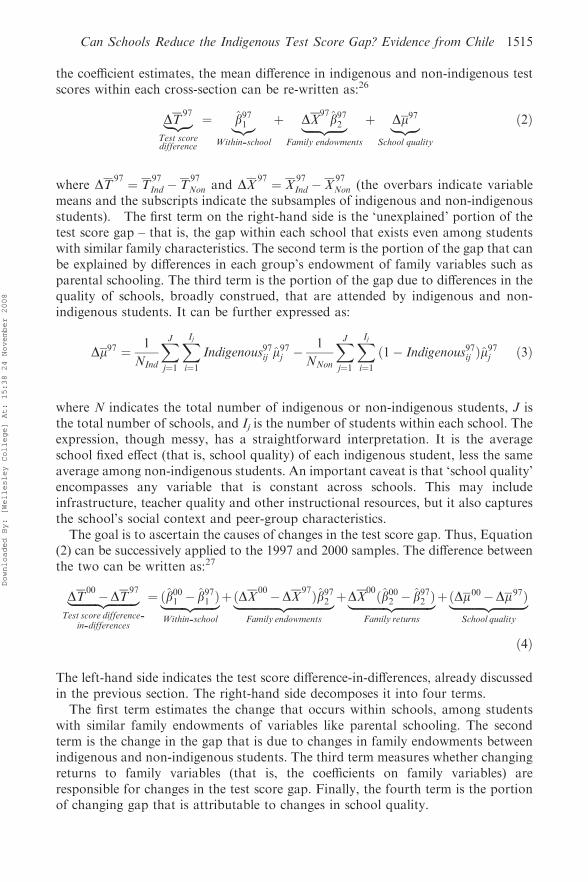
the coefficient estimates, the mean difference in indigenous and non-indigenous testscores within each cross-section can be re-written as:26
DT97
|ffl{zffl}Test scoredifference
¼ b971|{z}Within-school
þ DX97b972|fflfflfflffl{zfflfflfflffl}
Family endowments
þ Dm97|ffl{zffl}School quality
ð2Þ
where DT97 ¼ T
97
Ind � T97
Non and DX97 ¼ X
97
Ind � X97
Non (the overbars indicate variablemeans and the subscripts indicate the subsamples of indigenous and non-indigenousstudents). The first term on the right-hand side is the ‘unexplained’ portion of thetest score gap – that is, the gap within each school that exists even among studentswith similar family characteristics. The second term is the portion of the gap that canbe explained by differences in each group’s endowment of family variables such asparental schooling. The third term is the portion of the gap due to differences in thequality of schools, broadly construed, that are attended by indigenous and non-indigenous students. It can be further expressed as:
Dm97 ¼ 1
NInd
XJ
j¼1
XIj
i¼1Indigenous97ij m
97j �
1
NNon
XJ
j¼1
XIj
i¼1ð1� Indigenous97ij Þm
97j ð3Þ
where N indicates the total number of indigenous or non-indigenous students, J isthe total number of schools, and Ij is the number of students within each school. Theexpression, though messy, has a straightforward interpretation. It is the averageschool fixed effect (that is, school quality) of each indigenous student, less the sameaverage among non-indigenous students. An important caveat is that ‘school quality’encompasses any variable that is constant across schools. This may includeinfrastructure, teacher quality and other instructional resources, but it also capturesthe school’s social context and peer-group characteristics.
The goal is to ascertain the causes of changes in the test score gap. Thus, Equation(2) can be successively applied to the 1997 and 2000 samples. The difference betweenthe two can be written as:27
DT00�DT
97
|fflfflfflfflfflfflfflfflffl{zfflfflfflfflfflfflfflfflffl}Test score difference-
in-differences
¼ ðb001 � b971 Þ|fflfflfflfflfflfflffl{zfflfflfflfflfflfflffl}Within-school
þðDX00�DX97Þb972|fflfflfflfflfflfflfflfflfflfflfflfflfflffl{zfflfflfflfflfflfflfflfflfflfflfflfflfflffl}
Family endowments
þDX00ðb002 � b972 Þ|fflfflfflfflfflfflfflfflfflfflfflffl{zfflfflfflfflfflfflfflfflfflfflfflffl}Family returns
þðDm00�Dm97Þ|fflfflfflfflfflfflfflfflfflffl{zfflfflfflfflfflfflfflfflfflffl}School quality
ð4Þ
The left-hand side indicates the test score difference-in-differences, already discussedin the previous section. The right-hand side decomposes it into four terms.
The first term estimates the change that occurs within schools, among studentswith similar family endowments of variables like parental schooling. The secondterm is the change in the gap that is due to changes in family endowments betweenindigenous and non-indigenous students. The third term measures whether changingreturns to family variables (that is, the coefficients on family variables) areresponsible for changes in the test score gap. Finally, the fourth term is the portionof changing gap that is attributable to changes in school quality.
Can Schools Reduce the Indigenous Test Score Gap? Evidence from Chile 1515
Downloaded By: [Wellesley College] At: 15:38 24 November 2008

Regression Results
Table 3 reports estimates of Equation (1) for Spanish andmathematics test scores. Theodd columns control only for Indigenous, and the coefficients replicate the previousresults for test score gaps in 1997 and 2000. The regressions in even columns addcontrols for family variables and school fixed effects. The coefficients are consistentwith previous analyses of student-level Chilean data (McEwan, 2001, 2003, 2004).There are large gender gaps in Spanish test scores of almost 0.2 standard deviations,favouring female students. Male students score higher, by a smaller margin, inmathematics. Parental schooling, especially of mothers, is strongly related to testscores. In 1997, for example, a one standard deviation increase in mother’s schooling(3.8 years) increases Spanish test scores by 0.1 standard deviations. Relative to thelowest category of monthly household income, higher incomes are correlated withhigher test scores. The causal interpretation of these coefficients is uncertain. Rather,the author anticipates that they are correlated with a broad range of unobservedindicators of the quantity and quality of educational inputs available in the home.The coefficient on Indigenous is of particular interest. The inclusion of controls
causes the coefficient estimates to decline substantially, suggesting that groupdifferences in the endowments of family or school variables ‘explain’ the test scoregap. Even so, the estimates in the 1997 sample suggest that a gap of almost 0.1standard deviations persists within schools, even among observably similar students.By 2000, in contrast, estimates of the within-school gap are close to zero, or evenpositive. The counter-intuitive positive coefficient suggests that mean test score gapswithin schools, among observationally similar children, have been reversed. Theexplanations of the result are explored at greater length in the following sections.
Decomposition Results
Table 4 reports the results of the decomposition exercise for Spanish (panel A) andmathematics (panel B).28 The left-most columns report the decomposition within the1997 sample, based upon Equation (2).29 Approximately one-quarter of the 1997 testscore gaps can be explained by the different endowments of family variables acrossindigenous and non-indigenous students. A larger percentage, 55–60 per cent isexplained by differing school quality. And, as noted above, the balance of the gappersists within schools among observably similar students.The main objective, however, is not to decompose gaps within years, but to
understand what caused the decline of the gap between 1997 and 2000. Thus, theright-most columns report the decomposition of the test score difference-in-differences in each subject, based upon Equation (4). Overall, the gap declines by0.18 standard deviations in Spanish, and 0.09 in mathematics. The decompositionsuggests that very little of this change is explained by changing endowments offamily variables, consistent with previous descriptive evidence. Similarly, it cannotbe easily explained by changes in the returns to family variables between years. In thecase of mathematics, it even appears that changing returns to family characteristicsexplain an increase in the gap.The largest portion of the decline in the test score gap occurred within primary
schools, among students with similar endowments of family variables. In Spanish,
1516 P.J. McEwan
Downloaded By: [Wellesley College] At: 15:38 24 November 2008

Table
3.Eighth-graderegressions
Dependentvariable:Spanishtest
score
Dependentvariable:Mathem
atics
test
score
1997SIM
CE
2000SIM
CE
1997SIM
CE
2000SIM
CE
(1)
(2)
(3)
(4)
(5)
(6)
(7)
(8)
Indigenous
70.482**
70.098**
70.298**
0.023*
70.412**
70.075**
70.324**
0.012
(0.017)
(0.010)
(0.016)
(0.011)
(0.016)
(0.010)
(0.017)
(0.011)
Fem
ale
–0.172**
–0.190**
–7
0.066**
–70.098**
(0.005)
(0.005)
(0.005)
(0.005)
Mother’sschooling
–0.027**
–0.023**
–0.021**
–0.020**
(0.001)
(0.001)
(0.001)
(0.001)
Father’sschooling
–0.014**
–0.017**
–0.011**
–0.016**
(0.001)
(0.001)
(0.001)
(0.001)
100,000–200,000pesos
–0.077**
–0.102**
–0.039**
–0.094**
(0.006)
(0.005)
(0.006)
(0.005)
200,000–300,000pesos
–0.103**
–0.137**
–0.058**
–0.134**
(0.008)
(0.008)
(0.007)
(0.007)
4300,000pesos
–0.070**
–0.152**
–0.050**
–0.155**
(0.008)
(0.008)
(0.008)
(0.008)
Schoolfixed
effects?
No
Yes
No
Yes
No
Yes
No
Yes
Adjusted
R2
Number
ofstudents
189,119
189,119
188,177
188,177
189,599
189,599
188,177
188,177
Notes:**and*indicate
statisticalsignificance
at1per
centand5per
cent,respectively.Standard
errors,adjusted
forwithin-schoolclustering,are
inparentheses.In
additionto
thelisted
variables,
allregressionsincludeaconstant.
Regressionsin
even
columnsincludedummyvariablesthat
indicate
missingvalues
ofFem
ale,Mother’sschooling,Father’sschooling,andMonthly
income.
Can Schools Reduce the Indigenous Test Score Gap? Evidence from Chile 1517
Downloaded By: [Wellesley College] At: 15:38 24 November 2008

65 per cent of the change occurred within schools and, in mathematics, it was 100 percent (countervailed by the negative term on family returns). In each case, schoolquality also contributed to declines, but less so: 37 per cent in Spanish and 25 percent in mathematics.To summarise, the evidence suggests that convergence in endowments of family
variables, at least those observed in the SIMCE data, plays little role in the declininggap. Instead, the declines occur mainly within schools among similar students or, toa lesser extent, between schools because of changes in school quality.
VII. Did School Reform Reduce the Test Score Gap?
School reform might have affected the indigenous test score gap in two ways. First, itis possible that reforms were disproportionately targeted to schools that enrollindigenous students, and that this difference grew between the 1997 and 2000cohorts. If school reform has a positive and homogenous causal effect on allstudents’ test scores, then test score convergence would be reflected in the schoolquality component of the previous decomposition.Yet, an even larger portion of test score convergence occurred within schools. For
this to be the product of school reform, it must be the case that additional resourceswere either expressly targeted to indigenous students within schools, or that exposureto equivalent interventions had disproportionately large effects on the test scores ofindigenous students.30 The next two sections assess the likelihood of each possibility,focusing upon P-900 and the Full School Day, the two school reforms with thelargest evidence base.
Differential Exposure to Reform Between Schools
The 1997 cohort of eighth graders – this study’s baseline – entered the first grade in1990, while the 2000 cohort entered the first grade in 1993 (see Table 5).31 P-900began in 1990, and was targeted at grades one to four within participating schools.
Table 4. Decomposition results
1997 SIMCE 2000 SIMCE Difference
Panel A: Spanish test scoreRaw difference 70.48 100% 70.30 100% 0.18 100%Family variablesEndowments 70.12 25% 70.13 42% 0.01 4%Coefficients 70.01 76%
Within-school 70.10 20% 0.02 78% 0.12 65%School quality 70.26 55% 70.19 65% 0.07 37%
Panel B: Math test scoreRaw difference 70.41 100% 70.32 100% 0.09 100%Family variablesEndowments 70.09 22% 70.11 35% 0.00 6%Coefficients 70.03 730%
Within-school 70.08 18% 0.01 74% 0.09 100%School quality 70.25 60% 70.22 69% 0.02 25%
1518 P.J. McEwan
Downloaded By: [Wellesley College] At: 15:38 24 November 2008
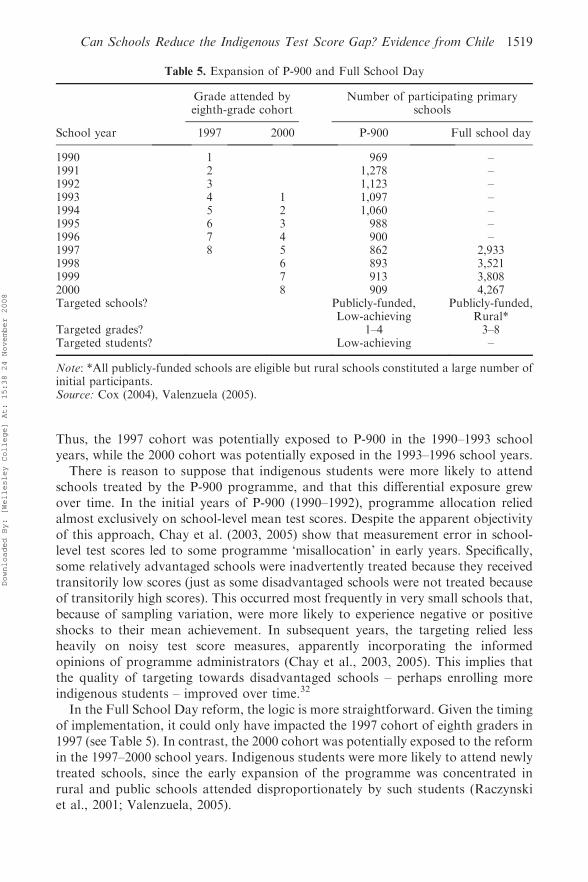
Thus, the 1997 cohort was potentially exposed to P-900 in the 1990–1993 schoolyears, while the 2000 cohort was potentially exposed in the 1993–1996 school years.
There is reason to suppose that indigenous students were more likely to attendschools treated by the P-900 programme, and that this differential exposure grewover time. In the initial years of P-900 (1990–1992), programme allocation reliedalmost exclusively on school-level mean test scores. Despite the apparent objectivityof this approach, Chay et al. (2003, 2005) show that measurement error in school-level test scores led to some programme ‘misallocation’ in early years. Specifically,some relatively advantaged schools were inadvertently treated because they receivedtransitorily low scores (just as some disadvantaged schools were not treated becauseof transitorily high scores). This occurred most frequently in very small schools that,because of sampling variation, were more likely to experience negative or positiveshocks to their mean achievement. In subsequent years, the targeting relied lessheavily on noisy test score measures, apparently incorporating the informedopinions of programme administrators (Chay et al., 2003, 2005). This implies thatthe quality of targeting towards disadvantaged schools – perhaps enrolling moreindigenous students – improved over time.32
In the Full School Day reform, the logic is more straightforward. Given the timingof implementation, it could only have impacted the 1997 cohort of eighth graders in1997 (see Table 5). In contrast, the 2000 cohort was potentially exposed to the reformin the 1997–2000 school years. Indigenous students were more likely to attend newlytreated schools, since the early expansion of the programme was concentrated inrural and public schools attended disproportionately by such students (Raczynskiet al., 2001; Valenzuela, 2005).
Table 5. Expansion of P-900 and Full School Day
School year
Grade attended byeighth-grade cohort
Number of participating primaryschools
1997 2000 P-900 Full school day
1990 1 969 –1991 2 1,278 –1992 3 1,123 –1993 4 1 1,097 –1994 5 2 1,060 –1995 6 3 988 –1996 7 4 900 –1997 8 5 862 2,9331998 6 893 3,5211999 7 913 3,8082000 8 909 4,267Targeted schools? Publicly-funded,
Low-achievingPublicly-funded,
Rural*Targeted grades? 1–4 3–8Targeted students? Low-achieving –
Note: *All publicly-funded schools are eligible but rural schools constituted a large number ofinitial participants.Source: Cox (2004), Valenzuela (2005).
Can Schools Reduce the Indigenous Test Score Gap? Evidence from Chile 1519
Downloaded By: [Wellesley College] At: 15:38 24 November 2008

Notwithstanding these arguments, the changing relative exposure of indigenousstudents to school reform is an empirical question. Thus, the author combined thestudent-level SIMCE data from the 1997 and 2000 cross-sections with administrativerecords from each programme. For each student, a measure of potential exposure toeach reform was constructed. The measures employ two key assumptions, given thelack of detailed panel data on each student’s schooling career. First, it is assumedthat members of each cohort did not repeat grades and entered school ‘on-time’.Second, it was assumed that they attended the same school throughout their primaryschool career. This facilitates the calculation of two variables for each student: (1) adummy variable indicating whether the student’s school participated in at least oneyear of a reform; (2) a variable measuring the total number of years of potentialexposure to school reform.Table 6 reports means of each variable, for each reform, by indigenous status and
year. Of non-indigenous students in the 1997 cross-section, for example, 20 per centattended a school treated by P-900 for at least one year, compared with 36 per cent ofindigenous students, a difference of 16 per cent. It is important to emphasise thatindigenous students were not explicitly targeted. Rather, they were more likely to betreated because they were more likely to attend schools that happened to be treated.This difference is larger in 2000 (22%), again favouring indigenous students. Thedifference-in-differences is positive and statistically significant, suggesting a diver-gence in the potential exposure of indigenous and nonindigenous students to P-900.Similarly, for the Full School Day, only 3 per cent of non-indigenous students
participated in 1997, versus 11 per cent of non-indigenous students, a difference of9 per cent. In the 2000 cohort, the difference grows to 18 per cent, again suggestinga divergence in the potential exposure of indigenous and non-indigenous students.The same pattern is evident when considering the total years of potential exposure toP-900 or the Full School Day reform.Thus, the limited empirical evidence suggests that the potential exposure of
indigenous students to school reform grew over time, relative to non-indigenousstudents. Two quasi-experimental evaluations suggest that exposure to eachprogramme caused improvements in the mean achievement of students attendingtreated schools. Chay et al. (2005) applied a regression-discontinuity approach to theevaluation of P-900. Relying upon the test-score based programme allocationdescribed in section III, it compared the fourth-grade test score gains between 1988–1992 of treated schools just below the eligibility cut-offs, to the gains of untreatedschools just above the cut-off. By the end of 1992, treated schools test score gainswere about 0.2 standard deviations higher.33
In an evaluation of the Full School Day, Valenzuela (2005) compared gains inmean fourth-grade test scores from 1999 and 2002, between treated and untreatedschools. In Spanish, he found effects of 0.1 to 0.2 standard deviations among publicschools, and 0.4 standard deviations among private subsidised schools. Inmathematics, the effects are smaller or not statistically different from zero.
Differential Exposure to Reform Within Schools
The majority of test score convergence occurred within primary schools, amongindigenous and non-indigenous childrenwith similar family characteristics. For school
1520 P.J. McEwan
Downloaded By: [Wellesley College] At: 15:38 24 November 2008

Table
6.Potentialexposure
toschoolreform
,byindigenousstatusandyear
1997SIM
CE
2000SIM
CE
Difference-in-differences
Non-
indigenous
Indigenous
Difference
Non-
indigenous
Indigenous
Difference
Atleast
oneyear:
P-900
0.198
0.356
0.158**
0.229
0.446
0.217**
0.059**
FullSchoolDay
0.025
0.112
0.087**
0.079
0.262
0.183**
0.096**
Number
ofyears:
P-900
0.615
1.145
0.531**
0.629
1.227
0.598**
0.068
FullSchoolDay
0.025
0.112
0.087**
0.209
0.792
0.583**
0.497**
Notes:**(*)indicatesstatisticalsignificance
at1per
cent(5%).See
Table
A1forsamplesizesin
each
year.See
textfordetailsofhypothesistests.
Can Schools Reduce the Indigenous Test Score Gap? Evidence from Chile 1521
Downloaded By: [Wellesley College] At: 15:38 24 November 2008

reform to be responsible, then it must either be the case that indigenous children weredisproportionately targeted within schools, or that an intervention applied to allstudents within a school produced larger test score gains among indigenous students.The most important component of P-900 was explicitly focused on low-achieving
students within schools (Chay et al., 2005). Within participating schools, trainedtutors worked with low-achieving students in grades one to four. The exact criteriaused in student selection are not clearly described, nor are records on individualstudents participation maintained. As with school-level targeting, however, it isplausible that indigenous students were disproportionately targeted if the criteriawere based on achievement or socioeconomic status.In the Full School Day programme, it is unlikely that indigenous students received
more resources than non-indigenous students. However, the quasi-experimentalevaluation suggests that lengthening the school day produced relatively larger testscore gains among schools that enroll disproportionate numbers of disadvantaged andlow-achieving students (Valenzuela, 2005). This evaluation, like others using Chileandata from the early 1990s, relies on data aggregated to the school level and cannotprovide separate estimates for different groups of students. Thus, the case linkingschool reform to within-school declines in the test score gap remains circumstantial.
Alternate Explanations
In light of uncertainties, five alternate explanations for the patterns described in thedecomposition exercise are reviewed. First, declines in the test score gap withinschools could be the result of convergence in unobserved family variables. As aplausible example, the relatively younger cohort of indigenous students in 2000 couldbe less likely to use native languages in the home, and more likely to use Spanish. InBolivia and Guatemala, for example, younger cohorts report declining knowledge ofindigenous languages (McEwan and Jimenez, 2002; Edwards and Winkler, 2004).34
To the extent that this improves (Spanish) test scores over time, it could lead toreductions in test score gaps within schools.Figure 1 reports data on native language ability from Chile’s 2003 CASEN
household survey, self-reported by survey respondents. The sample includes allindividuals that identify themselves as indigenous. Within age group intervals, thefigure reports the proportion of individuals that understand an indigenous language,speak and understand, and neither speak nor understand. The 1997 and 2000 cohortsof eighth graders would fall roughly within the survey cohort age of 16–19 years. Asin other Latin American countries, the oldest cohorts are more likely to speak orunderstand a native language, but approximately half neither speak nor understand.Among the younger cohorts, between 5–24 years old, a fairly steady 80 per centreport no knowledge of a native language. Thus, while indigenous language abilityhas steadily declined across cohorts, it appears unlikely that small shifts in a threeyear period – and limited to 20 per cent of indigenous students – could account forthe substantial within-school declines in Spanish test score gaps.Second, it is possible that within-school declines are the result of sorting of
indigenous and non-indigenous students across classrooms within schools. Supposethat indigenous and non-indigenous students in an older cohort were heavilysegregated across classrooms within schools because of ability tracking or streaming.
1522 P.J. McEwan
Downloaded By: [Wellesley College] At: 15:38 24 November 2008

Further suppose that a policy change diminished within-school segregation, leadingto improved indigenous achievement (with a zero or small negative effect on non-indigenous students). This would appear in the previous decomposition as within-school test score convergence, though clearly unrelated to P-900 or other reforms. Toassess this likelihood, the previous regressions with fixed effects for each classroomwas re-estimated, facilitated by the availability of data on all eighth graders within aschool. The revised decomposition is very similar to results with school fixed effects.It suggests that 59 per cent of Spanish test score convergence and 93 per cent ofmathematics score convergence occurs within classrooms. Thus, sorting withinschools is unlikely to be driving within-school declines in the test score gap.
Third, it is possible that declines are the product of students sorting betweenschools. That is, the school quality of students existing schools did not necessarilyimprove; instead, students in the 2000 cohort were more likely to choose high-qualityschools. Two scenarios seem most plausible. In the first, indigenous families may havemigrated from poor areas (such as region 9) to relatively richer communities, withhigher-quality schools, such as Santiago in region 13. Indeed, such migration isresponsible for the large number of Mapuche in Santiago. Yet, the indigenouspopulation proportions in each region have remained steady across the 1997 and 2000cohorts, which would be unlikely in the presence of extensive sorting across regions.
A related possibility is that sorting occurred between schools within localschooling markets, facilitated by Chile’s school choice provisions. That is, youngercohorts of families and children were more likely to choose higher-quality schools intheir communities. However, evidence from Table 1 provided little evidence that the
Figure 1. Proportion of indigenous individuals with self-reported knowledge of indigenouslanguages. Note: Sample (N¼ 22,309) includes individuals that identify themselves asindigenous between the ages of 5–69. Proportions within each age group, defined in 5 year
intervals, are weighted. Source: CASEN, 2003, and author’s calculations
Can Schools Reduce the Indigenous Test Score Gap? Evidence from Chile 1523
Downloaded By: [Wellesley College] At: 15:38 24 November 2008

proportion of indigenous families attending private schools has increased. Similarly,there was no evidence that students’ exposure to other indigenous students hassignificantly changed over time, which might occur as a result of different schoolchoices within local schooling marketsFourth, it is possible that declines are the artifact of a shifting propensity among
individuals to self-identify as indigenous. For this to be the case, indigenous familieswith relatively lower-achieving children must become less likely to identify asindigenous over a three year period, thus reducing the test score gap.35 While it isplausible that indigenous self-identification could diminish in newer cohorts, it is notclear that such families would be among the lower-achieving indigenous families. Itseems equally likely that such families would be drawn from the right tail of theindigenous achievement distribution, placing them above mean non-indigenousachievement, and leading to larger gaps.Fifth, it is possible that school sample selection could bias the results. Some
schools did not appear in both 1997 and 2000 samples, either because of closures andopenings, or because SIMCE was not conducted in the school that year (thoughnominally universal, sometimes schools are excluded from sampling for adminis-trative reasons). Thus, the regressions and decomposition with schools that appear inboth rounds were re-estimated. The results do not substantially change.
VIII. Conclusions
This paper has documented large differences in the mean achievement of indigenousand non-indigenous eighth graders in Chile. In three years, these mean differencesdeclined by 0.2 standard deviations in Spanish and 0.1 in mathematics. Applying adecomposition procedure, it was shown that declines did not result from convergencein observed family characteristics. Rather, the majority of declines occurred withinschools among students with similar socioeconomic status. A smaller portion,broadly attributed to school quality, occurred between schools.The paper argues that the most plausible explanation for such declines in the
test score gap is Chile’s large-scale school reform in the 1990s. For two components,P-900 and the Full School Day, it was shown that indigenous students in 1997 weremore likely to have been exposed to such reforms; this difference grew even larger in2000. Furthermore, it was argued that at least one reform (P-900) targetedindigenous students within schools, and another (Full School Day) may have yieldeda larger marginal impact among indigenous students. Though plausible, the case forschool reform’s role is circumstantial. Thus, I ruled out several alternativeexplanations, including student sorting. The strongest alternative explanation isthat declines are an artifact of the different test instruments used in the two years,particularly if the 2000 test became relatively easier for indigenous students, but notothers. It is important to replicate the facts described in this paper and probe theirvalidity, should additional data become available, especially item-level test data.Policies that affect test score gaps may have important implications for earnings
inequality. Indigenous families in Chile – and, indeed, throughout Latin America –face relatively higher rates of poverty and extreme poverty than non-indigenousfamilies. In 2000, 32.2 per cent of Chile’s indigenous population fell below thepoverty line, compared with 20.1 per cent of the non-indigenous population
1524 P.J. McEwan
Downloaded By: [Wellesley College] At: 15:38 24 November 2008
(MIDEPLAN, 2002).36 The Chilean gaps have persisted even in the wake of overallprogress in poverty reduction since the late 1980s (Litchfield, 2002).
The sources of indigenous earnings inequalities have been little explored, but asmall empirical literature, not including Chile, suggests that 50 to 60 per cent of themean earnings disadvantage of indigenous groups is explained by observeddifferences in the quantity of human capital (that is, years of schooling).37 Aplausible explanation of the residual, in addition to labour market discrimination, isa difference in the quality of human capital obtained by groups (as might be proxiedby test scores in Spanish or mathematics).38 There is no research on whether testscores explain indigenous earnings gaps in Latin America, although US literaturesuggests that racial test score differences prior to labour market entry can explain alarge proportion of the subsequent earnings gap (Neal and Johnson, 1996; Johnsonand Neal, 1998). There is certainly a strong warrant for better exploring the linksbetween schooling quality and earnings inequality in Chile, and in developingcountries more generally.
Finally, this paper’s findings merit an important caveat. The paper finds evidenceof declines in Spanish and maths test score gaps, but not in other areas. In particular,education reforms did not necessarily promote fluency or literacy in nativelanguages, such as Mapundungu, and may even have hastened their demise. In theearly part of the 1990s, official Chilean education policy essentially ignored nativelanguages. Bilingual education has belatedly assumed a small role in indigenousregions but it is dwarfed by resource investments in other reforms. There is a pressingneed to credibly evaluate the impact of bilingual programmes – and more maturereforms – on achievement in Spanish and native languages.
Acknowledgements
I am grateful to Gregory Elacqua and many officials of Chile’s Ministry ofEducation for providing data. Gillette Hall, Joseph Shapiro, Miguel Urquiola,Emiliana Vegas and two anonymous referees provided helpful comments. Theresearch received financial support from the World Bank, although the viewsexpressed are only attributable to the author.
Notes
1. The countries include Bolivia (Vera, 1998; McEwan, 2004), Canada (Ma and Klinger, 2000), Ecuador
(Garcia Aracil and Winkler, 2004), Guatemala (Wu et al., 2003; Hernandez-Zavala et al., 2006;
McEwan and Trowbridge, 2007), Mexico (Hernandez-Zavala et al., 2006), Peru (World Bank, 2001;
Hernandez-Zavala et al., 2006), and the US (Freeman and Fox, 2005). See McEwan and Trowbridge
(2007) for a summary.
2. Ethnographic evidence from region nine suggests that gaps within schools might be traced to low
teacher expectations for indigenous students, and use of instructional materials more suited to non-
indigenous, Spanish-speaking students (Herrera Lara, 1999).
3. The 1980s were characterised by public school decentralisation, privatisation and few direct
interventions in school quality by the national Ministry of Education (McEwan and Carnoy, 2000;
Hsieh and Urquiola, 2006).
4. This paper’s task is similar to US literature that explores the causes for the decline of the black-white
test score gap in the 1980s and its later stagnation or increase in the 1990s (Grissmer et al., 1998;
Hedges and Nowell, 1998, 1999; Cook and Evans, 2000; Hanushek, 2001; Neal, 2005).
Can Schools Reduce the Indigenous Test Score Gap? Evidence from Chile 1525
Downloaded By: [Wellesley College] At: 15:38 24 November 2008
5. The 1980s reforms may have also played a role, albeit more indirect, in affecting test score gaps by
removing constraints on school choice and perhaps allowing indigenous students to choose higher-
quality schools. Nonetheless, both cohorts of students in this paper’s data were exposed to a similar
regime of school choice, and the evidence presented below does not suggest that re-sorting of
indigenous students across schools can explain test score gaps.
6. The 2002 census asked: ‘Do you belong to one of the following first or indigenous nations?’ (author’s
translation). The mutually-exclusive options included Alacalufe (Kawashkar), Atacameno, Aimara,
Colla, Mapuche, Qechhua, Rapa Nui, Yamana (Yagan), and none of the above.
7. Among Chile’s smaller indigenous groups, the Aymara are concentrated in the far north (region one),
near Bolivia, and the Atacameno in region two.
8. Chilean household surveys began collecting data on indigenous status in 1996. Using similar
questions, the CASEN household surveys in 1996 and 2000 identified 4.5 per cent and 4.4 per cent
of the population, respectively, as indigenous (MIDEPLAN, 2002). The CASEN household survey
in 2003 found a slightly higher proportion indigenous (5.4%; author’s calculations with CASEN
2003 data). The discrepancy could be due to sampling error or the use of imperfect weights derived
from population projections based upon the 1992 census.
9. The 1992 census tabulations only report the indigenous population aged 14 or more (INE, 1993).
Thus, the absolute number of the indigenous in 1992 would be even higher. In calculating the
indigenous proportion, Gacitua-Mario (2002) used the total population, ages zero and above, as the
denominator, thus reporting a lower proportion.
10. The 1992 census asked: ‘Do you feel that you belong to one of the following cultures?’ (author’s
translation). Only three mutually exclusive options were provided (Mapuche, Aymara, and Rapanui).
11. The 2000 CASEN survey yields similar proportions (MIDEPLAN, 2002).
12. It asks: ‘In Chile, the law acknowledges the existence of eight first nations or indigenous peoples; does
the student’s mother belong to one of them?’ (author’s translation). The mutually exclusive options are
Atacameno, Aymara, Rapa-Nui, Quechua, Mapuche, Coya, Kawaskar and Yagan.
13. That is generally the case in countries without universal primary enrolments such as Guatemala
(McEwan and Trowbridge, 2007).
14. The estimates are obtained from the 2003 CASEN household survey.
15. In 1980, the Ministry of Education decentralised the management of public schools to more than 300
municipalities (McEwan and Carnoy, 2000; Hsieh and Urquiola, 2006). It also began financing
schools via a per-student subsidy based on monthly attendance. Private schools were eligible to accept
such subsidies if they did not charge tuition. Parents were able to attend either public or private
schools, presuming they were admitted. The reform precipitated a large-scale expansion of private
schooling throughout the 1980s.
16. The 1997 data have also been used to analyse the effectiveness of private schools (McEwan, 2001) and
the existence of peer-group effects (McEwan, 2003)
17. For an analysis of indigenous test score gaps in the 1999 cross-section, see McEwan (2004).
18. The original income categories in each year are more extensive and do not always overlap. They were
collapsed to facilitate comparisons between the two survey years.
19. Within each year’s sample, mean differences between indigenous and non-indigenous students are
estimated by regressing test scores on Indigenous. Robust standard errors are adjusted for the
clustering of students within schools.
20. Difference-in-differences are estimated by pooling the 1997 and 2000 samples and regressing students
test score on Indigenous, a dummy variable indicating the 2000 sample, and the interaction between
the two (where the last coefficient measures the difference-in-differences). Robust standard errors are
adjusted for the clustering of students within year-by-school cells.
21. The US literature on black-white test score gaps has usually focused on mean test score differences.
For an exception, see Clotfelter et al. (2006).
22. According to Cox (2004), it is possible to equate the 1997 and 2000 tests given anchor items duplicated
on the 1997 and 2000 tests. He summarises such an exercise, and it shows that equated mean test
scores in Spanish and mathematics are stable across time (implying similar mean achievement on
anchor items).
23. For applications of the Oaxaca decomposition to the wage differences between indigenous and non-
indigenous adults in Latin America, see Psacharopoulos and Patrinos (1994) and Hall and Patrinos
(2006).
1526 P.J. McEwan
Downloaded By: [Wellesley College] At: 15:38 24 November 2008
24. The present decomposition, and similar literature cited in footnotes 1 and 4, focuses on explaining
mean test score gaps, and changes in mean gaps. Given the relative lack of empirical evidence in
Chile or Latin America, this paper emphasises the application of well-known techniques for
describing and decomposing mean test score differences. Nonetheless, the evidence in Table 2
suggested, primarily for math scores, that declines were more substantial at select percentiles of the
indigenous and non-indigenous test score distributions. In future work, the author will explore this
further with quantile regressions, though neither fixed-effects nor a Oaxaca-type decomposition can
be applied without added methodological considerations (for example, see Koenker, 2004; Machado
and Mata, 2005).
25. Many control variables are missing values for some observations (see the sample sizes in Table A1). To
avoid reducing sample size, the author arbitrarily recode them to their sample means, and further
control for dummy variables equal to one for missing values, and zero otherwise (Krueger and Zhu,
2002). The coefficients on these additional variables, though not reported in the tables, are included in
regressions and later decompositions. Conducting the analyses with a smaller sample that excludes all
observations with missing data does not substantially alter the results.
26. Also see Cook and Evans (2000), McEwan (2004), and McEwan and Trowbridge (2007).
27. Note that the second term could also be weighted by the 2000 coefficients, and the third term by the
1997 mean differences, as in ðDX 00 � DX97Þb002 þ DX
97ðb002 � b972 Þ, a well-known feature of an
Oaxaca-type decomposition. All subsequent estimates were repeated both ways, but it does not
substantially affect the results.
28. A potential disadvantage of Oaxaca-type decompositions based on linear regressions is that
observations in the indigenous and non-indigenous groups may not fall within a region of common
support (see especially Nopo, 2004 and its references). That is, some indigenous children may be
observationally quite dissimilar from non-indigenous children, and vice-versa, and the decomposition
implicitly relies on projections of outcomes outside the observed range for such students. To assess the
sensitivity of results, probits within each cross-sectional sample were estimated, regressing the
indigenous dummy variable on the full set of family and school characteristics listed in Table A1.
Propensity scores for each student were then calculated. In 1997 (2000), the region of common support
includes 98.0% (97.7%) of non-indigenous students and 97.9% (98.6%) of indigenous students. The
author then dropped observations outside of the region of common support and re-estimated the
fixed-effects regressions in Table 3. The estimates and resulting decomposition results were not
substantively different from the full sample estimates.
29. McEwan (2004) carried out a similar exercise; the results are similar, but not identical because of small
sample differences.
30. For a similar discussion in the context of black-white test score convergence in the US, see Hanushek
(2001).
31. Due to grade repetition, some eighth grade students may have spent more than eight years in school
and, therefore, entered earlier than 1990 or 1993. The issue is less severe in Chile than other Latin
American systems because of generally low rates of grade repetition, less than 3 per cent in the first
grade (McEwan and Shapiro, 2008).
32. Declines in the test score gap between schools could have occurred even if indigenous students in the
2000 cohort were not more likely to be targeted by P-900 than students in the 1997 cohort. Anecdotal
and empirical evidence that the programme became more effective over time, probably because
programme interventions were added in the 1992 school year (Chay et al., 2005). Thus, the 2000
cohort may have been exposed to a relatively more effective intervention.
33. As Chay et al. (2005) note, there is no evidence on the relative cost-effectiveness of P-900 and other
reforms in improving student achievement.
34. Despite this evidence, there is a surprising lack of descriptive evidence on how knowledge of native
languages has shifted over time, and how such shifts may be related to children’s school performance.
35. It may also be the case that non-indigenous families with high-achieving children become more likely
to identify as indigenous over time. This seems implausible, given that indigenous identify is
stigmatised in Chile, revealed in attitude surveys (see Gacitua-Mario, 2002 and the citations therein).
36. The indigenous are also more likely to fall below the extreme poverty line (11% of the indigenous
population, compared with 5.4% of the non-indigenous population). For similar data on other Latin
American countries, see Psacharopoulos and Patrinos (1994), de Ferranti et al. (2004), World Bank
(2004), Hall and Patrinos (2006).
Can Schools Reduce the Indigenous Test Score Gap? Evidence from Chile 1527
Downloaded By: [Wellesley College] At: 15:38 24 November 2008
37. In particular, see de Ferranti et al. (2004: 94) and Psacharopoulos and Patrinos (1994: 214). In each
case, the results are obtained from an application of the Oaxaca decomposition to estimates
from Mincer earnings regressions estimated separately among indigenous and nonindigenous adults.
38. It is also plausible that the gap reflects differences in Spanish language skills – as might be captured by
test scores – an interpretation forwarded in the Bolivian context by Chiswick et al. (2000).
References
CASEN (2003) Encuesta de Caracterizacion Socioeconomica [Socioeconomic Characterization Survey],
Ministerio de Planificacion, Santiago, Chile.
Chay, K.Y., McEwan, P.J. and Urquiola, M. (2003) The central role of noise in evaluating interventions
that use test scores to rank schools. Working Paper No. 10118, National Bureau of Economic
Research, Cambridge, MA.
Chay, K.Y., McEwan, P.J. and Urquiola, M. (2005) The central role of noise in evaluating interventions
that use test scores to rank schools. American Economic Review, 95(4), pp. 1237–1258.
Chiswick, B.R., Patrinos, H.A. and Hurst, M.E. (2000) Indigenous language skills and the labor market in
a developing economy: Bolivia. Economic Development and Cultural Change, 48(2), pp. 349–367.
Clotfelter, C.T., Ladd, H.F. and Vigdor, J.L. (2006) The academic achievement gap in grades 3 to 8.
Working Paper No. 12207, National Bureau of Economic Research, Cambridge, MA.
Cook, M.D. and Evans, W.N. (2000) Families or schools? Explaining the convergence in white and black
academic performance. Journal of Labor Economics, 18(4), pp. 729–754.
Cox, C. (1997) La reforma de la educacion chilena: contexto, contenidos, implementacion. Documentos de
trabajo 8, Programa de Promocion de la Reforma Educativa en America Latina, Washington, DC.
Cox, C. (2004) Innovation and reform to improve the quality of primary education: Chile. Unpublished
manuscript, Ministry of Education, Santiago.
de Ferranti, D., Perry, G.E. Ferreira, F.H.G. and Walton, M. (2004) Inequality in Latin America: Breaking
with History (Washington, DC: World Bank).
Delannoy, F. (2000) Education Reforms in Chile, 1990–1998: A Lesson in Pragmatism (Washington, DC:
World Bank).
Edwards, J.H.Y. and Winkler, D.R. (2004) Capital humano, globalizacion y asimilacion cultural: un
estudio aplicado a los Mayas de Guatemala, in: D.R. Winkler and S. Cueto (eds), Etnicidad, Raza,
Genero y Educacion en America Latina (Santiago: PREAL), pp. 133–177.
Freeman, C. and Fox, M. (2005) Status and trends in the education of American Indians and Alaska
Natives. National Center for Education Statistics, Report 2005-108, US Department of Education.
Gacitua-Mario, E. (2002) Indigenous peoples in Chile: current situation and policy issues, in: Chile’s High
Growth Economy: Poverty and Income Distribution, 1987–1998 (Washington, DC: World Bank),
pp. 214–238.
Garcia Aracil, A. andWinkler, D. (2004) Educacion y etnicidad en Ecuador, in: D.R. Winkler and S. Cueto
(eds), Etnicidad, Raza, Genero y Educacion en America Latina (Santiago: PREAL), pp. 55–92.
Garcıa-Huidobro, J.E. (2000) Educational policies and equity in Chile, in: F. Reimers (ed.), Unequal
Schools, Unequal Chances: The Challenges to Equal Opportunity in the Americas (Cambridge, MA:
Harvard University, David Rockefeller Center for Latin American Studies), pp. 161–181.
Grinevald, C. (1998) Language endangerment in South America: a programmatic approach, in:
L.A. Grenoble and L.J. Whaley (eds) Endangered Languages: Current Issues and Future Prospects
(Cambridge: Cambridge University Press), pp. 124–159.
Grissmer, D., Flanagan, A. and Williamson, S. (1998) Why did the black-white score gap narrow in the
1970s and 1980s?, in: C. Jencks and M. Phillips (eds), The Black-White Test Score Gap (Washington,
DC: Brookings Institution Press), pp. 182–226.
Hall, G. and Patrinos, H.A. (eds) (2006) Indigenous People, Poverty and Human Development in Latin
America, 1994–2004 (New York, NY: Palgrave Macmillan).
Hanushek, E.A. (2001) Black-white achievement differences and governmental interventions. American
Economic Review, 91(2), pp. 24–28.
Hedges, L.V. andNowell, A. (1998) Black-white test score convergence since 1965, in: C. Jencks andM. Phillips
(eds), The Black-White Test score Gap (Washington, DC: Brookings Institution Press), pp. 149–181.
Hedges, L. and Nowell, A. (1999) Changes in the black-white gap in achievement test scores. Sociology of
Education, 72(2), pp. 111–135.
1528 P.J. McEwan
Downloaded By: [Wellesley College] At: 15:38 24 November 2008
Hernandez-Zavala, M., Patrinos, H.A. Sakellariou, C. and Shapiro, J. (2006) Quality of schooling and
quality of schools for indigenous students in Guatemala, Mexico and Peru. Unpublished manuscript,
World Bank.
Herrera Lara, R.H. (1999) Cultural images, education and domination: the case of the Mapuche of
southern Chile. Doctoral dissertation, University of Illinois at Urbana-Champaign.
Hsieh, C.-T. and Urquiola, M. (2006) The effects of generalized school choice on achievement and
stratification: evidence from Chile’s school voucher program. Journal of Public Economics, 90(8–9),
pp. 1477–1503.
INE. See Instituto Nacional de Estadıstica.
Instituto Nacional de Estadıstica (1993) Resultados oficiales, censo de poblacion. Instituto Nacional de
Estadıstica, Santiago.
Johnson, W.R. and Neal, D. (1998) Basic skills and the black-white earnings gap, in: C. Jencks and
M. Phillips (eds), The Black-White Test Score Gap (Washington, DC: The Brookings Institution
Press), pp. 480–497.
Koenker, R. (2004) Quantile regression for longitudinal data. Journal of Multivariate Analysis, 91(1),
pp. 74–89.
Krueger, A.B. and Zhu, P. (2002) Another look at the New York City school voucher experiment.
Working Paper No. 9418, National Bureau of Economic Research, Cambridge, MA.
Layton, H.M. and Patrinos, H.A. (2006) Estimating the number of indigenous people in Latin America,
in: G. Hall and H.A. Patrinos (eds), Indigenous People, Poverty and Human Development in Latin
America, 1994–2004 (New York, NY: Palgrave Macmillan).
Levin, H.M. (1998) Educational vouchers: effectiveness, choice, and costs. Journal of Policy Analysis and
Management, 17(3), pp. 373–391.
Litchfield, J. (2002) Updated income distribution and poverty measures for Chile: 1987–98, in: Chile’s
High Growth Economy: Poverty and Income Distribution, 1987–1998 (Washington, DC: The World
Bank), pp. 47–72.
Ma, X. and Klinger, D.A. (2000) Hierarchical linear modeling of student and school effects on academic
achievement. Canadian Journal of Education, 25(1), pp. 41–55.
Machado, J.A.F. and Mata, J. (2005) Counterfactual decomposition of changes in wage distributions
using quantile regression. Journal of Applied Econometrics, 20(4), pp. 445–465.
McEwan, P.J. (2000) The potential impact of large-scale voucher programs. Review of Educational
Research, 70(2), pp. 103–149.
McEwan, P.J. (2001) The effectiveness of public, Catholic, and non-religious private schools in Chile’s
voucher system. Education Economics, 9(2), pp. 103–128.
McEwan, P.J. (2003) Peer effects on student achievement: evidence from Chile. Economics of Education
Review, 22(2), pp. 131–141.
McEwan, P.J. (2004) The indigenous test score gap in Bolivia and Chile. Economic Development and
Cultural Change, 53(1), pp. 157–190.
McEwan, P.J. and Carnoy, M. (2000) The effectiveness and efficiency of private schools in Chile’s voucher
system. Educational Evaluation and Policy Analysis, 22(3), pp. 213–239.
McEwan, P.J. and Jimenez, W. (2002) Indigenous students in Bolivian primary schools: patterns
and determinants of inequities. Girls’ Education Working Papers, World Bank, Washington,
DC.
McEwan, P.J. and Shapiro, J.S. (2008) The benefits of delayed primary school enrollment: discontinuity
estimates using exact birth dates. Journal of Human Resources, 43(1), pp. 1–29.
McEwan, P.J. and Trowbridge, M. (2007) The achievement of indigenous students in Guatemalan primary
schools. International Journal of Educational Development, 27(1), pp. 61–76.
McEwan, P.J. and Urquiola, M. (2005) Precise sorting around cutoffs in the regression-discontinuity
design: evidence from class size reduction. Unpublished manuscript, Wellesley College and Columbia
University.
MIDEPLAN. See Ministerio de Planificacion y Cooperacion.
Ministerio de Educacion (2005) Orientaciones programa de educacion intercultural bilingue. Ministerio de
Educacion, Santiago.
Ministerio de Planificacion y Cooperacion (2002) Analisis de la VIII Encuesta de Caracterizacion
Socioeconomica Nacional (CASEN 2000). Documento No. 14, Etnias y Pobreza en Chile, Ministerio
de Planificacion y Cooperacion, Santiago.
Can Schools Reduce the Indigenous Test Score Gap? Evidence from Chile 1529
Downloaded By: [Wellesley College] At: 15:38 24 November 2008

Neal, D. (2005) Why has black-white skill convergence stopped? Working Paper No. 11090, National
Bureau of Economic Research, Cambridge, MA.
Neal, D. and Johnson, W.R. (1996) The role of premarket factors in black-white wage differences. Journal
of Political Economy, 104(5), pp. 869–895.
Nopo, H. (2004) Matching as a tool to decompose wage gaps. Discussion Paper No. 981, IZA, Bonn,
Germany.
Oaxaca, R. (1973) Male-female wage differentials in urban labor markets. International Economic Review,
14(3), pp. 693–709.
Psacharopoulos, G. and Patrinos, H.A. (eds) (1994) Indigenous People and Poverty in Latin America: An
Empirical Analysis (Washington, DC: World Bank).
Raczynski, D., Ruz P., M.A., Madrid V., A., Pavez G., A. and Quiroga M., P. (2001) Estudio de
Evaluacion Jornada Escolar Completa (Santiago: Pontificia Universidad Catolica de Chile).
Valenzuela, J.P. (2005) Partial evaluation of a big reform in the Chilean education system: From a half day
to a full day schooling. Unpublished manuscript, University of Michigan.
Vera, M. (1998) Bilinguismo y rendimiento escolar en Bolivia. MA thesis, ILADES-Georgetown.
Wooldridge, J. (2002) Econometric Analysis of Cross Section and Panel Data (Cambridge, MA: MIT
Press).
World Bank (2001) Peruvian Education at a Crossroads: Challenges and Opportunities (Washington, DC:
World Bank).
World Bank (2004) Poverty in Guatemala (Washington, DC: World Bank).
Wu, K.B. Goldschmidt, P. and Hara, M. (2003) The determinants of student achievement in primary
education, in: Guatemala: Equity and Student Achievement in Primary Education (Vol. 2: Background
Papers) (Washington, DC: World Bank).
Table A1. Descriptive statistics
1997 SIMCE 2000 SIMCE
Mean(S.D.)
Number ofstudents
Mean(S.D.)
Number ofstudents
Spanish test score 0.00 189,119 0.00 188,177(1.00) (1.00)
Math test score 0.00 189,599 0.00 188,177(1.00) (1.00)
Indigenous 0.05 194,359 0.05 188,177Female 0.52 191,449 0.51 188,176Mother’s schooling 9.69 190,176 10.10 175,140
(3.80) (3.99)Father’s schooling 10.12 187,788 10.63 167,653
(4.08) (4.26)Monthly household income5100,000 0.28 188,913 0.30 182,672100,000–200,000 0.32 188,913 0.34 182,672200,000–300,000 0.15 188,913 0.13 182,6724300,000 0.25 188,913 0.24 182,672
% indigenous in school 0.05 194,359 0.05 188,177(0.09) (0.09)
Average class size 35.31 190,581 35.72 185,939(7.02) (7.02)
Public school 0.58 194,359 0.56 188,177Private subsidised school 0.33 194,359 0.36 188,177Private paid school 0.09 194,359 0.08 188,177
1530 P.J. McEwan
Downloaded By: [Wellesley College] At: 15:38 24 November 2008