assessing the local and regional impacts of international
TRANSCRIPT

Centre for Urban and Regional Development Studies
Newcastle University Newcastle upon Tyne NE1 7RU
T: +44(0)191 222 8016 F: +44 (0)191 232 9259
E: [email protected] W: http://www.ncl.ac.uk/curds
Assessing the Local and Regional Impacts of International Migration
Final Report of a research project for the Department for
Communities and Local Government (DCLG), formerly the Office of the Deputy Prime Minister (ODPM)
New Horizons Theme 1b I: Migration and Demographic Change
Alison Stenning, Tony Champion, Cheryl Conway, Mike Coombes, Stuart Dawley, Liz Dixon, Simon Raybould and Ranald Richardson
June 2006

1
Summary A summary of this research report is published by the DCLG and can be found at http://www.odpm.gov.uk/index.asp?id=1161490 [not yet!]

2
Contents PageIntroduction 3Project Specifications and Methodological Structure 4Glossary of Abbreviations and Technical Terms 6Module A: Literature Review 7Modules B & C: Distribution of Country of Birth Groups (2001 & 1991) 20Module D: Analysis of Worker Registration Scheme Data 27Module E: Case Studies 48 Newcastle-upon-Tyne 53
Strategy, Policy and Institutional Engagement 55Labour Market and Skills Issues 58Community Integration and Access to Services 68
Peterborough 73Strategy, Policy and Institutional Engagement 75Labour Market and Skills Issues 78Community Integration and Access to Services 83
Key Point and Policy Questions 89Module F: Scenarios for 2016 92Methodological Reflection 100References 102 Annex 1: Numbers of residents in England in 2001 by county-of-birth groups 106Annex 2: Further detail on 2001 patterns of country-of-birth groups 108Annex 3: Transport Connections between the UK and Poland 110Annex 4: Guidance on Completing Key Factor Score Card and Plausibility Score Card 112Annex 5: Key Factors in Current and Future A8(+2) Migration to the UK 113Annex 6: Key Factors Score Card 123Annex 7: Plausibility Score Card 125Annex 8: Draft Scenarios 134 Box 1: Employer Case Study: Bus Co. North East 61Box 2: Employer Case Study: Award-Winning North East Hotel – Matfen Hall 63Box 3: Case Study JET-ESOL 69Box 4: Case Study New Link 78 Acknowledgements CURDS thanks the Home Office for access to data from the Worker Registration Scheme (WRS). We are also grateful to members of the Steering Group including Kylie Lovell (DCLG). Our thanks go in addition to the members of our expert panel: Dr Jane Hardy, Professor Marek Okolski, Professor John Salt, Leonie McCarthy, Kevin Richardson, Kevin Rowan and Owen Tudor.

3
Introduction Previous research suggests that migrants have made substantial contributions to the economic development of British cities and regions. Much of this evidence has centred on long-term settlers in the latter half of the twentieth century and more recent evidence suggests that current migrants tend to move shorter distances for shorter periods, raising questions about their local and regional impact. From the moment of accession on May 1st 2004, the UK opened its borders to the free movement of nationals from the eight accession states (A8) with the enlarged European Union. This report analyses the current and anticipated flows of migrant workers from A8 countries and explores the potential outcomes for England’s cities and regions. The research focuses on migrants from the new member states of the EU in east central Europe because early evidence suggests that they are particularly likely to be young and well-qualified people who may not settle long-term in the areas to which they first migrate. As such they perhaps represent the archetypal new migrant. Understanding the local and regional impacts of these migrants demands new research which clarifies whether this group’s experience does indeed represent a significant shift from that of previous migrant groups. To date analyses of international migration and of A8 migration, in particular, have tended to either focus on macro-level flows and impacts at the national and international scales or to study individual migrants and their communities. This study makes an important contribution to the ‘missing’ local scale in migration studies and analyses. The issues for English cities and regions centre on ‘capturing the resource’ which these new migrants potentially provide, as well as dealing with population turnover and community dislocation. The project was structured as follows. The knowledge base for the empirical research was extended through a review and analysis of existing literatures on international migration and local and regional development, which drew out initial studies of A8 migration and considered potential developments within the sphere of A8 migration in the context of previous migration flows. Alongside the literature review, the project team began an analysis of 1991 and 2001 Census data to better understand the spatial distribution of different migrant groups – both earlier waves of east central European migrants and those of other comparable or contrasting groups. That analysis resulted in the development of a typology of migrant groups which relates to their spatial patterning within the UK, paying particular attention to employment rates and urbanisation. The analysis of Census data was coupled with an analysis of Worker Registration Scheme data to identify the characteristics and spatial distribution of recent in-migrants from the A8 states, paying particular attention to their employment characteristics. This analysis was then connected to the typologies constructed on the basis of the Census data. The literature review

4
and the statistical analyses fed into the identification of case study areas for in-depth qualitative research and to the development of key areas for discussion and analysis within this phase of the research. The two case studies were developed in parallel to enable the project team to develop an iterative agenda which responded to the issues, policies and initiatives being developed in the case study regions, and in other well-publicised cases. Data and analyses from both the quantitative and qualitative phases fed into the final stage of the project – scenario-building. Using the knowledge gained in the earlier phases of the research, the project team developed migration scenarios, in collaboration with selected academic and policy experts to enable reflection on the changing local and regional impacts of international migration. This report follows the structure of the research and builds a set of outputs reflecting each stage of the research. In each section, conclusions and key findings are identified. For the statistical analyses (Census and WRS), these take the form of migrant distribution typologies. For the case studies, we have pulled together a set of key issues and policy implications. There are then integrated into the statement of scenarios, which serve as the key output of this report.
Project Specification and Methodological Structure Module A comprised a literature review focused on building an account of recent A8 migration in the comparative context of other post-war labour migration flows. The focus of the review was as follows: Migration to the UK from East Central Europe Local and Regional Impacts of A8 Migration Community Cohesion Local Services Provision and Access Housing Labour Markets Minority Ethnic and Migrant Enterprise The module concluded with a review of existing policy initiatives developed in many spheres in recent months by local and regional statutory and voluntary bodies. We concluded that these kinds of initiatives, and research into them, are both patchy and uncoordinated, leaving major gaps in knowledge of UK A8 migrant worker communities and in their local and regional impacts. Module B involved selective analysis of large datasets on contrasting groups of relatively recent in-migrants (n.b. the selection of groups was discussed at a Steering Group meeting). Practicalities dictated that the key sources were the 2001 and 1991 Census national datasets. Due to time limitations of the project, other potential data sources were identified but not used. Module C established typologies of the geography of relatively recent in-migrants. As well as a concern with whether a group has tended to cluster together or be widely spread, there is the

5
question of whether they choose to live in larger towns and cities, and whether they have gone to areas with tighter labour markets where more jobs may be available. The key output here is a typology codifying the distribution of groups across the country. Once this had been established, the typology provided a framework within which the present and possible future experience of newer migrant groups can be explored. Module D focused on the analysing data from the administrative systems put in place to manage in-migrant flows from the new EU member countries. The Worker Registration Scheme (WRS) generates data on the location and characteristics of arriving workers. Home Office staff very kindly made available WRS data for the research in what, to our knowledge, was previously unprecedented detail viz: postcoded – but anonymised – individual records. In addition, the dataset provides basic demographic information on the migrants and also key characteristics such as their number of dependents, if any. This information required processing to locate each migrant within a local authority area and to allow the creation of a set of job types. After this it was then possible to situate the new migrants from A8 countries within the typology of migrant groups which the project had developed (Module C). Module E centred on two in-depth case studies of cities/regions on the ‘receiving end’ of migration flows. The chosen case studies were Peterborough and Newcastle-upon-Tyne. Each study was placed in its wider city-regional context in order to reflect the cities’ institutional, labour market and regional development environments. This case study work focused on key interviews with local authorities, regional bodies, other service providers, community groups, trade unions, non-governmental organisations and key employers. The thematic focus of the interviews was labour market contribution and integration (including both legal and illegal labour); skills and training (identifying existing skills and training needs); service provision; the role of particular institutions in managing and supporting migration, labour market and community integration; and other economic and social contributions beyond labour markets (e.g. through the development of local authority partnerships, trade developments and export promotions). Module F consisted of a process of scenario-building drawing together the analyses from the quantitative and qualitative elements of our findings, focused on: • developing scenarios about the prospects for migration, from east central Europe in
particular, over the next decade, and • teasing out the policy-sensitive implications for the host areas and their existing
communities. The initial set of future scenarios has been reviewed by both the project team and an ‘expert panel’ representing three groups with expertise on migration and its impacts: academic and other experts based in the UK who have a particular interest in migration flows into the UK; academic experts who have a particular interest in outward migration flow from the A8 countries; and practitioners drawn from national, regional and local policy-making institutions (statutory and non-statutory).

6
Glossary of Abbreviations and Technical Terms A8 The eight East Central European (ECE) countries (Czech Republic,
Estonia, Hungary, Latvia, Lithuania, Poland, Slovakia, Slovenia) which acceded to the EU in May 2004
ACAS Arbitration and Conciliation Service ASRs asylum seekers and refugees BME black and minority ethnic CAB Citizens’ Advice Bureau CAP Common Agricultural Policy CoB Country of Birth category from Census data EEDA East or England Development Agency ECE East Central Europe ESOL English for Speakers of Other Languages EU European Union EU15 pre-2004 EU of 15 member states EU25 post-2004 accession EU of 25 member states EURES European Union Job Mobility Portal gangmaster a labour provider, usually in the agriculture, horticulture, shellfish
gathering and associated processing and packaging industries GLA Gangmasters Licensing Authority, established on 1 April 2005 to license
labour providers, maintain standards and curb the exploitation of workers in the agriculture, horticulture, shellfish gathering and associated processing and packaging industries
GVA gross value added; GVA measures the contribution to the economy of each individual producer, industry or sector in the UK.
HMOs houses in multiple occupation; i.e. houses that are occupied by more than one household
IOM International Organization for Migration LA local authority LFS Labour Force Survey LQ local quotient LSC Learning and Skills Council New Commonwealth nation states which joined the Commonwealth of Nations in the 1960s
and 70s as a result of decolonization; commonly used to refer to the post-war wave of non-White migrants from Commonwealth countries
ONE One North East (Regional Development Agency) ONS Office of National Statistics PD Postcode District RES Regional Economic Strategy RLN Regional Language Network SAWS Seasonal Agricultural Workers’ Scheme: allows workers from outside
the European Economic Area (EEA) to enter the UK to do seasonal agricultural work for farmers and growers
SBS Sector-Based Schemes: allows workers from outside the European Economic Area (EEA) to enter the UK to take short-term or casual jobs in low-skilled food manufacturing and hospitality industries
TUC Trades Union Congress WTO World Trade Organisation

7
Module A: Literature Review Migration to the UK from East Central Europe The patterns of migration to the UK from east central Europe in the last century have been marked by a number of distinct phases. The earliest phase saw both peasants migrating from the region in search of work and Jews escaping persecution. While some peasants arrived in the UK, the ‘New World’ was a much more popular destination and millions made their way instead to the US and Canada (Thomas and Znaniecki, 1967); it is estimated that approximately 15 million migrants made their way from eastern Europe to the United States between 1890 and 1914. The UK witnessed a more significant influx of east European Jews, expanding the British Jewish community from 65,000 to 300,000 between 1881 and 1914. These east European Jews settled mostly in urban areas – the east end of London, Glasgow, Manchester, Liverpool and Leeds. A second wave of east European Jews arrived in the run up to and during the Second World War, with an estimated 90,000 arriving in the 1930s.
The next significant wave of migrants consisted of a combination of the post-war settlement of refugees and displaced persons and the European Volunteer Workers schemes which permitted the immigration of thousands of workers and dependents from eastern Europe (Kay and Miles, 1992). It is estimated that over 400,000 east European workers settled in the UK between 1947-51. The majority of these new settlers were Polish but there were also a range of other nationalities, including Latvians, Czechs and Ukrainians. The immigration of these workers was managed so as to direct workers to sectors and regions with unmet demand for labour in support of post-war reconstruction (Robinson, 2003). The dispersal of migrant workers through these schemes led to east European communities throughout the UK, well beyond the ‘usual’ urban clusters, a pattern reflected in the 1951 census which, despite some considerable secondary migration back to London and the south-east, “records Polish-born communities in remote counties such as Merioneth, Anglesey, Northumberland and Cornwall” (Robinson, 2003, 5).
These post-war migrants, until recently, made up the vast majority of the UK’s eastern European communities as they settled, married, raised families and second and third generations grew. However, during the later post-war decades there were periodic flows of migrants, largely in response to major political events in the region. Thus Bijak et al (2004, 32) point to 200,000 emigrants from Hungary following the Soviet invasion and the fall of the anti-communist uprising of 1956; 104,000 from Czechoslovakia following the invasion of the armies of the Warsaw Pact and the fall of the Prague Spring in 1968; 13,000 emigrants from Poland following anti-Semitic events of 1968 and a further 160,000 following the introduction of the martial law in Poland in 1981. Fassman and Münz (2000; cited in Wallace, 2002) estimate that between the 1970s and the early 1980s 100,000 migrants were leaving east central Europe per year; by the mid-1980s this had risen to close to 1 million and by the early 1990s, war and ethnic conflict in the southern part of the region increased this figure to nearly 3 million. Fassman and Münz estimate that by 1994 the annual figure of out-migration had fallen to 500,000. The key European destinations for these migrants were Germany and Austria, though some of course made their way to the UK.
The migration regime between the UK and east central Europe changed dramatically after the collapse of communism in 1989 and the partial opening of the borders between east and west. The years 1989-2004 saw a significant inflow of both legal and illegal migration, including of asylum seekers and refugees, from Roma communities and from the war-torn former Yugoslavia.

8
Throughout the 1990s many east central European migrants came to the UK temporarily through managed migration schemes such as SAWS (the Seasonal Agricultural Workers Scheme) and SBS (Sector Based Schemes) which granted temporary work permits in specific sectors (notably agriculture, food processing, hospitality) or as au pairs or domestic workers (Clarke and Salt, 2003). In 2002, 51 per cent of SAWS workers came from the A8 states; in 2003, the top four SBS applicant nationalities were Ukrainian, Poles, Slovaks and Czechs, with a total of 55 per cent of applicants coming from the A8 states and a further 37 per cent from other ECE states (ibid). Since the accession of the 8 east central Europe countries to the EU in 2004, many workers on these schemes are from the A8 countries or other post-Soviet states (TUC, 2004a). In 2005, the quota for SAWS was 16,250 and SBS places numbered approximately 20,000.
On the accession of 8 east central European countries (Czech Republic, Estonia, Hungary, Latvia, Lithuania, Slovakia, Slovenia and Poland) to the EU in May 2004, the free movement of people from the A8 states was subjected to transitional measures to restrict migration. The other two new member states, Malta and Cyprus, were exempted from these measures. Existing member states “resorted to a variety of different restrictions ranging from limitations depending on sector or type of work, through quota arrangements, to work permits granted only when a national cannot be found to fill the vacancy” (Traser, 2005, 6), applicable for time periods up to 2009 (or 2011 in exceptional circumstances). All existing member states, with the exception of the UK, Ireland and Sweden, imposed restrictions on labour migration. The UK and Ireland opened their labour markets but restricted access to welfare benefits; only Sweden offered A8 nationals fully free movement and full access to rights and benefits.
In May 2004, the UK introduced the Worker Registration Scheme (WRS) under which nationals of the A8 states employed in the UK are required to register. After working legally for 12 months continually in the UK migrants from the A8 countries gain full rights of free movement, and will no longer need to register with the Worker Registration Scheme but instead can apply for a UK residence permit. The WRS was established not only to monitor the impact of EU accession on the UK labour market but also to restrict access to benefits. It is very unlikely that A8 nationals will be eligible for unemployment or housing benefits, for example. Between March 2004 and June 2005, just 51 applications for tax-funded, income-related benefits were approved for further processing; 43 local authority lettings to A8 nationals were approved (70 per cent to those who had arrived in the UK prior to May 2004) and there were 216 successful applications for homelessness assistance, 4 out of 5 of which were from people who had arrived in the UK prior to May 2004 (Home Office et al., 2005).
In the months leading up to accession various agencies and experts tried to estimate the anticipated inflow of A8 migrants to the UK, with a 2003 Home Office-funded study (Dustmann et al., 2003) estimating an average annual net flow into the UK of between 5,000 and 13,000. Other organisations such as Migrationwatch UK made ‘back of the envelope’ calculations suggesting 40,000 migrants a year (Migrationwatch UK, 2003). In reality, between May 2004 and June 2005, there have been 232,000 WRS applicants, although up to 30 per cent of the applicants may have already been in the UK before 1 May 2004 (Home Office et al, 2005). This is fifteen times the Dustmann et al estimate, with the principal explanation lying in the decision by other west European countries to refuse access to their labour markets, a decision taken after that study was produced. The number is also significantly more than the 129,041 who come into the country on various work permit schemes in 2002 (Clarke and Salt, 2003).
A more detailed analysis of the dataset is provided later in this report, but the WRS data only tells us part of the story and a number of questions remain. For example, we do not know how

9
many registered workers have remained in the UK or how many others are working unregistered or are self-employed. The Federation of Poles in Great Britain suggests the number of Poles living in the UK is some 50 per cent higher than those registered with the WRS (Long, 2005). The level of undocumented migration from the A8 states is obviously unclear. There has however, it is argued, been a tendency to regularization since accession. Bijak et al (2004, 48) note:
“many of the so far irregular migrants and illegal workers from Central and Eastern Europe are likely to regularise their status once they would have such an opportunity. Therefore, shortly after the liberalisation takes place, an increase in the numbers of migrants will likely be observed in the statistical registration, yet not in the reality. This hypothesis has been substantiated by the recent Home Office (2004) report stating that in May 2004 as many as 61% of those who registered under the Working Registration Scheme arrived before 1st of May 2004. By September 2004, the share decreased to 12%. This is exactly as was predicted by Kupiszewski (2002a).”
So far in this review we have largely focused on the volume of migration to the UK from East Central Europe but we now turn to consider what the literature has to say about the characteristics of these migrants. There is a clear consensus in the varied academic and policy literatures that migrants from central and eastern Europe represent a relatively new type of migration – that of shorter-term labour migration, mostly involving young, skilled workers with no dependents who plan to live and work abroad temporarily, from a few months (seasonally, during vacations) to for a couple of years, and then return to their home country with increased capital and, often, improved language skills (Traser, 2005). It is very clear in the literature that the vast majority of researchers see this migration as temporary: Wallace (2002, 605) quotes a 1998 International Organisation for Migration regional survey which suggests that “the shorter the period of time, the more people were interested in going abroad”. For some this is characterised as ‘incomplete migration’ or ‘boomerang migration’ (Jażwińska and Okólski, 2001); for others “it is better to talk about mobility rather than migration in the traditional sense” (IOM, 1998, 11-13).
It is suggested that the reasons for this new form of migration/mobility are diverse, not least social, geographical, economic and infrastructural. Wallace (2002) suggests that faith in the economic future of own countries discourages long-term migration and Pichelmann (2001, 17) notes that the “preference for short-term migration, including cross-border commuting, seasonal and casual work is clearly much higher” since it allows the migrant to maintain a home in their country of origin. The opening of borders and the development of transport networks (and especially, in recent years, budget airlines) within Europe have together facilitated short-term mobility.
There is some suggestion – both in the academic and policy literatures and in media anecdotes – that an initial preference for short-term migration can, sometimes, transform into a desire for longer term settlement. This was the case in earlier migrant flows, from the ‘New Commonwealth’ for example, and some migrants do seem to be staying longer than originally planned (Long, 2005; Winterman, 2005). Given the short time period elapsed since May 2004 and the structure of the Worker Registration Scheme, it is almost impossible to assess how many A8 migrants have chosen or will chose to settle more permanently.
Because much of the migration reported appears to gain the short-term financial benefits resulting from the marked difference in economic status of the UK and the A8 counties, it is expect that the growth of east central European economies following accession to the EU will
10
lead to a decrease in the numbers of migrants from the region. In short, it is reasonable to expect that the improvement in the economic position of the ECE countries will weaken the rationale for out-migration.
Future flows to the UK from eastern Europe will be affected by a number of significant events. In 2006, Denmark, Finland and the Benelux countries are expected to open their labour markets to A8 nationals, although Italy, France, Spain, Portugal and Greece are less likely to do so. It is expected that Germany and Austria will extend their labour market restrictions for as long as possible (Bijak et al., 2004). The opening of some northern European labour markets may reduce flows to the UK, although it could be argued that English language skills and the presence of significant prior migrant communities (with their social networks, their access to job opportunities etc) will maintain the UK’s position as a key destination of choice.
The accession of Bulgaria and Romania to the EU in 2007 will also have an impact, even though both countries accepted the same restrictions on labour migration as the A8 states and thus legal flows of migration will be limited. However, as Bijak et al. argue “the relatively low level of socio-economic development of these countries will, no doubt, constitute a strong push factor to emigrate for many more years” (Bijak et al., 2004, 37). Survey research in the Balkan region (not only Bulgaria and Romania, but also Croatia and Serbia-Montenegro) suggests that “many people … are keen to move for any period at all, so we would expect an influx of people from these countries, especially from the young people who see no future for themselves in their home country” (Pichelmann, 2001, 23).
Other researchers expect that the east central European region will increasingly be a migrant receiving region (Wallace, 2002), as EU membership leads to increasing prosperity. As the A8 countries are becoming more attractive for migrants from the former Soviet Union in particular (Bijak et al., 2004), they are becoming a destination for migration. Indeed Wallace and Stola (2001) identify in-migration, not out-migration, as the key regional challenge.
Local and Regional Impacts of A8 Migration Very early analysis of the Worker Registration Scheme data and other related sources has suggested that there are distinctive geographical patterns amongst new migrant workers. There is a marked dominance of London and adjacent regions, together accounting for over half of all registered workers, and the sectoral profile of registered workers differs quite clearly by region. TUC research (TUC, 2004b, 1) which analysed both early WRS data and TUC data concluded that “these new arrivals are to be found less in big cities of Britain than in smaller towns and rural areas” due to the jobs available being concentrated in hospitality, agriculture and food processing. For the TUC “this marks a departure from earlier waves of migration, which were predominantly to urban areas” (ibid).
More recent WRS data suggests that migrants have been increasingly registering to work beyond London and the adjacent regions where numbers registering have been falling, whereas registrations in other regions have been increasing. It is not clear whether this reflects seasonal patterns or regional economic trends, nor if those migrant workers registering beyond London have arrived directly to those regions or lived and worked in London first.
Notwithstanding this changing geography, the vast majority of research, empirical and anecdotal material relates to new migrants in London, the east and the south east. As a result, far less is known about A8 migrants in more northern and western regions, although early evidence

11
suggested they are fairly dispersed. This pattern would echo experience in Toronto and Lisbon where recent migrants from east central Europe appear to be settling beyond the urban core and in dispersed locations (Malheiros and Vala, 2004; Murdie, 2003).
Transport links appear to be critical to the geography of the flows. Initially most migrants were dependent on coaches (to/via London Victoria) but now the cheap flight network through which UK and central European-based airlines (e.g. Easyjet, Ryanair, SkyEurope, Centralwings, WizzAir) are connecting not only capital cities but also more regional centres. Migrants from much of Europe can now fly direct to many UK cities.
These particular geographies feed into a number of concerns at the local and regional level. There has been little systematic research into these concerns, thus what follows is an outline of some of the issues as they have been raised
~ in the little research on A8 migrant workers which does already exist; ~ in related research focused on other migrant groups (earlier waves of migrants and/or
asylum seekers and refugees); ~ in related research on ethnic minority communities (though much of this is focussed on
BME groups and as such ignores the experiences of white minority groups); ~ in the popular media, and ~ in local authority fora (on the basis of media reports and web-accessible material).
Community Cohesion In discussions of community cohesion, the major differences between A8 migrants and earlier migrants are the scale of migrant communities. In most places, the A8 inflow amounts to less than 1 per cent of the host population. In addition, A8 migrants are not a very visible migrant community, although some concerns have been raised in relation to language and cultural differences, linked not only to potentially low levels of community integration but also to vulnerability in both housing and labour markets.
Some weak evidence suggests there may be nascent ‘anti-social behaviour’ problems, connected to language misunderstandings but also to other ‘behavioural’ issues (see Housing below). The media and race relations organisations document dozens of instances of violence against A8 migrants, including some murders. In some areas then, there are clear community safety concerns.
Research into the integration and reception of asylum seekers and refugees (ASRs) suggests that alongside the more negative representations of ‘sponging foreigners’ within communities with significant ASR populations, these migrants are seen as good neighbours and good tenants, often possessing strong community/family values and an ethos of hard work (CRESR et al., 2003). Some communities value the cultural diversity migrants bring but are fearful of the pressure put on local services, not only by a quantitative increase in demand but also by the particular demands of ASR groups (in terms of language, vulnerability, urgency etc). Some media reports have identified communities where there is a perception that ASR groups receive preferential treatment. Some ASRs from east central Europe (mostly Roma from the Czech Republic) are singled out as a particularly ‘bogus’ group, seeking work rather than escape from persecution.
Of course migrant workers from the A8 states are not asylum seekers or refugees. In contrast to ASRs, A8 migrant workers are

12
∼ unlikely to be afforded the same level of sympathy; ∼ can (in theory) choose where they wish to live and work; ∼ may stay for longer or shorter periods of time; ∼ must be self-supporting; ∼ are likely to have travelled without dependents; and ∼ are less vulnerable. For all of these reasons, their integration and reception are likely to be considerably different.
For some A8 migrant workers, however, their travel, settlement and employment is dependent on agencies (or gangmasters). In these cases, their behaviour is much more likely to mirror ASRs because
∼ they tend to be geographically concentrated, often in remote rural areas; ∼ they are unaware of their rights; ∼ their language skills may be weaker; and ∼ their position in the UK housing and labour markets much more tenuous.
Issues of community cohesion also highlight relationships with existing east central European immigrant communities, whose existence and activities vary from nationality to nationality, and from region to region. Whilst some existing community groups have been incredibly active in providing advice and support to new migrants, there are also potential conflicts between different migrant generations (a tendency identified in many of the long-established literatures on immigrant communities, e.g. Erdmans, 1998). Within new migrant groups themselves, some researchers have identified ‘unrestrained competition’ within A8 migrant communities over employment and housing opportunities in particular (Grzymala-Kazlowska, 2005; Jordan, 2002).
Local Services Provision and Access There is a very small evidence base regarding local service provision and A8 migrant workers. As with community cohesion, it is necessary to extrapolate research findings from ASR groups, with the very clear proviso that A8 migrant workers are not the same as asylum-seekers or refugees. Nevertheless it seems likely that there are similar issues around language, housing, access to health services and a set of labour market and training concerns.
In both the popular media and in some policy research (Rogaly and Taylor, 2004; Winkelmann-Gleed and McKay, 2005), concerns are raised about knowledge of and access to the health and benefits systems. It seems both migrant workers and service providers are confused about what services registered A8 migrant workers can access. Migrant workers lack a clear source of information and, as with ASR groups, suffer from “an over reliance on word of mouth on rights and entitlements” (Phillimore, 2005, 25).
The extra pressures placed on service providers by diverse language users and by more vulnerable groups are well-documented. The greater the diversity of language and cultural backgrounds, the more difficult service provision becomes (renewal.net, n.d.). For this reason it is not difficult to see how service provision for new migrant groups will frequently be perceived as at the expense of established populations and earlier migrant communities.
In areas where community and voluntary groups are weak or absent, agencies have difficulty reaching migrant groups. Inappropriate services (particularly schools) end up acting as advice

13
centres, and the range of bodies involved may result in uncoordinated activities and a failure to share information. For example, the Citizens Advice Bureau have raised questions about “the ownership of the migrant worker agenda and the extent to which is it shared (or not) by all the bodies and agencies that need to be involved” (Citizens Advice Bureau, 2005, 3).
Although existing migrant/ethnic community groups can offer an important sources of support for newly-arriving migrants, for A8 migrants it is likely that the strongest levels of support exist in London; it may also be the case that these support structures are ‘saturated’ and unable to respond to all those seeking help.
Where obvious forms of support and assistance are unavailable, it is unclear where migrants are turning to for support in relation to employment, housing, benefits and immigration problems. Sometimes advice agencies, such as the Citizens Advice Bureau or migrant and/or refugee organisations, will provide support; in other places, churches or community organisations are under pressure to offer support that they are ill-equipped to provide. The fact that many migrant workers have gone to move to rural areas, where there is often less experience with issues of diversity and service provision, has exacerbated some of these concerns (Citizens Advice Bureau, 2005). Some media reports suggest in passing that informal ad hoc organisations have been established by particularly active migrants (Chrisafalis, 2005).
There are likely to be considerable differences between and within A8 migrant groups. Not only do Poles make up the majority of recent migrants, but Polish community organisations have long been established in some regions. The vast majority of research, empirical and anecdotal material relates to Polish migrants and the picture for the other seven national groups is much sketchier. Within each national group, the diversity of migrants (by age, gender, education etc) will also mean that needs and opportunities are very varied.
In short, we can hypothesise that access to information about rights and local service provision is profoundly uneven. With subsequent EU accessions this problem is likely to be exacerbated, since the existing Romanian and Bulgarian communities in the UK are very small and weakly institutionalised.
Housing Previous research into housing and migration suggests that many new migrant groups, especially undocumented migrants, are characterised by high levels of vulnerability and informality in the housing sector (Burgers, 1998; Murdie, 2003; Musterd and Deurloo, 2002). Evidence from other cities beyond the UK suggests that most recent A8 flows have been characterised by increasing vulnerability in housing markets as a result of the lower skills (including language) and more precarious labour market positions of more recent migrants, and of growing numbers of migrants who may over-stretch the accessible housing market.
Numerous recent research reports (including Davis, 2005; Winkelmann-Gleed and McKay, 2005) point to the need for systematic surveys at the local or regional scale of migrant worker housing and for the results to be fed into local, sub-regional and regional housing strategies. There is little evidence that housing strategies currently take into account the housing needs of migrant workers – in the evidence base for the West Midlands regional housing strategy, for example, there are reports on ASRs as well as black and minority ethnic (BME) and Roma communities, but no consideration of the housing needs of other migrant groups.

14
Both academic and policy research and a great deal of anecdotal evidence points to the phenomenon of recent migrants sharing houses with multiple occupants (HMOs), with a tendency to overcrowding. For example, the Selby Communities and District Industrial Mission (SCADIM) verified cases of 8 workers living in two-bedroomed houses, and recorded “the worst case of 14 people resident in one house, with people living in attic spaces and yet other people sleeping in the loft space” (Davis, 2005, 5). Jordan and Düvell identify so-called ‘Polish houses’ where numerous A8 migrants (not always Poles) are resident in particular properties; the residents are not necessarily constant but are continuously from the A8 counties (Düvell, 2004; Jordan and Düvell, 2002). This kind of situation clearly has implications for the resident migrants, for neighbours and for local authorities, who are duty bound to act in response to overcrowded HMOs.
There is some early evidence (and comparative evidence from other non-UK cities) that A8 migrant housing markets link co-ethnic landlords and tenants, with landlords potentially coming from earlier migrant communities. Access to housing amongst other migrant groups seems to be closely connected to earlier established immigrant communities which act, formally or informally, as key sources of information (Burgers, 1998).
Housing vulnerability rests not only on issues of language and social capital but also on the dependence of housing on employment (TUC, 2004b). Gangmasters are accused of forcing migrants into expensive sub-standard accommodation, which is withdrawn when employment is terminated, leaving migrant workers without a job, a home or the right to claim benefits. While migrant workers from larger and more established communities may be able to rely on the help of friends and acquaintances in these situations, others may be more vulnerable to roughsleeping.
There have been numerous anecdotal accounts of homelessness amongst recent A8 migrants, with charities and local authorities having to intervene (BBC News Online, 2005; Chrisafalis, 2005; Housing Today, 2004a, b, c; peterboroughtoday, 2005). Housing charities in London have been documenting the number of east European roughsleepers, providing basic services (food and showers), facilitating their search for work and paying for onward travel to other UK regions. Charities have been working with local councils to provide information in Polish and the other languages. The importance of the geography of these flows is highlighted by the leader of Westminster Council, Simon Milton: “It’s a particularly acute problem for Westminster, he says, because many rough sleepers stay near their point of arrival, Victoria station, rather than spreading out around the country” (Housing Today, 2004d).
Earlier waves of migration from east central Europe (especially post-war) led to the establishment of housing associations and mutual societies to support access to stable housing markets. It is not known whether these are involved in supporting new migrants, but the ageing of these institutions along with the ageing of their migrant cohorts suggests that these resources are not extensively available to new migrant groups.
The importance of employment in construction amongst A8 migrant workers points to an ironic situation in which some are threatened by homelessness while they are building other people’s homes. In London and the South East, A8 migrant workers are employed in the construction of homes for the UK’s existing key workers (Weaver, 2005).

15
Labour Markets The top twenty occupations between July 2004 and June 2005, accounting for approximately 80 per cent of registered workers, were as follows (Home Office et al., 2005).
1. Process operative (other factory worker) 2. Kitchen and catering assistants 3. Packer 4. Farm worker/farm hand 5. Cleaner, domestic staff 6. Waiter, waitress 7. Warehouse operative 8. Maid/room attendant (hotel) 9. Care assistants and home carers
10. Sales and retail assistants 11. Building labourer 12. Crop harvester
13. Bar staff 14. Food processing operative (fruit/veg) 15. Food processing operative (meat) 16. Chef 17. HGV driver 18. General administrator 19. Fruit picker 20. Delivery van driver
With this kind of occupational profile, it is not surprising that A8 migrant workers have so frequently been depicted as filling labour gaps, “to take vacancies our young people currently can’t or won’t do” (Conservative spokesman on employment, cited in Rennie, 2005). Perhaps more popular than the image of migrant workers ‘taking our jobs’ – although this image also exists, especially in labour markets with relatively high unemployment amongst unskilled and semi-skilled workers – is the image of A8 migrant labour as hard-working in stark contrast to UK labour. A typical example of this comes from The Daily Mail (Dolan, 2005):
“A businessman has revealed that he has to recruit workers from Poland because English people on benefits have ‘given up on the work ethic’."
In addition to simply meeting relatively unskilled labour shortages, there are teachers, dentists, doctors and nurses who have been actively recruited from the A8 states to work in various parts of the UK (McLaughlin and Smith, 2005). Organisations such as the Bank of England and the Chartered Institute of Personnel and Development have drawn attention to the critical role migrant labour and skills are playing in the UK economy (ePolitix.com, 2005; politics.co.uk, 2005) and the Department for Work and Pensions commissioned a major report on this (Portes and French, 2005; Gilpin et al, 2006). It is clear that there are significant differences between different parts of the country.
A significant proportion of A8 migrants appear to be well-educated and to have foreign language skills. Some employers’ organisations (such as the Engineering Employers Federation, see Ashby, 2005) have highlighted the benefits of east European employees in the context of growing European competition. In addition, the DTI (through UK Trade and Investment) have drawn attention to the role that émigré Central Europeans might play in the medium- to long-term as ‘export promoters’ by offering language skills and economic and cultural knowledge of these new trading partners (Insight into Central Europe, September 2000).
Many skilled migrants are employed in low-skilled sectors. This is evidence not so much of a ‘brain drain’ as a ‘brain waste’ (Garnier, 2001, 133), a phenomenon which raises questions

16
about the larger contribution these migrants could play in local and regional economies if they were to settle more permanently and/or utilise all their skills.
These issues raise questions about the local provision of further training, including on English for speakers of other languages, and the accreditation of prior learning. In these spheres, issues of information, access and childcare recur. In particular there are questions about the provision and coordination of such services, and their connection to wider local and regional strategic goals. Initiatives such as the National Institute of Adult Continuing Education (NIACE) ESF-funded ProjectGB1 have been launched to enable refugees and migrant workers to adapt and develop their skills in the UK labour market.
Employment agencies, intermediaries and labour providers (including gangmasters) in both the UK and in the A8 states are playing a major role in managing these migrant flows. Vast numbers of new agencies (some only virtual) have sprung up in recent months to facilitate — and profit from — these labour migrations. Local newspapers in the A8 states are full of advertisements for work in the UK and Ireland, mostly offered through agencies. Organisations such as the British-Polish Chamber of Commerce have also organised job fairs in the region for potential migrants.
Once in the UK, information about job opportunities is often spread by word-of-mouth within migrant communities, sometimes focused around key sites such as the so-called Ściana Płaczu (Wall of Tears) in Hammersmith (Jeffries, 2005). The role of intermediaries (both formal and informal) shapes a particular geography of migration. It seems that certain clusters of A8 migrant workers have been formed by particularly influential intermediaries.
There is comparatively little research yet on the local and regional impacts of recent migrant flows or — with the exception of London — the link between migration and urban competitiveness debates. However, some city councils, such as Aberdeen (Jeffries, 2005; Simpson, 2005), have proactively organised recruitment missions to A8 countries, seeking staff for hard-to-fill vacancies
There has been a mixed response from UK employee organisations and from trade unions to the recruitment of migrant labour. As in the post-war period (Miles and Kay, 1990), there has been ambivalence, at least, on the part of some to the influx of migrant labour. Thus the case of Aberdeen seeking construction workers in A8 states was
“branded premature by a construction union boss. David Murray, regional organiser of UCATT,2 claims there is not enough work for builders in the area at the moment. And he has called on companies to overcome any skills shortages by employing more apprentices” (Simpson, 2005; see also, Tomlinson, 2005).
Yet trade unions have also been at the forefront of programmes to monitor and promote migrant workers’ rights, intervening in cases of exploitation, and representing migrant workers in governmental and other fora. The TUC has, for example,
∼ worked with Compas (Oxford University) to identify sources of support for migrant workers; ∼ cooperated through the Birmingham Centre for Unemployed Workers with the Birmingham Polish Centre to provide advice on workers’ rights; and
1 http://www.niace.org.uk/Research/ASR/Projects/Progress-GB.htm 2 Union of Construction, Allied Trades and Technicians

17
∼ seconded a Solidarity organiser from Poland to work with migrant workers in Manchester and the North West.
Minority Ethnic and Migrant Enterprise One of the other areas in which immigrants are often seen to have a particularly positive economic contribution is in self-employment and enterprise. Whilst there is a considerable literature on ethnic entrepreneurialism and urban and regional development, we are unaware of any literature which deals with A8 migrants and self-employment and/or entrepreneurialism.
We will first summarise some of the key research on minority ethnic entrepreneurialism and urban and regional development before turning to the question of A8 migrants. In the following sections, we reference literatures on both minority ethnic and immigrant enterprise. There is a considerable overlap between these two literatures, despite the clear differences between the two populations. In both sets of literatures, the focus is overwhelmingly on black and Asian enterprise, with very little attention paid to white minority ethnic or migrant communities (Irish, other European, Australian, South African etc).
A range of research has drawn attention to the potential of immigrant enterprise in the revival of marginalised neighbourhoods and localities (see, for example, Kloosterman and van der Leun, 1999; Barrett et al., 2001). Immigrants can be seen as more entrepreneurial, either because they possess an ‘enterprising spirit’ (Kloosterman and van der Leun, 1999, 664), evidenced by the risks taken to migrate, or because in the face of rejection and discrimination in the labour market it is “easier for immigrants to participate in the economy as entrepreneurs than as employees” (ibid.). Because of the tendency for migrant communities to be clustered in such neighbourhoods — often neighbourhoods targeted by government renewal initiatives — it is suggested that any entrepreneurial activity “may, therefore, strengthen the local economy of these neighbourhoods and offer not only specific goods and services but also jobs, nodes of information and role models” (Kloosterman and van der Leun, 1999, 659). Together these trends “gave rise to a vision of the ethnic minority entrepreneur as potential urban regenerator” (Barrett et al., 2001, 242). In addition to these wider economic benefits, Barrett et al draw attention to the claims made in, amongst other places, the 1982 Scarman Report, that self-employment works as a means to integration.
The local neighbourhood – through its formal and informal institutions, and the mix of minority ethnic and ‘mainstream’ populations – is seen to be absolutely critical to the development of minority ethnic enterprise. Particular sites within minority communities can act as “hot spots of information … crucial in obtaining a job, a house or a partner” (Kloosterman and van der Leun, 2001, 665). A ‘critical mass’ of immigrants allows for the ‘nurturing of social capital’, the development of social networks, and the servicing of a ‘captive’ market (Kloosterman and Rath, 2001), whilst the wider institutional environment at the urban and regional level shapes markets, entrepreneurial opportunities and development potential. For these reasons, Kloosterman and Rath stress the importance of what they call ‘mixed embeddedness’ which is the articulation of the migrant entrepreneur with both immigrant social/community networks and the wider economic and institutional context.
Barrett et al (2001, 241) stress the importance of spatially-sensitive and locally-variable policies for migrant enterprise support. Their reasoning is
“the uneven geography of migrant and native age and class structures, and the varied legacies of earlier economic cycles in the urban fabric, mean that localities and regions

18
possess differing potential for business development. The number of potential entrepreneurs varies; the availability of co-ethnic labour differs; markets are distinguished along dimensions of culture, prosperity and sector; and the competitive context is rarely the same.”
Much of the research on minority ethnic access to business support services echoes the research on access to other local services: contact with such agencies is limited by a relative lack of awareness of available support or initiatives, and by language and cultural barriers. Barrett et al (ibid) suggest that minority ethnic entrepreneurs have relatively little contact with enterprise and business support agencies or training and skills councils; they also question how much direct support has been targeted at these entrepreneurs in urban regeneration programmes.
Alongside the focus on enterprise development by migrants or minority ethnic citizens, some parts of the literature also identify as ‘survivalist entrepreneurs’ the day labourers and other marginally-employed migrants. In these cases, self-employment is seen as a means of maintaining an income through flexible employment and, in some cases, as a means of circumventing labour market restrictions.
Given the virtual dearth of material on entrepreneurialism among A8 migrants, this report can only pull together anecdotal material from the popular media and raise questions to be addressed in Module E of the current project, or in further research.
The data from the Worker Registration Scheme only includes those migrants who are employed in the UK and so it does not register all working migrants. Data on applications for national insurance numbers, cross-matched with WRS data, might give some idea of the scale of self-employment amongst A8 migrants (but still little idea of its nature). In June 2005, the WRS recorded only 95 employed plumbers. Although many more may be working illegally, numerous plumbers (and other tradesmen) are likely to be self-employed.
There is anecdotal evidence that some ‘advance’ migrants (i.e. those who came before 2004, either as migrants or asylum seekers) are now establishing their own companies — especially in construction — and then employing their fellow nationals (Clark, 2005).
The relatively small size of some migrant communities (both nationally or within particular UK cities and regions) suggests that the potential for co-ethnic business is limited since a ‘critical mass’ of co-ethnics/nationals is often the starting point for migrant businesses. Even so, reports from around the country point to the establishment of new delicatessens and specialist shops serving east central European communities. It is unclear what the ownership of these enterprises is, and what their potential is for development beyond the co-ethnic community.
Some reports suggest that many A8 migrants are currently working in the UK to save for business start-ups back home. If this is the case, it is unclear whether the UK is likely to lose the most skilled and most entrepreneurial migrants through return migration.
In all of these questions, the relationship between the new migrants and the existing east central European communities in the UK (as markets, sources of support and labour etc) could well be critical.
19
Other Local and Regional Initiatives In many spheres, recent months have seen the development of a number of initiatives by local and regional statutory and voluntary bodies. In places as diverse as Llanelli, Peterborough, Belfast, Selby, Boston, Wrexham, Coleraine and Wigan, local organisations, often working in partnership, have begun to confront the impacts and demands of A8 migrant workers.
In most cases, these initiatives focus on both the rights and needs of A8 workers and/or on issues of integration with local populations. They cover areas such as workers’ rights and welfare, education, housing (especially HMOs), training (including in the English language), community development and community safety.
The working groups or partnerships created to manage these concerns see participation by local authorities, local strategic partnerships, RDAs, the police, schools, Citizens Advice Bureaux, ASR support agencies, health authorities and primary care trusts, social services, Job Centre Plus, town centre managers, employers, trade unions, credit unions, voluntary services, MPs, political parties, and migrant community organisations. The report by Citizens Advice Bureau (2005) presents a range of these initiatives.
The increasing use of Language Line (http://www.languageline.co.uk/) by local statutory and voluntary organisations eases some of the language issues. There are nevertheless questions of affordability with respect to Language Line and other interpreting services (Citizens Advice Bureau, 2005). Some advice agencies have employed interpreters or advisers from the migrant worker population, but this is only feasible in cases of substantial demand.
Other local and regional bodies have been proactive in identifying and pursuing opportunities presented by EU enlargement and the Worker Registration Scheme. Some have sought to facilitate recruitment from the A8 states; others have built stronger strategic partnerships on the basis of employing A8 nationals. Yet the evidence suggests that it is only a very small number of local and regional authorities which have actively pursued these opportunities to facilitate export promotion and creative partnerships between eastern and western Europe.
These kinds of initiatives, and research into them, are both patchy and uncoordinated, leaving major gaps in knowledge of UK A8 migrant worker communities and in their local and regional impacts and potential.

20
Modules B & C: Distribution of country of birth groups in 2001 & 1991 The migrant background: UK residents in 2001 who were born abroad This section of the report describes the results of analysing Population Census data to explore the geographical distribution across England of people born outside the United Kingdom (UK). The main emphasis of the work has been on patterns shown by data from the latest Census (which refers to the position as of 29 April 2001). An attempt is made to compare these patterns with the situation recorded by the 1991 Census but this is problematic, as is explained below. The 2001 Census dataset analysed here was taken from the univariate table on country of birth (UV08) because this provides data on the fullest list of countries. The analysis here is based on a selection of countries – or country groups – mainly those with at least 50,000 people resident in England at the 2001 Census but also including a number of additional countries of potential interest here (especially some from Eastern Europe). The full list of 47 countries of birth, or country groups (both of which are referred to here as CoBs), is shown in Annex 1 as the entries highlighted in bold where they are set within the full list of Table UV08 country of birth categories. The analyses here depend on calculating a location quotient (LQ) for each CoB in each area. What the LQ shows is the factor by which an area’s share of people in that particular CoB differs from the area’s share of England’s total population, indicating where the group has a greater, and where a lesser, presence than would be expected. In practice, the “expected” value is the area’s share of all people across the country. For any group, the equivalent area-by-area shares of that group across England are also worked out. Finally the area’s share of the group of interest is divided by the “expected” value viz: its share of everyone in the country. Values of over 1.0 show the area has a larger presence of this group than it does of the total population, whereas LQ values of less than 1.0 indicate that the group is under-represented in that area. Thus an LQ of 2.0 signifies that that area’s share of the national total of that CoB was twice the area’s share of England’s total population. Annex 2 reports the LQs at the level of the Government Office region, and then the 46 counties of England prior to the mid-1990s local government reorganisations (including former counties such as Avon, Cleveland, Hereford & Worcester and Humberside). These areas are here termed “1991 counties” because the analyses here are rooted in 1991 Census data as well as statistics from the Census 10 years later. Part of the process of contextualizing the impact of A8 arrivals in England is looking at how in-migrant groups have been distributed in recent years. Given the small size of some CoB groups, the Population Census – with its attempted 100% coverage of the population – is the only feasible source to use for this purpose, although this limits the analyses to full 10-year periods. On the other hand, it is important to recognize that the Census suffers from limitations as the basis for analysing trends over time (Annex 2 provides information on these data constraints). There were around 50,000 people living in England who had been born in each of Poland, Turkey and former Yugoslavia, but only 7000 born in Romania and barely 2,200 in Albania. For England as a whole, the largest increases between 1991 and 2001 are the 33,000 gain in numbers born in former Yugoslavia and the 26,000 gain in Turkey-born. Whereas most of these increases are due to immigration over the decade, the drop of over 11,000 in the number of Poland-born people will have partly been due to the death of Poles who moved to England
21
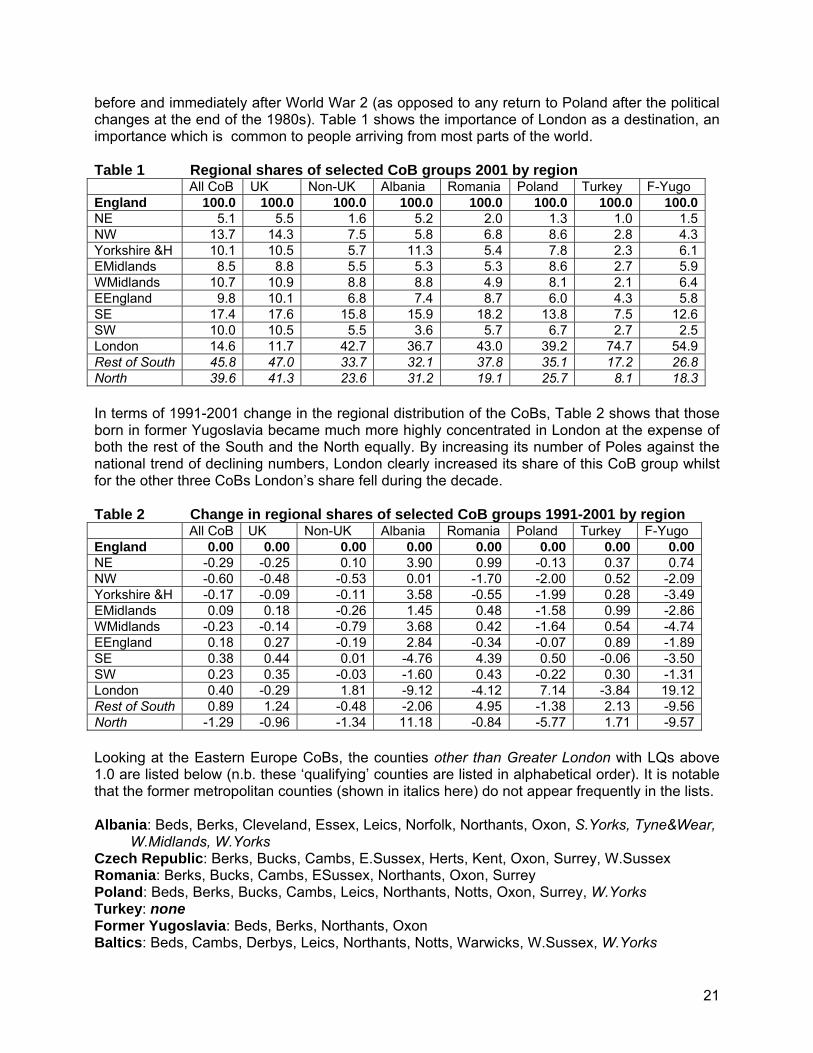
before and immediately after World War 2 (as opposed to any return to Poland after the political changes at the end of the 1980s). Table 1 shows the importance of London as a destination, an importance which is common to people arriving from most parts of the world. Table 1 Regional shares of selected CoB groups 2001 by region All CoB UK Non-UK Albania Romania Poland Turkey F-Yugo England 100.0 100.0 100.0 100.0 100.0 100.0 100.0 100.0NE 5.1 5.5 1.6 5.2 2.0 1.3 1.0 1.5NW 13.7 14.3 7.5 5.8 6.8 8.6 2.8 4.3Yorkshire &H 10.1 10.5 5.7 11.3 5.4 7.8 2.3 6.1EMidlands 8.5 8.8 5.5 5.3 5.3 8.6 2.7 5.9WMidlands 10.7 10.9 8.8 8.8 4.9 8.1 2.1 6.4EEngland 9.8 10.1 6.8 7.4 8.7 6.0 4.3 5.8SE 17.4 17.6 15.8 15.9 18.2 13.8 7.5 12.6SW 10.0 10.5 5.5 3.6 5.7 6.7 2.7 2.5London 14.6 11.7 42.7 36.7 43.0 39.2 74.7 54.9Rest of South 45.8 47.0 33.7 32.1 37.8 35.1 17.2 26.8North 39.6 41.3 23.6 31.2 19.1 25.7 8.1 18.3 In terms of 1991-2001 change in the regional distribution of the CoBs, Table 2 shows that those born in former Yugoslavia became much more highly concentrated in London at the expense of both the rest of the South and the North equally. By increasing its number of Poles against the national trend of declining numbers, London clearly increased its share of this CoB group whilst for the other three CoBs London’s share fell during the decade. Table 2 Change in regional shares of selected CoB groups 1991-2001 by region All CoB UK Non-UK Albania Romania Poland Turkey F-Yugo England 0.00 0.00 0.00 0.00 0.00 0.00 0.00 0.00NE -0.29 -0.25 0.10 3.90 0.99 -0.13 0.37 0.74NW -0.60 -0.48 -0.53 0.01 -1.70 -2.00 0.52 -2.09Yorkshire &H -0.17 -0.09 -0.11 3.58 -0.55 -1.99 0.28 -3.49EMidlands 0.09 0.18 -0.26 1.45 0.48 -1.58 0.99 -2.86WMidlands -0.23 -0.14 -0.79 3.68 0.42 -1.64 0.54 -4.74EEngland 0.18 0.27 -0.19 2.84 -0.34 -0.07 0.89 -1.89SE 0.38 0.44 0.01 -4.76 4.39 0.50 -0.06 -3.50SW 0.23 0.35 -0.03 -1.60 0.43 -0.22 0.30 -1.31London 0.40 -0.29 1.81 -9.12 -4.12 7.14 -3.84 19.12Rest of South 0.89 1.24 -0.48 -2.06 4.95 -1.38 2.13 -9.56North -1.29 -0.96 -1.34 11.18 -0.84 -5.77 1.71 -9.57 Looking at the Eastern Europe CoBs, the counties other than Greater London with LQs above 1.0 are listed below (n.b. these ‘qualifying’ counties are listed in alphabetical order). It is notable that the former metropolitan counties (shown in italics here) do not appear frequently in the lists. Albania: Beds, Berks, Cleveland, Essex, Leics, Norfolk, Northants, Oxon, S.Yorks, Tyne&Wear,
W.Midlands, W.Yorks Czech Republic: Berks, Bucks, Cambs, E.Sussex, Herts, Kent, Oxon, Surrey, W.Sussex Romania: Berks, Bucks, Cambs, ESussex, Northants, Oxon, Surrey Poland: Beds, Berks, Bucks, Cambs, Leics, Northants, Notts, Oxon, Surrey, W.Yorks Turkey: none Former Yugoslavia: Beds, Berks, Northants, Oxon Baltics: Beds, Cambs, Derbys, Leics, Northants, Notts, Warwicks, W.Sussex, W.Yorks
22
Former USSR in E Europe: Berks, Cambs, E.Sussex, Notts, Oxon, Surrey, GreaterManchester, W.Yorks
Other E Europe: Beds, Berks, Bucks, Cambs, E.Sussex, Herts, Oxon, Surrey (Maps of LQs for CoBs of particular interest were included in the Interim Report of this project.) A classification has been developed here to group together CoBs with similar patterns of LQs across the 46 counties. The groupings are arranged so that groups adjacent to each other in the listing are more similar to each other in their geographical patterning across England than they are to groups further away from each other. • Pakistan • UK, Channel Isles and Singapore • India, Kenya • Bangladesh, Jamaica • Turkey, Nigeria, Somalia, Sri Lanka • Albania, Italy • Cyprus, Iraq, Portugal, South America • Caribbean excl Jamaica, former Yugoslavia • Greece, Iran • Republic of Ireland, Baltics, Poland, USSR-Europe, China • Japan • Australia, New Zealand, Spain, Romania, E Europe Other, Malaysia, Hong Kong, Czech
Rep, South Africa, Zimbabwe Note that this classification is based purely on the geographical distribution of CoBs across the 46 county areas: thus it takes no account of CoBs’ migration history or personal characteristics. It is unfortunate, in relation to the latter, that very little information is available by CoB in the published 2001 Census tables: just gender, broad age, and ethnic group. The result is that great emphasis here has to be placed on characteristics which can be ascribed to CoB groupings due to their locational patterns, with the analyses from here on helped by the greater precision provided by shifting from the country scale to 350+ local authorities (LAs). Following on from this classification, the research has selected certain CoB groups for the next stage of the analysis. From one end of the spectrum which the classification presents, the three South Asian groups – India as well as Pakistan and Bangladesh – need to be included because of their substantial contribution to the English population overall. From the other end, the very different migrant groups from Australia and South Africa can provide valuable insight into the locational behaviour of groups who are more likely to be transitory rather than aiming to settle. People from Hong Kong are known to be particularly widespread geographically, whereas this may be probably much less true of the Turkish CoB group so these two groups provide a good contrast for the analyses. Spain and Greece are two relatively recent entrants into the EU and thus useful points of reference to the A8 countries: Cyprus has entered at the same time as the A8 countries but its long links through the Commonwealth make it another contrasting case. Finally the A8 countries of Poland and the Baltic States can be included too although, of course, the people who are represented in the 2001 Census data may have been migrants 50 or more years ago. If a group is distributed in a way which leads to LQ values of exactly 1.0 in all areas then it would be exactly mirroring the distribution of the total population, and so would not be clustered at all.

23
Any deviation of values away from 1.0 (whether of higher or of lower values) can then be seen as positive evidence of clustering. The measure of the clustering of a group which is used here is the average, across all areas, of the deviation from 1.0 in the LQs for that group. Thus higher values of this measure indicate higher levels of clustering, in that they are showing a high level of difference between that group’s distribution and the distribution of the total population. One important difference between groups is the extent to which they are concentrated in and around London specifically, and in more urban areas in general. This has been examined here by comparng the LQs for any group against the CURDS Urbanisation Index which is the most policy-relevant measure of areas’ relative urbanisation (Coombes and Raybould, 2001). The form of comparison used is correlation analysis, which assesses how far two variables ‘move in parallel’ in the sense that areas which have high values on one variable will also tend to have well above – or indeed well below – average values on the other indicator. Correlation values (referred to as “r” in all cases) range between -1.0 and +1.0 as follows:
if r is not much higher than -1.0 then the two variables are negatively related, so that an area with a high value on one variable is likely to have a low value on the other;
if r is close to 0.0 then the two variables are not closely related in the pattern of their values across areas;
if r is not much less than +1.0 then the two variables are positively related, so that an area with a high value on one will tend to also have a high value on the other (and low values will also tend to be found in the same areas). In this way, if a group’s LQ values are positively correlated with Urbanisation Index values then the group tends to be over-represented in more urban parts of the country. Finally an equivalent correlation-based analysis has been carried out to look at whether the geographical distribution of groups suggests that they are ‘following jobs’ in their location. The employment rate of areas is used to indicate where labour markets are tighter, and so a positive correlation with LQs is found for groups which are over-represented where there may be skill shortages, and more available jobs locally. On the other hand, if there is a negative correlation between the group’s LQs and local employment rates then the group is more over-represented in areas where job opportunities are more scarce. Figure 1 shows the correlation values, and the clustering measure, for the selected CoB groups discussed earlier. The sequence of CoB groups is descending size order: the largest CoB group in the 2001 Census data used here was the Indians and the smallest those who were born in the Baltic States (Estonia/Latvia/Lithuania). It is immediately apparent that there are similar patterns of values for the three South Asian groups, although people born in India are the least – and the Bangladeshis the most – likely to be clustered in their distribution and to be living where job opportunities are more scarce. Of the groups who are included here because it was thought they may be more similar to the A8 nationalities, people born in either Turkey or Greece are the most similar to the South Asian groups in tending to be strongly clustered, with an emphasis on more urban areas, and in areas where employment rates are not so high. The groups whose distributions are most different to the south Asian groups were those who were born in South Africa and Australia: their distributions are not very clustered, they are not concentrated in urban areas, and they are most likely to be in areas with high employment rates and so probable still shortages. In between the two sharply contrasting types of groups identified so far are the CoB groups who are not strongly concentrated in either high or low employment rate areas. Most of these groups appear to be likely to live in more urban areas than average: this includes CoB groups from Hong Kong and from Cyprus (in the Commonwealth) and from

24
Spain and Ireland (in the EU). People born in the Baltic States or Poland who had migrated into England prior to the 2001 Census were distributed in a similar way across the country. Figure 1 2001 Census country-of-birth groups: locational factors
-0.25
-0.15
-0.05
0.05
0.15
0.25
0.35
0.45
India
Pakist
an
Banglad
esh
S.Afri
ca
Australi
a
HongKong
Cypru
s
Poland
Turkey
Spain
Greece
Baltic
States
corr
elat
ions
(bar
s)
0.4
0.5
0.6
0.7
0.8
0.9
1.0
1.1
1.2
1.3
1.4
clus
terin
g
Urban correlation Employment rate correlation clustering (LA)
Figure 2 summarises the above discussion in diagrammatic form and then sketches a typology as a result. To a large degree, the fact that the top-right of the diagram is vacant is due to the fact that high employment rates are relatively rare in English cities and so it is unlikely that any group would have to be distributed in a way which produces high correlations against both areas’ Urbanisation Index values and their employment rates. It is more possible to have modestly negative correlation values against these two characteristics of areas, because there is more diversity among very rural areas than there is among the large cities, so it is possible for groups which are located mainly in rural areas for those areas to have predominantly either low or high employment rates.

25
Figure 2 Typology of selected 2001 Census CoB groups according to locational factors
employment rate correlation
-0.10 0.15
negative neutral positive urbanisation correlation
urban-concentrated
Bangladesh
Pakistan India Greece
Turkey ? strong
scattered/dispersed
0.35
Poland(pre-A8) BalticStates(pre-A8)
Cyprus Spain Hong Kong
? slight
employment-linked
0.08
Australia South Africa
neutral or negative
BOLD = clustered @ > .8
The most distinctive type then is the one embracing the Australia and South Africa CoB groups; a relatively strong positive relationship with employment rates and little or no association with more urban or rural areas together with little clustering add up to an employment-linked spatial distribution in their case. The type with the ‘opposite’ characteristics includes the three south Asian groups plus Greece and Turkey: the key characteristics here include a locational pattern which is urban-concentrated and leads to the tendency to emphasise areas with lower employment rates. The third type features the Cyprus and Spain and Hong Kong CoB groups and is here termed scattered/dispersed because it has only weak values on all the three locational factors; this could either be due to a very even dispersion over the country or instead to a pattern which is so patchily scattered it is not significantly associated with either the urbanisation level or the employment rates of areas. Figure 2 has two central cells which separated to identify whether a group has a negative or positive employment rate correlation; that said, any group getting into either of these cells in this matrix must have a spatial pattern which is only very weakly correlated with area employment rates so to put weight on this distinction between the two cells would be unreasonable. As a result, the pre-A8 Poland and Baltic States CoB groups are probably best included with the scattered/dispersed type here. Table 3 summarises the typology which has been developed and set out so far in this report. The question which remains open at this stage is whether the typology needs to include a fourth type which would, in practice, cover groups occupying the lower-left parts of the above diagram (Figure 2).

26
Table 3 Summary of the typology based on locational factors as at 2001 Type Employment-rate Urbanisation Clustering CoB examples urban-concentrated low high high South Asian
groups; Turkey or Greece
employment-linked high low low Australia & South Africa
scattered/dispersed medium medium mixed Hong Kong; Cyprus; Spain; Baltic States (pre-A8); Poland (pre-A8)
27
Module D: Analysis of Worker Registration Scheme Data
The A8 migrants: Where From, Where To, and For What Jobs? This part of the report includes new and very detailed analyses of a Worker Registration Scheme (WRS) dataset which the Home Office kindly provided to the project. There is very little missing data among the fields, so although it is not a quality-assured National Statistics dataset the evidence is that it is robust to the spatial analyses carried out here. Each record has the following data items. Postcode District (PD)* of registration address Gender Date of Birth Nationality Job Title Job Description Outcome of Application Number of Dependents aged Under 16 Number of Adult Dependents The dataset was supplied in tranches – with one for each month of operation of WRS up to the end of June 2005 – so it was possible to infer the date of registration from this process. The date has been combined with the Date of Birth to calculate an age at registration. This process revealed a small number of registrants who were apparently under 16 but it turned out that almost all of these were cases where the registration date had been entered by mistake in the Date of Birth field. The problems with the dataset – which are few – are this type of coding error, rather than item non-response (ie. data fields left blank for some cases). The principal geographical process applied to the dataset was assignment of each case to the area of one local authority (LA). Two important approximations were involved in this process. The first is that the PD which is captured by the dataset relates to the address of the employer, or perhaps in some cases to the location of an agency. To some extent, broadening the analysis to LAs reduces the mismatch between this address and where the migrant is living.. The other approximation involved results from the necessary ‘best fit’ between the approximately 2000 PDs in England and the 354 LAs: many PDs straddle more than one LA but in practice each PD needs to have all its records allocated to the one LA which includes the largest proportion of the PD’s resident population. This is a conventional ‘best fit’ approach; although it introduces a degree of error into the analyses, the error is usually expected to be by and large self-cancelling (as well as being unavoidable with the given dataset). There were fewer than 5% of records which are unassignable to any LA by this process, showing the PD data to be less error prone than is often the case with postcode information. That said, it was necessary to spend some time on data cleaning so as to change records such as “B1O” to “B10” for example. The most challenging part of the data handling stemmed from the need to examine the types of job which in-migrants reported they are doing. As shown above, the data fields of value here are Job Title and Job Description: these fields were coded to classifications which meet the requirements of the WRS but do not match the Standard Occupation Classification systems for
* PDs are areas in which all the addresses have the same ‘outward half’ postcode (ie. the part of the postcode to the left of the space); examples of PDs include N1 NE1 NE11 S42 SW1P W1P

28
which other official labour market statistics are produced. This is a consequence of deriving statistics from an administrative dataset collected for a very specific purpose. For the published reports based on WRS data (e.g. Home Office et al 2005), a ‘look-up table’ must have been developed to aggregate these classifications to broader groupings, but no copy was made available when it was requested for the project. Further investigation led to the view that, in fact, this coding produces some rather implausible results, such as that in the Midlands 47% of all the A8 in-migrants work in Administration, Business and Management (Home Office et al., 2005). The necessary response has been to produce a new classification suitable for this research, although this has drawn attention to questionable coding within some of the data. For example, linking the Job Title and Job Description codings for in-migrants produces combinations such as the following: Other legal occupation – poultry catcher Magician – production worker Barrister – waiter (with the last case almost certainly explicable as an error in coding “barrista”). Linking the codings of these two data items for around 200,000 cases produced around 50,000 unique combinations, although this number was very much inflated through variation in spelling and formatting of essentially the same codings. After the data cleaning process, a preliminary set of 12 job types was produced, together with a relatively small unclassifiable category (for codings such as “other”). The share of A8 in-migrants to England who fell within these 13 types varied hugely, so to make the analyses more appropriate the coding system has been further grouped in ways which make the categories somewhat more even in their coverage of the in-migrant population. The decisions about which job types to group together and which to keep separate were based upon an understanding of which job types have similar skill levels, whilst analyses showing where the people in each group are registered was used to avoid combining types whose distributions across the country were very different. Table 4 shows the seven categories which were the outcome of this process.
Table 4 A8 in-migrant job types (May 04 – June 05)
A8 job type n
(England)%
totalinitial job groupings subsumed in this type
managers and (semi-)professional workers 3374 1.8
professional workers (e.g. lawyers); semi-professional workers (e.g. nurses, translators); managers (excluding those of small establishments where possible)
other office-based workers 8182 4.4
other office-based workers (e.g. clerks, call centre workers)
hospitality/leisure/retail/wholesale workers 57178 30.4 hospitality/leisure/retail/wholesale workers personal service and domestic workers 18232 9.7
domestic and cleaning workers; caring and personal service workers
mechanics and transport or construction workers 15159 8.1
engineers/mechanics transport workers; building and construction workers
manufacturing/process/other low skilled workers 57027 30.3
general manufacturing/process industry workers not listed elsewhere; unclassifiable (e.g. “unskilled workers”)
agricultural and food processing workers 28806 15.3
agriculture and related workers food processing workers

29
Before turning to the local and regional distribution of A8 in-migrants in detail, it is helpful to give an overview of their main characteristics so far as the WRS data allows these to be identified. Table 5 shows that the full dataset includes over 220,000 in-migrants across the UK as a whole. Over half were Polish — and another quarter were from Lithuania or Slovakia — whereas three of the A8 counties (Hungary/Estonia/Slovenia) together provided less than 1 in 20 of all cases. Table 5 also shows that this distribution by nationality has not changed greatly over the period covered by the dataset. The main change is that the initially very high proportion — given the country’s small population size — of Lithuanians has dropped a little. Table 5 Distribution of A8 migrants to UK by nationality: % by period Nationality May04-Aug04 Sep04-Nov04 Dec04-Mar05 Apr05-Jun05 totalCzech Rep 6.4 6.9 7.0 5.2 6.4Estonia 1.6 1.5 1.6 1.4 1.5Hungary 2.6 3.1 3.3 3.2 3.0Latvia 7.2 6.8 7.0 7.6 7.2Lithuania 18.1 13.2 13.4 13.6 14.7Poland 54.7 57.4 56.0 58.2 56.5Slovakia 9.3 10.9 11.6 10.7 10.5Slovenia 0.1 0.1 0.1 0.1 0.1total (column) 100.0 100.0 100.0 100.0 100.0
total (row) 28.3 23.9 23.7 24.0 100.0total (number) 62509 52824 52398 53056 220787
Table 6 reveals that well over 40% of the A8 in-migrants to England were women. It is not surprising to find that this proportion is very different for some job types: nearly two-thirds of the other office-based workers are women as might have been expected, whereas the very similar proportion of personal service and domestic workers (e.g. cleaners) is probably lower than may have been expected. The most extreme gender split is for mechanics and transport or construction workers who are massively more likely to be men than women. By comparison, variations between nationalities in the share who are women is much more modest. Table 6 reveals that the pattern is one which may well be purely coincidental, in that the largest nationality group (Polish) has the lowest proportion of women whilst the two smallest groups (Estonia and Slovenia) are among the three nationalities which have more women than men among their migrant inflow to this country. Table 6 Proportion of England’s A8 migrants (May 04 – June 05) who are women: % by job type, and by nationality Total 43.7 Poland 40.9managers and (semi-)professional workers 53.4 Lithuania 51.1other office-based workers 65.2 Slovakia 41.8hospitality/leisure/retail/wholesale workers 53.9 Latvia 48.6personal service and domestic workers 66.0 Czech Rep 46.8mechanics and transport or construction workers 7.2 Hungary 44.7manufacturing/process/other low skilled workers 35.8 Estonia 50.9agricultural and food processing workers 36.6 Slovenia 52.0 Table 7 turns to the geographical analysis of where the in-migrants have moved to within England and presents location quotients (LQs) of the regional distribution of each nationality group (n.b. there are nearly 188,000 cases which could be allocated to English LAs). The values in bold are those over 1.0 and these help to identify in which regions any one nationality seems to be ‘over-represented’ relative to that region’s total share of A8 migrants. The results indicate

30
that few nationality groups have location patterns which very differ greatly from those of all the A8 migrants, apart from the Latvians who have a strong presence in the East Midlands and Yorkshire & the Humber in particular.
Table 7 A8 migrants to England (May’04-June’05) by nationality and region: LQs [bold if LQ >1] Czech Rep Estonia Hungary Latvia Lithuania Poland Slovakia Slovenia
North East 1.46 0.97 0.63 0.84 1.77 0.83 0.79 0.84 North West 1.35 0.75 0.97 0.84 0.46 1.11 1.12 0.65 Yorkshire & the H. 1.04 1.09 0.62 2.18 0.72 0.89 1.30 1.23East Midlands 0.74 1.29 0.63 1.55 1.11 0.97 0.87 0.63 West Midlands 0.63 1.12 0.82 1.06 0.78 1.06 1.22 0.53 Eastern England 0.76 0.95 0.78 1.05 1.45 0.97 0.69 0.73 London 1.13 0.81 1.52 0.54 1.15 0.99 0.95 1.43South East 1.11 1.14 0.99 0.99 0.81 1.01 1.12 0.99 South West 1.12 1.06 0.88 0.72 0.81 1.07 1.06 1.29
total (n) 11636 2786 5838 13271 27800 106376 19919 216
Similar regional analyses have been carried out by gender and also on the much small number of A8 in-migrants who have dependents. The principal finding was that female migrants were slightly over-represented in London and, to a lesser extent, adjacent regions. Table 8 moves these analyses on to the LA scale, showing the 10 LAs with the highest LQs for each of these two groups, and also for both genders combined. Moving to the LA scale — and to produce LQs for the total A8 migrant population — the LQs need a different ‘base’ population to act as comparator. Given that the WRS records refer only to employed migrants, it was decided to use as the comparator distribution the number of people employed at workplaces in each LA (in the 2001 Census data). Table 8 thus shows that the 2,645 A8 migrants to Boston represent a share of the total A8 in-migrant flow to England which is 12.2 times higher than Boston’s share of all 2001 jobs in the country. All the 6 highest LQs are in the Fens region. Table 8 also shows that the same 6 LAs feature among the top 10 for female A8 migrants too, even though the regional analysis had shown that London was a more popular destination for females than for males. Table 8 Distribution of A8 migrants to England (May 04 – June 05) by LA: highest LQs
Total n LQ Females n LQ With depen. n LQ Boston 2645 12.2 Boston 963 10.1 Isles of Scilly 5 9.7E. Cambridgeshire 1694 8.1 S. Holland 809 6.7 Boston 79 7.7S. Holland 1959 7.0 E. Cambridgeshire 584 6.4 Peterborough 227 6.3King's Lynn & W. Norfolk 2756 5.8
King's Lynn & W. Norfolk 1213 5.9 Luton 178 5.3
Peterborough 3999 5.3 Peterborough 1634 4.9 Brent 172 4.8Fenland 1312 4.9 Luton 1388 4.5 Thanet 78 4.7Luton 3275 4.6 Fenland 519 4.5 Fenland 57 4.5Northampton 4123 4.4 W. Somerset 204 4.2 Slough 112 3.9Arun 1620 4.2 Arun 693 4.1 Haringey 97 3.9Herefordshire 2690 4.1 Kensington & Chelsea 1413 3.8 Corby 45 3.8
Table 9 presents the 10 LAs with the highest LQs for each of the A8 nationalities. For the larger national groups, Boston and other LAs in the Fens are still strongly evident (plus Boroughs like Brent and Barnet from London’s north and west). Maps of these national group LQ values at the LA scale were included in the Interim Report: here only a brief summary for each nationality –

31
in descending order of their numerical size – is presented because the mapping revealed that there are relatively few strongly distinct patterns.

32
Table 9 Distribution of each A8 nationality across English LAs (May 04 – June 05): highest 10 LQs Czech Rep Estonia Hungary Latvia Lithuania Poland Slovakia Slovenia
Barnet Corby Isles of Scilly Boston Boston E. Cambridgeshire Gravesham St. Albans
Boston Fenland Great Yarmouth
King's Lynn & W. Norfolk
King's Lynn & W. Norfolk Boston
S. Oxfordshire Hastings
Forest Heath N. Kesteven S. Kesteven Fenland S. Holland Luton Northampton Plymouth
Northampton Isles of Scilly Norwich S. Holland E. Cambridgeshire S. Holland Barnet Malvern Hills
Peterborough King's Lynn & W. Norfolk
Richmond upon Thames
E. Riding of Yorkshire Penwith Peterborough Peterborough Barnsley
St. Albans Herefordshire Brent Arun Fenland Northampton Chester Kerrier
Thanet Nuneaton & Bedworth Westminster Swale Castle Morpeth W. Somerset Boston
Tower Hamlets
Shepway Boston Barnet Calderdale Peterborough Arun Herefordshire Purbeck Brighton & Hove Penwith S. Lakeland Chichester Herefordshire Gedling Corby
E. Hertfordshire
Kensington & Chelsea Hastings
Kensington & Chelsea Breckland Gravesham Brent Daventry
Basingstoke & Deane
Poland only slight differences from the total pattern (due to providing over half of the total population of
cases), but some nuances such as the lower value for Derby
Lithuania more dispersed across agricultural areas; very few in midland and northern cities
Slovakia more dispersed across the south, including several fairly different areas
Latvia more dispersed across agricultural areas (e.g. Kent); fewer in London
Czech Rep more dispersed through the Home Counties; fewer in midland and northern cities
Hungary more dispersed through the South Midlands; very few further north
Estonia fewer in midland cities
Slovenia very distinctive pattern, but as this is due to this nationality providing only a tiny proportion of the total population of cases, this does not warrant much attention

33
Map 1 introduces the format which will be used for the mapping of A8 in-migrant job type groups, in this case showing the employment rates of LAs as a background to understanding where migrants might have been expected to gravitate towards. To help orientation, Region boundaries are shown along with 1991 County boundaries (n.b. current counties are not useful for mapping because in parts of the country like the former Humberside they are of uncertain configuration). In several counties, especially across the centre of the country, the main town of city can be readily picked out because it has a small area and it is shaded blue unlike the surrounding LAs. This pattern reflects the broad tendency for more urban areas to have lower employment rates, a pattern which can be seen starkly with the low values covering most London Boroughs whilst, by very clear contrast, many of the more rural LAs across the south together make up a swathe Map 1 Employment rates of English LAs (2004)

34
of areas with the highest employment rates in the country. The other parts of England where low employment rates are widespread are Merseyside and much of the North East region: these are areas with long histories of high unemployment so their low employment rates are unsurprising. Map 2 uses LQs to reveal the basic pattern of A8 in-migration to the country. Within the south, there may be a tendency for an inverse relationship between the LQs and LAs’ employment rates because there are many high LQs in London and mostly low values in the prosperous rural outlying LAs. Yet further north the high LQs are restricted to areas with intensive agriculture – most clearly towards the east – whilst there are low LQs in the North East and other northern areas with low employment rates. It is useful to summarise these patterns, as a bench-mark for Map 2 Distribution of all A8 in-migrants across English LAs (May’04-June’05): LQs

35
the following analyses of individual job types. Areas with high employment rates may have the most available jobs but these jobs and the
(high cost) housing there may be unavailable to in-migrants due to strong local competition. Areas with middling employment rates may be more feasible definitions for A8 migrants but
the level of inflow will depend on low paid jobs such as agricultural work being available. Areas with low employment rates are the least attractive to A8 migrants due to the scarcity
of jobs (n.b. the exception is London which is very attractive despite low employment rates). Map 3 provides the equivalent LQs for the slight majority of all A8 in-migrants who have come from Poland (n.b. a map of each nationality group was included in the Interim Report). In all the Map 3 Distribution of A8 in-migrants (May’04-June’05) from Poland: LQs

36
maps in the report, the shading categories are kept constant to aid comparability and certainly there is little difficulty in seeing a similarity between the distribution of Polish people and of the A8 in-migrants in total (Maps 3 and 2 respectively). Of course, the fact that people from Poland make up over half of the total made it more likely that their distribution and that of the total would not be hugely different, but this degree of similarity does not automatically follow. In fact much the same observation can be made in relation to the distribution of women in-migrants (Map 4). Once again a rather more distinctive pattern might have been expected – perhaps a notably lower concentration in the fens where the work is largely manual – but men and women are found to be going to much the same areas. Some southern coastal areas like Brighton and Folkestone have higher LQs for women in-migrants but the differences are really very slight. Map 4 Distribution of women A8 in-migrants (May’04-June’05): LQs

37
Figure 3 presents for A8 in-migrants, by nationality group, the equivalent analysis to that set out earlier for the CoB groups (Fig 1). The scales on the chart have been kept constant from the earlier analysis so as to allow a direct comparison of the values for A8 nationality groups with those of the CoB groups which were selected for study. The total A8 in-migrant flow proves not to be strongly clustered, and yet clustering proves to be a feature of every individual nationality (as well as of women among the total flow, who are also shown here). As before, the group size declines from left to right in the chart and this shows a clearly a tendency for the smaller groups to be more clustered as might have been anticipated. Neither of the measures using correlation analyses produces very strong values, so in summary this set of results suggest the distribution of A8 migrants does not fit very neatly with any of the three types of spatial pattern set out above (Table 3). This lack of congruence may well largely reflect crucial methodological factors: • the A8 migrants have (in most cases) arrived very recently; the locational data reports ‘where
they arrived’ and, in fact, a substantial number may have left subsequently, so the statistics are not reporting on a distribution at one point in time; by contrast
• the CoB migrants were all present on Census night in April 2001 and in fact many had been settled in this country for several decades, so their settlement pattern has taken shape over a long period.
Figure 3 A8 in-migrants to England (May 04 – June 05) by nationality: locational factors
-0.25
-0.15
-0.05
0.05
0.15
0.25
0.35
0.45
TotalA8
women
Poland
Lithuan
ia
Slovakia
Latvia
Czech
Rep
Hungary
Estonia
Slovenia
corr
elat
ions
(bar
s)
0.4
0.5
0.6
0.7
0.8
0.9
1.0
1.1
1.2
1.3
1.4
clus
terin
g (li
ne)
Urban correlation Employment rate correlation clustering (LA)
Figure 4 takes the information from the previous diagram and considers what it means in terms of the typology devised earlier when examining CoB group locational factors. For both the total A8 in-migrant flow and for all those who are women, the locational factors have indicated that none of the three types identified earlier provides a ‘good fit’ for the new ECE migrant arrivals. Most interestingly, the nearest to a match was offered by the pre-2001 migrants from Poland and the Baltic States; the key differences for the new in-migrants is that they are more clustered and

38
also less likely to be urban areas. This higher level of clustering may be partly due to monitoring a new inflow which, in time, may well disperse somewhat. The lower level of correlation with urbanisation is clearly fuelled by the numbers in agriculture and related activities, but whether this will continue to be a strong feature of the A8 groups’ spatial distribution cannot be forecast. Looking at the separate A8 nationalities, the differences were rather insubstantial (Figure 3). Bearing in mind that the A8 data can be seen to measure of flow, unlike the 2001 Census which is a ‘stock’ measure, it is probably unwise to place too much emphasis on fairly slight differences in correlation values based on analysing substantially different datasets. The implication is that the A8 migrants can perhaps be viewed as following a locational pattern which is not so very different from the relatively scattered/dispersed type associated with several CoB groups earlier. In fact, this type covered the pre-A8 location of people from Poland and the Baltic States whilst the A8 in-migrants from the Czech Republic and Slovenia – two of the nationalities who feature the most white collar workers among their number – are already distributed in much the same way as a result of their stronger focus on more urban areas. Figure 4 A8 in-migrants by nationality and the typology of locational factors
employment rate correlation
-0.10 0.15
Negative neutral Positive
urbanisation correlation
urban-concentrated
?
strong
scattered/dispersed
0.35
Czech Republic Slovenia
?
slight
employment-linked
0.08
all A8 in-migrants all A8 women
Poland Baltic States
Hungary Slovakia
neutral or negative
BOLD = clustered @ > .8
Map 5 presents the first results of the job type categorization of A8 in-migrants which has been carried out in this research. The first type identified here covers the 15% of A8 in-migrants who are working in either agriculture or food processing. Some of the latter activity occurs in towns and cities so urban areas ranging in size to Peterborough and even Leicester have high values. It seems likely that the high value for Westminster is due to employment agencies located there. Even within England’s more agriculturally-intensive areas there is here evidence that the pattern is influenced by decisions and factors specific to particular sub-regions: strongly contrasting levels of in-migration are found in adjacent LAs (examples range from Somerset to Lancashire).

39
Such very localised patterns raise questions about recruitment behaviour at the local level, which is why later in the report there are detailed case studies of contrasting parts of the country. Map 5 A8 agricultural and food processing workers (May’04-June’05): LQs
This observation of intra-regional variation perhaps applies even more strongly to the job type which includes manufacturing and related process workers (Map 6). Despite including over 30% of all A8 in-migrants this job type too has some very strong contrasts in the LQs of adjacent LAs. Reassurance that the job type successfully identifies workers in manufacturing derives from the very few London Boroughs with high LQs. High concentrations of these workers are instead found in agricultural areas like the fens – despite the exclusion here of food processing workers

40
– and several of England’s older industrial centres such as Bradford and Blackburn in the north, Stoke and Derby in the midlands and Luton and Ipswich in the south. In the Hull and north Humberside area manufacturing is near to a prime agricultural area and so the two location factors which appear to drive the location of people with this type of job come together. Map 6 A8 manufacturing and other low-skilled workers (May’04-June’05): LQs
Map 7 reports the distribution of the A8 transport and construction workers, plus people who are identifiable as doing other work with mechanical or other competencies. The inability to precisely identify occupation profiles with the available information results in this job type (like most here)

41
having a strong presence in the fens where most of the work will really be related to agriculture. This category of A8 in-migrants appears to have some very localised ‘hot spots’ ranging from Alnwick in Northumberland through Manchester and the industrial West Midlands to the cities of Bristol and Southampton among others in the south. Part of the explanation may lie with the recruitment by specific employers or agencies for particular job openings (e.g. bus drivers). Certainly the regional contrasts for this job type are less stark than many of the earlier analyses, with here much more of the variation occurring within regions (e.g. between adjacent LAs). Map 7 A8 transport/construction workers (May’04-June’05): LQs
Before moving on to the white-collar job types, there remains the personal service and domestic worker job type which includes jobs in care homes, for example. Map 8 reveals that this job type

42
is very heavily concentrated in or near London (n.b. to a small extent, this pattern may be being amplified by the lack here of a secondary concentration in the fens). There seems little doubt that this southern orientation will be fuelled by the difficulties of recruiting to such low-paid jobs in this part of the country where the labour market is tightest. The relationship between the distribution of this job type and employment rates would have been closer if these types of job opportunity had not already drifted away from the tightest labour market areas to some extent. Map 8 A8 personal service workers (May’04-June’05): LQs
Map 9 shows the distribution of the large numbers of A8 in-migrants who have less well paid white-collar work (including jobs such as manager of a small shop, where this level of detail was available in the data). Workers in the hotel and catering trade are also included, producing some

43
local concentrations in many report areas – such as Brighton and Blackpool – although others like Bournemouth and Yarmouth are not affected similarly. Apart from the now-familiar clustering in London there is only Manchester of the other large cities with a notably strong concentration of A8 in-migrants in this job type. The other high values are often found in medium-size cities within regions where labour markets are tighter; examples range from Peterborough and Northampton to Oxford and Reading across the prosperous southern regions. Map 9 A8 hospitality/retail workers (May’04-June’05): LQs
The second-last job type covers the white collar workers in office jobs such as call centre operators and clerical or secretarial staff. Map 10 echoes the patterns already seen of high levels in the fens and inner/west London along with low values across most of the midlands and

44
the north. The far south west here also has very low values, which is not like the pattern for all A8 in-migrants (Map 2). In part this reflects a more general pattern of very low values in the more peripheral areas with few larger settlements, because similar low values are common across East Anglia and Lincolnshire away from the fens themselves. The area with many low values which does echo the distribution of all A8 in-migrants is found in the former coalfield and textile towns straddling the southern Pennines (from mid Lancashire to north Derbyshire). Map 10 A8 lower-paid office workers (May’04-June’05): LQs
The final job type category embraces all who have succeeded in gaining jobs which either require substantial qualifications – that is, professional or semi-professional posts – or are managerial positions and so likely to be quite well paid. This job type has by some way the

45
smallest share of all A8 in-migrants and so their spatial distribution across more than 350 LAs must be interpreted with some caution due to small number variability. Map 12 does, even so, provide some evidence consistent enough to be taken as robust, such as the high concentration of this job type in the same inner and western London Boroughs which are important locations for all A8 in-migrants (Map 3). Most of the north shows very low levels of inflow, but a few cities have high values (such as the main centres on the M62 corridor and Coventry in the midlands). Map 11 A8 managers and (semi-)professional workers (May’04-June’05): LQs
Figure 5 finally breaks down the A8 migrant flow using the job types devised for this research (n.b. here the groups are not ordered by their size but by their ‘skill level’). These results go some way to providing an important part of the explanation for the ‘neutral’ outcome of analyses

46
of all A8 migrants, and all those from any one country. In short, it appears that there are important differences between the in-migrants according to the types of job they have gained. The highly clustered agriculture and food processing job type is, not surprisingly, concentrated in the least urban areas; there is also no notable relationship to the level of the (all-sector) employment rates in areas. The two white collar job types are the next most strongly clustered, but in their case there is a clear association with urbanisation. The managers and (semi-)professionals also have a negative association with employment rates: this is consistent with these migrants filling vacancies which would otherwise remain difficult to fill as they are for people with reasonably high skill levels but are set in areas with depressed labour markets which are not very attractive to British-born higher-skilled people as places to live. The other job types, which in fact include the bulk of all A8 migrants, are found then to be ‘driving’ the results seen for the whole migrant inflow – and also for most of the national groups – because (a) they are not very strongly clustered, (b) they have just a slight emphasis on more urban areas in most cases, and (c) there is rather little consistent evidence that the in-migrants are going to high employment rate areas where the demand for labour might have been expected to be strongest. Figure 5 A8 in-migrants to England (May 04 – June 05) by job type: locational factors
-0.25
-0.15
-0.05
0.05
0.15
0.25
0.35
0.45
mana./prof. other office hosp.ty/retail pers.service trans./const. manufacturing agric./food
corr
elat
ion
0.4
0.5
0.6
0.7
0.8
0.9
1.0
1.1
1.2
1.3
1.4
clus
terin
g (li
ne)
Urban correlation Employment rate correlation clustering (LA)
Figure 6 finally returns to the typology of locational factors and looks at the A8 in-migrants within job types. In general, this analysis reinforces the earlier suggestion that A8 in-migrants are probably moving towards a scattered/dispersed pattern of distribution (although with their unusual emphasis on rural areas, in the first instance at least). The one distinctive result is that of managers and (semi-)professionals who are found more in areas with low employment rates. As this is by some margin the smallest job type numerically, the risk of over-interpreting results based on less reliable data has to be borne in mind and of course these patterns alone cannot provide an explanation of the spatial processes underlying them. That said, one possibility is that these A8 in-migrants are indeed helping to redress shortages of particular skills, because they are taking up hard-to-fill vacancies in those parts of the country where well-qualified people born

47
in Britain are less likely to choose to live (not least because they seek the advantage for their families of living in more buoyant labour markets). Figure 6 A8 in-migrants (May 04 – June 05) by job type: typology of locational factors
employment rate correlation
-0.10 0.15
Negative neutral positive
urbanisation correlation
urban-concentrated
?
strong
scattered/dispersed
0.35
manager/(semi-)prof. other office
transport/construction
personal service ?
slight
employment-linked
0.08
manufacturing hospitality/retail agricricultural/food
neutral or negative
BOLD = clustered @ > .8
48
Module E: Case Studies
Case Study Selection
At the commissioning meeting in August it was agreed that the two case studies would be illustrative rather than representative, but that there should nevertheless be some clear criteria for selection. It was also agreed that the case studies would be outside London, probably one in the north and one in the south, reflecting different labour market situations (tight/loose).
Avoiding London and the inner South East and those regions which already form the focus of case study research (cited above), the WRS analysis highlights a number of local authorities which could be selected for case study research. These can be grouped as follows:
East Midlands/East of England (Northampton, Corby, Peterborough, Bedford) North West (Chester, Crewe and Nantwich, Fylde) West Yorkshire (Bradford, Wakefield, Calderdale) West Midlands (Herefordshire, Wychavon, Stratford, Redditch) South (West Somerset, Penwith, Taunton Deane, Cheltenham, Southampton)
In the analysis of Census data (later in this report), the following counties have location quotients over 1 for key A8 groups (Poland, Czech Republic, Baltic States, Other Eastern Europe):
Bedfordshire Berkshire Buckinghamshire Cambridgeshire Derbyshire East Sussex Hertfordshire Kent
Leicestershire Northamptonshire Nottinghamshire Oxfordshire Surrey Warwickshire West Sussex West Yorkshire
This analysis showed where there were more significant eastern European migrant communities prior to the A8 countries’ accession to the EU: locating case study research in such areas would enable us to explore the changing position of these communities before and after EU accession.
The review of current policy initiatives (section 8 above), suggests that only a small number of local authorities have identified A8 migration as a particular policy challenge. Identifying case study areas amongst these authorities would enable us to engage more directly with interested parties (statutory and voluntary organisations).
The literature review has identified a number of key issues for further research. Before beginning the case study research, the most important issues which should be the focus for that research need to be agreed. On the basis of early literature reviews and some of the data analysis, we identified Bradford and Peterborough as possible case studies, subject to a preliminary mapping exercise.

49
Peterborough was chosen as a local authority which emerged as within the top ten local authority areas which high A8 migrant location quotients (see Table 8 above). This top ten is dominated, as we have discussed above, by rural authorities with significant concentrations of agricultural processing and packaging work. These regions have already been the subject of concerted academic and policy research (see, for example, Rogaly and Taylor, 2004; Winkelmann-Gleed and McKay, 2005, and the literature review above) and we were keen to place our focus on a less-researched urban authority which seemed to taking on a key role as a gateway to rural employment, with a concentration of employment agencies, statutory organisations and voluntary organisations engaging directly with A8 nationals and their community and labour market integration. Peterborough was identified as a productive illustration since its migrant in-flows are also putatively shaped by its proximity to London, its location of the mainline north-south railway connection and its direct and quick link to Stansted Airport, the destination of the vast majority of the UK’s low-cost flight connections to the A8 states (see Annex 3). We chose Bradford as a city with a post-war East European population and an existing set of integration and cohesion agendas, reflecting the presence of significant BME communities. However, in beginning to map the institutions and activities shaping A8 migration to Bradford, we failed to identify any particular policy initiatives, agendas or actors engaging directly with these issues. The overwhelming focus of relevant organisations was, perhaps understandably, on asylum seeker and refugee (ASR) integration. Whilst an early respondent at the RDA suggested that they were on the brink of considering the impact of A8 migration in more detail, we were not able to identify any obvious interview partners for the case study work. In Newcastle-upon-Tyne, however, whilst the number of registered A8 workers is limited (approximately 350), it is clear that the city council is starting to grasp the challenge of A8 migration directly. The city’s external affairs division has commissioned its own research with migrant workers themselves with a view to establishing structures to support in-migration. This has been stimulated by a notion that A8 migration may be one route to confront the city’s and region’s declining population and skills gaps, in part reflecting the conclusions of a recent Comedia report,3 that “the interface between policies influencing immigration and policies concerned with regional disparity and development has barely been explored yet” and recognising that competitive cities “embrace their diversity as a motor for growth and innovation”. In addition, Northern TUC is actively researching the changing ethnic make up of the region’s workforce and has identified A8 migrants as a distinct group within this, the city’s JobCentre Plus has been working on a technical assistance programme with a Polish urban labour office and a range of bottom-up initiatives within the new A8 migrant communities to support workers arriving in Newcastle (see, for example, http://www.ncl.to.pl/) have been established. In short, the fact that a range of agencies and actors in Newcastle are proactively and positively engaging with the impacts of A8 migration meant that we shifted the focus of our second case study to Newcastle, which offered a very useful opportunity to explore developing policy initiatives and a strong contribution to our scenario development. In switching to Newcastle, we perhaps lost the extensive experience of integration and cohesion agendas of Bradford (though these are of course also evident in Newcastle), since in Newcastle
3 Comedia, 2005, The Intercultural City: Making the Most of Diversity: A Study for One NorthEast into the Attraction and Retention of Migrants to Tyne and Wear City Region.

50
the pre-accession east European communities are smaller (though also still present). Nevertheless, the gains achieved by working in and with a set of statutory, voluntary and community organisations engaging directly with the A8 migration agenda have outweighed the losses. Moreover, the Peterborough case study – with its very different geographical location and economic structure – has offered a clear point of contrast and comparison for a Newcastle case study.
The Case Studies
Having agreed the case study city-regions, we then proceeded to map the local institutional terrain, identifying the organisations – private, public and voluntary sector – to be targeted for interviews (see below). The research days dedicated to the case study work inevitably limited the number of interviews undertaken and led us to focus our attentions slightly differently in the two case study regions. To a considerable extent, this reflected not only the differential impacts of and responses to A8 migration in Peterborough and Newcastle and the rationale for selection identified above but also our desire to adequately cover a range of policy issues. As a result, although both case studies cover institutional, labour market, service provision issues, the balance in coverage is different. In Peterborough, we have developed the material on housing and community integration whilst in Newcastle, we have expanded the discussion of labour markets and regional development. It is worth reiterating that this reflects the differential importance of these spheres, as identified by interview partners and broader documentary analysis.

51
Interview Mapping
General Labour Markets Enterprise/ Economic Development
Housing/Service Provision
Community Cohesion
Regional RDA Regional TUC Regional Housing Board
voluntary organisations networks
GO Regional Skills Sector Skills
Agency
Sub-Regional sub-regional partnerships
Learning and Skills Council
employers’ organisations (CBI, Chambers of Commerce, employers’ federations)
Strategic Health Authority
Local City Council Job Centre Plus City Council Economic Development Department
City Council Housing and Social Services Departments
community groups: host population
training providers (FE colleges)
employers’ organisations (CBI, Chambers of Commerce, employers’ federations)
housing associations
community groups: migrant populations
employment agencies
enterprise agencies
primary care trusts
local media
Small Business Service/Business Link
churches
Citizens’ Advice Bureaux
New Deal for Communities voluntary organisations: workers’
rights; migrants’ rights; homelessness
Within the two case studies, we focused not only on local – urban – organisations and agencies but also those acting at sub-regional and regional scales. It was clear in reviewing the literatures (Module A) and in mapping the two cities that many of A8 issues identified needed to be considered at a scale beyond the city itself. As we will see below, the question of scale in documentation and management of A8 migrant workers is very important. The final list of participating organisations was as follows: Peterborough Citizens Advice Bureau Communication Worker’s Union East of England Regional Assembly East of England Development Agency
52
Government Office for East of England JobCentre Plus Peterborough New Link Project One Call Recruitment St Peter and All Souls Roman Catholic Church Southern and Eastern Trades Union Congress Sure Staff Recruitment Williams Labour Services Newcastle-upon-Tyne Arbitration and Conciliation Advisory Service (ACAS) North “BusCo North East” Engineering Employers Federation (EEF) EURES (European Job Mobility Portal)/JobCentre Plus North East Jobs through ESOL and Training (JET-ESOL) Learning and Skills Council Tyne and Wear Newcastle City Council North East Assembly North East Chamber of Commerce North East Employee Relations Forum Northern Trades Union Congress One North East: Regional Development Agency Polacy w Newcastle (www.ncl.to.pl) Prime Time Recruitment Regional Language Network

53
Newcastle upon Tyne
Newcastle upon Tyne City-Region Newcastle upon Tyne is the principal city of the North East region of England. The city itself lies on the north bank of the river Tyne with a population of 260,000, but the population of the wider built up area is over 1 million. Although not formally defined, there is increasing agreement on the identification of Newcastle as a broader functional city-region. The city region is based on the travel to work area for Newcastle and the Tyne and Wear conurbation (see map). This area of 1.65 million people, reaches out into the smaller towns and rural areas in Northumberland to the north and Durham to the south. As such Newcastle is the centre of the sixth biggest conurbation in the UK. In Northumberland there is a core industrial zone in the South East (Blyth Valley and Wansbeck) that has very strong links into the conurbation. Castle Morpeth and Tynedale are more rural areas but with small towns and villages with strong commuting links into Newcastle. To the south, the districts of Derwentside, Chester-le-Street and Durham have very strong interactions with the conurbation, with some parts having development that is physically coterminous with the built-up area. Easington also has very strong links with Sunderland and could be included in the city region, although the southern part of the district also has very close links into the Tees Valley city region. The population of the city region is concentrated in the riverside communities that were originally developed to serve the traditional industries of the North East- mining, shipbuilding, steel and heavy manufacturing. By contrast Northumberland contains some of the most sparsely populated rural areas in England and contributes 15% of the population of the city region but over two thirds of the land area. There is considerable variation

54
within the region in terms of economic activity with areas of relative prosperity contrasted with severely deprived communities. There have been enormous changes in the industrial profile of the Newcastle city region over the past 50 years with the virtual elimination of the more traditional industries of mining and heavy engineering. There has also been a fundamental reduction in employment in the agricultural sector over the past few decades with the sector currently accounting for only about 1% of employment. However manufacturing remains important to the regional economy and a number of industrial sectors have remained productive – notably chemicals and metal sectors. Inward investment has contributed to a considerable diversification of the economic base into new areas such as microelectronics, the offshore industry, pharmaceuticals and biotechnology, and automotive assembly. The recent growth in foreign owned branch plants has, however, failed to compensate for the closure of UK-owned branch plants over the same period. Although the region does not have a particularly strong financial and business service sector some of the losses in the primary and secondary sectors have been offset by jobs gained in the services sectors with a particular concentration of service sector jobs in Newcastle. In addition nearly 30% of the employment in the city region is concentrated in public administration, education, health and social work. Overall though the North East region performs poorly on most economic and social indicators – low GDP, low innovation and entrepreneurship, low education achievements, poor health etc. In 2003, GVA per head4 in the North East stood at 80% of the national average. Furthermore, the productivity gap between the North East and the rest of Great Britain widened throughout the 1990s. Since 2000, North East GVA per head growth has been slightly above the national average suggesting a possible narrowing of the productivity gap. Here, relatively more of the North East’s economic growth has taken place in Tyne and Wear, despite continuing to lag the national average. Worker Registration Data (May 2004 – June 2005) Our analysis of the WRS data illustrates the very weak role played by the North East region as a destination for A8 migration within England. By mid-2005, only 2084 A8 migrants were registered with employers (or agencies) in the North East. In absolute terms, the North East accommodated the lowest numbers of A8 Worker Registrations 2004-20055. Using location quotient calculations, the data illustrates further that the North East (LQ = 0.23) is attracting a considerably lower proportion of A8 migrants than would be expected relative to the size of the region’s working age population. The Tyne and Wear metropolitan area accounts for 36.9% of migrant destinations within the North East. Whilst this urban centric pattern may be expected given the population and employment distribution of the region, the data also reveals important ‘pockets’ of migration beyond the confines of the urban core. For example, Castle Morpeth – a local authority area in Northumberland – has a higher level of WRS registered migrants than Newcastle city. Therefore,
4 GVA measures the contribution to the economy of each individual producer, industry or sector in the UK. At the regional level GVA is defined in terms of income, i.e. GVA equals the total income earned by individuals (e.g. wages) and corporations (e.g. profits) in the production of goods and services. GVA/head is calculated as GVA divided by the total resident population (One NorthEast, 2006). 5 The North East attracted just one sixth of worker registrations witnessed in the second worst performing region - Yorkshire and Humberside.

55
the findings suggest that the flows of migrants into the North East are best considered across and within the local, sub-regional and regional levels. The sub-regional geography of WRS data can be explained by the locational distribution of sectoral recruitment patterns. Just under half (44.7%) of A8 migrants are employed within manufacturing/process/other low skilled work. A further fifth (19.6%) are registered in occupations classified as hospitality/leisure/retail and wholesale. At the sub-regional scale, Tyne and Wear attracts the largest proportions of migrants working in service related activities, with over 50% of migrants registered in either hospitality/leisure/retail and wholesale (30.7%) or personal service and domestic work (21.1%). In contrast the majority of work undertaken in Northumberland (68.4%) and Co. Durham (58.2%) is registered as manufacturing/process/other low skilled activities. Despite the apparently low absolute and relative proportions of registered migrants flowing into the Newcastle city-region our case study evidence, as detailed below, suggests that A8 migration is an increasingly salient agenda across a variety of local and regional institutions. Strategy, Policy and Institutional Engagement The potential impact of A8 migration connects with a key theme emerging from the 2006 Regional Economic Strategy6 - migration and economic growth. The Regional Economic Strategy (RES) identifies two principle drivers of the North East’s current weak economic performance (as measured by GVA per capita), namely productivity (of those in work) and participation (employment rate). Strategies to improve skills and employment therefore play a fundamental role in achieving the region’s economic aspirations. In both cases, a key implication for change recognises that:
“The size and demography of our labour force means that in order to generate a step change, we should be looking to attract more skilled workers into the region from elsewhere.” (RES, p.30)
The emphasis placed upon increasing working age population through migration is reinforced by the particular demographic projections for the North East. The North East continues to experience net out-migration of younger skilled workers, compounding the region’s ageing workforce. Forecasts suggest that 40% of the region’s population will be aged over 50 by 2013 and that the North East will be the only English region to lose population over the next 2 decades, which
“Creates a greater imperative for the North East to attract in and retain its skilled workers, entrepreneurs and leaders to create a vibrant, globally competitive economy…Positive action in this respect is therefore vital” (RES, p.23)
At the city-region level, One NorthEast recently commissioned a report from Comedia to investigate the contribution of migration and cultural diversity to city-region competitiveness.7 Drawing inspiration from the Scottish Executive’s Fresh Talent Campaign,8 the report explored how Tyne and Wear could move from a traditionally non-diverse city-region to a locality that could attract and retain migrants. A multiplicity of economic, social and institutional barriers 6 One NorthEast, 2006, Leading the Way, Regional Economic Strategy 2006 (subject to DTI approval). 7 Comedia, 2005, The Intercultural City: Making the Most of Diversity: A Study for One NorthEast into the Attraction and Retention of Migrants to Tyne and Wear City Region. 8 Scottish Executive (2004) New Scots: Attracting Fresh Talent to Meet the Challenge of Growth (http://www.scotland.gov.uk/library5/government/afttm-00.asp).

56
requiring action were identified, ranging from weak qualitative and quantitative labour demand to local attitudes towards diversity. The report’s recommendations paid significant attention to targeting ‘high-skilled’ elements of potential in-migration, for example students and scientists, termed knowledge and business migrants. However, in terms of A8 migration the findings not only suggested that flows of migrants to the North East were low but that:
“…. only a small proportion of these new migrants to the region had better paid work…more typical jobs included care assistants: low paid work with unsocial conditions…. surprisingly large numbers of production plant workers…It seems disappointing that the region appears to have attracted a lower proportion of A8 migrants to work in jobs which were in administrative, business or management categories than has happened elsewhere (Comedia, 2005, p.42).
The report identified the weakness of the ‘demand side’ of the region’s labour market as the key determinant of low levels of A8 in-migration, a factor that has been largely responsible for the region’s low levels of in-migration more generally for many decades. Strategies to improve the flows of A8 migrants to the city-region were implicitly included within the report’s overall recommendations - ranging from overseas promotion to building a welcoming community. However, the dominance of low-skilled work undertaken by existing A8 migrants and how this connected with the overall emphasis on migration and competitiveness were not considered. Overall, these two policy documents contribute to the general concern of in-migration and retention. Neither report explicitly explores the role of international in-migration relative to domestic migration. Nevertheless, international migration - A8 migration in particular - is intricately connected to the overall emphasis of fostering population and labour force development. Against this contextual backdrop, several themes – specific to A8 migration – emerge from our case study analysis. First, our interviews reveal a common perception that the current evidence-base seriously underestimates the ‘real’ levels of A8 migration in the North East region. Interviewees provided details of sectors, firms and individual plants that appear indicative of a disjuncture between existing statistical sources (derived from WRS data) and estimates drawn from observations ‘on the ground’. Previous research in the North East has already voiced concerns over the low estimates provided by the evidence base,9 supporting the current views of many interviewees that the WRS data offers both a ‘gross underestimate’ (TUC Northern, Authors’ Interview 2006) and a ‘corrupt’ geographical dataset (Newcastle City Council, Authors’ Interview 2006).10 Explanations for the potential variance in estimates include the problems of tracking post-WRS movements within the UK, the existence of illegal non-registered workers or recent larger inflows not yet reported by the Home Office’s Accession Monitoring Reports. Crucially, however, the critical finding is not necessarily the degree of either under or over estimation, but instead that the perceptions and subsequent actions of policy makers are being moulded without a common and extensive evidence base. Whilst certain institutions operating at the interface of A8 migrant labour issues (e.g. ACAS, TUC Northern) are developing an awareness for the scope and scale of issues emerging, other institutions are working from data which suggest the number of migrants are “so small they have not been reported in the analysis, whilst we are seeing an increase now, in the past its almost been too small to matter” (Tyne and 9 Comedia, 2005, The Intercultural City: Making the Most of Diversity: A Study for One NorthEast into the Attraction and Retention of Migrants to Tyne and Wear City Region. 10 The inclusion of Yorkshire and Humberside in the categorisation of the North East in WRS data has led to the local media reporting North East estimates on the basis of a more larger geographical spread (Evening Chronicle, 12th May 2005).

57
Wear Learning and Skills Council, Authors’ Interview 2006). The potential dislocation between the evidence base and policy formulation hinders the accurate targeting of action (spatial; sectoral; skill-based etc.). In terms of policy prominence, differing forms and elements of the evidence base are already beginning to create alternate emphases, strategies and activities across the North East’s regional institutional support structure. For example, institutional perspectives ranged from being on the ‘radar but with no formal position as yet’ to agencies which are actively engaged in the fields of A8 recruitment, workplace and community (e.g. TUC; ACAS; JET-ESOL). Moreover, in terms of strategic themes, emerging policy discourses inspired by ‘Floridian’ (Florida, 2002) concepts of migration and the creative classes appear non-aligned with the emergent occupational and spatial labour market realities of A8 migration. Second, and partially reflecting the paucity of the evidence base, there remains a lack of connectivity between the strategies and approaches of institutional actors across both geographical scales (i.e. regional; sub-regional) and thematic fields (recruitment; skills and training; housing etc.). ACAS are driving a series of initiatives to develop a ‘joined-up’ approach to A8 migration labour market issues, drawing representation from – amongst others – the Regional Development Agency, the Learning and Skills Council, EURES, Job Centre Plus and a number of local labour intermediaries. A similar position was advocated by the TUC who are engaged in multi-level actions nationally and locally. Nevertheless, there remained a sense that “there are lots of people doing lots of different things but often in conflict with each other” (ACAS, Authors’ Interview 2006). Our findings suggest a lack of inter-agency connectivity - both in information and action. For example, institutions providing services in terms of housing and language provision appeared relatively unknown to certain agencies providing recruitment and workplace services. In particular, despite important synergies, there appears to be unfamiliarity between the roles of ‘formal’ public sector service providers and those of ‘third sector’ actors and agencies delivering community-based activities. In this sense, the region requires an institutional audit of service provision. The case study evidence also raised the need for a form of policy leadership at the ‘regional’ level, connecting migration to regional competitiveness, equality and diversity agendas. Pockets of A8 migration work exists across the region. The existing WRS data illustrates that, whilst flows concentrate on the Tyneside conurbation, institutional approaches need to better integrate local, sub-regional and regional scales. Moreover, key labour market issues and themes cut across spatial scales (e.g. workplace standards). Third, recent moves towards a joined-up policy approach is occurring in a context where “the market has led the way; private firms have dragged people in during the first wave after accession” (Newcastle City Council, Authors’ Interview 2006). Our findings reveal the overwhelmingly dominant role of private sector agencies in the recruitment and resettlement of A8 migrants. The agency base includes existing recruitment agencies developing new strands of activity but also new A8 specific agencies forming to capture the new market ‘opportunity’. For example, EURES North East – EU funded cross-border labour mobility network - estimate that only around 2% of A8 migrants entering work in the North East do so through the ‘formal’ EURES process (EURES, Authors’ Interview 2006). Therefore, it remains important that local and regional strategists and actors recognise that any attempts to develop effective forms of intervention (e.g. workforce development) must effectively negotiate the predominantly private sector agency-led model of recruitment and settlement. Finally, the attractiveness of Newcastle as a migration destination emerges as an important policy question. In different ways, most of our respondents recognised that very few A8 nationals were attracted specifically and directly to Newcastle itself. Instead, interviewees suggested that

58
migrants arrived as a result of jobs (or rumours of jobs), family and friendship networks, transport links (in particular the ferry connection from North Shields to northern Europe) and serendipity. The administrator of the Polacy w Newcastle website had arrived in Newcastle simply because he had previously been living in Hannover, had wanted to leave and had noticed direct cheap flights to Newcastle. It is suggested that many A8 nationals have arrived in Newcastle from London but increasingly that they are coming direct to Newcastle, by coach or by the growing number of low-cost routes which bypass London (from Poland to Glasgow, Edinburgh or Leeds or from Berlin to Newcastle). In this light, the expressed desire to attract diverse populations – including A8 nationals – to the city and region demands more consideration. If local and regional actors do wish to attract more in-migrants, how should they represent Newcastle’s attributes? Is this about the core city (Newcastle-Gateshead) or the wider region? Should local and regional actors be looking to attract migrants directly from the A8 states or from London and other UK regions? Labour Market and Skills Issues The evidence from our case study research appears to correlate with the findings of the recent Home Office Report into employers’ use of migrant labour.11 The Institute of Employment Studies report highlighted the importance of migrant labour in filling labour shortages in low-skilled positions of work, deemed unattractive to domestic workers (e.g. long hours, poor pay). In turn, migrant workers were perceived by employers as advantageous in terms of:
“their general attitude and work ethic. They tended to be more motivated, reliable and committed than domestic workers. For example, migrants were said to be more likely to: demonstrate lower turnover and absenteeism; be prepared to work longer and more flexible hours; be satisfied with their duties of work….” (Institute of Employment Studies, 2006, p.iv)
However, our case study evidence illustrates the importance of analysing the systems behind the labour market outcomes and how these processes fit into broader issues of regional development. Recruitment and the Role of Migrant Workers Several drivers of recruitment appear prevalent in the context of Newcastle and the North East. Certain strands of recruitment reflect skill-based labour shortages within the region. For example, some of the region’s demand for migrant workers reveals situations whereby “workers in this region do not have the skills needed in industries like hospitality, catering and NHS” (TUC Regional Secretary cited in Tomlinson 2005).12 In specific sectors, such as construction, a lack of local skills have triggered construction employers (both large and small) to recruit workers, predominantly male and Polish, either directly or through an intermediary such as a recruitment agency or EURES.13 Therefore, despite the Royal Institution of Chartered Accountants North East maintaining that the flows of construction workers into the North East remains very small compared to London and South East,14 Newcastle North’s MP Doug Henderson states that:
…in the direct work industry – house maintenance and, to some extent, house building – there is an ever increasing need to use skilled labour from eastern European countries.
11 Institute for Employment Studies, 2006, Employers’ Use of Migrant Labour, Home Office Online Report 03/06 http://www.homeoffice.gov.uk/rds/pdfs06/rdsolr0306.pdf). 12 Tomlinson, G., 2005, Region just the job for 6,000, Evening Chronicle, May 12th 13 TUC Northern and UCATT are currently undertaking research into the region’s construction industry and the role of A8 migrants. 14 The Journal, 2005, Foreign Influence Bridges Skills Gap, May 1st

59
The arms-length management organisation of council housing in Newcastle cannot meet the targets laid down by central government because of a shortage of labour or people who are prepared to train in those skills15
These sentiments were echoed from within Newcastle City Council (Authors’ Interview 2006):
Construction is a real problem, anecdotal evidence suggests skills shortages across all (occupational) levels… I know a guy who is setting up an agency in Poland now
Evidence cited by our interviewees also suggested small pockets of additional skilled recruitment in sectors ranging from public administration to welding and fabrication within maritime industries. Respondents were also keen to stress the roles of the hospitality, leisure, catering and care sectors as important destinations of migrant workers (EURES, Authors’ Interview 2006). In contrast, a large proportion of recruitment remains concentrated in low skilled work, focusing upon non-skill derived ‘hard to fill’ vacancies:
You have more employers now looking at lower skilled recruitment. Previously the sort of vacancies I would tender would be high specification jobs, hotel work, hotel management, welders etc. You would not get any food processing and manufacturing positions. But now employers are asking for these as first choice (EURES, Authors’ Interview 2006).
Indeed, the proportion of migrants recruited into low to semi-skilled manufacturing was commented upon by one multi-region agency as being distinctive to the North East:
Up in the North East, its manufacturing. One firm last year hired an EasyJet plane and flew a planeload of migrant workers in. This year it will be two plane loads. (It is) semi-skilled assembly work. They produce seasonal products which means they employ around 600 temps a year, they work 5-6 months per year… (ACAS, Author’s Interview 2006).
Both inside and adjacent to the Newcastle city-region, A8 employment within manufacturing is supplemented by low-skilled manual work in food-processing production and warehouse distribution activities. Therefore, whilst it is accurate to suggest that some work is being created by skills shortages, significant demand is derived from work in which “migrant workers …are the only ones prepared to do the jobs, many of which are minimum wage” (TUC Regional Secretary cited in Tomlinson 2005)16. In sum, the anecdotal evidence serves to reinforce the WRS analysis which suggests the greater proportion of recruitment is targeting hard to fill vacancies in the low skilled sections of the labour market. The extent to which these vacancies are ‘hard-to-fill’ based on shortages of labour or indeed skills - especially beyond low-skills - appears less convincing than the terms of pay, conditions, shifts etc. being unattractive to domestic workers. For example, the district of Easington represents one of the highest rates of unemployment and worklessness in the UK, however migrant workers are being attracted to Easington for work in low skilled functions (e.g. food processing). The agencies repeatedly identified and recommended by Polish migrants in Newcastle – Prime Time, Kelly Services and First Recruitment, amongst others – all focus on industrial and more routine service sector jobs across the Newcastle conurbation. The Newcastle agency interviewed recruits exclusively to industrial work, predominantly low-skilled packing and
15 Jacobs, B., 2005, Tyneside needs EU builders, Evening Chronicle, December 2nd 16 Tomlinson, G., 2005, Region just the job for 6,000, Evening Chronicle, May 12th

60
processing work, although there are occasional examples of more skilled employment in pharmaceuticals and other manufacturing sectors (Authors’ Interview 2006). This agency, based in central Newcastle, places workers in workplaces across the wider region – not only within the city, but in, for example, Blaydon, Gateshead, North Tyneside, and Northumberland, as far north as Jedburgh. For most workers, travel times are approximately 30 minutes. This reflects not only the specific geography of this agency’s clients, but also the regional geography of light industrial plants – property and land costs and space requirements are likely to lead to the location of assembly, processing and packing plants on industrial estates on the edges of the Newcastle conurbation or in semi-rural districts. In the Newcastle region, Consett, Team Valley and Cramlington stand out as areas of concentrated processing and packaging employment. None of these are actually located in Newcastle but all seem to draw workers living in Newcastle and employed through agencies based in Newcastle. Thus the geography of A8 nationals and their employment and residency is much more complicated than the WRS data allows us to understand and the challenge for integrating and capitalising on A8 migrant flows is of importance to more than just the core city. For this agency, A8 nationals have proved to be critically important in its expansion and development – both regionally and nationally. In Newcastle, A8 nationals now make up 60-70 per cent of the approximately 150 workers on the agency’s books. In part, it seems that these A8 nationals have displaced other workers – particularly workers from earlier migrant groups (Iraqis and Kurds were explicitly mentioned) but the agency has also used their success with recruiting and placing A8 nationals to expand their business, establish new client contracts and increase the numbers of workers they place in client workplaces. In one workplace, on the basis of recruiting A8 nationals, the agency has expanded its workers from 3 to 53 in just eight months. When these figures are extrapolated nationally, they become quite significant. This agency is part of a 126-branch national network which, it is estimated, now has around 20,000 A8 nationals on its books and placed in industrial workplaces. This demonstrates very starkly the role of agencies in shaping A8 labour and their contribution to regional and national economies. Recognising that EURES estimate only around 2% of migrant recruitment is captured by their services, the overwhelming majority of recruitment within the North East region operates either through employment agencies or direct forms of recruitment by employers. It is unclear why so few employers choose to utilise the free government service provided EURES and instead opt to take on the additional costs of a private sector agency. At one level, our findings indicate that the services offered by EURES may not be well known to the region’s base of employers and support institutions. At another level, many private sector agencies offer to absorb both the bureaucratic load of recruitment and the provision of worker accommodation (see Box 1). In many cases, agencies were acting as migrant workers’, such that the migrant worker remains an employee of the employment agency irrespective of the work conducted. This does offer some stability of employment and contract.17 However, several interviewees remain concerned over the rise of “shrewd operators” within the agency field, with anecdotal evidence of agents exploiting particular issues and vulnerabilities of A8 migrants. Whilst accepting that the working conditions for A8 migrants tend to reflect the workplace conditions of the sectors concerned, evidence also reveals less scrupulous employers (and/or agencies) that are exacerbating the vulnerabilities of migrant labour. Drawing upon case study evidence from Yorkshire and Humberside, ACAS relayed concerns of the growing pressures on A8 migrants to register themselves as ‘self-employed’ and therefore allow employers to modify rates of pay and conditions in line with individual negotiations. However, there is also considerable recognition of
17 This does however raise questions about the use of WRS data in tracking the profile and geography of A8 employment since the registration address will often not accurately reflect the place of work.

61
the good quality and standards of services provided by many recruitment and employment agencies in the region (EURES, Authors’ Interview 2006). In addition, several institutions are beginning to work together to identify and develop standards and benchmarks for employment of A8 migrants, for example the TUC and the Engineering Employers Federation. It is envisaged that a consortia of both employer and labour related organisations can develop a regional ‘code of practice’ for employment. Box 1: Employer Case Study: Bus Co. North East Triggered by a chronic shortage of bus drivers in the South East of England, Bus Co. developed a national strategy to ‘relocate’ drivers from Poland using a Polish based recruitment agency. In total, Bus Co. has ‘relocated’ 300 Polish Bus Drivers to the UK since 2004. During this period, a persistent shortfall in local recruitment began to impinge upon Bus Co. North East’s ability to obligate local service requirements. Consequently, Bus Co. North East entered into the parent company’ recruitment strategy and recruited 50 drivers from Poland. An agreement was developed between Bus Co. North East and a Polish recruitment agency through which: • Polish drivers subscribe to the recruitment agency’s 100 hours training package delivered in
Poland (includes language, customer service, operating systems etc.) • Bus Co. North East visit Poland for interview ‘event’ prior to the recruitment • The recruitment agency arranges for accommodation to be provided in host destination for
the first 6 months. Thresholds of rental payments are set at no more than 1/3 net income • Bus Co. pay the recruitment agency in four instalments for each driver: deposit; delivery; 3
months and 6 months Following recruitment and arrival in the North East, Bus Co. provided an extensive classroom based induction followed by 4 weeks of training with a driving instructor and 8 weeks with a mentor. Bus Co. also supported ESOL training for new recruits, engaging with local employment training pilot schemes and local colleges. However, differing levels of engagement and performance by the drivers has led Bus Co. to now deliver such provision ‘in-house’ through Trade Union Learning Representatives. The depth of induction and training provided by Bus Co. North East was recognised as exceeding the levels offered by other firms, despite such firms recruiting ‘directly’ without the use of an agency. Bus Co.’s induction programme to move migrant worker’s towards ‘work readiness’ extends for twice the duration required for a domestic recruit. Nevertheless, the combined costs of induction, recruitment and relocation were perceived as being insignificant relative to the costs of unfilled vacancies. Due to a reduction in labour shortages Bus Co. North East. are no longer actively recruiting from Poland. As such, the Polish recruitment exercise operated as a ‘project’, and would require the culmination of around ‘30’ unfilled vacancies to trigger a new and second round of recruitment. Bus Co. North East perceives the project to have been a success, with rapid integration into the workforce and high levels of performance. The company estimates that 50% of its migrant driver intake ‘are here to stay’, including several family-based resettlements, with the remainder being more transient in the short to medium term.

62
Finally, out with the practices of labour market intermediaries, an increasingly large proportion of recruitment is occurring through networks, contacts and word of mouth. These networks include direct marketing by North East firms in the A8 states but also the flows of job search information between existing migrants already in the North East and prospective migrant in the origin state. For example, several hotels within the city-region have utilised the social networks of first wave migrants to subsequently source ‘groups’ of A8 workers (see Box 2). This appears to be an increasingly preferred option of employers due to the reduction in the cost of agencies but also through the advantages of referrals and recommendations from existing valued members of staff. Word of mouth contacts also reinforce the role of key employment agencies with already-resident A8 nationals recommending employment agencies to new arrivals, and recommending fellow nationals to agencies (and employers). One industrial recruitment agency in Newcastle had established a workforce of some 100 A8 nationals (approximately 80 per cent Polish), largely on the basis of recommendation and referral from two Poles who arrived to work in mid-2004 (Authors’ Interview 2006). Existing or former employees regularly bring friends, family members or partners to the agency, and these groups are often placed in workplaces together. Workplace and Workforce Development The evidence gathered during the interview process restated the perceptions of A8 migrant workers cited within the media18:
I am surprised at the volume of people asking me to get workers from Poland, and it’s always Poland. You ask the employer why and they’ll say its reputation and word of mouth how good the workers are (EURES, Authors’ Interview 2006)
I’ve got anecdotal feedback where if you ask the Poles at 16.00 on Friday night if they can stay on for overtime there are no problems at all. All they have to do (as an alternative) would be go back home and wait until the next shift starts (ACAS, Authors Interview 2006). Feedback on migrants is very positive, they are dedicated and punctual (EEF, Authors’ Interview 2006). Some companies have the flexibility to come to their own conclusion about certain types of workers and stereotyping. Poles are known as being fantastically reliable (Newcastle City Council, Authors’ Interview 2006).
Our findings support those of the Institute for Employment Studies (2006) that illustrate the advantages to the employer of recruiting A8 migrants. The evidence also suggests a number of problems and emerging issues for employers, for example language barriers – especially written English – in maintaining health and safety within the workplace. Several instances have been reported of temporary misunderstandings and confusion within the workplace stemming from differing workplace cultures. In the case of one Newcastle recruitment agency, language and cultural barriers were often overcome by pairing an experienced, English-proficient worker with newcomers with weaker language skills (Authors’ Interview 2006). In a small number of workplaces, this agency had appointed Polish supervisors and team leaders, from amongst their more longstanding employees. Other workplaces, agencies and sectors have used cultural briefing services to facilitate workplace integration (see below).
18 Ford, R., 2006, “Oh the shame of it”: Workers from the East put Britons in the shade, The Times, 16th March; Tomlinson, G., 2005, “We’re not afraid of hard work”, The Evening Chronicle, 30th May
63
Both employer and employee attitudes to workplace integration were deemed – albeit anecdotally – as generally positive, although it was recognised that most interactions between the region’s institutions and employers tend to highlight only the best practice employers. Several interviewees made citations towards the odd “horror story” of undelivered pay and the reneging of worker entitlements etc. which emerge through reports to the Citizens Advice Bureau. The salience of these issues becomes more profound when employers also provide accommodation as part of the employment package, accentuating the vulnerabilities of the employer and migrant employee relationships. In these cases, the explicit links between workplace and home illustrate clearly how “things stack up differently for A8 migrants” (JET-ESOL, Authors’ Interview 2006) and the importance of a joined-up approach to understanding issues and implementing action. Box 2: Employer Case Study: Award-Winning North East Hotel – Matfen Hall One of the region’s most prestigious hotel and conference venues employs 16 members of staff from Poland, Germany, Romania and Philippines. Due to regional shortages, the hotel was forced to look overseas for chefs, waiters, kitchen porters and room attendants on short term contracts “We try to recruit locally whenever we can but it appears that our young people don’t want to work some of the anti-social hours and weekends which are a pre-requisite of the hotel and catering industry. We pay well above the minimum wage so I don’t believe money is an issue” (Director and General Manager) The Hotel has developed a free informal English course. Many of the migrants hold degrees and seek work-based training in their chosen field. Polish migrants live in accommodation provided within the nearby rural village and have a positive perception of being integrated into the community. Source: The Journal 2005, May 1st; Newcastle City Council, Authors’ Interview 2006 Indicative of the low-skilled functions performed by many A8 migrants, issues pertaining to workforce development, skills and training have to date received little attention. In terms of vocational skills, there were no suggestions emerging from our research that A8 migrants were unable to perform any workplace activities due to a lack of skills. Indeed, there were anecdotal suggestions that considerable numbers of migrants were over qualified and underemployed in their current work. The acceptance of underemployment by migrants either reflected a long-term plan to move into more suitable work or simply matched the objectives of an uncomplicated employment strategy to accrue good salaries relative to home nation. However, especially in the lower sections of the labour market, there are examples of (often extremely) poor English language skills. The North East region already performs poorly in relation to Basic Skills19, and therefore certain sections of migrant work are contributing a new and additional dimension to the region’s Basic Skills agenda. Several institutional responses are emerging within this context, although the coordination across the programmes is less clear. First, there are several case
19 DfES, 2006, Skills for Life: The National Strategy for Improving Literacy and Numeracy Skills (http://www.dfes.gov.uk/readwriteplus/bank/ABS_Strategy_Doc_Final.pdf).

64
studies of employers proactively providing access to English language training courses. These activities range from informal ‘in-house’ and non-accredited provision to a clear engagement with the region’s formal training programmes and providers. Bus Co. North East integrated English language training for their migrant recruits with the region’s Employer Training Pilot( ETP). The ETP, funded by the LSC, provided wage compensation to the employer for Entry Level 1 and 2 ESOL training. However, many migrants failed to meet the performance targets set by the funding criteria and therefore failed to trigger the wage compensation. Moreover, Bus Co. North East experienced considerable problems in accessing the funding they were entitled to and were forced to continue their provision of training directly through the local colleges without wage compensation. After 6 months Bus Co. North East decided to end their paid leave for English training due to the cost burden and also the expectation that the migrants should show independent commitment to learning outside of work provision. Instead, migrants’ training is no longer bespoke, instead sharing common employee access to Bus Co. North East’s TUC learning centre. In most cases, however, access to funding for training A8 migrants is related to the eligibility of the employer as opposed to the employee. The LSC perceive most of this support to be centred on language training, indicating an expectation that migrants already possess sets of work-place and vocational skills. At a broader level, the LSC are also keen to ensure that local employers give full consideration to recruitment and support for workforce development from within the local labour market before looking to migrant recruitment. Second, there are various forms of training programmes which are not dependent upon the participation of an employer, such as the Jobs through ESOL and Training (JET-ESOL; see box 3). This programme combines ESOL training with work-focused activities and recruitment opportunities. However, these programmes appear constrained by the instability and fluctuating nature of migrant work. Many of JET-ESOLs clients were engaged in fluctuating short-term employment, frequently moving between workplaces and reliant upon agency facilitation. Crucially, many migrants, including high-skilled individuals, were unable to balance employment with sustained training – effectively dropping their commitment to training when compromised with maintaining paid employment. Beyond recruitment and the static analysis of employment stocks, very little is known about the subsequent labour market movement of A8 migrants:
…for statistical purposes I will have migrants names etc. and confirmation that they have started work. After that I will ring the employer to ask if they are happy and that the migrant has settled okay. But it’s important to recognise that the migrants might be happy to be in work but it does not mean they are happy in their work. We are therefore keen to find out about the impacts and experiences further down the line of recruitment and employment process (EURES, Authors’ Interview 2006)
Our understanding of the medium-term contributions made by the migrants to the region’s labour market would be enhanced by being able to track employment retention, movement and transitions. Several interviewees raised the prospect of migrants using first destination employment as a stepping stone to a more advanced position within the labour market (see below). At the same time, there is also evidence of short-term migrant flows, albeit mostly anecdotal due to the problems of capturing return flows of migrants. Therefore, inward and outwards flows range from seasonal and holiday work periods (a few weeks to months), to long-term employment of over a year (Bus Co North East, Authors’ Interview 2006; industrial recruitment agency, Authors’ Interview 2006). Inter-regional migrant flows are also common, and establishing the role of the North East as an origin or destination of domestic ‘post-international’

65
migration flows is clearly important. For example, EURES’ jobs-portal website provides the CVs of A8 migrants who have been in the UK since 2004, and therefore a North East company could just as easily recruit a Polish welder from Blackburn as from Kraków. Connecting the Labour Market to Regional Development The connection between migration and economic growth represents a key driver behind the recent policy emphasis placed upon immigration in North East region (RES 2006). The evidence of the WRS data suggests that A8 migrant flows have been limited in scale and scope, with a high proportion of recruitment taking place in lower skilled functions. Our interview evidence lends considerable support to the limited scope of the skilled functions performed by A8 migrants. However, our research also suggests that the scale of migrant flows into the lower-skilled functions may be considerably higher than portrayed in the WRS data. To better understand these dynamics, the analytical emphasis must focus upon the ‘demand’ side of the labour market. It is widely accepted that the demand side within the region’s labour market is structurally weak and under performing.20 The structural characteristics of the North East economy – the historically high proportion of branch plant operations, relatively limited high-technology, knowledge-based and R&D activities, and the small size of the business service sector – act as a powerful influence over the character of skills demanded within the region. This lack of overall demand within the labour market is represented in the region’s poor record of employment growth. Consequently, the interaction of low employment growth with other labour market processes and economic drivers produces a reciprocating process whereby the inadequacies of the demand side feed through and produce comparatively poor supply-side performances. The concept of low-skill equilibrium was adopted by One NorthEast within the previous Regional Economic Strategy (2002), which suggested that the “crux of the problem is: low demand for advanced skills among employers dampens individuals aspirations to gain qualifications, develop new skills and seek advancement in their job”. The need to break out of the circular process has been identified as a key target in the move to a healthier and better performing regional labour market, especially in terms of raising skill levels and the subsequent link to enhanced regional competitiveness and social inclusion. The persistence of these policy objectives have been retained within the 2006 Regional Economic Strategy, albeit with the caveat of replacing the idea of skills ‘equilibriums’ with ‘trajectories’ to account for inter-sectoral variances. Indeed, current and forecasted problems of low demand for higher-levels skills, low representations of managerial and professional occupations and below average earnings for most occupations and sectors remain key challenges posed by the region’s demand side. The evidence of A8 migration into the region suggests that not only will the migration flows reflect the nature of demand, but may also sustain and perpetuate the demand side problem. Put another way, it is difficult to envisage how the current patterns of A8 labour migration to the region will lead to a progressive advancement of the demand side of the labour market. Some interviewees expressed a belief that many migrants would use first destination employment as a stepping-stone, accepting initial underemployment but with the ultimate aim of moving into a more suitable occupation when established in the host labour market:
… we seemed to pick up from our research that there is a transition type process going on, to gain experience and confidence of being in the UK and learning the language through an initial job, often lower skilled, and then actually trying to gain employment in
20 Stone I. and Braidford, P., 2002, North East Labour Market Study, commissioned by Regional Skills Research Network (NERU, Durham University); GHK/ CURDS, 2004, Regional Skills Foresight - Skills Scenarios for the North East, commissioned by Skills Intelligence North East.

66
field that they are actually more qualified for (Newcastle City Council, Authors’ Interview 2006).
Whilst anecdotal evidence exists of examples of such moves, this should not be overestimated in relation to the mixed aspirations and motives of A8 migrants (e.g. short-term financially driven work cf. longer terms commitments), the general skill profile of A8 migrants and most importantly the ‘demand’ side of the labour market. In the case of Newcastle, the degree to which existing flows of A8 migrants link to policy strategies which connect concepts of in migration to the promotion of research-led science and technology based growth, to date, remain unclear (Newcastle City Council, Authors’ Interview 2006). This question rests not only on issues of demand but also on the absence of structures which might facilitate the transition of A8 nationals into jobs which better utilise their skills and education. The absence of labour market intermediaries in this particular demand and (latent) supply relationship remains exacerbated by the fragmentation of policy engagement at the local level. A further problem hindering transitions within the region’s labour market is the potential for certain sections of A8 migration to become economically and institutionally ‘segmented’ within lower-skilled functions. Evidence of demand side segmentation is already occurring through the recruitment patterns of employers targeting the perceived advantages of the ‘work ethic’ of A8 migrants and their willingness to undertake certain roles and functions deemed unattractive to the domestic job seeker. On the supply-side, segmentation can also occur within the labour force when certain jobs and occupations become ‘associated’ with certain sections of the workforce, for example A8 migrants. However, the experience of Bus Co. North East suggests that the converse has occurred in terms of bus drivers, with - albeit circumstantial - evidence suggesting an overall reduction in absenteeism and an increase in levels of domestic job applicants following the recruitment of Polish drivers. The poor performance of the region’s labour market in stimulating employment growth is one possible explanation for the low levels of A8 migrant flows in the North East. However, the analysis presented earlier in this report (Module D) illustrates that there is no simple relationship between the size of A8 migrant flows and the strength of the destination labour market (i.e. A8 migrant flows are slightly more likely to be heading to poor performing, low growth labour markets). Although the flows of migrants to the North East are relatively small in number, they appear to be concentrated in ‘specific’ sectoral and occupational pockets of the labour market. Therefore, whilst the levels of overall labour market demand may be low, there are nevertheless pockets of demand where gaps in supply exist. An important implication of A8 migration maybe that migrant flows are responding to pockets of demand in low-waged, low-skilled and highly flexible work that exist because of the unattractiveness of the vacancies (i.e. non-skill dependent) to the local labour force. As such, further research is required into the extent to which A8 migrant flows may both reflect and perpetuate the circular dynamic between low-skilled demand and the characteristics of labour supply. Indicative of the region’s low-skill equilibrium, underemployment of A8 migrants may persist as long as migrants continue to be drawn into occupations and functions operating in cost sensitive low-value added sectors (e.g. food processing). A8 migrants are being recruited into sectors and functions with a tradition of weak investment in workforce development and up-skilling. More starkly, evidence from Yorkshire and Humberside illustrates the rise of a regressive form of flexible work driven by the interplay of employers’ recruitment and employment strategies; recruitment agencies; and the short-term money making aspirations of A8 migrants. Large swathes of the food processing workforce in Yorkshire and Humber are almost exclusively composed of migrant labour (not necessarily A8). In practice, a discrete segment of the labour market is beginning to form whereby the flexible terms and conditions offered by employers are sustained – almost exclusively - by the supply-

67
side of migrant workers. Put another way, several interviewees speculated around the extent to which A8 migrants are willing to price themselves into work, especially as many of the vacancies exist due to the local workforce being unwilling to do so. Under these local labour market conditions, non-competing sections of the supply side are being formed through the nature of demand. The articulation and playing out of these labour market dynamics remain open to conjecture, however they do represent some of the core concerns of our case study interviewees. In overall terms, the impacts of A8 migration on the North East labour market and its relation to regional development are not immediately clear in the limited timeframes and scales witnessed to date. Certainly it remains far from clear to what extent A8 flows are leading to a progressive movement in the region’s labour market. To date, evidence suggests A8 migrant flows are instead contributing to the sustainability of low-skilled, flexible and low-paid sections of work. Conversely, where potential exists to release underemployed migrants and realise the latent skill-base, interventions are needed to improve and configure the matching process of supply and demand. This will necessarily involve a raft of interventions, ranging from reducing languages barrier to helping migrant workers look beyond the exclusive routes into employment offered by certain recruitment agencies. Institutions such as EURES, TUC and JobCentre Plus appear to offer important roles in this process. Our research interviews also revealed concerns within several institutions over the sustainability of migrant labour. Similar to the findings of Institute for Employment Studies (2006), certain institutions are speculating that in several years’ time economic growth in home nations, and/or other EU states with open borders, will create altered migratory flows away from the North East. In this context, concerns are emerging over the extent to which current migrant flows are compromising longer-term workforce planning and development agendas by resorting to a ‘quick fix’, ‘sticking plaster’ and ‘short-term’ solutions to current gaps in the labour market. These notions appear to connect with what the media have crudely styled ‘they are taking our jobs’ debates. Whilst existing research suggests that A8 migration is not necessarily creating labour market displacement or unemployment,21 several interviewees raised the potential connections between A8 migration and other local labour market policy agendas. For example, despite a 3.5% rise between 1996 and 2004, the North East exhibits the lowest ‘employment rate’ of any English region, with only 69.4% of people of working age actually in work.22 The North East exhibits entrenched pockets of worklessness, nearly 1 in 5 of working age population claim state benefits relating to worklessness. A key regional implication of the Department for Work and Pensions Welfare reform agenda will be to assist large sections of the North East’s incapacity benefits claimants into work. The Northern Way programme has allocated £12 million to provide enhancements to the Pathways to Work strategies to bring a further 100,000 people currently on incapacity benefits into work by 2014. It is overtly simplistic to assume that large sections of the workless moving into work will be pitched into competition for entry levels jobs with A8 migrants. Nevertheless evidence appears to suggest that A8 migrants are currently filling pockets of unmet demand at entry level and it maybe reasonable to assume some elements of the current workless will seek transition into entry level occupations. Our interviews illustrated that elements of the region’s policy community are beginning to connect A8 migration with other regional labour market dynamics such as worklessness. Realistically, however, given the currently limited scale of A8 migration in the North East it would appear to have limited potential impact on the complexity of the worklessness agenda. Even so, connecting the roles and implications of 21 Gilpin, N. et al ., 2006, The Impact of Free Movement of Workers from Central and Eastern Europe on the UK Labour Market, Department for Work and Pensions, Working Paper No. 29 (http://www.dwp.gov.uk/asd/asd5/wp29.pdf). 22 Adams, J , 2005, A Full Employment Region, IPPR.

68
migration with other local and regional labour market issues remains an important field for policy research and strategy development. Community Integration and Access to Services In the sphere of community integration and access to services, policy and institutional engagement reflects the wider picture – understanding of and provision for A8 migrant workers’ housing, language, community and service (health, education etc.) needs tend to be weak and fragmented. As we have already noted, there is a particular disjuncture between labour market actors and those in spheres of service provision, but even within the latter sphere we see a largely reactive and piecemeal picture, with a small number of agencies – formal and informal – working hard to meet needs, provide support and raise the profile of A8 migrant workers. For agencies working with A8 workers, there were strong concerns about the lack of preparation in advance of accession, notwithstanding the fact that the date of accession – and its implications – were known well in advance. A key service provider in Newcastle explained how they were sent a very short Home Office document summarising rights and entitlements in the context of the Worker Registration Scheme and were called to attend a hurriedly-arranged meeting at Civic Centre. The focus of that meeting was not all A8 migrants but particularly those A8 citizens who were already in the UK as asylum seekers and whose status was to change overnight on accession (with implications for accommodation, benefits etc.). This agency felt there was no broader preparation for the consequences of A8 migrant flows. Organisations engaged with A8 migrants tend to fall into two categories – more longstanding agencies which have developed or switched their focus to cater for A8 migrant workers and newer organisations which have been established to cater specifically for the needs of A8 workers. In the former category, we can identify, for example, the JET-ESOL programme which has increasingly engaged with A8 workers in addition to its previous client group dominated by asylum seekers and refugees (ASRs) and settled immigrants groups (see box 3) and the Regional Language Network which is developing its work with A8 migrants to extend the profile of its language programmes in the region. This category clearly dominates. In the latter category, however, we can identify informal, emerging structures to support migrant worker communities, such as the ‘Poles in Newcastle’ (Polacy w Newcastle) website and forum.

69
Box 3: Case Study JET-ESOL The JET-ESOL scheme provides support for migrant workers seeking (predominantly) entry level employment. It also acts as an intermediary between migrant worker job seekers and employers/contractors. The kind of help it offers includes: help with application forms, interviews vocational training with ESOL support health and safety training
Many of these programmes were established for asylum seekers and refugees (ASRs) or for settled immigrant communities before the demand amongst A8 migrants materialised. There has consequently been a shift in focus from older to these newer migrant communities and they are currently developing new programmes with A8 migrants specifically in mind. The scheme is funded by a range of regeneration initiatives and has two sites – in the East and West Ends of Newcastle. About one quarter of its current clients are A8 migrants. Many of their clients belong to an earlier wave of asylum seekers (Roma from the Czech and Slovak Republics, Russian-speakers from the Baltic States) whose status changed on May 1st 2004. Thus they have very varied profiles, from frequent movers in very vulnerable labour market positions (especially amongst Roma) to the highly educated with strong English who are looking for substantive career development in the UK. Some are much more job ready than others. For more information: http://www.newcastle.gov.uk/educlibnew.nsf/a/ESOLJetProject?opendocument In spheres such as health, education and housing, the small numbers of registered migrant workers have meant that A8 issues rarely make it formally onto the radar of relevant statutory organisations. Nevertheless, the case study research has enabled us to identify some signs of growing engagement. The Health Authority has recently advertised for more interpreters with A8 language skills; SureStart in the west end of Newcastle is seeking to establish a group for Polish parents; and a Slovak employee of Your Homes Newcastle has become, by default, a first point of contact for housing queries. In this context, active organisations often find themselves playing critically important signposting roles in spheres well beyond their formal capacity – the JET-ESOL scheme, for example, had directed A8 workers to welfare education officers, health visitors, social workers, counsellors and psychiatrists. For many, however, access to these and other services were fairly straightforward. As the City Council noted: “We have done some little research into integration issues by asking migrants questions and there are pretty standards answers, yeah, we just registered and joined the library, the sports centre etc.” The City Council’s (as yet unpublished) research, primarily amongst educated white-collar migrant, documented some frustration amongst migrants in registering with doctors, opening bank accounts and finding accommodation, but few more significant problems. As we will explore in more detail below, however, whilst some migrant workers seem to navigate their new landscapes relatively easily, those in more vulnerable positions find it more difficult.

70
Housing In the sphere of housing, we identified relatively little evidence of accommodation being tied to employment (in contrast perhaps to more rural labour markets). Bus Co. North East arranged accommodation for its Polish drivers, acting as an intermediary between workers and landlords, but it left the workers themselves to negotiate with landlords after the initial six-month lease. Whilst this intermediary arrangement enabled the Poles to avoid the bureaucracies of bill payment, some increasingly became concerned about the cost of accommodation sought out cheaper alternatives. Others found their own accommodation when their wives and children joined them, an apparently increasingly important phenomenon. Despite the importance of family and friends in shaping migration flows, there did not seem to be any particular evidence of clusters of migrant workers within the city. As far as we can tell from anecdotal evidence and from discussions on the Polish web forum (see below), Poles in Newcastle are based across the city – Benwell, Cruddas Park, Jesmond, Gosforth, Heaton, Fenham, Denton Burn and Kenton, to name a few. Some respondents suggested a noticeable clustering in the west end (around Fenham), an area with a high proportion of private rental accommodation and where one or two new Polish shops are being established, but others noted more contact with A8 migrants in the city’s east end. The dispersal of migrant workers – and a lack of real data on their patterns of residency – makes targeted social provision difficult. Whilst it seems that the vast majority of A8 migrant workers in Newcastle are finding accommodation through the mainstream private rental market – and identify few problems – it was recognised that some migrant workers find themselves in particularly marginal housing markets, with other vulnerable social groups. Those with weaker language skills, insecure work and other vulnerabilities (such as children with health problems) tend, like indigenous populations, to cluster among other transitory and/or poor populations, in private accommodation (not the social housing sector) and in places where unsocial hours, multiple occupancy, high tenant turnover is not unusual (JET-ESOL, Authors’ Interview 2006). As elsewhere, there has been evidence of “hot bedding”, where one worker sleeps in the bed whilst others are out at work and swap on return, but this is anecdotal and certainly not a widespread phenomenon (EURES, Authors’ Interview 2006). There is also anecdotal evidence of homelessness within A8 migrant groups, and this indicates a concern specific to A8 groups – if workers have not been registered for 12 months, they have no entitlement to social housing other than in exceptional circumstances. Those exceptional circumstances are largely defined by the family status of the migrant, such that women with children seem to access much more support than single men (JET-ESOL, Authors’ Interview 2006). As a result, a small number of migrants “don’t have access to basic tenets of life and are refused access to the benefits system” (JET-ESOL, Authors’ Interview 2006). The apparent tendency for early migrants to be joined by their families or for more migrants to come as family groups suggests that the proportion of A8 migrants with, albeit limited, entitlements to benefit-related social services will grow. Social, Family and Community Networks In the absence of access to formal service providers, family and community networks take on greater significance, particularly amongst vulnerable populations. For JET-ESOL, a disproportionate number of their clients belong to an earlier wave of asylum seekers whose status changed on May 1st 2004. Many are in large adult family groups – contrary to the stereotypical depiction of the A8 migrant as a young worker travelling alone. In many of these groups, JET-ESOL reports that there is often one (often male) English speaker who mediates, facilitates and interfaces with agencies for the other family members. In a more general sense, a lot of ‘feet finding’ in Newcastle relies on word of mouth contacts, with already-resident A8

71
nationals recommending employment agencies, workplaces, housing etc. to new arrivals, and recommending fellow nationals to employers and landlords. Building on these flows of information, the city has witnessed the emergence of structures and fora for these new migrant communities. The website and forum Polacy w Newcastle (Poles in Newcastle; www.ncl.to.pl) was established by a thirty-something Pole in 2005 after he realised that there were few other easily accessible sources of information for Poles in Newcastle or thinking of moving to Newcastle. The forum now has approximately 200 registered users (against a background of around 200 WRS-registered Poles in Newcastle). These are Poles living not only in Newcastle and but also throughout the north east (including Jarrow, Gateshead, South Shields, Hartlepool, Sunderland, Consett and Chester le Street), and indeed still living in Poland. The web forum hosts detailed and lively discussions of life in the North East – both serious and frivolous – and offers, amongst other things, advice on finding work and accommodation, on taxes, social security, health, education, childcare, on English-language courses, opening bank accounts and on finding Polish food. The associated website offers regularly updated summaries of essential information for new arrivals and advertises news and events of relevance to Poles in Newcastle. In short, www.ncl.to.pl acts as a site for Poles to seek out all kinds of advice for navigating life in the UK, and mirrors similar sites in Leeds, Birmingham and, of course, London. The site is testimony to the commitment of one individual who, though now supported by others, established a service much-demanded but not offered elsewhere. Although connections with earlier waves of co-ethnic migrants are sometimes seen to be important, for many there is a rejection of existing community organisations – “The Polish Club tries to help but the age profile of members means that they know little about rental accommodation, job agencies etc., i.e. the sorts of things migrant workers need to know about. Attendance at the Polish Club still tends towards older, settled Poles.” (Polacy w Newcastle, Authors’ Interview 2006). In our brief review of local institutional structures, we found no evidence of similar fora for other A8 nationalities. This raises concerns about where other migrants are accessing the kinds of information and know-how offered through these channels and suggests a need to more fully document this sphere. Language The issue of language was explored in the Newcastle case study from two perspectives – firstly, assessing the importance of and access to English-language skills for labour market participation (discussed in part above) and secondly, exploring the potential – realised or not – for A8 language skills to be utilised as a resource within the city and region. In terms of English language provision, as we have already suggested, some employers were offering their workers access to subsidised, free or facilitated English for Speakers of Other Languages (ESOL) lessons. In some cases, lessons were organised directly with a language training provider; in others, workers were simply supported in their participation in mainstream classes. Recommendations of the best language providers flowed amongst A8 migrant workers by word of mouth, and large, public providers such as Newcastle College were seen to be most popular. However, many respondents – employers, agencies, service providers and migrants themselves – clearly stated that the need to work often conflicted with the desire to improve English language skills. This is a problematic and paradoxical issue since gaining a very marketable proficiency in English was often as important a motivation for migration as the income opportunities.

72
Alongside ESOL training, a number of respondents identified the increased use of A8 languages in workplaces and local organisations, in particular in the spheres of health and safety and legal and official paperwork. The Regional Language Network is increasingly involved in initiatives to translate symbols and signage and increase the number of languages employed in workplaces and at key points of arrival (airports, coach stations, ferry ports etc.) (Regional Language Network, Authors’ Interview 2006). The RLN also identified increased usage amongst local and regional organisations of services such as Language Line (see Module A above) and an increased demand for translators and interpreters with A8 language skills – the RLN maintains two databases, one of language professionals and one of jobs requiring language skills. In both, they had witnessed a significant, but not overwhelming, increase in A8-related entries. They noted, however, that more could be done to capture and ‘promote’ the region’s new population with new language skills. The RLN works with other regional agencies (in particular in the spheres of tourism and inward investment) to promote and enable the use of other languages and facilitate the integration of other cultures in economic activity. In both these areas they have noticed an increase in A8 activities and recognise the potential for further development – for example, using A8 workers in the region’s tourism industries to translate leaflets and brochures to enable better marketing in the A8 countries and beyond – A8 nationals are, after all, often tourists and investors as well as employees. In the Yorkshire and Humber region, the RLN has been involved in running cultural briefings in the food and drink sector. Other providers – local and national – are engaged in other forms of cultural and language integration services. International House in Newcastle (http://www.ihnewcastle.com/), for example, builds on its experience of teaching English to foreign nationals (at home or abroad) to offer cultural awareness training for business

73
Peterborough
Peterborough City-Region Peterborough is 78 miles from London and has good road and rail links both to the North and South and East to West. The city lies on the River Nene which flows into the North Sea approximately 30 miles to the north east of the City. The 2001 census recorded a population of 156,061 for Peterborough. It was estimated that in 2003 the population had risen to 158,800 and the mid year estimate for 2004 was 159,100. Peterborough has been a unitary authority since 1998 and has been regarded as a major growth point within Cambridgeshire since it was designated as a New Town in May 197123. Peterborough has recently been included in the government’s London-Stanstead-Cambridge growth corridor and has been identified as a major growth area for both business and housing.24 Indeed Peterborough has been identified as the focal point of the Peterborough sub-region which extends beyond the City boundaries into the surrounding rural areas. A study carried out on behalf of the East of England Regional Assembly25 identified the sub-region as comprising complete local authority areas of Peterborough, South Kesteven, South Holland, Fenland, Huntingdonshire, East Northamptonshire and Rutland.
23 http://www.peterborough.gov.uk/page-230 24 http://www.positivelypeterborough.org.uk/Business_stats.asp 25 Peterborough Sub-Regional Study, Final Report, November 2003, Llewelyn Davies in association with Steer Davies Gleave and Robert Huggins Associates.

74
In terms of topography the sub-region is divided into Fenland and Uplands. The boundary between the two runs more or less north to south and passes through Peterborough. The Fenlands are flat and low lying with some parts lying below sea level and comprise mainly good quality agricultural land. It is suggested that Peterborough occupies a unique position with the East of England in that the City faces south towards the economically prosperous areas of Cambridge, Huntingdon and London, but also neighbours The Fens (part of which falls into the Peterborough sub-region) an area that shows signs of rural deprivation26 Economically, Peterborough is seen as a major employment centre within the Eastern region as a whole. The economic activities of the Peterborough sub-region include food processing, the provision of services, finance and insurance agriculture, engineering, mail order and retail27. Peterborough is perceived as an important retail centre with the 27th largest shopping population in the country28. The proximity of Peterborough to high quality farmland and good transport links (road, rail, air and sea) assist in the competitiveness of the area’s agri-food businesses. It is estimated that the agri-food industry currently generates £2 billion of food-related trade. This figure is split between £0.8 billion in ‘farm-gate’ sales of raw ingredients and £1.2 billion in manufacturing sales.29 Peterborough City Council in partnership with EEDA and English Partnerships have developed a new City Centre Plan which outlines a new vision for the city centre over the next 15-20 years. The plan includes a major expansion of shopping facilities, new office accommodation to attract new businesses into the City along with new housing and leisure facilities. The City Council has already been successful in securing more than £10 million towards city centre projects. It is estimated that over £750 m of new investment will be attracted to the city. A new hospital is also planned within the City and Peterborough Regional College and Anglia Ruskin University have confirmed that they will be working in partnership to establish a University Centre in Peterborough. It is anticipated that the local economy will benefit from this major investment in higher education.30 Peterborough is a multi-racial and multi-cultural city, with 10% of its population classifying itself as belonging to a non-white group. This is slightly above the GB average (8% in 2004). Our analysis of the worker registration data identified Peterborough as the urban Local Authority (LA) with the largest A8 location quotient (LQ). The surrounding rural areas which form part of Greater Peterborough (South Holland and Fenland) also feature in the top ten LA LQs (3rd and 6th respectively). Peterborough is also interesting as it has a high LQ in terms of registered workers with dependents and this may throw light on the sort of services required by A8 migrants. The nationalities with the highest LQs in Peterborough are: Czechs, Poles Slovakians and Lithuanians.
26 http://www.peterborough.gov.uk/page-163 27 Peterborough Sub-Regional Study, Final Report, November 2003, Llewelyn Davies in association with Steer Davies Gleave and Robert Huggins Associates. 28 http://www.peterborough.gov.uk/page-230 29 http://www.positivelypeterborough.org.uk/Food_industry.asp 30 http://www.anglia.ac.uk/ruskin/en/home/news/archive/peterborough.html

75
From the qualitative interviews perceptions of the A8 migrant communities in the Peterborough area were mixed. Many respondents stated that the A8 migrants they came into contact with were mainly young single men, whilst others found they were predominantly dealing with families. All respondents suggested that Poles were the largest and most established group from the A8 countries. The other groups were perceived to be slightly smaller, with the next largest being the Lithuanians, followed by the Czechs, which reinforced the findings mentioned earlier. It was also suggested that migrant workers in general and the Poles in particular could be seen as falling into three different groupings. The first group are those who want a better life than that experienced in their home countries and they didn't really mind where they find it. It was felt that this group was the most likely to settle in the UK long term. The second group comprises those who want to earn as much money as possible and then return to their home countries. The third group are those that have become disillusioned with life in the UK and have problems with issues such as culture and identity. However, they don't want to leave imminently, due to the economic advantages the UK can still offer them. Peterborough has a relatively tight labour market, unemployment in the Cambridgeshire and Peterborough sub-region is low compared with the rest of East of England and the rest of the UK and although Peterborough has a relatively high rate compared to the rest of the county it stands at only around 2.8 percent (2006). Our analysis showed that in terms of jobs undertaken by A8 migrants who are registered as part of the Worker Registration Scheme, by far the biggest category of employment is general manufacturing and process industry work which absorbs over two thirds (69.7%) of the labour force. This category of employment includes such jobs as packing, warehouse assistant and machine operative. A8 migrants are also employed to a much lesser extent in hospitality/leisure/retail/wholesale (9.2%), office based work e.g. clerks, call centre workers (4.6%). Only a very small percentage of workers (less than 1%) can be classified as professional or semi-professional and includes for example nurses, translators, lawyers, pharmacist and researchers. Strategy, Policy and Institutional Engagement The East of England in general and Peterborough in particular has been the destination for a significant number of migrant workers for many years and it is likely that this trend will continue. These now settled communities include Ukrainians, Poles, Italians, Portuguese, Pakistanis and Indians. Despite this historic legacy we found little evidence to suggest that procedures that dealt with migrant workers formerly had been embedded into policy arenas,
a lot of the issues and the threads of tension that are now coming out have already happened in Peterborough 25 or 30 years ago and I don’t think we have learned the lessons from that. A lot of the things that were being said by the host community about those now settled communities are now being said by those people who have become part of the settled community about new arrivals, it has come full circle. (Statutory agency interviewee, Authors’ Interview 2006)
Instead, as has been evident with the recent wave of A8 migrants the response from statutory agencies at both a regional and local level has been fairly reactive,
institutions are still at the stage were they are trying to get to grips with what it means to have migrant workers around. We haven’t really looked at solutions to the issue yet,

76
we’re still grappling with what the issues actually are (Statutory agency interviewee, Authors’ Interview 2006)
To a certain extent this has been a symptom of the sheer scale of migration which greatly exceeded the expectations of statutory agencies and the lack of available and reliable data upon which to make appropriate planning provision. There was also a lack of robust data on the qualifications profile of A8 migrants and their level of skills. In order to address this information gap a need for research to inform a strategic response was identified to determine amongst other things the profile of migrant workers and to identify any other issues. The East of England Development Agency commissioned the Working Lives Research Institute at the London Metropolitan University to compile Migrant Workers in the East of England (2005). The purpose of this report was to map the scale, characteristics, skills, employment experiences and issues of migrant workers related to well being. The project brought together an advisory and steering group drawn from key partners from across the region. The recommendations flagged up in this report around such issues as increased access to information and services, housing, skills and their under-utilisation are currently being addressed through a number of local and regional partnerships. Other on-going research includes a housing study which the East of England Regional Assembly has just commissioned to look at the housing needs of migrant workers. Job Centre Plus in conjunction with New Link (see later) have accessed EMF funding to look at what is stopping migrant workers from accessing jobs e.g. not understanding the application process, terminology. At a regional level the East of England Development Agency (EEDA) is in the process of developing a Regional Action Plan to tackle some of the issues arising from the growth in migrant workers, this review will obviously have local implications. EEDA also provide support at a sub-regional level through their Investing in Communities Programme which aims to help deprived communities throughout the region address social issues at a neighbourhood level and improve employment opportunities of disadvantaged people (which includes migrant groups). Government Office for the East of England are encouraging and influencing local decision makers so that they take ‘migrant worker groups’ into account when developing Local Area Agreements and economic strategies. MENTER is a regional network for Black Minority Ethnic voluntary organisations and communities and is funded by the Home Office Active Community Unit and EEDA. The network targets BME communities, asylum seekers and refugees, Gypsies and travellers and migrant workers and aims to raise awareness of the needs and issues affecting these groups. Regional and local trade unions are making sure that A8 migrants are aware of their employment rights within the workplace. Taken across the interviews a number of Peterborough specific measures have been put in place to try and tackle migrant worker issues. These include: • A Multi-Agency Forum made up of about 80 Community and Statutory organisations
including the City Council, Health Trusts, Police to deal with issues related to the needs of asylum and refugee integration and increasingly migrant workers;
• Job Centre Plus using a stream of Government funding called the Ethnic Minority Flexible Fund to help move people from BME, new arrival and migrant backgrounds closer to the labour market within identified LA wards that are seen as disadvantaged – working with both statutory and community organisations to put provision in place;
• Job Centre Plus are also working with the Health and Safety Executive to make sure that leaflets (translated) are available within work places, and also directly with employers (especially with small and medium sized enterprises) and Recruitment Agencies to provide employees with basic health and safety training;

77
• The Women’s Centre in Peterborough work with women within migrant communities; • A network of Community Contact Centres set up with Urban II funding are increasingly
seeing people from migrant backgrounds because people are moving out and living in different parts of the city;
• Contacts have been set up and facilitated within New Link with the Millfield Health Centre, the Healthy Living Partnership and with the Police and the Community Safety Forum.
• Citizens Advice Bureau in Peterborough are undertaking two awareness raising campaigns at the moment around fee charging ATMs and the Right to Justice.
To date there has been very little evidence that local or regional institutions have attempted to be more strategic by for example actively attracting particularly types of migrant worker into Peterborough. However several interviewees commented that the situation was changing and a more coherent, strategic response at a local and regional level was being developed. This process has been described as ‘joined up thinking at an embryonic stage’. One interviewee suggested that although to date there were attempts to identify skills shortages,
we need to take it a step forward and say okay if we need lorry drivers and we know that some of them are going to come from abroad then why don’t we work out a way of getting them here rather than just waiting to see whoever shows up and if we’re lucky then some of them might just happen to be lorry drivers. Let’s start looking at what the pre-requisites are to them coming and ask can we make it easier for them to get language skills, more straightforward in terms of how they get their qualifications transferred and housing (Statutory agency interviewee, Authors’ Interview 2006)
To some extent employers and Employment Agencies within Peterborough have been more proactive and have sought to address labour shortages by actively recruiting workers directly from A8 countries. Often this is without due consideration to the pressure which then has to be born by local service providers - in the sense that these workers often have housing needs, health needs, their children need schooling. Of course this is not always the case and many employers are working in conjunction with statutory agencies and trade unions to provide a more cohesive response. Policy makers are also beginning to recognise that once A8 migrants are based locally and regionally then more effort should be made to retain them. Several interviewees felt that if you could settle someone or reasonably settle them so that they were not constantly changing housing then migrants are going to more integrated and ‘it’s going to put less of a strain on services.’
The government needs to be aware that phase 1 is here (workers are happy doing unskilled work because they are getting paid more than they would in their own countries), but phase 2 (when this is no longer sufficient and they want a better life) is how do we take them up a level because they are pretty good workers and we need to re-train them and I think that will come through good confidence building, a sense of them feeling very much part of a community but also not letting them lose their cultural identity. These are issues that the government needs to think through (Local priest, Authors’ Interview 2006)
It was also recognised that a certain amount of work still needed to be done in terms of giving out positive messages about the economic and cultural contributions that migrants can make to the community and this was already been taken forward by EEDA and other agencies working on the ground at a local level. New Link (see later) in Peterborough have worked closely with the Refugee Council around ‘myth busting’, often this has involved going into communities and teaching migrants how to be confident enough to talk to the media about their backgrounds, what they do in their home countries and how they want to contribute to the economy.

78
When you look at integration from an agency’s point of view it certainly helps if we can say to those people who are very critical of migrant workers, that they do have things to offer, they can bring a lot of different skills to this country, they will do work that other people might not want to do and they are contributing an enormous amount to the economy. It helps to dispel some of the myths that are around (Statutory agency interviewee, Authors’ Interview 2006).
One of the major issues within Peterborough has been a general confusion between refugees, asylum seekers and migrant workers. Peterborough was designated a major dispersal area for asylum seekers in 2001 and this has lead to a general level of confusion between migrant workers and asylum seekers/refugees particularly in terms of their needs. There has been a tendency at a number of levels to ‘lump these groups together’ although they are intrinsically very different with very different needs. Groups like New Link (see below) have gone some way towards dispelling the myths about the different groups by developing and facilitating a number of awareness raising workshops and training events in Peterborough about refugees and asylum seekers. There was also a sense that it was important to distinguish between different groups of migrant workers, that it was important to respond to ‘different demographics at a local level’. Box 4: New Link New Link is Peterborough City Council’s Asylum and Migration Service which supports the integration of new arrivals to Peterborough. Part funded by a successful £2.2 million bid to the Home Office’s Invest to Save Programme – the new arrivals whether asylum seekers, refugees or economic migrants are interviewed by a bilingual adviser employed or volunteering at the centre who pinpoints their needs and entitlements. New arrivals are helped to register with a doctor, dentist and school and are given information on accommodation, English classes, volunteering and employment opportunities, health advice and family welfare groups, referral to immigration and legal services. Each one is partnered with a mentor from the local community31. Awareness raising activities are also undertaken at the local and community level. The Centre has won a number of awards including Outstanding Achievement in the Social Housing in the UK, sponsored by the Office of the Deputy Prime Minister and Excellence in Promoting Social Cohesion. The funding for New Link finishes in March 2007 when community organisations will take over the running of the Resource Centre. Labour Market and Skills Issues Finding Work The majority of respondents suggested that the main route through which A8 migrant workers actually found employment is through word of mouth and their own networks. Many arrive in the area on the recommendations of friends, relations and acquaintances. The agencies and employers approached for work tend to be on the recommendation of earlier migrants who have often learned through experience who are the better employers and the more reputable agencies. It was suggested that JobCentre Plus was not favoured in the search for work and migrants will only use JobCentre Plus if work is becoming difficult to find through their usual methods. (Community & Voluntary sector interviewee, Authors’ Interview 2006)
31 New Link documentation

79
JobCentre Plus staff in Peterborough estimate that the largest migrant worker client group is the Portuguese. It is well known that there is a large Portuguese presence in the East of England and Peterborough is no exception. It could be suggested that the Portuguese are a more established group than the A8 migrants and as such are more aware of UK employment processes, possibly have better English language skills having been in the UK longer and are more comfortable accessing JobCentre Plus services. Some large companies have recruited directly from the country of origin. Tesco have recruited around 100 Poles to work in their distribution centre which opened in Peterborough in 2005. The distribution centre employs around 1,000 people and Tesco have claimed they struggled to fill vacancies locally and in such circumstances the company will look to recruit abroad.32 Tesco have introduced measures to support migrant workers e.g. setting up a link with MoneyGram International, the company that Polish people use to send money back to Poland. Nearly all respondents had similar stories to relate of migrant workers being duped by unscrupulous agencies. The workers arrive in the area on the basis of promises of work and accommodation in return for fees paid. More often than not such promises are false. Skills Level Our research indicates that although some migrant workers have a good level of skill, many of them are undertaking unskilled work. There are a number of reasons for this. Primarily, unskilled work is readily available in the Peterborough area and the type of work being taken up by migrant workers is generally ‘unattractive’ to English workers. The work in question covers a range of factory work particularly related to fresh produce, such as food preparation, packing and warehouse work One respondent suggested that English workers did not like the working arrangements attached to much of this work e.g. 4 days on 4 days off working 12 hour shifts as it impinged on weekends. This is despite some of this work attracting a wage well above the national minimum wage with additional bonuses (Private sector interviewee, Authors’ Interview 2006) Unskilled work is easy and quick to access. When migrant workers arrive many want to get a job, any job as quickly as possible. If they wanted to access employment that better matches their skills and qualifications, the process may take time. They may have to get existing qualifications verified, or even upgrade qualifications and possibly gain work experience in this country. They would almost certainly have to prepare cvs or complete application forms and go through an interview process. In addition unskilled work in the UK attracts a much higher wage level than skilled work does in the migrants’ home countries. (Statutory Agency interviewee, Authors’ Interview 2006) It must also be noted that distinct problems have arisen due to qualifications gained in migrant workers’ home countries not being recognised in the UK. Many respondents identified this as a major issue and anecdotal evidence suggests there are migrant workers with qualifications, skills and experience not being able to fill identified skills gaps in the UK. (Community and Voluntary Sector interviewee, Authors’ Interview 2006) Conversely, it should also be recognised that when equivalency checks have been made to ascertain whether a degree obtained abroad is at an acceptable level for an employer or a professional body, sometimes a degree turns out to be equivalent to an English A Level (Statutory Agency interviewee, Authors’ Interview 2006)
32 http://www.peterboroughtoday.co.uk/ViewArticle2.aspx?SectionID=845&ArticleID=1319624
80
In addition to problems arising over the equivalency of qualifications, it has emerged that some migrant workers with qualifications (some are graduates) have not made it known that they possess qualifications because they either don’t understand the employment system, or are simply frightened to do so. The latter possibly being related to the perception that they may lose their job because they are ‘over qualified’. Lack of awareness relating to skills was highlighted by anecdotal evidence; it was revealed that one employer was experiencing such severe skills shortages that relocation was under consideration, it was unknown to the employer that workers with the necessary skills and experience were already being employed within his company as unskilled workers. (Statutory Agency Interviewee, Authors’ Interview 2006) In an attempt to increase awareness and improve the utilisation of the skills of migrant workers as highlighted earlier in the document, New Link has instituted a registration process for every new client in which information is gathered regarding qualifications, levels of skill, work experience etc. One of the recruitment agencies interviewed stated they were getting more skilled workers registering with them. Where possible the agency tried to find suitable work for the people with the technical ability to undertake it. They had found work for two chefs and more recently had registered some bus drivers and were in the process of verifying their documentation. Language Barriers Lack of English language skills was highlighted by all respondents as a major barrier for migrant workers, whether in the labour market or accessing services or advice. In many cases the type of work migrant workers were able to take up was determined by the level of English. One employment agency stated that they did not differentiate between workers in relation to their levels of English, however, in practice workers are categorised by which factories they can work in. Certain jobs need a higher level of English than others e.g. in food preparation some English is needed for them to understand health and safety and the factories stipulate the level of English they require from their workers. Even with highly skilled workers a lack of English language ability has been recognised as a problem area. JobCentre Plus in Peterborough has identified a group of migrants
who are quite skilled and have had quite a high standard of living in their own country. They then move to the UK bringing a lot of skills and they want to get a job as quickly as possible. One of their problems is that a lot of their qualifications may not be at a standard that British employers and institutions require and they need to engage in some fast track ESOL provision that will enable them to get that job and build on their experience (Statutory Agency interviewee, Authors’ Interview 2006)
However, as will be discussed in a later section, ESOL provision has itself encountered a number of problems. The level of documentation translated into workers’ own language varies. One agency had everything professionally translated while another only had what it regarded as ‘important forms’ translated. This related to anything with financial or legal implications, such as transport forms (allowing the agency to deduct £2 a day from wages to cover transport), the 48 hr opt out form (opting out allows workers to work up to 60 hours per week), overpayment form (enabling the agency to deduct any overpayments made due to lack of timesheets). One agency carries out its own induction process which includes Health and Safety and food hygiene. The agency has its own training room, a staff member with A8 language abilities and

81
they use videos in workers’ first language. The importance of such an approach was emphasised in recent research carried out by the GMB33 in that although extremely important, it wasn’t enough just to give workers information in their first language, explanation was also required. None of the agencies organised ESOL classes, but one encouraged workers to sign up for evening classes held at the local FE college. Availability of Work Unskilled work linked to food production and preparation is generally plentiful for 10 months of the year, with extra workers being taken on at peak times such as Christmas or in the case of flower factories a special occasion such as Mother’s Day. January and February are regarded as the quiet months where there is little if any of this type of work. All the agencies interviewed stated that they currently had workers registered with them who had no work. One had closed its books to new registrations because of the shortage of work. Another tried to encourage workers to take holidays at this time of year34. Normally, the availability of work is expected to rise around the end of February, but this year that has not happened and at the time of research (mid March 2006) the agencies were still experiencing a quiet period. One of the agencies said they made a concerted effort to diversify the type of contract they held so they would have work to cover the expected quiet period. This was printing work and cleaning work for a number of letting agencies. It was suggested by one respondent that the unusually long quiet period could be due to employers ‘holding back’ work until April when agencies can apply for licensing with the GLA.35 It was further suggested that many agencies, if they continued to follow their present mode of operation would not be able to obtain a GLA license. The big supermarkets are wary of who they work with as it is intended that there will be a ‘name and shame’ campaign if any part of their supply chain is found to be using unregistered agencies. One interviewee described this ‘as a very powerful incentive for employers to make sure they are maintaining things properly’ (Statutory Agency interviewee, Authors’ Interviews 2006). Location of Work Much of the work the employment agencies offer is not located in Peterborough itself. One agency stated they had a policy of not accepting work outside a 40 mile radius of Peterborough, whilst others are willing to transport workers up to around 60 miles with a travelling time of around 1½ hours. Much of this work appears to be in rural areas (Spalding, which is regarded as the start of the rural areas lies within 20 miles of Peterborough). Migrant workers have been identified as extremely important to the local economies of Fenland and surrounding rural areas, particularly in farming and the food industries. In these areas there is almost full employment and a degree of reluctance on the part of local people to undertake much of the work36.
if you were here at 5am, along Lincoln Road, its amazing a stream of white vans pitch up and people just come out of houses like ants out an anthill, get in and disappear and then come back again and are dropped off (Statutory Agency Interviewee, Authors’ Interview 2006)
33 http://www.gla.gov.uk/documents/eighth-board/GLA8-9%5B1%5D.6%20Exclusions%20Summary.pdf 34 All the agencies interviewed offered workers paid holidays (4 weeks per year pro rata) in addition to sickness and maternity/paternity benefits. 35 It will become illegal for an unlicensed Gangmaster (or an agency acting as a Gangmaster) to provide labour from October 2006, and from December 2006 it will be an offence for a Labour User to engage an unlicensed Gangmaster. 36 European Migration and the Impact on the Skills Agenda within Cambridgeshire, Briefing Note, Cambridgeshire LSC January 2005.

82
Transport costs are deducted from workers’ wages and these seemed to range from around £2 per day to £2 per week. However, one agency stated that where possible they built transport costs into the contract with the employer and in such cases there would be no charge to the workers. Unemployment It was suggested that unemployment is now starting to become an issue amongst migrant workers. This is particularly a problem for those who do not qualify for benefits. It has also been suggested that less reputable employers specifically target new migrants because of their vulnerable situation which makes them less likely to complain and more willing to endure poor working conditions (Community and Voluntary sector interviewee, Authors’ Interview 2006). Anecdotally, suggestions have been made that employers are showing signs of preferring Polish and Lithuanian workers over those from other A8 countries as they will do ‘the worst jobs’ and work for less money (Statutory Agency Interviewee, Authors’ Interview 2006). This suggestion was not backed up by the experiences of the employment agencies interviewed. However, one agency did suggest that they take on Poles because in general they have relatively good English and a higher standard of general education than other migrant groups. One respondent also reported a degree of tension between the Portuguese and Polish communities over jobs, in that the jobs that had been targeted by Portuguese workers are now being taken by Poles. It was suggested that many employers perceive Polish people as having better English, more skills and were altogether more reliable as compared to Portuguese workers. As a result Portuguese workers felt ‘pushed out’ (Statutory Agency Interviewee, Authors’ Interview 2006). An alternative view on the issue of unemployment was given by other interviewees in that they suggested that unemployment will never become a major problem because of the fluidity of the migrant worker population. Migrant workers are drawn to work and if the work dries up, the migrant workers will simply move to another location where work is plentiful. (Trade Union Interviewee, Authors’ Interview 2006). Queries from Home Countries One employment agency in particular received requests for information from people still in their home countries. In response to this the agency is planning a trip to Poland in the near future as a PR and information giving exercise. Many Poles, and indeed migrant workers in general, are exploited simply due to their lack of knowledge regarding the law and their entitlements. This agency wants to advise Polish people interested in coming to the UK how to get it right and how to avoid pitfalls. The Directors of the company have Polish family connections and feel very strongly about the exploitation of migrant works. Indeed this was one reason why they established their agency. Employment Agencies The three agencies approached were all members of the Association of Labour Providers. Members are audited against the Association’s Code of Practice which covers the terms and conditions of employment for workers registered with member agencies and requires the agencies themselves to have systems in place to ensure the correct procedures are followed and legal requirements are adhered to. The Code or Practice also stipulates that any sub-

83
contractors must comply with the code and self-employed workers37 cannot be used. In addition two of the agencies interviewed were heavily involved with the GLA in relation to the new licensing scheme which opens to registrations in April 2006. As such it is recognised that the agencies interviewed are more likely to be interested in establishing models of best practice than exploiting migrant workers. All workers with the agencies are entitled to holiday pay (4 weeks a year pro rata), sickness benefits and maternity/paternity benefits. One agency stated they had been in operation for around 7 years and held some long term contracts. They did have workers who had been with the agency for 6 or 7 years. Community Integration and Access to Services Housing Nearly every respondent identified housing as being a major issue in the Peterborough area. It was suggested that there are in the region of 7,000 (one respondent suggested this figure was higher at around 8,500) currently on the waiting list for social housing, as such there is severe pressure on the existing housing stock. Shelter commissioned a report in 2005 to explore the housing advice needs of a number of groups in the East of England, including migrant workers. The research38 identified housing difficulties as a major issue for migrant workers, but that migrants rarely had difficulties in housing alone, and were usually part of a whole range of other problems. As was highlighted in the previous section dealing with the labour market, many of these problems stemmed from a lack of English language and literacy skills which made it difficult or even impossible to communicate their needs and to complete the necessary forms. This situation was further exacerbated by a lack of understanding of systems in the UK which led to migrants not following the correct procedures, with poor English potentially increasing the likelihood of any information or instructions being misunderstood. The report also suggested that although Housing Officers had access to interpretation services they did not always use them. Our research revealed a positive move on the part of Peterborough City Council and some of the housing associations in respect to dealing with migrants in that correspondence is now being sent out in the recipient’s native language. The Shelter report identified a number of potential barriers faced by migrant workers in accessing advice, again these barriers related to housing advice, but can be seen as relevant in a number of situations. Potential barriers included the long working hours and shift work that migrant workers commonly undertake. This often makes it difficult to seek advice from housing offices during normal office hours. It was further suggested that such working patterns can interfere with access to ESOL classes. Houses of multiple occupation are common and have given rise to a number of issues. It has been suggested that some landlords are not complying fully with legislation39 and charging
37 Recruiting workers as self employed has been one way unscrupulous agencies and employers have managed to circumvent employment legislation. 38 Anderson, J., 2005, The Housing Advice Needs of Migrant Workers, Gypsies and Travellers and Non-English Speaking Groups (Including Asylum Seekers and Refugees) in the Eastern Region, University of East Anglia. 39 Registration of relevant houses is mandatory under the provisions of the Peterborough City Council (registration of Houses in Multiple Occupation) Control Scheme 1999.

84
exorbitant rents. Additionally migrant workers are unaware of the correct procedures linked to renting in the private sector, such as the need for contracts and receipts for rent payments.40 It has been suggested that houses of multiple occupation (HMOs) often generate complaints from neighbours which does not assist community integration. New Link (see above) is working in partnership with a community mediation service and one of the issues they deal with is the tension raised between long term residents and migrants living in HMOs, usually due to a lack of both understanding and the ability to communicate from both sides. Migrant workers only become eligible for social housing (in that they can join the housing list) after being economically active in the UK for 12 months. However, even when migrant workers are offered housing, issues still arise. Peterborough Council are concerned about large numbers of people from the same ethnic origin living in one particular area and would prefer more integration. However, this has resulted in people turning down an offer of housing because they don’t want to live in a separate area to the majority of their fellow countrymen. This is perceived as not being ‘a valid reason’ for refusal and people are then taken off the housing list altogether. (Community and Voluntary Sector interviewee, Authors’ Interview 2006). It is recognised that some workers are in a very vulnerable and precarious position in that the offer of work includes accommodation. Anecdotal evidence from Peterborough, other parts of the East of England, (Community and Voluntary Sector interviewee, Authors’ Interview 2006) and indeed across the UK41 suggests that this practice is still common and abuse is rife with an excessive proportion of workers’ wages being deducted to cover ‘accommodation costs’. The Church The Church has emerged as playing a significant role in the integration of migrant workers into the community and also as a source of advice and guidance; offering both practical and spiritual support. One of the issues highlighted earlier was the difficulty experienced by many institutions and agencies in distinguishing between migrant workers and asylum seekers and refugees in terms of their rights and entitlements. The Church has always seen these people as clearly distinct groups, each with very distinct and different problems. It has been noted by many respondents that Peterborough has a well established, post war, Polish community. This community has lived a very cocooned ‘Polish life’ in an English setting. However, the new wave of Polish migrants is very different and they are much more eager to engage in English ways and integrate with the local community. It is this new group of Polish migrants that the Church is coming into contact with. It was also noted that there are significant numbers of Lithuanians and Czechs also coming to the Church. It has been suggested that all these groups see the Church as:
“the most visible sign of continuity with their country … the church is the point where they engage with their culture” (Local Priest, Authors’ Interview 2006).
It was noted that congregation numbers have increased dramatically in recent years, to such an extent the Church is full to overflowing on some occasions. It would appear that this is a general trend across the UK in areas that have attracted migrant workers. The Catholic Church in the UK is struggling to cope with this demand especially in light of a decline in numbers taking up priesthood in the UK. It would appear that the practice of the Church recruiting priests in Poland 40 Anderson, J., 2005, The Housing Advice Needs of Migrant Workers, Gypsies and Travellers and Non-English Speaking Groups (Including Asylum Seekers and Refugees) in the Eastern Region, University of East Anglia. 41 http://www.gla.gov.uk/documents/eighth-board/GLA8-9%5B1%5D.6%20Exclusions%20Summary.pdf

85
is becoming increasingly common. There are also instances of priests flying over on easyJet to give communion.42 Migrants often come to the Church with problems as the Church is held in a position of trust. In response the Church has organised sessions where they have brought people in to explain things like bank accounts to migrant workers (see below). In addition Peterborough has a very good ecumenical partnership and an ecumenical chaplain has been appointed. Part of his role is to keep abreast of local issues and the appropriate agencies (and people within those agencies) to contact when certain problems arise. In many cases the Church cannot solve problems, but it does act as a signposting service for migrants. The Church is encouraging people to act as a spokesperson for their particular group to both gather information on the concerns and difficulties encountered by each particular group, but also to disseminate information on the services available to them and how to access them. Bank Accounts A number of respondents have mentioned bank accounts cause problems for migrant workers. Apart from not understanding the process of opening a bank account, it has been reported that migrant workers often struggle to provide all the supporting documentation required. It was suggested that banks normally request sight of a passport or a travel document, but in addition they require some documentation relating to proof of address. In many cases migrant workers may have found somewhere to live but don’t have sufficient evidence to open a bank account. Bank accounts are required to enable employers to pay workers. This leads to many migrant workers arranging to have their wages paid into the bank account of someone else, who is more established in the area. Needless to say this practice can give rise to problems if the ‘friend’ goes ‘on holiday’ (Community and Voluntary sector interviewee, Authors’ Interview 2006). Citizens Advice Bureau The CAB find that their organisation is often the first place migrant workers come when they run into difficulties. Initially, they did find this quite strange as many of the migrants have very little English and it is thought that apart from Lithuania, no other A8 countries have an organisation equivalent to the CAB. It is assumed that the networking that occurs within the migrant communities in Peterborough indicates that the CAB is the place to ask for advice. Peterborough CAB does not have a translator for any A8 languages and has to rely on Language Line. The only bi-lingual member of staff is Portuguese. The CAB has tried to recruit volunteers from the A8 communities, but this has met with little success possibly because the whole ethos of voluntary work is not in the culture of these people and there is the ever present problem of lack of English Language skills. The necessity of interpreters and good translation services is recognised by all the agencies working at local level. New Link approach any migrants (or asylum seekers and refugees) who clearly have a good standard of English language to undertake training to become qualified interpreters. The CAB offer migrant workers options in how to address the problems they are facing. If they are in a situation where they can’t find work, can’t find housing or can’t afford to pay the rent, one option is often that they should consider returning to their home country. However, even this is not straightforward as there no clear funding source for repatriation. Some embassies will in effect loan the migrants money which they then repay once they have returned to their home country, however, other embassies are not interested.
42 Harding, L., 2006, New migration fills British pulpits, The Guardian, 15th March
86
The Church has often stepped in to help, where there has been no other option e.g. Two young Latvians (about 17 years old) arrived in Peterborough. They had paid someone for the promise of a job and needless to say there was no job. They ended up staying in the presbytery as they had no-where to go and no-one was interested in their plight. The Church eventually arranged for them to return home. Media Press coverage concerning migrant workers has been varied. On one hand the national press has published a number of scare stories along the lines of ‘Peterborough is a tinder box about to ignite’ where Peterborough is portrayed as a hotbed of racial tension. A recent dispute between the Pakistani community and the more recently arrived Kurdish community was also covered on national TV. This is another instance where migrant workers, asylum seekers and refugees are regarded as one. It was suggested that in the past journalists didn’t always appreciate the difference between the groups, but this is becoming less common. On the other, there have been a couple of stories recently in the local press where migrant workers have died in tragic circumstances and it is felt such stories as these have generated a degree of sympathy for migrant workers. ESOL Provision It has been noted throughout this report that a major barrier to migrant workers accessing the labour market, at any level, accessing services and integrating with the local community relates to a complete lack of, or poor, English language skills. To overcome this barrier, migrants need to be able to access ESOL classes. However, it has been suggested that there is a major gap in the provision of ESOL. This gap relates not just to the provision of ESOL per se, but also relates to where it is delivered and how it is delivered. A number of respondents have noted that ESOL services are under severe pressure. It is believed that the local regional college has a waiting list of 1,600 people, the local college of adult education has a waiting list of 400 people (Statutory Agency interviewee, Authors’ Interview 2006). This situation is reflected in the nearby areas, with both Huntingdon and Ely Colleges unable to meet the demand and requiring extra resources.43 Suggestions have also been made that there are a number of issues surrounding the mode of delivery of ESOL. In the main ESOL is being delivered by English teachers which in itself it quite reasonable. However, problems arise because these teachers do not speak the native language of the people they are teaching which makes the whole process more difficult for those trying to learn.
... people will go to either PCAE (Peterborough College of Adult Education) or the Regional College and sit round a table, somebody would come in and stand at the end, talk to them in a language they didn’t understand and then they wouldn’t go anymore and my understanding is that that hasn’t changed very much because that’s what colleges do (Statutory Agency interviewee, Authors’ Interview 2006)
43 European Migration and the Impact on the Skills Agenda within Cambridgeshire, Briefing Note, Cambridgeshire LSC January 2005.

87
One way around this would be to develop an exchange programme for teachers from the UK and the main home countries of migrant workers. The counter argument for such a programme would be in terms of the costs involved and would such a programme be justified especially in the case of migrant workers who only intend to work for a short period of time in the UK and then return to their home country. (Voluntary and Community sector interviewee, Authors’ Interview 2006). The Peterborough ESOL network is now looking to bring ESOL training into the community in a way that is accessible to people. The network is intending to become a social enterprise to access funding through Investing in Communities (which will not be available in Peterborough until 2007), rather than relying on funding from the LSC or other statutory organisations. Funding for ESOL provision does present problems. At present ESOL is funded by outcome which is adversely affected by the proportion of learners who do not complete the courses. Many migrant workers only attend long enough to learn enough English ‘to get by’ and once they have achieved this they drop out. The LSC has suggested that some clarification is required over eligibility. This relates to ‘candidates who are working and need ESOL Training, and therefore qualify for free training, and those who are studying and working to supplement their studies, who do not qualify’44 Integration into Host Community It has been suggested that as Peterborough has a history of accepting migrant workforces, Belgian refugees after the First World War, followed by the first wave of Polish Migrants and Italians, more recently Portuguese, in general people are quite accepting of European migrants and Eastern Europeans in particular have gained a reputation as being willing and diligent workers. New Link do a lot of work with groups newly arrived to the UK who don’t really understand every day life in the UK. There are a number of issues relating to cars, in terms of driving licenses, the need for insurance, tax, an MOT, and even an awareness of parking restrictions. Even very simple activities are problematic:
We have a lot of problems around rubbish – they don’t understand how waste management works – and New Link has got quite a big role in trying to look at all those issues that can be quite small and might seem petty but for the settled people here they become a stick with which to beat anybody with who happens to be different.
It is admitted that more time and energy has been directed at helping new arrivals to settle into the community compared to working with long term Peterborough residents. A move to rectify this imbalance could be exemplified by the ‘Refugee and Migrant Awareness’ project supported by New Link, where staff from New Link go out into the community and give talks to local residents about refugees and migrant workers. The aim is to provide information on why people have come to this country, what they are entitled to, the contributions made by migrant workers to the local economy and what would be the effects if they didn’t come. It is hoped that a better understanding of migrant workers (and refugees) will lead to a greater acceptance of both groups within the community.
44 ibid.

88
Areas of potential tension between long term residents and migrants are around housing and jobs, especially where there is competition for either between the indigenous population and incoming migrants. One respondent expressed the view that full integration between the various groups in Peterborough would be difficult. He estimates that there were around 44 different nationalities currently living in Peterborough. If they are allowed to form their own communities in separate areas of the city it was envisaged that they could live harmoniously. The potential for trouble lies in trying to fully integrate all the nationalities across the whole of the city. It was suggested that some racial, cultural and religious differences between the various groups meant that integration was problematic. An example of such differences was given as the siting of a mosque near to a pub (with a late licence for weekends, including Fridays). The pub is operating within the law, but the mosque deems their activities to be disrespectful (Community and Voluntary Sector interviewee, Authors’ Interview 2006) There was also a suggestion made that integration may not be the main priority of many migrant workers
If you talk to migrants who are looking for work they don’t think ‘well I’m going to integrate’ they think I can put food on the table for my children or I can send some money home to my parents. And the integration could be a by-product of getting a job. Integration takes time and it’s about building up relationships and it’s about priorities and what your needs are (Statutory Agency interview, Authors’ Interview 2006)

89
Key Issues and Policy Questions • At the local and regional scale, policy and practical responses to A8 migration have been
largely reactive and piecemeal, notwithstanding existing institutional structures geared towards managing the integration of other migrant groups (asylum seekers and refugees [ASRs] and migrants to settled immigrant communities [family/reunion migration]).
• There are some signs in our two case study regions of plans for increasingly ‘joined up’ working, led in Peterborough by New Link, focusing on community integration, and in Newcastle by ACAS, with a focus on labour market issues. In the Peterborough region, the East of England Development Agency has been proactive in researching and responding to A8 migration flows. Around Newcastle, regional actors have been less involved in setting agendas and developing initiatives.
• Moving towards joined-up thinking and working demands consideration of the following issues: i) institutional audits at local and regional scale, documenting the presence and activities of different organisations and agencies; ii) learning from best practice nationally and internationally; iii) competition for often very short-term funding streams between voluntary and community groups; iv) integrating A8-related issues with those concerning other migrant groups and with more settled (indigenous and minority ethnic) communities.
• In both areas, a significant proportion of the ongoing work with A8 migrants in the sphere of community integration and service provision is taking place in organisations or networks established for very different migrant groups (in particular ASRs).
• There is a clear perception amongst all respondents that the numbers of A8 nationals living and working in both case study areas are considerably larger than those identified in the WRS data. Many respondents had little real sense of the numbers – some were using inaccurate interpretations of the Accession Monitoring Report figures – but all were clear that their experience suggested larger numbers when given the current WRS data.
• Even in the case of Newcastle, where registered A8 workers number only 350 (see Module D), there was a clear perception that this small population demanded particular attention and that A8-related issues would be of growing importance in coming months and years.
• In Peterborough, in particular there were significant concerns over the lack of A8 access to social housing and the quantity and quality of private rental stock. In Newcastle, the co-location of vulnerable A8 populations within existing disadvantaged communities raised some real anxieties amongst service providers.
• The WRS data will become less and less useful for locating and monitoring A8 nationals for a number of reasons. As more A8 nationals become settled, more may move into self-employment, more dependents may arrive and, above all, more and more will have been employed for over 12 months, meaning that they will no longer have to register and may begin the process of residence permit applications. Whilst some of these settlers may be tracked through residence permit applications, many more will simply be lost. Since there are no other ways of monitoring the immigration and settlement of A8 nationals, it will be increasingly difficult for local and regional actors, organisations and decision-makers to respond with evidence-based policy. There may, however, be some potential in tracking A8 nationals through National Insurance Number applications.

90
• A8 migrant workers are a very diverse group. It is very difficult to depict a ‘typical’ A8 migrant. However, we can identify two polarised representations, between which many workers find themselves. At one extreme, we find a skilled, white collar worker with excellent English language skills, strong social networks and a good understanding of labour market and service provision landscapes in the UK; at the other extreme, we find a marginal worker with low skills, or English so weak they can not explain their skills, with other factors of vulnerability (former asylum seekers, personal or family health problems etc.). The experiences and needs of these different types of worker are very varied. In our research, it seemed that different organisations engage primarily with one extreme or the other, meaning that few local actors recognised the full range of migrant needs and experiences.
• A8 nationals are differentiated not only by their skills and English-language proficiency but also their motivation for migration and their commitment to the UK. Amongst some employers and institutions, there are differing perceptions of different national groups but many others tend to treat A8 nationals as a homogenous cohort. When formulating policy responses, it is important to respond to demographics at a local level, recognising not only national differences but other cleavages amongst these migrants.
• For employers and labour market intermediaries, there are a range of important issues, including recruitment, language and cultural sensitivity, working conditions, retention and skills verification and equivalency. Many of these reflect broader concerns relating to the employment of vulnerable and marginal groups.
• It was suggested that there is a need to develop better ways of recruiting and integrating workers which would more easily enable A8 nationals to fulfil their potential in local labour markets. These included matching employers with potential employees more creatively (using, for example, ‘job trials’) but also investing more substantively in systems to support language integration, information flows and knowledge of UK benefit, education, taxation, employment and health systems (amongst others).
• Labour market issues are structured, not surprisingly, at a scale beyond the cities themselves. Workers are often commuting, with the help of labour intermediaries, considerable distances to work – and moving workplaces from week to week or month to month. Since workers’ WRS registration in these cases is often facilitated by agencies, the geography of WRS registrations may not reflect where A8 nationals are working, nor where they are living.
• There was considerable differentiation in the impacts A8 workers were seen to be having on local and regional labour markets. This reflected in large part significant differentiations in local and regional labour markets themselves. Thus there is a further need to expand on national labour market analyses to explore in considered detail the labour market impacts in a range of different labour markets, setting analyses of A8 migration into grounded accounts of urban and regional economic change.
• Relatively little attention has been paid at the local and regional scale to the impacts in the spheres of service provision and labour markets of A8 migration on indigenous populations, especially more marginal populations. Whilst there is no real evidence that indigenous populations and A8 nationals are competing for services or for jobs, they are certainly living and working in the same spaces. There is a particular concern that the vulnerability of some A8 nationals forces them, like more vulnerable indigenous populations, into marginal and

91
insecure housing and labour markets and into spheres where knowledge of and trust in social and related service providers is weak.
• There was little tangible evidence of the development of ‘ethnic entrepreneurialism’, with most workers – and more policy attention – focused in relatively low-skilled and often temporary labour markets. Weak developments in the sphere of enterprise may reflect the short time elapsed since migration for most of these populations, their scattered residential geography and their varied commitment to the UK. These features may however be exacerbated by a lack of policy attention and a lack of awareness amongst local and regional policy makers of the potential economic contribution of these migrant groups.

92
Module F: Scenarios for 2016
1 Introduction Much of the value added of the project upon which this report is based comes through analysis of new data, explorations of current developments and considerations of their implications for current policy. In constructing the research methodology, however, it was recognised that as a New Horizons project we should reflect on future developments and outcomes. In order to do so we proposed that we should undertake some scenario work. Following internal discussion amongst the team members, we chose a ten-year timeframe for our scenarios. We felt that a ten year span would be sufficiently long to allow us to consider a range of political and economic developments, but still be relevant for current policy thinking. Scenarios do not forecast the future, but they do help policy makers reflect on a range of policy outcomes. As van der Heijden and colleagues put it:
“A scenario is not a forecast of the future. Multiple scenarios are pen-pictures of a range of plausible futures …constructed in such a way as to bound the uncertainties that are seen to be inherent in the future …Multiple scenarios provide alternative frames on the nature of the future ... scenario planning assumes that the best that can be done is to identify critical future uncertainties and plan for a range of factors that could, plausibly unfold” (van der Heijden et al., 2002, p63).
There are many ways of constructing scenarios. For reasons set out in the methodological reflections section, we designed the following process:
• Literature review • Data analysis of current and past trends • Construction of typology of migrants • Interview survey with key actors • Production of an initial set of key factors which will determine future migrant flows from
the A8 and other ECE countries • A first internal scenario meeting between the project team members to brainstorm the
key factors and consider variables which could impact on these factors • Construction of a ‘Key Factors Sheet’ which sought to capture our internal discussions
and a ‘Key Factors Scorecard’ and ‘Plausibility Scorecard’ (see Annexes 4-7). These three documents were sent to our ‘migration expert panel’, together with a ‘Guidance Sheet’. Their responses were taken into account when constructing the scenarios. The strengths and weaknesses of these instruments are considered in the methodological reflection section.
o The most relevant factors in the view of the migration expert panel were, in declining order of importance: UK demand for migrants to fill low paid, seasonal and dirty jobs; overall skills shortages in the UK; the UK’s liberal attitude to migration from the A8 countries; future accession to the EU; existing and growing A8 migrant networks in the UK; the length of stay of migrants in the UK; and, the growing strength of the A8 economies.
o Turning to the plausibility scorecard nearly three quarters (73%) of the 82 change possibilities listed in our key factors sheet were regarded as highly plausible or plausible by the majority of the panel.

93
• A second internal scenario meeting between the project team members to ‘brainstorm scenarios’, taking into account expert panel comments. On the basis of our first two internal scenario meetings it was decided that, although any number of scenarios could be constructed, it was most appropriate to create three scenarios: a high growth scenario; a medium growth scenario; and, a low growth scenario.
• Construction of draft scenarios and internal circulation for further comments. • Circulation of draft scenarios to ‘policy expert panel’ for comments on implications of
scenarios for policy. The scenarios which were sent to the panel appear in annex 8; • Final internal scenario meeting to finalise scenarios and implications for policy taking into
account the responses of the ‘policy expert panel’ and of the ‘project steering group’. The final scenarios are set out in the following section. These take into account the comments made by the ‘policy expert panel’ and comments at the final internal scenario meeting. They also take into account comments from the project steering panel as to the presentational style of the scenarios. The scenarios presented below are, therefore, different in style but only slightly in substance, from those which appeared in our March report, though policy implications are more elaborated. The earlier scenarios form Annex 8 to this report.
2 The Scenarios
Scenario 1 – High Migration Scenario The UK Policy Stance The UK’s relatively open policy towards migrants since 2004 pays dividends in terms of creating continued flows of labour, based on successive accessions to the EU. The 2006 regulations which make it more difficult for all but the highest skilled non-EU migrants to gain access to the UK for work, together with harsher treatment of refugees and asylum seekers, means that the vast bulk of migrants have come from the acceding ECE countries. EU Growth It is anticipated that by 2020 the EU will have an extra 169 million people, equivalent to more than fifty per cent of its pre-May 2004 population. Bulgaria and Romania add around 30 million (in 2007) to the 74 million A8 citizens, Croatia adds around 5 million (in 2012) and Ukraine brings around 50 million people. The anticipated accession of the ‘Balkan four’ in 2018 will add a further 10 million. Negotiations regarding Turkey continue, though there is no sign of the resolution of key outstanding issues. General Push and Pull Factors Although, strong growth in the A8+3 economies slows migration from these countries and there is some evidence of return flows, many workers have settle in the ‘west’, particularly in those countries, such as the UK, which developed a relatively liberal policy to European migration early on. Moreover, the UK has continued to be a preferred destination for migrants as other large EU economies keep Transition Measures in place until 2012 with regards to the A8 member states and imposed similar measure on later joiners under increasing pressure to increase labour market participation of native workers and populist pressure to resist the ‘dilution’ of national cultures. Some commentators have suggested that even now certain governments are using a range of non-regulatory measures to hinder entry of workers from accession countries.
94
Macro and Microeconomic Developments in the A8 Economies Although the economies of the A8+3 countries grow significantly a number of ‘push’ factors cause continued migration. Sectoral ‘efficiencies’ and structural change in sectors like agriculture lead to large scale redundancies, in countries such as Poland, where despite strong continued growth, unemployment – especially amongst the young and in peripheral regions – remains relatively high. Moreover, FDI which was initially attracted to the A8 economies by the availability of relatively cheap labour at both the low and high end of the skills spectrum stalls as investors look ‘farther east’ – to the former Soviet Republics and to south east Asia – for opportunities. In addition EU employment targets which seek to raise employment participation amongst women and other groups increase competition for jobs. Macroeconomic Situation in the UK Sustained economic growth, a low and regressive tax system, the English language, the relatively open and cosmopolitan nature of the society, and the more entrepreneurial culture (relative to other large EU economies) lead to an increase in the number of highly skilled migrants arriving in the UK. Migration Flows in the UK The presence of settled communities of migrants, with concomitant networks attracts workers to the UK, as does the continued growth in low cost air travel. ECE migrants are attracted to the UK across all skill levels, including at the level of knowledge workers. It is for this group of workers that competition from other countries is strongest. ECE workers will, however, only ever represent a small proportion of knowledge migrants, as the UK’s open door policy attracts migrants from around the world. Many knowledge workers and professionals settle and make a valuable contribution to competitiveness and to public services, though others have returned home or migrate to a third country, whilst still others effectively develop dual employment locations. Regional Settlement Patterns Although most of the workers settle in the South East as young workers are attracted by the presence and/or proximity to London as a Global City, additional resources channelled into the UK’s cities and regions towards the end of the decade, together with initiatives by these cities to attract foreign workers (following on from the success of the Scottish Fresh Talent Initiative), result in a significant number of knowledge workers locating outside the South East. Most of these knowledge workers tend to settle in urban locations over the short-term, over the longer term they will tend to follow the behaviour of their professional peer groups and move to the suburbs, small towns and accessible rural areas as they grow older. Less skilled workers (and those whose full skills are not recognised or utilised) continue to move to where the work is. Given the large proportion of workers engaged in food production, processing and distribution rural areas and towns and cities adjacent to rural areas continue to attract workers, both seasonal workers and non-seasonal. Migration policy which limits migration to fewer nationalities, many of whom are entitled to UK benefits, has the effect of stimulating more permanent settlement as these workers begin to feel ‘more at home’ and local support networks become established. A number of ‘hot spots’ have emerged in certain parts of the country, where perceived or actual concentrations of migrants have appeared. These concentrations comprise a settled group of

95
workers and an impermanent or ‘rotating’ group of migrants. Although conflated in the public mind these groups have different interests and requirements. Social and community cohesion Migrant workers continue to fuel the UK’s low skills ecology, postponing investment in technology and training. Over a sustained period of time, wages for low-skilled workers are dampened by successive flows of cheaper labour. This raises concerns of a further widening of the gap between skilled workers and those with low or no skills. Lack of access to certain employment opportunities in certain local labour markets or in particular sectors, also becomes a problem for native workers as migrant worker networks effectively act as recruitment agencies, thus excluding local people and intensifying tensions. Media coverage of the knowledge migrants is generally absent, as is coverage of the many budding entrepreneurs who are developing new businesses, serving both local markets and linking the UK and ECE markets. When coverage does occur it ranges from the benign to the enthusiastic. By contrast, coverage of less skilled migrants - who still make up the bulk of the migrant population – ranges from the suspicious to the vitriolic. Media attention focuses particularly on the migration ‘hot spots’. Tensions occur in these hot spots based on genuine concerns of the native population. For example, the lifestyles of concentrations of young males living in, often overcrowded, buy-to-let properties, are add odds with others in the local community and the behaviour is associated with ‘foreigners’. These concerns are exacerbated by the media. Tensions between migrant groups are fuelled by the preference given to employers for certain nationalities, particularly Poles, who are seen as hardworking, at the expense of other groups. Policy Implications Training and labour market access policies need to be developed further to equip native workers to develop the skills to gain access to labour markets. This, in itself, may not be sufficient to promote native employment so long as migrant workers are prepared/required to engage in ‘self-exploitation, thus reducing incentives for other workers to enter sectors where migrants dominate. Increasing tendencies for employers to select migrant workers may be accompanied by a decline in employer investment in the local skills infrastructure. Such a short fall may need to be compensated for through public investment or through some form of training levy on employers. With respect to housing, the influx of knowledge workers also causes its own pressures and more accommodation will be required for young professionals. More urgently, action on housing is required for those at the lower end of the skills spectrum (and those who have important manual skills, such as those in the building trade). In particular policies are required to address the consequences of the ‘alternative’ housing market which seems to be emerging, with certain streets becoming dominated by landlords servicing ECE migrants. Policy responses are required: to ensure that migrant workers are not exploited in terms of accommodation provided, to ensure that the housing stock does not deteriorate significantly over time, as can happen where tenant turnover is rapid and tenants perceive themselves to have no stake in the property, to ensure that migrants do not become (or are not perceived to be) ‘bad neighbours’. One approach here is for local organisations to provide welcome packs detailing rights and responsibilities. Another approach is to provide conciliation services which act quickly to facilitate dialogue between neighbours. Local authorities and community organisations could also engage with employers and employment agencies (including those operating in ECE countries) to raise awareness of standards of behaviour expected when living in a mixed neighbourhood

96
environment. At the same time action could be taken improve the reception given to migrants (see approaches to the media, below). Other social services also require additional policy measures. At the very least the provision of information in multiple languages is required, not only in respect of written material, but also in terms of interpreters. Services such as schools and medical practices will have to be sensitive to the differentiated requirements of the various migrant groups. Although these migrants will have different issues and concerns to asylum seekers and refugees who arrived in the late 1990s and 2000s lessons may be learnt from projects which were set up to meet the needs of these groups. Migrants have found that ESOL-type courses are scarce, can be expensive and are often unsuitable. Migrant entrepreneurship. It is often suggested that migrants can contribute to economic growth through establishing small businesses. Suitable channels to allow access to capital will be required if this is to become a reality. Migrant entrepreneurs, who find it difficult to raise capital through the normal channels, remain reliant on alternative sources of capital, often from their country of origin, as UK banks still hesitate to invest. Efforts will be required by government (through, for example, Business Link) and by the private financial sector to find new ways of providing capital to migrant entrepreneurs. This is likely to impact negatively on business growth and tax take, may encourage black economy activities and provide opportunity for criminal elements to become associated with what would otherwise be legitimate enterprises. National/regional intelligence gathering on migration, monitoring and forecasting. Mechanisms need to be put in place In order to identify current and future needs in the above policy areas, both at the national and regional levels. Approaches to the media. Although it is neither possible nor desirable to control what the media presents in relation to migrants, local agencies need a coordinated approach to the media and a common understanding of the issues involved. Links need to be made between local communities and the media so ‘both sides of the story’ are communicated. The media has to be made aware of the differences between legal migrants and others and be encouraged to reflect this in its coverage. Good news stories need to be brought to the attention of the media.
Scenario 2 – Medium Migration Scenario UK Policy Stance The UK continues its liberal stance on migration from the A8+3 (i.e., A8 plus Bulgaria, Rumania and Croatia) in contrast to some other larger EU15 countries. A series of bilateral agreements between the UK and candidate countries (Ukraine, Turkey and the Balkans countries) are negotiated in an attempt to increase the flow of migrants. Under pressure from employers’ organisations the points-based migration rules are relaxed, again in order to increase numbers of migrants working in the UK. EU Growth Expansion of EU membership stalls as negotiations between the Commission and candidate countries become drawn out, with only Croatia joining Bulgaria and Rumania in acceding to EU23.

97
The Macro and Micro Economic Situation in the UK The UK experiences a recession between 2008 and 2010. However, trend growth over the 10 year period remained unchanged. The economy undergoes some structural change with employment in two key areas of migrant employment particularly affected. Agriculture declines further after some growth in the first half of the 2000s. Employment in the construction sector undergoes a period of cyclical downturn - as the construction boom in the South East associated with large-scale infrastructural projects such as the Olympic Games, Thames Gateway, the Heathrow extension and the London-Stanstead-Cambridge Peterborough corridor tails off. Growth areas are in the provision of “front-line” public services, particularly in health, education and social care. Growth in retail, administration, private services and in tourism and hospitality also continues to be strong under this scenario. Although the majority of these roles require good English language skills, the growth in the provision on English training in the source countries will continue to reduce this hurdle to migrant labour. Although, the increases in retirement age go some way towards mitigating the decline in labour supply as a result of an ageing population, relatively low fertility rates and a gradual increase in outward migration of highly-skilled UK workers, labour shortages prevail at all skill levels. Moreover, because these trends prevail throughout the whole of the EU, the UK has difficulty in attracting large number of migrants to fill these shortages. The Macroeconomic Situation in the Accession Countries Continued economic growth, falling unemployment and higher wages in the A8 lead to a reduction in migrant outflows. This is only partly off-set by the accession of Bulgaria and Romania and, latterly, Croatia. The growing international role of certain A8+3 countries in food production caps the outflow of agricultural related workers, at the same time soaking up some of the low-skilled labour from neighbouring ECE countries. Many of those who learn a range of skills and techniques in the UK have return home to set up their own businesses or to take key roles in modernising production techniques in their own countries, particularly in horticulture. Migration Flows into the UK Migrant flows continue but are not as great as anticipated prior to the accession process. The period 2004 to 2007 sees year on year increases in the inflow of migrants from these countries, but growth slows during the 2008-2010 recession, after which it begins to recover, but not to previous levels. The coincidence of the ending of Transition Measures and improved economic growth in EU15, together with continued economic growth rates, falling unemployment and higher wages in the A8 means that competition for even relatively low skilled workers has intensifies. The reduced inflow of A8 workers is partly off-set by workers from Romania, Bulgaria and Croatia, but again competition for these workers is intense. The relaxation of the points-based migration rules and the bi-lateral agreements negotiated by the UK government with the governments of candidate countries appears to be addressing the issue with some evidence that documented migrant flows are growing. The relaxation of the PBS adds new streams of migration from beyond the A8+3. Regional Settlement Patterns The decline in agriculture related and seasonal work, leads to a fall in the number of migrants settling in or near rural communities. Although some migrants continue to arrive in the North of the country as a result of well established communities and demand for low and medium skilled labour in the health and care sectors, migration to the North of the country falls significantly as a

98
result of: an acceleration in the decline of the traditional manufacturing sector concentrated in the North of the country; the decline in replacement industries such as “call-centres”; a reduction in the more “bureaucratic-type” of public sector jobs and the phasing-out of EU and UK regional development subsidies. Instead, the South-East becomes once more the region experiencing the strongest growth in migrant inflows. Community Cohesion Although the total flow of migrants from Europe remains relatively stable over the period, there are significant changes to the composition of the flows. In particular, bilateral agreements with the candidate countries lead to a more diverse migrant population in terms of ethnicity, religion and English language skills. Migrants from countries “beyond the A8+2” may also be less familiar with Western European norms and have less in common with native British communities in terms of traditions of civic society. Moreover, the cyclical downturn in employment in the construction sector towards the end of the decade, also leads to some friction between groups of workers from different nationalities as migrant workers stay on even as the number of jobs declines. Policy Implications From a social cohesion perspective, and to a lesser extent from a labour market perspective, the policy implications are the same as those set out in Scenario 1 (above). At the very least services will have to be offered in additional languages. At the extreme, housing and other services will come under increasing pressure. As the geographical settlement patterns are different, however, policy responses will be more urgent in the South East of the country. Renewed efforts will be necessary to attract migrants of all types in order to support continued growth in UK economy. Particular efforts will need to be made to attract people to peripheral parts of the UK to counter falling populations though the relative lack of employment opportunities will make this difficult.
Scenario 3 – Low Migration Scenario UK Policy Stance In spite of pressure from some parts of the media, the political classes and the general population the UK has stuck to its liberal policy towards A8+2 migrants and, in the face of concerns regarding the country’s ability to compete internationally and to meet social service obligations, has selectively relaxed the rules on non-EU workers entering the UK. EU Growth The impasse in negotiations for entry of further states to the EU means that the anticipated further rounds of post-accession flows are delayed. The increase in nationalism and the move towards the right in north European countries formerly associated with relatively open migration policies reinforces the anti-enlargement bloc (which also includes some A8+2 countries). Turkey remains the main target of opposition for this lobby, but it has become politically difficult for the CEC to negotiate access of other countries which commence talks later to enter ahead of Turkey. The instability in Ukraine and the slow pace of reform in the Balkans, which in former times might have been overlooked, in the current climate, also act as a barrier to accession.
99
It is not clear that all these countries remain keen to join the Union. A number of reports suggest that the success of the A8+2 economies has occurred despite entry to the EU rather than because of it. This, together with the perceived racism and condescension of EU countries dampens fervour to join, though there is still a small majority in favour in each country. Macroeconomic Situation in the UK The UK experiences a period of protracted recession between 2009 and 2013. Unemployment goes up. Employers look to the newly unemployed or those about to become unemployed to fill semi-skilled and unskilled vacancies. Skill shortages, however, remain in key areas The decline in employment in the agricultural sector is not reversed when the recession comes to an end. This is because production is increasingly taking place in other countries following WTO and CAP reforms and the move of the processing and packaging work offshore. Macroeconomic Situation in the Accession Countries Outward flows of migrants from Central and Eastern Europe decline as their economies pick up. Competition from Other Large EU Economies and from the US Restricts Supply Other large economies in the EU (e.g. France and Germany) which were initially slow to open up their labour markets to the accession countries do so and provide increased competition for migrants both at the higher and lower end of the skills distribution. In addition, the UK’s relative position vis-à-vis the other large European economies (e.g., Germany and France) deteriorates as growth in the Euro area picks up and unemployment comes down. An ageing population in other large EU economies increases the demand for migrant labour and higher wages and benefits despite structural reform increase supply. Moreover, although the tax-take in these European countries is larger than in the UK, because overall living costs are around the same but housing costs lower, migrant workers’ remittances from these countries are greater than from the UK which acts as a further disincentive to choose the UK. Additionally, the US starts to open its borders to skilled overseas migrants following a sustained period of economic isolationism. Migration Flows in the UK The combination of higher unemployment in the UK, slowed flows from A8 countries, and increased competition from the rest of the EU means that, apart from brief peaks of migration following the accession of the A8 countries in 2004 and of Bulgaria and Romania in 2007/8, the much anticipated flow of migrants from Central and Eastern Europe does not materialise. Regional Settlement Patterns Those migrants that do come tend to settle in urban areas mainly in the South East as, as is generally the case, recovery from recession occurs in this region first. Low demand for labour from the agricultural and related sectors, and thus in rural areas, increases the tendency to settle in urban areas. Policy Implications The key policy concern is how to increase the level of inward migration as the economy recovers from recession, whilst not damaging employment for native workers. The key imperative remains how to increase the supply of knowledge workers to the UK and how to ensure that such workers are distributed to more evenly across the country.

100
Methodological Reflection Given the scoping nature of this project (including its exploratory use of Worker Registration Scheme data, the integrated development of case study work and the creation of scenarios), these concluding notes reflect on the methodological framework employed. Methodological Reflection on Modules B, C and D It is unfortunate that very little information is available by CoB in published 2001 Census tables. The only way to gain more information is to use the controlled access microdata sample (CAMS) − with its 3% sample of people in the 2001 Census – but this can be accessed only by special permission of ONS and at one of their secure sites (London, Titchfield, Newport or Southport). Carrying out such analyses is a suggestion for future work beyond the present project. Labour Force Survey (LFS) datasets have the critical advantage of being available not only for several years before 2001 but also for more recent years too. One key advantage of now being able to access LFS more readily is that there is continuous updating of this information source, but the disadvantage remains over the uncertainty about the data’s robustness when analysed for relatively small sub-groups such as the migrants from a single job type. The key difference between the WRS data and the datasets mentioned above is that the former is a ‘cordon’ survey, counting a flow passing a point over a period of time, whilst the latter are measures of a ‘stock’ as at one point in time. This distinction draws attention to the issue raised by using the WRS to estimate numbers of migrants who may have particularly likely to have stayed in England for only a short time. Some evidence suggests that the more highly qualified migrants are increasingly likely to move on from this country after a rather short time. The time constraints on the project means that is only possible to identify the data sources which could help to investigate transitory migration; the Longitudinal Study data provides at the very least one promising opportunity which needs to be explored by any further research in this direction. Methodological Reflections on Module F: The Scenario Process It was recognised that the limited resources associated with the project and the range of tasks involved meant that we could not undertake our preferred method of scenario building which would involve regular face-to-face contacts running throughout the project with policy-makers and other interested groups. We, therefore, adopted the approach set out above. The approach we adopted worked fairly well and we were able to incorporate the views of a range of academic experts on migration and it is anticipated that we will be able to incorporate the views of a number of policy makers in the final version of this Report. Our approach did have limitations in the context of an exploratory project such as this. Some of these limitations may have extended to other scenario building processes. The key limitations are these: First, on an exploratory project such as this, which is dealing with a relatively new trend, the project team needs to build its expertise and knowledge of the specific phenomenon being researched. It is only when this process is well under way that the team is in a position to bring this expertise to bear on the scenario-building process. It is only then that external experts can be brought into the process.

101
Second, whilst we were able to approach experts on migration relatively early on in the project, as these were known to us through the literature and through our existing networks, the exploratory nature of the work also meant that we could only identify and ‘appoint’ our policy expert panel once the field work was well underway, as it was primarily through our fieldwork that we could establish which policymakers had the knowledge to contribute and would be willing to contribute. These first two factors meant that scenarios could only be sent to policy experts towards the end of the work process, rather than involving them from the beginning. We anticipate receiving a full set of responses in the coming weeks. Third, although our expert academics largely approved of our approach to factor identification, there were some reservations as to whether this approach could entirely capture the complexity of the processes under review. It is not clear, however, whether the more traditional approach to scenario-building would have done so either.

102
References Ashby, R., 2005. Looking overseas to plug North skills gap. The Journal (Newcastle). 11.3.05, 33.
Barrett, G., Jones, T. and McEvoy, D., 2001, Socio-economic and policy dimensions of the mixed embeddedness of ethnic minority business in Britain, Journal of Ethnic and Migration Studies, 27/2, 241-258.
BBC News Online, 2005, Union campaign on migrant workers, http://news.bbc.co.uk/1/hi/wales/4158068.stm 17.8.05, accessed 24.8.05.
Bijak, J., Kupiszewski, M. and Kicinger, A., 2004, International Migration Scenarios for 27 European Countries 2002-2052, Central European Forum for Migration Research, Warsaw, 4/2004 http://www.cefmr.pan.pl/docs/cefmr_wp_2004-04.pdf.
Burgers, J., 1998, In the margin of the welfare state: Labour market position and housing conditions of undocumented immigrants in Rotterdam, Urban Studies, 35/10, 1855-1868.
Chrisafalis, A., 2005. Migrants' grim deal thrown into tragic relief. The Guardian. 13.1.05, http://www.guardian.co.uk/Northern_Ireland/Story/0,2763,1389158,00.html.
Citizens Advice Bureau, 2005, Supporting Migrant Workers in Rural Areas: A Guide to Citizens Advice Bureaux Initiatives, Citizens Advice: London.
Clark, R., 2005. It's the economy, glupi. The Telegraph. 23.1.05, http://money.telegraph.co.uk/news/main.jhtml?xml=/news/2005/01/23/ntory223.xml&sSheet=/news/2005/01/23/ixnewstop.html.
Clarke, J. and Salt, J., 2003, Work Permits and Foreign Labour in the UK: A Statistical Review, Labour Market Trends, November, 563-574.
Coombes, M. and Raybould, S., 2001, Public policy and population distribution: developing appropriate indicators of settlement patterns, Government & Policy, 19, 223-248.
CRESR, CUPS and EIUA, 2003, Seeking Asylum in NDC Areas: A Report on Experiences, Policies and Practices, Centre for Regional Economic and Social Research, Sheffield Hallam University, Sheffield, Research Report 18.
Davis, J., 2005, Mapping Migrant Workers: Report to the SCADIM Executive, Selby Communities and District Industrial Mission, Selby.
Dustmann, C., Casanova, M., Fertig, M., Preston, I. and Schmidt, C., 2003, The Impact of EU Enlargement on Migration Flows, Home Office Online Report, London, 25/03 http://www.homeoffice.gov.uk/rds/pdfs2/rdsolr2503.pdf.
Düvell, F., 2004, Polish Undocumented Immigrants, Regular High-Skilled Workers and Entrepreneurs in the UK, Instytut Studiów Społecznych, Warsaw, Prace Migracyjne 54 May http://www.iss.uw.edu.pl/osrodki/cmr/wpapers/pdf/054.pdf.

103
ePolitix.com, 2005. Bank chief intervenes in immigration issue. ePolitix.com. 10.8.05, http://www.epolitix.com/EN/News/200508/5a940d06-af20-4a77-af73-cb78ccf674e5.htm.
Erdmans, M., 1998, Opposite Poles: Immigrants and Ethnics in Polish Chicago, 1976-1990, Pennsylvania State University Press: Philadelphia.
Florida, R., 2000, The Rise of the Creative Class, Basic Books: New York.
Garnier, P., 2001, Foreign workers from central and eastern European countries in some OECD European countries: Status and social protection, in Organisation for Economic Co-operation and Development (ed.) Migration Policies and EU Enlargement The Case of Central and Eastern Europe, OECD, 131-154.
Gilpin, N., Henty, M., Lemos, S., Portes, J. and Bullen, C., 2006, The Impact of Free Movement of Workers from Central and Eastern Europe on the UK Labour Market, Working Paper 29, HMSO: London.
Grzymala-Kazlowska, A., 2005, From ethnic cooperation to in-group competition: Undocumented Polish workers in Brussels, Journal of Ethnic and Migration Studies, 31/4, 675-697.
Home Office, DWP, Inland Revenue and ODPM, 2005, Accession Monitoring Report May 2004 - June 2005, Joint Report, London,
Housing Today, 2004a. Charity helps homeless Poles into work. Housing Today. 15.10.04, http://www.housing-today.co.uk/story.asp?storycode=3042168.
Housing Today, 2004b. Charity pays for migrants to work in Belfast. Housing Today. 29.10.04, http://www.housing-today.co.uk/story.asp?storycode=3042785.
Housing Today, 2004c. Polish rough sleepers may be bussed back to Warsaw. Housing Today. 30.7.04, http://www.housing-today.co.uk/story.asp?storyType=10§ioncode=306&storyCode=3038735.
Housing Today, 2004d. Welcome to Britain. Housing Today. 30.7.04, http://www.housing-today.co.uk/story.asp?storyType=10§ioncode=309&storyCode=3038822.
IOM, 1998, Migration Potential in Central and Eastern Europe, United Nations Publications: Geneva.
Jażwińska, E. and Okólski, M., (eds.) 2001, Ludzie na Huśtawce: Migracje między Peryferiami Polski i Zachodu, Scholar, Warsaw.
Jeffries, S., 2005. Why every middle-class homeowner needs a Poles: Workers of the world. The Guardian. 9.3.05, http://www.guardian.co.uk/immigration/story/0,15729,1433412,00.html.
Jordan, B., 2002, Polish Migrant Workers in London: Mobility, labour markets and prospects for democratic development, Beyond Transition: Development Perspectives and Dilemmas, Warsaw, 12-13.4.02.
Jordan, B. and Düvell, F., 2002, Irregular Migration: Dilemmas of Transnational Mobility, Edward Elgar: Cheltenham.
104
Kay, D. and Miles, R., 1992, Refugees or Migrant Workers? European Volunteer Workers in Britain 1946-51, Routledge: London.
Kloosterman, R. and Rath, J., 2001, Immigrant entrepreneurs in advanced economies: mixed embeddedness further explored, Journal of Ethnic and Migration Studies, 27/2, 189-201.
Kloosterman, R. and van der Leun, J., 1999, Just for starters: Commercial gentrification by immigrant entrepreneurs in Amsterdam and Rotterdam neighbourhoods, Housing Studies, 14/5, 659-977.
Light, I. and Gold, S., 2000, Ethnic Economies, Academic Press: San Diego.
Long, G., 2005, "Old Europe" offers Poles profits and perils, http://go.reuters.co.uk/newsArticle.jhtml?type=worldNews&storyID=877797 27.9.05, accessed 28.9.05.
Malheiros, J. and Vala, F., 2004, Immigration and city change: the Lisbon metropolis at the turn of the twentieth century, Journal of Ethnic and Migration Studies, 30/6, 1065-1086.
McLaughlin, D. and Smith, D., 2005. Doctors go west in Polish brain drain. The Observer. 15.5.05, http://observer.guardian.co.uk/international/story/0,6903,1484268,00.html.
Migrationwatch UK, 2003, The impact on immigration of the EU expansion to Eastern Europe, Migrationwatch UK, 27.6.03 http://www.migrationwatchuk.org/pdfs/TheimpactofEUenlargement.pdf.
Miles, R. and Kay, D., 1990, The TUC, foreign labour and the Labour government 1945-1951, Immigrants and Minorities, 9/1, 85-108.
Murdie, R., 2003, Housing affordability and Toronto's rental market: perspectives from the housing careers of Jamaican, Polish and Somali newcomers, Housing, Theory and Society, 20/4, 183-196.
Musterd, S. and Deurloo, R., 2002, Unstable immigrant concentrations in Amsterdam: Spatial segregation and integration of newcomers, Housing Studies, 17/3, 487-503.
peterboroughtoday, 2005. Migrants facing misery. peterboroughtoday. 19.6.04, http://www.peterboroughtoday.co.uk/ViewArticle2.aspx?SectionID=845&ArticleID=809580.
Phillimore, J., 2005, West Midlands Regional Housing Strategy - West Midlands Regional Spatial Strategy Shared Evidence Base: Asylum Seekers And Refugees, Centre for Urban and Regional Studies, Birmingham.
Pichelmann, K., 2001, East-West Migration Flows Following Enlargement: A Tentative Assessment, 15th Annual Conference of ESPE, Athens, 14-16.6.01.
politics.co.uk, 2005, Row over EU worker numbers, http://www.politics.co.uk/domestic-policy/row-over-eu-worker-numbers-$8602972.htm 27.5.05, accessed 31.5.05.
Portes, J. and French, The Impact of Free Movement of Workers from Central and Eastern Europe on the UK Labour Market: Early Evidence, Working Paper 18, HMSO: London.

105
renewal.net, n.d., Asylum Seekers in New Deal for Communities Areas.
Rennie, D., 2005. EU urged to give British welcome to Polish plumbers. The Telegraph. 7.9.05, http://www.telegraph.co.uk/news/main.jhtml?xml=/news/2005/09/07/weu07.xml&sSheet=/news/2005/09/07/ixworld.html.
Robinson, V., 2003, An evidence base for future policy: reviewing UK resettlement policy, in Gelsthorpe, V. and Herlitz, L. (eds.) Listening to Evidence: The Future of UK Resettlement, Home Office, London, 3-18.
Rogaly, B. and Taylor, B., 2004, Migrant Working in West Norfolk, Norfolk County Council: Norwich.
Simpson, M., 2005. Building demands reducing. gazeta.pl. 12.7.05, http://www.polishworkers.pl/europraca/1,60747,2816536.html.
Thomas, W. and Znaniecki, F., 1995, The Polish Peasant in Europe and America, University of Illinois Press: Chicago.
Tomlinson, G., 2005. Shipworkers lose out to foreigners. The Evening Chronicle. 6.4.05, http://icnewcastle.icnetwork.co.uk/eveningchronicle/eveningchronicle/tm_objectid=15372297%26method=full%26siteid=50081-name_page.html.
Traser, J., 2005, Who’s Afraid of EU Enlargement? Report on the Free Movement of Workers in EU-25, European Citizen Action Service, Brussels, August http://www.ecas.org/file_uploads/786.pdf.
TUC, 2004a, Gone West: Ukrainians at Work in the UK, TUC: London.
TUC, 2004b, Propping Up Rural and Small Town Britain, Trades Union Congress, London.
van der Heijden, K., Bradfield, R., Burt, G., Cairns, G. and Wright, G., 2002, The Sixth Sense: Accelerating Organizational Learning with Scenarios, Chichester: John Wiley & Sons.
Wallace, C., 2002, Opening and closing borders: migration and mobility in East-Central Europe, Journal of Ethnic and Migration Studies, 28, 603-625.
Wallace, C. and Stola, D., (eds.) 2001, Patterns of Migration in Central Europe, Palgrave, Basingstoke.
Weaver, M., 2005. Key workers offered new flat pack homes. The Guardian. 11.5.05, http://society.guardian.co.uk/keyworkers/story/0,1266,1481470,00.html.
Winkelmann-Gleed, A. and McKay, S., 2005, Migrant Workers in the East of England, WLRI, London Metropolitan University, London, Research report for East of England Development Agency, Cambridge
Winterman, D., 2005. Here to stay? BBC News Online. 16.6.05, http://news.bbc.co.uk/1/hi/magazine/4087408.stm.
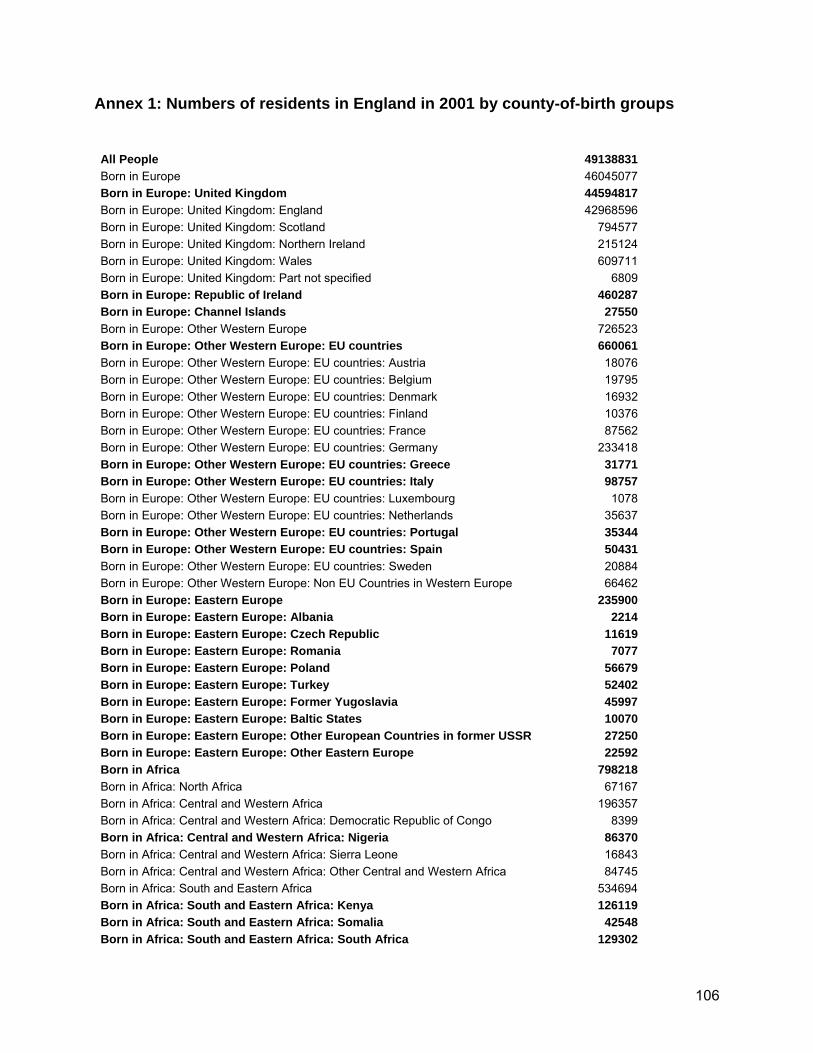
106
Annex 1: Numbers of residents in England in 2001 by county-of-birth groups All People 49138831 Born in Europe 46045077 Born in Europe: United Kingdom 44594817 Born in Europe: United Kingdom: England 42968596 Born in Europe: United Kingdom: Scotland 794577 Born in Europe: United Kingdom: Northern Ireland 215124 Born in Europe: United Kingdom: Wales 609711 Born in Europe: United Kingdom: Part not specified 6809 Born in Europe: Republic of Ireland 460287 Born in Europe: Channel Islands 27550 Born in Europe: Other Western Europe 726523 Born in Europe: Other Western Europe: EU countries 660061 Born in Europe: Other Western Europe: EU countries: Austria 18076 Born in Europe: Other Western Europe: EU countries: Belgium 19795 Born in Europe: Other Western Europe: EU countries: Denmark 16932 Born in Europe: Other Western Europe: EU countries: Finland 10376 Born in Europe: Other Western Europe: EU countries: France 87562 Born in Europe: Other Western Europe: EU countries: Germany 233418 Born in Europe: Other Western Europe: EU countries: Greece 31771 Born in Europe: Other Western Europe: EU countries: Italy 98757 Born in Europe: Other Western Europe: EU countries: Luxembourg 1078 Born in Europe: Other Western Europe: EU countries: Netherlands 35637 Born in Europe: Other Western Europe: EU countries: Portugal 35344 Born in Europe: Other Western Europe: EU countries: Spain 50431 Born in Europe: Other Western Europe: EU countries: Sweden 20884 Born in Europe: Other Western Europe: Non EU Countries in Western Europe 66462 Born in Europe: Eastern Europe 235900 Born in Europe: Eastern Europe: Albania 2214 Born in Europe: Eastern Europe: Czech Republic 11619 Born in Europe: Eastern Europe: Romania 7077 Born in Europe: Eastern Europe: Poland 56679 Born in Europe: Eastern Europe: Turkey 52402 Born in Europe: Eastern Europe: Former Yugoslavia 45997 Born in Europe: Eastern Europe: Baltic States 10070 Born in Europe: Eastern Europe: Other European Countries in former USSR 27250 Born in Europe: Eastern Europe: Other Eastern Europe 22592 Born in Africa 798218 Born in Africa: North Africa 67167 Born in Africa: Central and Western Africa 196357 Born in Africa: Central and Western Africa: Democratic Republic of Congo 8399 Born in Africa: Central and Western Africa: Nigeria 86370 Born in Africa: Central and Western Africa: Sierra Leone 16843 Born in Africa: Central and Western Africa: Other Central and Western Africa 84745 Born in Africa: South and Eastern Africa 534694 Born in Africa: South and Eastern Africa: Kenya 126119 Born in Africa: South and Eastern Africa: Somalia 42548 Born in Africa: South and Eastern Africa: South Africa 129302

107
Born in Africa: South and Eastern Africa: Zimbabwe 46379 Born in Africa: South and Eastern Africa: Other South and Eastern Africa 190346 Born in Asia 1566998 Born in Asia: Middle East 211298 Born in Asia: Middle East: Cyprus 74757 Born in Asia: Middle East: Iran 40187 Born in Asia: Middle East: Iraq 29927 Born in Asia: Middle East: Other Middle East 66427 Born in Asia: Far East 360604 Born in Asia: Far East: China 47201 Born in Asia: Far East: Hong Kong 84770 Born in Asia: Far East: Japan 35322 Born in Asia: Far East: Malaysia 45059 Born in Asia: Far East: Singapore 36327 Born in Asia: Far East: Other Far East 111925 Born in Asia: Far East: Asian countries in former USSR 3203 Born in Asia: South Asia 991893 Born in Asia: South Asia: Afghanistan 14481 Born in Asia: South Asia: Bangladesh 150057 Born in Asia: South Asia: India 450493 Born in Asia: South Asia: Pakistan 304706 Born in Asia: South Asia: Sri Lanka 66330 Born in Asia: South Asia: Other South Asia 5826 Born in North America 460258 Born in North America: Canada 59356 Born in North America: United States of America 141198 Born in North America: Jamaica 145234 Born in North America: Other Caribbean and West Indies 106280 Born in North America: Other North America 8190 Born in South America 72867 Born in Oceania 155072 Born in Oceania: Australia 96437 Born in Oceania: New Zealand 53466 Born in Oceania: Other Oceania 5169 Born Elsewhere 40341

108
Annex 2: Further detail on 2001 patterns of country-of-birth groups This part of the report (which is largely unchanged from middle sections of the Interim Report) reports the LQs at the level of the Government Office region (GOR). This provides context to the second stage, looking at data for the 46 English counties as they were in 1991 (ie. prior to the mid-1990s local government reorganisations). These include former counties such as Avon, Cleveland, Hereford & Worcester and Humberside: they are here termed 1991 counties (although the term used in ODPM household projections since 1998 has been “virtual counties”). With 47 CoBs and 46 counties, the LQ tables are too large to be presented within the main body of this report. London stands out as having a higher than average representation of virtually all of the selected 47 CoBs. The only significant exception – necessary to make the others possible statistically – is for the UK-born (with an LQ of 0.80). This indicates that the proportion of London’s population that is UK-born was 20% lower than the national average. The only other one of the selected 47 CoBs that is underrepresented is the Channel Isles (0.87). The CoBs with the highest level of over-representation in London are Nigeria and Somalia, both five and a half times greater proportion than the norm. Other CoBs with LQs of 3 or higher, and listed here in descending order of LQs, are Turkey, Sri Lanka, Cyprus, Portugal, South America, Iraq, Caribbean (excluding Jamaica), Bangladesh, Jamaica, Former Yugoslavia, Japan, Iran, Rest of World, New Zealand and Spain. By contrast, the UK-born are over-represented in all the other 8 GORs. Besides this, there are so few cases of over-representation (LQs higher than 1) that it is not difficult to list them all (with countries of Eastern Europe highlighted in bold).
• South East has the most cases: those born in Channel Isles, Greece, Italy, Portugal, Spain, Czech Republic, Romania, Republic of South Africa, Zimbabwe, China, Hong Kong, Japan, Malaysia, Singapore, Australia and New Zealand
• South West: only the Channel Isles • East of England: just Italy, Czech Republic and North America as a whole • East Midlands: Poland (but only just, at 1.01), Baltic States, Kenya and India • West Midlands: Irish Republic, India, Pakistan and Jamaica • Yorkshire and the Humber: Albania and Pakistan • the North West: Pakistan • the North East: none.
Because of the larger number of areas, it is more difficult to summarise the patterns for the 46 counties. Greater London is the same as London GOR just described, so attention is focussed on the other 45 and just on Eastern Europe. The classification below will set these in their wider context. Looking at the Eastern Europe CoBs, the counties other than Greater London with LQs above 1 are listed below (not ranked, but in alphabetical order, first by former metro county, and then shire county). Albania: SYorks, Tyne&Wear, WMids, WYorks, Beds, Berks, Cleveland, Essex, Leics, Norfolk,
Northants, Oxon Czech Republic: Berks, Bucks, Cambs, ESussex, Herts, Kent, Oxon, Surrey, WSussex Romania: Berks, Bucks, Cambs, ESussex, Northants, Oxon, Surrey

109
Poland: WYorks, Beds, Berks, Bucks, Cambs, Leics, Northants, Notts, Oxon, Surrey Turkey: none Former Yugoslavia: Beds, Berks, Northants, Oxon Baltics: WYorks, Beds, Cambs, Derbys, Leics, Northants, Notts, Warwicks, WSussex Former USSR in E Europe: GManch, WYorks, Berks, Cambs, ESussex, Notts, Oxon, Surrey Other E Europe: Beds, Berks, Bucks, Cambs, ESussex, Herts, Oxon, Surrey. A classification of counties has been derived from an exploratory analysis of the LQs of 47 CoBs for 46 counties, using hierarchical cluster analysis and k-mean cluster analysis. Ten clusters of counties were recognized in all, four of which are single counties. The results are as follows, with the final cluster centres with CoB LQs of over a certain level listed here. 1) Greater London: all CoBs except UK and Channel Isles are over 1.2 2) Leicestershire: Poland, Baltics, Kenya, Zimbabwe, India (also Africa and Asia at group level)
are over 1.2 3) Bedfordshire: Irish Republic, Italy, Albania, Former Yugoslavia, Baltics, E Europe Other,
Kenya, Zimbabwe, China, Bangladesh, India, Pakistan, Jamaica, Caribbean rest, Rest of World (and Asia and North America at group level) are over 1.2
4) West Midlands county: Irish Republic, Albania, Iraq, Bangladesh, India, Pakistan, Jamaica, Caribbean rest, Rest of World (and Asia and North America at group level) are over 1.2
5) Greater Manchester, West Yorkshire: Former USSR in Europe and Pakistan are over 1.2 6) Berks, Bucks, Oxon, Surrey: Channel Isles, Italy, Spain, Czech Republic, Romania, USSR-
Europe, E Europe Other, South Africa, Zimbabwe, China, Hong Kong, Japan, Malaysia, Singapore, Pakistan, Australia and New Zealand (and EU, N America, Far East, Oceania at group level) are over 1.2
7) Avon, Cambs, Dorset, ESussex, Herts, Hants, Kent, WSussex, Wilts: only Channel Isles and Singapore are over 1.2
8) Essex, Northants, Notts, Warwicks: none above 1.0 except UK (1.04) and Baltics (1.01), and the only others above 0.8 are Poland (0.88), Irish Republic, Channel Isles
9) Cheshire, Cornwall, Devon, Gloucs, Hereford&Worcs, Isle of Wight, Lincs, Norfolk, NYorks, Shropshire, Somerset, Suffolk: none above 1.0 except UK (1.06) and Channel Isles (1.19), and the only other above 0.8 is Singapore (0.97)
10) Cleveland, Cumbria, Derbyshire, Durham, Humberside, Lancs, Merseyside, Northumberland, Staffs, SYorks, Tyne &Wear,: none above 0.8 except UK (1.07)

110
Annex 3: Key Transport Connections between the UK and Poland Flights to Warsaw Gatwick –Warsaw LOT Polish Airlines 3 flights a day Heathrow –Warsaw British Airways 3 flights a day Luton – Warsaw Easyjet 1-2 flights a day Stansted – Warsaw SkyEurope everyday except Sat Gatwick – Warsaw Centralwings twice a day Edinburgh – Warsaw Centralwings Mon – Fri Leeds – Warsaw Centralwings Tues, Thurs, Sat Luton – Warsaw Wizzair twice a day Liverpool – Warsaw Wizzair Mon, Thurs, Fri, Sun Glasgow – Warsaw Wizzair Tues, Thurs, Sat
Flights to Kraków Stansted – Kraków Ryanair twice a day Glasgow – Kraków Ryanair Tues, Thurs, Sat Stansted – Kraków Sky Europe twice a day Manchester – Kraków Sky Europe Tues, Thurs, Sat Birmingham – Kraków Sky Europe Weds, Sat Edinburgh – Kraków Sky Europe Tues, Thurs, Sat Luton – Kraków Easyjet Everyday Gatwick – Kraków Centralwings Everyday Gatwick – Kraków British Airways Everyday Liverpool – Krakow Easyjet Mon, Weds, Fri, Sun
Other Regional Flight Connections Stansted Ryanair Rzeszów, Szczecin, Gdańsk,
Łódź, Poznań, Wrocław and Bydgoszcz
Everyday
East Midlands
Ryanair Łódź Tues, Thurs, Sat
East Midlands
Ryanair Wrocław Mon, Weds, Thurs, Sun
Edinburgh Centralwings Katowice, Gdańsk Glasgow Wizzair Gdańsk Tues, Thurs, Sat Liverpool Wizzair Gdańsk Tues, Thurs, Sat Liverpool Wizzair Katowice Tues, Thurs, Sat,
Sun Luton Wizzair Poznań Mon, Weds, Thurs,
Fri, Sun Luton Wizzair Katowice Twice a day Luton Wizzair Gdańsk Twice a day, except
Tues Thurs, Sat – once a day
All listed airlines provide flights connection in both directions (to and from Poland).

111
Coach Eurolines, Orbis, EuropaExpres, Eurobus, Acorn, Polonia Transport are just a few of many coach operators who travel from UK to every large and medium size town in Poland. Timetables are available at: www.aura.pl. Buses usually start their routes in major cities (London, Birmingham, Manchester) but are interconnected with local buses operators enabling travel form different places in UK. In Poland buses, key starting points/destinations are major cities such as Warsaw, Kraków, Poznań, Wrocław, Gdańsk, Białystok, Lublin, Rzeszów and many other Polish towns. Example of coach connections:
Warsaw – London –Warsaw 6-9 everyday connections
Kraków – London – Kraków 4-7 everyday connections
Białystok – London - Białystok 2-5 everyday connections
Rzeszów – London - Rzeszów 2-5 everyday connections
Kraków – Birmingham - Kraków 1-2 everyday connections
Warsaw – Glasgow – Warsaw 1-2 everyday connections
Kraków – Glasgow - Kraków 1-2 everyday connections
Kraków – Newcastle – Kraków Mon, Thurs, Sat
Warsaw – Newcastle – Warsaw Mon, Thurs, Sat

112
Annex 4
Migration and Demographic Change: Assessing the Local and Regional Impacts of International Migration – ODPM New Horizons Programme, Theme 1b I.
Guidance on completing Key Factor Score Card and Plausibility Score Card We are currently engaged in a scenario building process for the above research project. As part of that exercise we would like you to comment on our understanding of the key factors behind current migration trends from the A8 countries to the UK and on our hypotheses as to how these factors might change over the next 10 years, i.e., up to 2016. The attached Key Factors Sheet sets out 14 key factors which we believe help explain current flows of migration from A8 countries to the UK. These factors are numbered are set out in bold (1 to 14) each with a short accompanying text in italics. A Key Factors Score Card is also attached. Could you please complete that score card by scoring each key factor in line with the importance you attach to each (1 is low importance 5 is high), placing a X next to the relevant box. If you feel there are other factors which we have not cover please add these at the bottom of the score card and rate them in line with the scoring system (no need to create boxes etc. merely make statement and place relevant score in bracket at end of statement). We have also developed a set of statements which raise questions about the continuing importance of the key factors in the future. These are also set out on the Key Factor Sheet in numbered bullets under the appropriate Key Factor (1.1…..14.3). A Plausibility Score Card is attached which asks you to rate the plausibility of the possible trends and events which will have identified and that we think could impact on Key Factors. Please score each statement as the scale given (highly plausible, plausible, not plausible, don’t know) by placing an X next to the relevant box. You will see on the Key Factors Sheet that each numbered bullet has a sign at the end (+) (-) or (?). These signs indicate that we think that if the statement indicates a plausible development then it will either potentially increase migration flows to the UK (+), potentially decrease flows to the UK (-), have no impact or we are not confident enough to say what the potential outcome would be (?). If you think that the direction of outcome indicated is incorrect feel free to say so, though you may wish to do so only where you think this is significant, given the time involved. Finally, we would be grateful for any written commentary you wish to provide on particular parts of the Key Factors document in which you have particular expertise. Any input which helps our understanding of the ‘push’ factors from A8 countries and from countries which will or may gain accession to the EU would be particularly welcome.

113
Annex 5
Key factors Sheet
Key Factors in Current and Future A8(+2)45 Migration to the UK
1 Ageing population in UK Proportion of +64 in population has grown in UK with increased need for migrant labour to address resulting general labour shortage and also to address labour shortfall in elder related health and social care workforce. 1.1 Proportion of +64 will continue to grow until 2016 and thus increase in labour through
migration will be required. (+) 1.2 Ageing more pronounced in some other parts of EU15 and this will continue until 2016 so
competition for migrants to replace general labour market shortfall and shortfall in health and social care may emerge when Transition Measures end. (-)
1.3 Ageing more pronounced in some A8 countries so more employment opportunities may
emerge for younger people in home labour markets making migration less attractive/necessary in the group most likely to seek work abroad. (-)
1.4 Recent more family friendly UK policies may lead to faster natural replacement and
stimulate total fertility rates, but impact in terms of workforce will not be felt before 2016. Increased demand for childcare labour may increase demand for migrants. (-)
2 Population decline in some parts of UK Because of ageing population, low fertility replacement rates and outflow of population, certain parts of the UK are suffering from population decline. Nascent regional policies are emerging to address these issues through encouraging migration. 2.1 Population decline is predicted to continue in regions such as Scotland and North East
England until 2016 and, if jobs do not reduce, the demand for migrants will continue. (+)
2.2 Migration of existing UK citizens is expected to continue with downward impact on population size. UK policy is therefore likely to favour (selective) migration. (-)
45 The terms +2 refers in this document to Romania and Bulgaria who will accede to the Union in 2007. This situation regarding other ECE countries is less certain, but talks with Ukraine are due to begin in 2007

114
2.3 Competition from other areas of population decline and population increase in Europe will grow as Transition Measures end potentially reducing the supply of migrants for UK to draw on. (-)
3 Skills shortages in the UK economy There are structural problems in the UK economy which means that there are skills gaps whether economy is healthy or frail. The skills gap is apparent at both the top and bottom ends of labour market and means that migrants are required at both ends 3.1 Skill shortages likely to continue to 2016 for high, medium and low skills-level
employment. (-) Demand for ‘knowledge workers’ (KW), or ‘creatives’, to expand throughout the UK, including regions with low knowledge economy component leading to increased demand for skilled migrant workers from A8+2. 3.2 UK migration policy moving towards skill based points system focusing on KWs and
seeking to encourage inward migration in this area. (?) 3.3 Policy moving towards preference for EU migrants in areas such as medicine and health
care, partly in order to lessen effects of UK migration demands on third world economies, increasing demand for A8+2 medics. (+)
3.4 Regional initiatives to attract high skilled KW and to retain existing foreign KW (e.g.,
students). Government policy changes to support this approach (e.g., easier access to visa extensions). (+)
3.5 Firm initiatives to attract and retain high skilled KW. Government policy changes to
support this approach (e.g., easier access to visa extensions). (+) 3.6 Stricter security-related migration policy in US prevents easy access to US labour market
and increases supply for UK46. (+) 3.7 A8+2 migrant workers need to compete with highest skilled KW, entrepreneurs and
workers to fill ‘shortage jobs’ from around the globe under new ‘Australian-style’ migration rules. (?)
3.8 The UK will experience fierce and increasing competition for KWs from most advanced
countries and advanced developing countries reducing supply to UK and danger of UK being merely an entry point to improve English, first job, etc., with migrants staying on a temporary basis before moving on. (+)
46 See arguments from Florida and Tingali (2004) ‘Europe in the Creative Age’

115
UK has low productivity and low skills equilibrium economy (across most of the country, but most pronounced in certain regions including rural East Anglia and North East England) and therefore has a need to draw on a large pool of low and semi skilled workers. This has sustained migration including recent A8+2 migration. 3.9 US’s stricter security-related migration policy opens opportunities for UK (and EU) to
attract KW from around the world reducing demand from A8+2. A8+2 migrants have easier access to US compared to workers from many other countries. Net result (from UK perspective) is reduced flow to UK. (-)
3.10 New migration rules severely limit permissions from low skill workers beyond EU and
assume that A8+2 (plus subsequent pre-Accession countries?) will fill unskilled jobs causing increased demand for A8 migrants. (+)
3.11 The UK successfully moves away from its low-productivity, low skills equilibrium. (-) 3.12 Skills shortages may be ameliorated to some extent, reducing requirements for migrant
labour in key areas of labour shortage (e.g., significant resources into construction, and care recruitment and training). (-)
3.13 Increasing requirement for accredited qualifications in some ‘migrant-intensive’ sectors
such as construction and health and social care. Accreditation process not migrant friendly: needs sustained employment, basic+ English, out-of-work-hours study. (-)
3.14 Employers become increasingly frustrated about low standards of English by migrant
workers and costs of upskilling. (-) 3.15 Structural changes in the type of work available. Migrant labour as ‘last gasp’ in global
competitiveness battle leading to reduction in unskilled labour requirements. Offshoring of manufacture and service jobs (including to A8+2) dampens migrant demand. (-)
4 Demand for migrants to fill flexible, seasonal, low paid and ‘dirty’ work A related, but separate point to the skills debate is that migration is required to counter the fact that there is a shortage of UK workers willing to undertake precarious, seasonal, on-call, low paid, dirty or dangerous work. 4.1 New migration rules may increase role of A8+2 workers in these jobs by excluding non-
EU workers from certain jobs. (+) 4.2 Positive impact of CAP reforms on large UK producers vis-à-vis smaller producers, with
increased demand for migrant workers (+)

116
4.3 Continued mechanisation of agriculture and horticulture, decreasing overall demand for labour. (-)
4.4 Decline in agricultural production in UK as CAP and WTO reforms increase amount of
food imported and exported as UK becomes less competitive? (-) 4.5 Decline in seasonal employment in agriculture due to decrease in seasonal production
(through polytunnels, etc.), offset to some extend by seasonal tourist and hospitality (but different workers?). (?)
4.6 But continued/growing food preparation, packaging and processing in UK? (+) 4.7 Continued/increased dominance of UK food production, processing and packaging by
supermarkets and continued consumer demand for ‘value added’ and processed food with concomitant demand for JIT and on call workers. (+)
4.8 Disinclination of some A8+2 workers from undertaking such work once qualifying for
UK tax paid benefits. (?) 4.9 Extension of ‘workfare’ benefits environment in UK in order to reduce ‘disincentives’ for
workers undertaking such work. Also applies to A8+2 workers who are disinclined to undertake such work. (-)
4.10 Continued limited impact of ‘workfare’ policies on ‘hard to reach’ UK workers. (+)
5 Higher comparative growth rates in the UK than much of EU15 The UK has seen steady and sustained growth since the mid-1990s with employment levels growing to record levels, exacerbating skill shortages labour shortages migrant labour to meet demand. 5.1 Any slowdown in the economy could reduce the needs for migrant labour. (-)
5.2 Short term approach by employers. Evidence from our research that tightening of labour
market increases demand from local labour pool (e.g., bus drivers) and reduces incentives for employers to engage in expensive recruitment drives and language courses in jobs where customer interface important. (-)
5.3 However, also evidence of high value placed on A8 migrant workers by UK employers
and they may still be preferred to UK workers in times of slow and uncertain growth. (+)
5.4 High public service expenditure will come to an end reducing opportunities in one of the key areas of employment growth, including for low wage workers, over past 8 years. (?)
117
5.5 Demand in specific migrant-intensive sectors such as elder care will continue to grow because of structural demand, constraints on spending will keep down wages which means more migrants required. Construction work may decline overall, but certain long-term strategic projects will continue, for example, Thames Gateway, building projects in East of England, the Olympic Games. (+)
6 Relative strength of UK economy in relation to other parts of EU15 Growth, but not necessarily productivity has been stronger in the UK than in some other EU countries. In particular employment performance has been stronger than in other large EU15 countries. This has created opportunities for migrant workers from A8 countries. 6.1 UK unemployment begins to rise as ‘economic cycle’ comes to an end. Short term
adjustments leading to short term reduction in demand for migrant workers. ‘Flexible’ UK labour market allows employers to ‘switch off’ migrant demand. (-)
6.2 Long-term structural weaknesses, including debt burden (consumer, private sector, public
sector), inequalities in income, poor performance, decline in manufacturing base, off-shoring of service work, leads to stagnation and higher and longer-term unemployment. (-)
6.3 (Partial) recovery of larger EU15 economies and falling unemployment levels
accompanied by further ‘flexibilisation’ of labour markets and ending of Transition Measures, creating demand for migrant workers. (-)
6.4 Higher levels of pay (and benefits) in other EU15 countries post-Transition Measures
attracting migrant workers away from UK 6.5 Lagging A8 countries including main migrant exporters to UK (Poland and Lithuania)
reduce unemployment and create employment opportunities reducing the flow of migrants. (-)
6.6 Greatest demand in faster growing EU15 though fastest growing are smallest so total
demand limited. (?)
7 UK’s ‘open’ labour market approach and light regulatory touch Part of UK’s success in attracting A8 migrants is due to being one of only three EU15 states to open up labour market to workers from accession states. The other two states Ireland and Sweden very small labour markets.

118
7.1 Scrapping of one year working proviso in entitlement to benefits for A8 workers and introduction of reciprocal arrangements in line with EU Treaties could increase flow of workers, but less inclined to stick with worst jobs for extended periods. (+)
7.2 New points migration system based on skills A8 migrants may still compete with other
migrants for high skilled and ‘skilled with job offer’ jobs, could have a negative impact on A8+2 skilled, but many current non-EU low skilled migrant workers excluded from permissions, with jobs expected to be filled by EU workers, thus increasing demand for A8+2 workers. (+)
7.3 Effects of ending transition measures mitigated to some degree by any ‘fudging’ by
member states in reaction to internal political pressures if unemployment still high. (+)
7.4 More fundamental reappraisal of open markets policy by some European countries in reaction to continued high levels of unemployment, ‘protectionist’ policies (national economic champion debates around Merger and Acquisition activity) and general moves to the right politically. (+)
7.5 New migration controls may lead to increase undocumented migrants as the cost and
obligations of employing documented workers increases with A8+2 in competition with those workers. (-)
7.6 Change of UK government leads to (even) stricter controls on migrants. If A8+2 workers
excluded from restrictions more demand, if included less demand. (?)
7.7 A second round of countries, led by Finland and Spain end ‘transition measures’ in 2006, followed by some others in 2009. All EU15 open to A8+2 migrants by 2011, with slowing of flow to UK as other opportunities emerge in countries with higher levels of worker protection. (-)
7.8 Increase in wages for A8 migrants in UK if less competition from non-EU migrants for
low skilled jobs as a result of migration policy change
8 English language as an attractor People are attracted to the UK in order to learn to speak English or to improve existing English, as it is seen as the international language and may open career and other opportunities. 8.1 English is likely to continue to be the key or one of the key international languages and
thus to act an attractor (?)
8.2 Some employers and local support agencies including training agencies provide basic English training for employees (such as ESOL). (?)

119
8.3 Realisation by migrants that most employers do not provide English training, that few courses are available, that available courses do not fit in with timing of work, are untailored to specific migrant groups, and may be expensive. (?)
8.4 Migrants find themselves working and living with other migrants outside work and have
few opportunities to learn English through interaction. (?)
9 Existing and growing networks There is evidence on evolving formal and informal networks which facilitate access to employment for migrants in the UK, particularly on short term basis 9.1 Networks grow stronger and thicker over time making it easier to obtain labour market
intelligence and information on services encouraging the migration process on a temporary or permanent basis. (+)
10 Ease of access to transport and relative reduction in transport costs The growth in low cost airlines and access to various forms of surface transport has eased access to UK labour markets. This transport regime has opened up a number of points of entry contributing to a more dispersed geography of migrant work in the UK. It has also made it cost effective (for some migrants) to arrange short stay work periods. 10.1 Low cost airlines continue to flourish making easy access to an increasing number of
points of entry in the UK from an increasing number of points of departure from A8+2 countries stimulating flows. (+)
10.2 Low cost airlines come under pressure particularly from new entrants, increasing oil
prices, changing in structure of airport charges, etc., and reduce number of flights (as margins per passenger already low), reducing numbers of migrants, numbers of points of entry, and changing patterns of settlement – fewer people staying longer? (-)
10.3 Substitution by other forms of transport possible but rising oil prices impacts on all forms
of transport. Group transport becomes more economical than personal transport, but this reduces flexibility for individuals. (-)
11 Length of stay in the UK The existing data sources allow us to analyse ‘flows’ or ‘stocks’. The flow data which is more current than stock data does not tell us about how long A8 migrants are remaining or are likely

120
to remain in the UK. Length of stay will clearly be an important factor in the cumulative numbers of migrants and their effects the labour market and services. 11.1 The majority of A8 migrants will settle permanently in line with previous generations of
migrants to the UK and bring their families with them. (+) 11.2 The majority of A8 migrants will stay only temporarily, returning home when they have
saved enough capital to ‘gain a start’ in their home country and as their home economies develop. (+)
11.3 The majority of migrants will develop a mix of behaviours with effectively dual
residence and dual employment locations
12 Growing Strength of A8 economies There is a ‘jobs deficit’ in several A8(+2) countries and average unemployment is higher and average employment levels lower in A8 than in EU15 countries. Levels vary between countries within both ‘blocs’. The UK has amongst the lowest unemployment levels and the highest employment levels. Poland, the main A8+2 exporter of workers to the UK has by far the highest levels of unemployment. Wage differentials between the UK (and EU15) and A8 are significant. The literature suggests that these economic factors are the key to understanding migration flows. But A8 economies have grown at twice the rate of EU15 economies since accession (albeit from lower base). 12.1 Continued differential growth of A8 and UK economies reduces supply of migrants as
A8 firms suck up over-supply of labour and new business start ups increase. (-)
12.2 Reduction in wage differentials between UK and A8+2 countries as economies grow, which, together with increased employment opportunities, lead to lower incentives to migrate for work. (-)
12.3 Increasing consumer demand for workers in the service sector reduces supply of certain
types of migrant (-)
12.4 Increased inward investment including by UK in production areas, including agriculture, processing and packaging, which currently use migrant labour from A8+2 countries (-)
12.5 EU Employment targets increase labour pool with women and other target groups
increasingly (re)entering the labour market, reducing pressure on wages. UK-A8 wage differentials remain and migration flows unaffected. (?)
12.6 Cuts in public expenditure in A8 economies act as a push factor for certain groups of
workers. (+)

121
12.7 Work related to recent inward investment flows into A8 reduces as work flows out of A8
countries to cheaper locations as wage inflation takes place. Out migration as a continuing response to decline in job opportunities. (+)
12.8 Inability of A8 economies to soak up redundant manufacturing, agricultural and other
low skilled labour means continued outflow, including to UK (+)
12.9 Removal of import duties and protection leads to reduction in local production as exports increased. (+)
12.10 8 countries allow/encourage inward-migration from outside Europe and from emerging
pre-Accession countries (see section X) to keep down wages, with continuing outward flows of existing A8 workers in search of higher wages. (+)
13 Future Accessions to the EU Our study in the UK has focused on A8 migrants, reflecting current policy concerns and the most robust data sources (through the WRS), further accessions to the EU are, however, likely to occur within our ten year time frame. Romania and Bulgaria, with a combined population of almost 30 million, are due to accede in 2007. 13.1 Migrants from Romania and Bulgaria (and from other new accession countries – see
below) exhibit the same patterns as A8 countries benefiting the UK in terms of labour supply (+)
13.2 Migrants from Romania and Bulgaria take advantage of post Transition Measure regimes
and travel to other countries besides the UK, Ireland and Sweden and to growing A8 countries (-)
13.3 The rapidly growing +2 economies (especially in Romania) dampen migration. (-)
13.4 Ukraine, with a population of around 47 million, will open accession negotiations with
CEC in 2007 and may gain access before 2016. Thus potential ‘EU’ migrant pool available to the UK could double (from around 74 million A8 population) within our time frame.
13.5 Other countries, such as Turkey and Croatia, are admitted pre-2016 increasing the pool of
migrants
13.6 Pre-accession rules are introduced to allow certain types of migrants from these countries to enter the UK under controlled migration regime – e.g., preference given to these groups for low skilled jobs as supply of low-skilled A8 migrants dries up.
122
13.7 A ‘flood’ of new migrants become available to the UK reducing the significance of any reduction in migrant flows from A8 countries particularly in the low skilled category
13.8 EU15/EU25 introduce further ‘Transition Measures’ regime to manage accession-
associated migration.
14 Diffusion of the A8 population across the UK The first two years of the post-accession migration stream have seen a rapid diffusion of A8 arrivals, away from the early focus on London and a reducing tendency for arrivals to go to the Fens and other key agricultural areas. Pioneering localised analysis of WRS data47 finds that the overall pattern of A8 in-migration does not emphasise either large cities or small settlements; it also does not provide evidence that the migrants are redressing skill shortages. 14.1 Areas of population decline may be less attractive to migrants. They may act as a work-
related point of entry for migrants who may then seek out new locations within, or beyond, the UK.
14.2 Rather than going to the areas in the south with the clearest skill shortages, better
qualified A8 migrants may bolster the pattern which may be already emerging of them taking up professional or similar jobs in more deprived areas where highly qualified British-born people tend to be reluctant to live.
14.3 The flexibility of people from abroad about where they live in Britain partly reflects their
willingness to accept crowded housing and other poor conditions outside the workplace, fuelling a possibility that the long-standing drift from north to south in British internal migration is at least partly replaced by the flow to the London region of people from A8 countries and elsewhere who more readily accept the limited disposable income which high housing and other costs leave for people on entry-level job incomes.
47 Unfortunately, the data gives no indication of how long arriving (or registering) migrants stay.

123
Annex 6
KEY FACTORS SCORE CARD Please score key factor identified in Key Factors document in terms of importance in explaining current flows of migration from A8 (where 5 is high and 1 is low importance). Please tick one box per factor. 1 Ageing population in UK 1 2 3 4 5
2 Population decline in some parts of UK 1 2 3 4 5
3 Skills shortages in the UK economy 1 2 3 4 5
4 UK demand for migrants to fill flexible, seasonal, low paid and ‘dirty’ work 1 2 3 4 5
5 Higher comparative growth rates in the UK than much of EU15 1 2 3 4 5
6 Relative strength of UK economy in relation to other parts of EU15 1 2 3 4 5
7 UK’s ‘open’ labour market approach and light regulatory touch 1 2 3 4 5

124
8 English language as an attractor 1 2 3 4 5
9 Existing and growing networks 1 2 3 4 5
10 Ease of access to transport and relative reduction in transport costs 1 2 3 4 5
11 Length of stay in the UK 1 2 3 4 5
12 Growing Strength of A8 economies 1 2 3 4 5
13 Future Accessions to the EU 1 2 3 4 5
14 Diffusion of the A8 population across the UK 1 2 3 4 5

125
Annex 7
PLAUSIBILITY SCORE CARD
Please score the likelihood of the events or trends outlined in the numbered statements which appear on the Key Factors sheet (1.1……14.3)
Highly Plausible Plausible Not Plausible Don’t Know
1.1
Highly Plausible Plausible Not Plausible Don’t Know
1.2
Highly Plausible Plausible Not Plausible Don’t Know
1.3
Highly Plausible Plausible Not Plausible Don’t Know
1.4
Highly Plausible Plausible Not Plausible Don’t Know
2.1
Highly Plausible Plausible Not Plausible Don’t Know
2.2
Highly Plausible Plausible Not Plausible Don’t Know
2.3 Highly Plausible Plausible Not Plausible Don’t Know
3.1 Highly Plausible Plausible Not Plausible Don’t Know
3.2

126
Highly Plausible Plausible Not Plausible Don’t Know
3.3 Highly Plausible Plausible Not Plausible Don’t Know
3.4
Highly Plausible Plausible Not Plausible Don’t Know
3.5
Highly Plausible Plausible Not Plausible Don’t Know
3.6
Highly Plausible Plausible Not Plausible Don’t Know
3.7
Highly Plausible Plausible Not Plausible Don’t Know
3.8
Highly Plausible Plausible Not Plausible Don’t Know
3.9
Highly Plausible Plausible Not Plausible Don’t Know
3.10
Highly Plausible Plausible Not Plausible Don’t Know
3.11
Highly Plausible Plausible Not Plausible Don’t Know
3.12
Highly Plausible Plausible Not Plausible Don’t Know
3.13

127
Highly Plausible Plausible Not Plausible Don’t Know
3.14
Highly Plausible Plausible Not Plausible Don’t Know
3.15
Highly Plausible Plausible Not Plausible Don’t Know
4.1
Highly Plausible Plausible Not Plausible Don’t Know
4.2
Highly Plausible Plausible Not Plausible Don’t Know
4.3
Highly Plausible Plausible Not Plausible Don’t Know
4.4
Highly Plausible Plausible Not Plausible Don’t Know
4.5
Highly Plausible Plausible Not Plausible Don’t Know
4.6
Highly Plausible Plausible Not Plausible Don’t Know
4.7
Highly Plausible Plausible Not Plausible Don’t Know
4.8

128
Highly Plausible Plausible Not Plausible Don’t Know
4.9
Highly Plausible Plausible Not Plausible Don’t Know
4.10
Highly Plausible Plausible Not Plausible Don’t Know
5.1
Highly Plausible Plausible Not Plausible Don’t Know
5.2
Highly Plausible Plausible Not Plausible Don’t Know
5.3
Highly Plausible Plausible Not Plausible Don’t Know
5.4
Highly Plausible Plausible Not Plausible Don’t Know
5.5
Highly Plausible Plausible Not Plausible Don’t Know
6.1
Highly Plausible Plausible Not Plausible Don’t Know
6.2
Highly Plausible Plausible Not Plausible Don’t Know

129
6.3
Highly Plausible Plausible Not Plausible Don’t Know
6.4
Highly Plausible Plausible Not Plausible Don’t Know
6.5
Highly Plausible Plausible Not Plausible Don’t Know
6.6
Highly Plausible Plausible Not Plausible Don’t Know
7.1
Highly Plausible Plausible Not Plausible Don’t Know
7.2
Highly Plausible Plausible Not Plausible Don’t Know
7.3
Highly Plausible Plausible Not Plausible Don’t Know
7.4
Highly Plausible Plausible Not Plausible Don’t Know
7.5
Highly Plausible Plausible Not Plausible Don’t Know
7.6

130
Highly Plausible Plausible Not Plausible Don’t Know
7.7
Highly Plausible Plausible Not Plausible Don’t Know
7.8
Highly Plausible Plausible Not Plausible Don’t Know
8.1
Highly Plausible Plausible Not Plausible Don’t Know
8.2
Highly Plausible Plausible Not Plausible Don’t Know
8.3
Highly Plausible Plausible Not Plausible Don’t Know
8.4
Highly Plausible Plausible Not Plausible Don’t Know
9.1
Highly Plausible Plausible Not Plausible Don’t Know
10.1
Highly Plausible Plausible Not Plausible Don’t Know
10.2

131
Highly Plausible Plausible Not Plausible Don’t Know
10.3
Highly Plausible Plausible Not Plausible Don’t Know
11.1
Highly Plausible Plausible Not Plausible Don’t Know
11.2
Highly Plausible Plausible Not Plausible Don’t Know
11.3
Highly Plausible Plausible Not Plausible Don’t Know
12.1
Highly Plausible Plausible Not Plausible Don’t Know
12.2
Highly Plausible Plausible Not Plausible Don’t Know
12.3
Highly Plausible Plausible Not Plausible Don’t Know
12.4
Highly Plausible Plausible Not Plausible Don’t Know

132
12.5
Highly Plausible Plausible Not Plausible Don’t Know
12.6
Highly Plausible Plausible Not Plausible Don’t Know
12.7
Highly Plausible Plausible Not Plausible Don’t Know
12.8
Highly Plausible Plausible Not Plausible Don’t Know
12.9
Highly Plausible Plausible Not Plausible Don’t Know
12.10
Highly Plausible Plausible Not Plausible Don’t Know
13.1
Highly Plausible Plausible Not Plausible Don’t Know
13.2
Highly Plausible Plausible Not Plausible Don’t Know
13.3

133
Highly Plausible Plausible Not Plausible Don’t Know
13.4
Highly Plausible Plausible Not Plausible Don’t Know
13.5
Highly Plausible Plausible Not Plausible Don’t Know
13.6
Highly Plausible Plausible Not Plausible Don’t Know
13.7
Highly Plausible Plausible Not Plausible Don’t Know
13.8
Highly Plausible Plausible Not Plausible Don’t Know
14.1
Highly Plausible Plausible Not Plausible Don’t Know
14.2
Highly Plausible Plausible Not Plausible Don’t Know
14.3

134
Annex 8: Draft Scenarios
1 Introduction Much of the value added of the project upon which this report is based comes through analysis of new data, explorations of current developments and considerations of their implications for current policy. In constructing the research methodology, however, it was recognised that the as a New Horizons project we should reflect on future developments and outcomes. In order to do so we proposed that we should undertake some scenario work. Following internal discussion amongst the team members, we chose a ten-year timeframe for our scenarios. We felt that a ten year span would be sufficiently long to allow us to consider a range of political and economic developments, but still be relevant for current policy thinking. Scenarios do not forecast the future, but they do help policy makers reflect on a range of policy outcomes. As van der Heijden and colleagues put it:
“A scenario is not a forecast of the future. Multiple scenarios are pen-pictures of a range of plausible futures …constructed in such a way as to bound the uncertainties that are seen to be inherent in the future …Multiple scenarios provide alternative frames on the nature of the future ... scenario planning assumes that the best that can be done is to identify critical future uncertainties and plan for a range of factors that could, plausible unfold” (van der Heijden et al., 2002, p63).
There are many ways of constructing scenarios. For reasons set out in the methodological reflections section, we designed the following process:
• Literature review • Data analysis of current and past trends • Construction of typology of migrants • Interview survey with key actors • Production of an initial set of key factors which will determine future migrant flows from
the A8 and other ECE countries • First internal scenario meeting between the project team members to brainstorm the key
factors and consider variables which could impact on these factors • Construction of a ‘Key Factors Sheet’ which sought to capture our internal discussions
and a ‘Key Factors Scorecard’ and ‘Plausibility Scorecard’ (see Annexes 4-7) • These three documents were sent to our ‘migration expert panel’, together with a
‘Guidance Sheet’ • Second internal scenario meeting between the project team members to ‘brainstorm
scenarios’, taking into account expert panel comments • Construction of draft scenarios and internal circulation for further comments • Circulation of draft scenarios to ‘policy expert panel’ for comments on implications of
scenarios for policy for comment • Final (and pending) internal scenario meeting to finalise scenarios and implications for
policy taking into account the responses of the ‘policy expert panel’ and from the ‘project steering group’.
On the basis of our two internal scenario meetings it was decided that, although any number of scenarios could be constructed, it was most appropriate to create three scenarios: a ‘rapid growth in migration’ scenario; a scenario which foresees limited but steady growth in migration; and one which foresees limited growth. These scenarios (which were sent to the ‘policy expert

135
panel’) are presented in the following sections. For reasons set out in the Methodological Reflections below, responses have not been received from all members of our policy panel. We would also appreciated input from the ODPM New Horizons team. The scenarios, therefore, should be regarded as draft. We do not anticipate that the substance of the scenarios would change, except insofar as the policy implications of each scenario would be elaborated.
2 The Scenarios
Scenario 1 – Rapid Growth in Migration The past 10 years have seen the accession of a number of ECE countries to the European Union, following the successful integration of the A8 states. This process seems likely to continue, though divisions on the issue between existing EU members remain. It is anticipated that by 2020 the EU will have an extra 169 million people, equivalent to more than fifty per cent of its pre-May 2004 population. 74 million people were added to the EU population through A8 accession in 2004, Bulgaria and Romania added around a further 30 million in 2007, followed by Croatia, with around 5 million in 2012. Last year’s accession of Ukraine added around 50 million people and the anticipated accession of the ‘Balkan four’ in 2018 will add a further 10 million. Negotiations regarding Turkey continue, though there is no sign of the resolution of key outstanding issues. This successive wave of accessions to the EU has provided successive waves of potential migrants to the original EU 15 and latterly to the EU25. The growth of the A8+3 economies has slowed migration from these countries and there is some evidence of return flows. However, many workers have settled in the ‘west’, particularly in those countries, such as the UK, which developed a relatively liberal policy to European migration early on. Although the economies of the A8+3 countries have grown significantly there are still a number of ‘push’ factors causing continued migration. For example: ‘efficiencies’ in certain sectors of these economies have meant redundancies, although some countries such as Poland have shown high growth unemployment remains high particularly amongst the young, inward investment from the west which was primarily based on cheap labour has relocated ‘farther east’ and beyond, documented and undocumented migration from other parts of ECE and beyond have tightened competition for unskilled employment, modernisation of agriculture has led to decline in demand for labour in that sector. In addition EU employment targets (agreed at the Zagreb jobs summit in 2013) which again seek to raise employment participation amongst women and other groups are increasing competition for jobs. The presence of settled communities of migrants, with concomitant networks has also attracted workers to the UK, as has the continued growth in low cost air travel. The UK’s relatively open policy towards migrants since 2004 has paid dividends in terms of creating continued flows of labour, based on successive accessions to the EU. The 2006 regulations which made it more difficult for all but the highest skilled non-EU migrants to gain access to the UK for work, together with harsher treatment of refugees and asylum seekers, has meant that the vast bulk of migrants have come from the acceding ECE countries. This influx of relatively cheap and flexible labour has fuelled sustained economic growth and has attracted further rounds of migrant labour. The success of the UK ‘open’ policy can be contrasted with, and partly explained by, attitudes in several other EU countries, particularly the larger countries which kept Transition Measures in

136
place until 2012 and which sought to impose similar measures on later joiners. Indeed, only when the Commission threatened legal action against them did some countries fully open their labour markets to migrants from the accession countries. Some commentators have suggested that even now certain governments are using a range of non-regulatory measures to hinder entry of workers from accession countries. This attitude was originally attributed to high levels of unemployment and policy targets to increase labour market participation within countries. More recently it appears that populist resistance to the ‘dilution’ of national cultures is becoming more apparent. These attitudes may also be becoming more pronounced in the UK. The continued security-related stance to migrants by the US has also contributed to the flow of migrants to the UK. Competition from other Anglophone countries has tended to be limited to skilled migrants. Thus potential destinations for the majority of ECE migrants have been and remain limited. ECE migrants have been attracted to the UK across all skill levels, including at the level of knowledge workers. It is for this group of workers that competition from other countries has been strongest. The success of the UK in attracting numbers of these workers has been attributed to a number of factors, including sustained economic growth, low and differentiated (regressive) tax system, the English language, the relatively open and cosmopolitan nature of the society, and the more entrepreneurial culture (compared to some European countries), as well as the US’s attitude to migration, though further research is required to establish the exact reasons for the success. ECE workers have, however, only ever represented a small proportion of knowledge migrants, as the open door policy has attracted migrants from around the world. Unsurprisingly, the majority of these workers have located in the south east. London, as a global city, is seen as a key attraction, particularly for younger workers. However, the additional resources pumped into the UK’s city-regions towards the end of the last decade, together with initiatives by these city-regions to attract these workers, which followed the path-breaking ‘Fresh Talent’ initiative, have resulted in a significant number of knowledge workers locating in these areas. The limited evidence suggests that these knowledge workers are mainly live in urban locations, though those who settle longterm tend to follow the behaviour of their professional peer groups and move to the suburbs, small towns and accessible rural areas as they grow older. The structure of the UK economy inevitably means that many are attracted to London and the South East over time. These fresh-talent style initiatives have mainly involved retaining graduates and targeting skilled workers in their own countries. This has caused some friction between the UK and the ECE countries as has the targeting of professionals and para-professionals in areas such as health. Many knowledge workers and professionals have settled and are making a valuable contribution to competitiveness and to public services, though others have returned home or migrated to a third country, whilst still others have effectively developed dual employment locations. The flow of high skilled workers from the A8 countries appears to be in decline, however, as these countries’ economies have grown and the main flows now appear to come from the newer accession countries, and non-European countries. Competition for these workers from countries within the EU has also increased over the years, initially from northern Europe, but latterly from across Europe. Media coverage of knowledge migrants has been largely absent. What coverage there has been has varied from the benign to the enthusiastic. By contrast coverage of less skilled migrant workers, who of course remain the majority, has ranged from suspicious to vitriolic (Migrants continue to flood Britain: The Daily **** Online), notwithstanding that many early migrants have melted seamlessly into UK society. Sectoral patterns of employment have become more diverse. With the exception of the ‘knowledge workers’ referred to above, migration appears largely to continuing to fuel the UK’s

137
low skills ecology, postponing investment in technology and training. The food production, processing and distribution sector has benefited hugely from migration through significant improvements in competitiveness. This sector continues to receive most attention from the media largely, mainly because it involves large concentrations of migrants in or close to rural settlements, where there presence is more obvious than in cities. Policy which limited migration to fewer nationalities, many of whom are entitled to UK benefits, seems to have had the effect of stimulating more permanent settlement as these workers begin to feel ‘more at home’ and local support networks become established. The media has focused mainly on illegal or semi-legal groups (invariably employing the term mafia, regardless of country of origin) some of whom are forming cartels to manage worker-employee relationships. There is also evidence, however, of more positive developments. A number of joint ventures between firms from ECE and local UK farmers have emerged, a number of UK-based ECE workers have turned entrepreneur, establishing their own companies to develop new products and processes for the supermarket chains and also buying up farms. These groups remain reliant on alternative sources of capital, often from their country of origin, as UK banks still hesitate to invest. The ‘dominance’ of some rural areas by people of foreign origin has created much unrest. Ironically, it is often those who themselves are ‘newcomers’ to rural areas who have been most vocal in their opposition. Longitudinal data on migrant settlement patterns is extremely limited, but those surveys which have been carried out and data from the 2011 census suggest that ECE migrants appear to be relatively well spread throughout the UK. Nevertheless, a number of ‘pressure points’ have emerged and many local communities have reported difficulties in coping with significant influxes. Common themes have been the difficulty in providing services to migrants (and, indeed, their entitlement to them). Housing has perhaps been the most high profile issue, and here an ‘alternative’ housing market seems to be emerging, with certain streets becoming dominated by landlords servicing ECE migrants. Other issues include the difficulty of multiple languages which are required, not only in respect of written material, but also in terms of interpreters. Migrants have found that ESOL-type courses are scarce, can be expensive and are often unsuitable. Early evidence which suggested that the inflow of migrants has little impact on wages proved to be incorrect. Recent research shows that over a sustained period of time, wages for low-skilled work are dampened by successive flows of cheaper labour. There is concern that this means that the already wide and growing gap between skilled workers and those with low or no skills will widen further. Another key area of concern in some localities is the impact of continuous migration on employment opportunities for existing British workers. The continued perceived failure of the UK education system to address the needs of low income families and the opening social and spatial divides in skills and qualifications means that employers will often turn first to migrants rather than consider applicants from certain areas. This problem is particularly pressing as the ‘success’ in tackling ‘worklessness’ in the previous decade turned out to be a ‘false dawn’, as underlying problems were not addressed. A new group of ‘hard to reach’ people has now emerged.
Scenario 2 – Steady but Limited Growth in Migration Despite a recession between 2008 and 2010, the UK economy has grown at trend rates over the past 10 years. This has been driven by growth in private sector services and in specialist manufacturing exports, which have benefited from the recovery of the European economy, together with a range of large-scale construction projects. Not all regions of the UK have benefited to the same extent, however, and concerns have been expressed that the north-south

138
divide is again emerging. A combination of population ageing, relatively low fertility rates, and the gradual increase in outward migration of existing citizens from the UK, particularly skilled workers, has led to widespread concern that the UK cannot reproduce its labour force and that skills shortages are emerging at all levels. Many other European countries have experienced similar trends and competition for skilled migrants has become more intense in recent years. Overall labour shortages have been off-set to some extent by later retirement (although employers continue to prefer younger workers) and by migrants who have settled more or less permanently over the past ten years. The success of government policy in bringing fifty per cent of school leavers into higher education, together with success in attracting higher skilled migrants48 has helped the UK to sustain its position in the international ‘knowledge economy’. However, with other countries raising the bar the UK remains a relatively low-skills equilibrium economy and it is widely recognised that more migrants will be required for the UK to be competitive, particularly if the huge amounts being spent on upskilling the native workforce continue to achieve limited results. Although migration flows from the A8 have continued over the past 10 years, they have not been as large as anticipated. The period 2004 to 2007 saw year on year increases in the inflow of migrants from these countries, but the growth slowed during the 2008-2010 recession, after which it began to recover, but not to previous levels. The coincidence of the ending of Transition Measures and improved economic growth in EU15, together with continued economic growth rates, falling unemployment and higher wages in the A8 has meant that competition for even relatively low skilled workers has intensified over the past five years. The reduced inflow of A8 workers has been partly off-set by workers from Romania and Bulgaria, but again competition for these workers has increased. The recent relaxation of the points-based migration rules of 2006 and 2010, in response to pleas from employers’ organisations, together with the series of bi-lateral agreements recently negotiated by the UK government with the governments of new pre-Accession countries49 appears to be addressing the issue with some evidence that documented migrant flows are growing. This suggests that housing and other services will come under increasing pressure. Although the total flow of European migrants has been steady over the past 10 years, albeit with some fluctuations, there have been several changes in the composition of migrants: they are more diverse in terms of nationality, ethnicity and religion, the occupational/sectoral composition has altered to some degree, and settlement patterns have changed. The recent pre-Accession agreements with other ECE countries, is leading to a more diverse migrant population, with nationals of several non A8+2 countries entering the UK. This trend is likely to continue and could have a number of implications for employers, public authorities and voluntary groups. At the very least services will have to be offered in additional languages. This mirrors the situation which emerged following accession of the A8, and again when Bulgaria and Romania entered the EU, and it is hoped that agencies will have learned lessons from those processes. There may also be more profound implications in that migrants from those countries ‘beyond’ the A8 may be less familiar with west European norms and have less in common with native British communities in terms of religion and traditions of civic society. There is also room for disruption if A8 and other ‘settled’ migrants resent the arrival of potential competitors in the
48 This is generally attributed to an open door policy to knowledge workers and targeted incentives by regions and individual firms and sectors. 49 Ukraine, Turkey and five Balkan countries

139
jobs and services markets. At the extreme, schisms between certain new migrant groups, such as those arriving from the Balkans, may be deep and lasting. The two most notable changes in sectoral composition are the decline in the contribution of agriculture and associated work and the recent decline in workers in construction related activities. The former can be seen as structural, the latter as cyclical. The emergence of Poland, Hungary, Romania and Bulgaria as the new ‘breadbaskets of Europe’ has impacted on migration flows to the UK to work in agriculture, horticulture and associated sectors as production has moved east. The trend towards food production in Eastern Europe has also soaked up some of the low-skilled labour from these states and from neighbouring ECE countries, which UK agriculture has relied on for the past 10 years. Many of those who have learned a range of skills and techniques in the UK have returned to set up their own businesses or to take key roles in modernising production techniques in their own countries, particularly in horticulture. This is happening at a time when increasing mechanisation of production is already dampening demand for labour in this sector. Competition from ECE (and from other parts of the globe) has been off-set to some degree by UK supermarkets’ preference for ‘close to home’ production, in some product areas in order to operate their just-in-time supply chains for UK stores efficiently. Earlier investment in preparation and packaging facilities makes it cost-effective to continue to prepare some imported food products close to the consumer, though significant rationalisation is apparent. Ever rising oil prices and transport costs have also made the UK a more cost effective base for certain (non-export) food production activities, though this situation could change if water shortages continue. Remaining jobs in the sector continue to attract migrants as the UK still offers higher wages than some ECE countries. These jobs have become less seasonal, with all year round packaging of global food flows. An opposite trend, with similar effects on the demand for labour in British agriculture, is the growing consumer interest in locally-sourced produce. The recent construction boom in the South East of England associated with large-scale infrastructural projects including the Olympic Games, Thames Gateway, the Heathrow extension, and the London Stansted Cambridge Peterborough corridor is now tailing off. The huge influx of workers from Europe as well as the traditional inflow from other parts of the UK placed great strains on housing capacity and other infrastructure. This impact was felt throughout the greater South East. Whilst some workers have returned to their home countries – and other peripatetic groups of workers have moved to other construction sites elsewhere in Europe – many have stayed on. Recent press reports suggest that the decline in work has led to the friction between groups of workers and there appears to be an incipient media and public backlash against foreign workers. The remaining growth areas are now in ‘front-line’ public services, particularly health and social care and education. Retail, administration, private services and tourism and hospitality are also growing. The majority of these roles have a ‘customer facing’ element and require considerable communications skills, but the growth of English language skills in almost all countries will continue to reduce this hurdle to migrant labour. Some early studies on A8 migration suggested patterns of geographical settlement were more diverse than in previous waves of migration. London appeared to be becoming less dominant as a settlement location. Smaller towns and rural areas appeared to be particularly attractive with the localised impact of agriculture-related work opportunities. More recent research suggests that A8 and subsequent waves of migration remain relatively widely spread across the country, though some changes are apparent. The decline in agricultural related production, and in

140
seasonal work, however, means that some the rural concentrations have declined. The continued general population growth in greater south east England and the consequent demand for services, together with the construction boom has led to a refocusing of some migrant activity into that area. Towns and cities which acted as dormitory towns for their rural hinterland now appear to be acting as dormitory towns for London and its surrounds as well as providing employment opportunities themselves. This trend towards the South East suggests has meant a growing demand for services in that area. The movement of migrants towards the south east has been exacerbated by the accelerated rate of manufacturing decline in the north of the country. This, together with a steady decline of replacement industries such as call centres, the reduction in public sector ‘bureaucratic’ jobs and the ending of European and UK subsidy regimes, has increased unemployment levels in some parts of the north. This has reduced incentives for employers to invest in importing migrant labour, but many migrant workers are well established and others continue to arrive to compete in the low and medium skilled labour markets, including the growing health and social care sector.
Scenario 3 – Low Growth Apart from the brief peaks of migration following the accession of the A8 countries in 2004 and Bulgaria and Romania in 2007, the much anticipated flood of migrants from Eastern Europe has not materialised.50 Several recent reports have questioned the UK’s ability to compete internationally or to meet the pressure placed on its social services by an ageing population unless migration flows rise. There is also a danger that the UK will start to face population decline in the next two years, as net emigration, the rate of which has risen for 10 successive years, looks set to continue. The population in the north of the UK has continued to decline. The recent (selective) relaxation of migration rules to encourage non-EU workers to enter the UK signalled the end of the policy of allowing lower-skilled workers from the EU only. The current impasse on the accession of further states to the EU looks set to continue meaning that the anticipated further rounds of post-accession flows will be delayed. The emergence of the so-called ‘accession paradox’ has been particularly damaging for the UK. This ‘paradox’ describes the situation whereby west European member states, such as France and Germany, which were initially slow to open their labour markets to acceding countries have now done so, increasing competition for migrating labour. At the same time, the resulting political pressure from unions, the media and the public has made several countries less receptive to further accessions, despite employers’ organisations lobbying to the contrary. The increase in nationalism and the move towards the right which is apparent in north European countries formerly associated with relatively open migration policies has reinforced the anti-enlargement bloc (which also includes some A8+2 countries). Turkey remains the main target of opposition for this lobby, but it has become politically difficult for the CEC to negotiate access of other countries which commenced talks later to enter ahead of Turkey. The instability in Ukraine and the slow pace of reform in the Balkans, which in former times might have been overlooked, have, in the current climate, also acted as a barrier to accession. It is not clear that all these countries remain keen to join the Union. A number of recent reports have suggested that the success of the A8+2 economies has occurred despite entry to the EU rather than because of it. This, together with the perceived racism and condescension of EU countries has dampened fervour to join, though there is still a small majority in favour in each country. 50 Though there is still some uncertainty as to the actual numbers of workers who have stayed in the UK, as opposed to the number entering the country, as promises to put new methods of assessing stocks were not out into practice.

141
The short term effects of lower than anticipated flows of European migrants were relatively limited during the long recession which the UK experienced between 2009 and 2013, as employers merely looked to the newly unemployed or those about to become unemployed to fill unskilled and semi-skilled jobs. This recession now appears to be over and unemployment is falling. Economic growth is again likely to be consumer-led and there are signs that the housing market is taking off. The housing ‘backlog’ may fuel rapid growth in construction, which, apart from a small number of high profile projects such as the Olympic Games, has been stagnant. The demand for migrants remained in some sectors throughout the recession, reflecting the shortage of available skills in the UK and the unwillingness of many native workers to take on the more dirty and dangerous jobs, but also arising from the distance from population concentrations of much of this work. Demand was reduced in key areas of migrant employment, such as processing and packaging of ‘value added’ food products, as people sought lower cost alternatives, construction, as housing and public infrastructure investment declined, in health and social care services and in hospitality and tourism. Demand is anticipated to rise in these areas as the economy grows, though some of the agricultural related work may not recover as production increasingly takes place in other countries following WTO and CAP reforms and processing and packaging follows production offshore to become more cost-effective. Although there will be growing demand for migrant labour in the UK competition for that labour from other countries is likely to be stronger than it was in the period 2000 to 2007, the last period when there was high demand for migrant labour in the UK. Greater competition is likely to make it increasingly costly to employ migrants and may dampen employer demand in the UK. A number of factors point to difficulties in meeting demand in the UK. Firstly, outward flows from ECE member states are less strong as their economies have developed. Secondly, all EU15 member states have opened their labour markets following the ending of Transition Measures and some other A8 states are now competing to attract Polish labour. Thirdly, the UK’s relative position vis-à-vis other European countries has altered for the worse since the earlier period. For example, France and Germany have seen continued steady growth whilst the UK has been in recession, and unemployment in both countries has fallen. Fourthly, the ageing of populations in all European countries has increased the demand for scarce labour resources. Fifthly, wages and benefits remain higher in several European countries than in the UK in spite of ‘structural reforms’ in some of these countries. The tax take is higher than in the UK, but overall living costs are around the same and housing costs are lower. This allows migrants to send home larger sums. Sixthly, after a decade of sustained isolationism the US has started to open its borders to overseas to migrants, especially skilled migrants. Finally, the demand across all advanced economies for ‘knowledge workers’ has made competition for this group of workers particularly intense. The shortage of workers at all skill levels point to two main policy implications. In the short term efforts to attract non-EU migrant workers need to be intensified and rules further relaxed. It could also intensify its efforts to attract specific types of workers from these countries though recent agreements not to poach key workers from third world countries makes this more difficult. The UK could also explore entering into bi-lateral pre-accession agreements with ECE countries to allow labour to migrate to the UK under certain conditions. It could also redouble its efforts, together with similarly minded countries, to remove barriers to EU enlargement. It will also have to increase its efforts to attract and retain foreign graduates. This will also prove difficult as the great expectations placed on attracting students form South East Asia have shown to be misplaced as those countries’ own higher education sectors have taken off. In the longer term (though starting immediately) the UK will have to re-double its efforts to move away from the low-skills ecology on which its economy has been based over the past 50 years. Crucially there

142
is a need to enhance education, skills and training for the existing population, though the limited success of this area of policy over the past 20 years must be cause for concern.