assessing sea level rise risks in changing coastal ... · coastal systems are projected to be...
TRANSCRIPT

Assessing sea level rise risks in changing
coastal environments: a national assessment
supporting disasters management and
climate change adaptation
International Conference Risks, Security and Citizenship
Setúbal, Portugal 28/29 March 2019
Critto A., Torresan S., Furlan E., Dalla
Pozza P., Derepasko D., Michetti M.,
Mysiak J., Marcomini A.

Euro-Mediterranean
Centre on Climate
Change
Website: www.cmcc.it
Partners:
National Institute on Geophysics and Volcanology (INGV)
University of Salento (UNILE)
Centro Italiano di Ricerche Aerospaziali (CIRA)
University Ca' Foscari Venice
Eni Enrico Mattei Foundation (FEEM)
University of Sannio
University of Sassari
University of Tuscia
Associated centers:
Mediterranean Agronomy Institute of Bari
Pure and applied mathematics Research Centre (CRMPA)
SPACI Consortium
National Institute of Oceanography and Experiment Geophisics
(OGS)
Abdus Salam International Centre for Theoretical Physics (ICTP)
http://www.cmcc.it/it/
Euro-Mediterranean Centre
on Climate Change

Focal Point IPCC in Italy:CMCC (Centro Euro-Mediterraneo sui Cambiamenti Climatici )
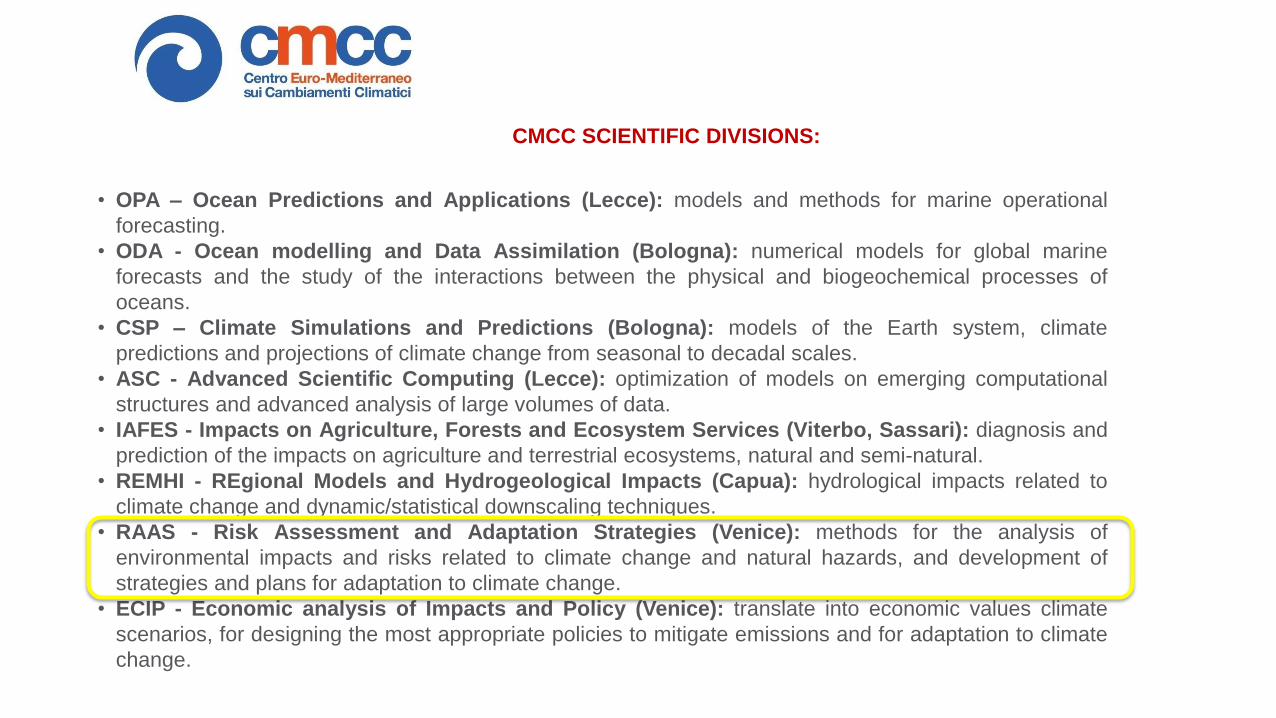
CMCC SCIENTIFIC DIVISIONS:
• OPA – Ocean Predictions and Applications (Lecce): models and methods for marine operational
forecasting.
• ODA - Ocean modelling and Data Assimilation (Bologna): numerical models for global marine
forecasts and the study of the interactions between the physical and biogeochemical processes of
oceans.
• CSP – Climate Simulations and Predictions (Bologna): models of the Earth system, climate
predictions and projections of climate change from seasonal to decadal scales.
• ASC - Advanced Scientific Computing (Lecce): optimization of models on emerging computational
structures and advanced analysis of large volumes of data.
• IAFES - Impacts on Agriculture, Forests and Ecosystem Services (Viterbo, Sassari): diagnosis and
prediction of the impacts on agriculture and terrestrial ecosystems, natural and semi-natural.
• REMHI - REgional Models and Hydrogeological Impacts (Capua): hydrological impacts related to
climate change and dynamic/statistical downscaling techniques.
• RAAS - Risk Assessment and Adaptation Strategies (Venice): methods for the analysis of
environmental impacts and risks related to climate change and natural hazards, and development of
strategies and plans for adaptation to climate change.
• ECIP - Economic analysis of Impacts and Policy (Venice): translate into economic values climate
scenarios, for designing the most appropriate policies to mitigate emissions and for adaptation to climate
change.

COASTAL ZONES are complex systems of strategic importance in different sectors:
• they are home to a large percentage of citizens worldwide;
• they are a major source of food and raw materials;
• they are a crucial link for transport and trade;
• they include valuable habitats and natural resources;
• they are favoured destination for leisure time and recreational activities.
In the last decades urbanization,
agriculture, industry, energy
production,
transportation and tourism posed
increasing pressures on coastal areas
habitat destruction, water and
soil contamination, coastal
erosion and resource depletion
the depletion of the limited resources of coastal
zones and the limited physical space is leading to
increasing conflicts of interests among different
stakeholders (e.g. aquaculture and tourism)
Climate change and coastal zones

Coastal systems are projected to be increasingly at
risk due to global climate change trough the 21th
century and beyond
(IPCC, 2007 and 2014).
BIOGEOPHYSICAL IMPACTS:
Sea-level rise.
Increasing flood-frequency probabilities.
Erosion.
Inundation.
Rising water tables.
Saltwater intrusion.
Negative consequences for biodiversity
and ecosystems.
SOCIO-ECONOMIC IMPACTS:
Direct loss of economic, cultural and
subsistence values through loss of land,
infrastructure and coastal habitats.
Increased flood risk of people, land and
infrastructure.
Damage to coastal protection works and
other infrastructure.
Impacts related to changes in water
management, salinity and biological activity.
Impacts on agriculture and aquaculture.….

A strategic approach is needed to ensure that timely and
effective adaptation measures are taken, ensuring
coherency across different sectors and levels of
governance.
The challenge for policy-
makers is to understand
climate change impacts
and to develop and
implement policies to
ensure an optimal level of
adaptation.
The aims for the scientific
community are to improve the
knowledge on climate impact and
vulnerability and to provide
methodologies and tools in order
to guide the development of
appropriate adaptation measures.
EC, 2009.
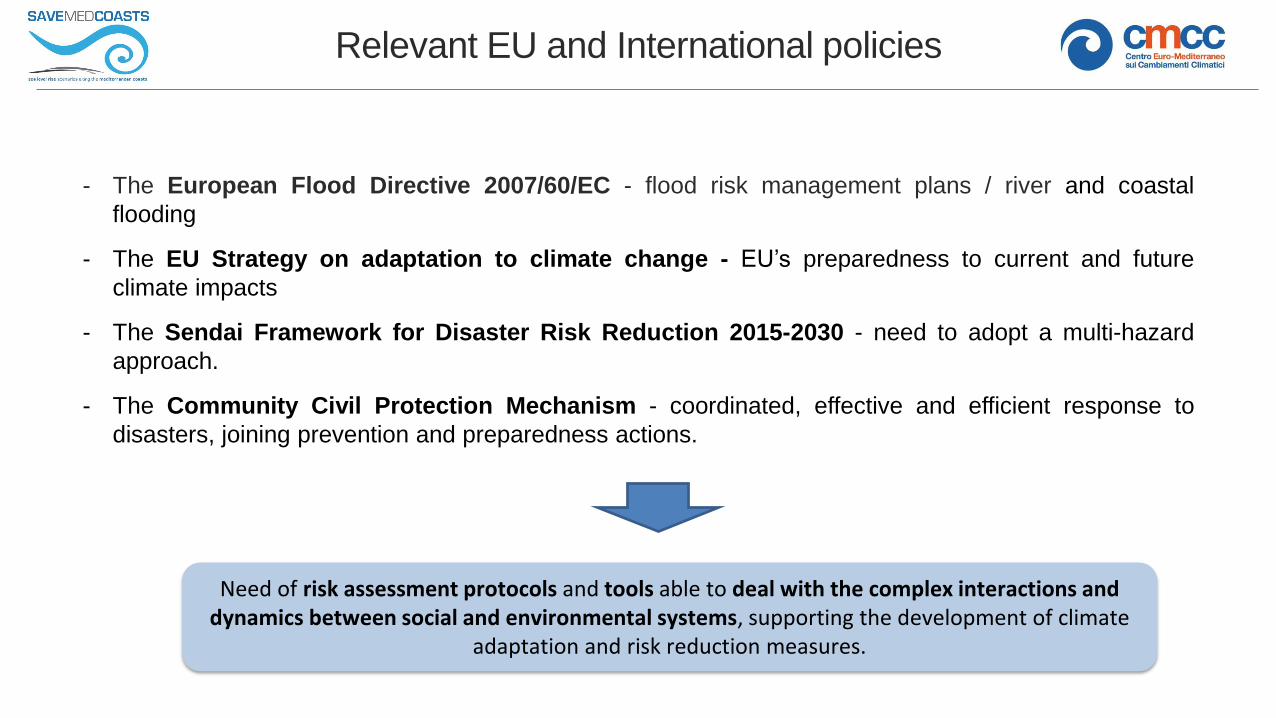
- The European Flood Directive 2007/60/EC - flood risk management plans / river and coastal
flooding
- The EU Strategy on adaptation to climate change - EU’s preparedness to current and future
climate impacts
- The Sendai Framework for Disaster Risk Reduction 2015-2030 - need to adopt a multi-hazard
approach.
- The Community Civil Protection Mechanism - coordinated, effective and efficient response to
disasters, joining prevention and preparedness actions.
Need of risk assessment protocols and tools able to deal with the complex interactions and dynamics between social and environmental systems, supporting the development of climate
adaptation and risk reduction measures.
Relevant EU and International policies

1. Objectives
Development of GIS-based maps and
indicators ranking the coastal areas at higher
risks
Improve risk
governance and
raise community
awareness towards
the impacts of
climate change and
sea level rise
Provide guidance
and criteria for risk
and vulnerability
assessment
http://www.savemedcoasts.eu
Aims to respond to the need of people and assets prevention from
natural disasters and sea level rise in Mediterranean coasts
DG-ECHO (European Civil Protection and Humanitarian
Aid Operations)
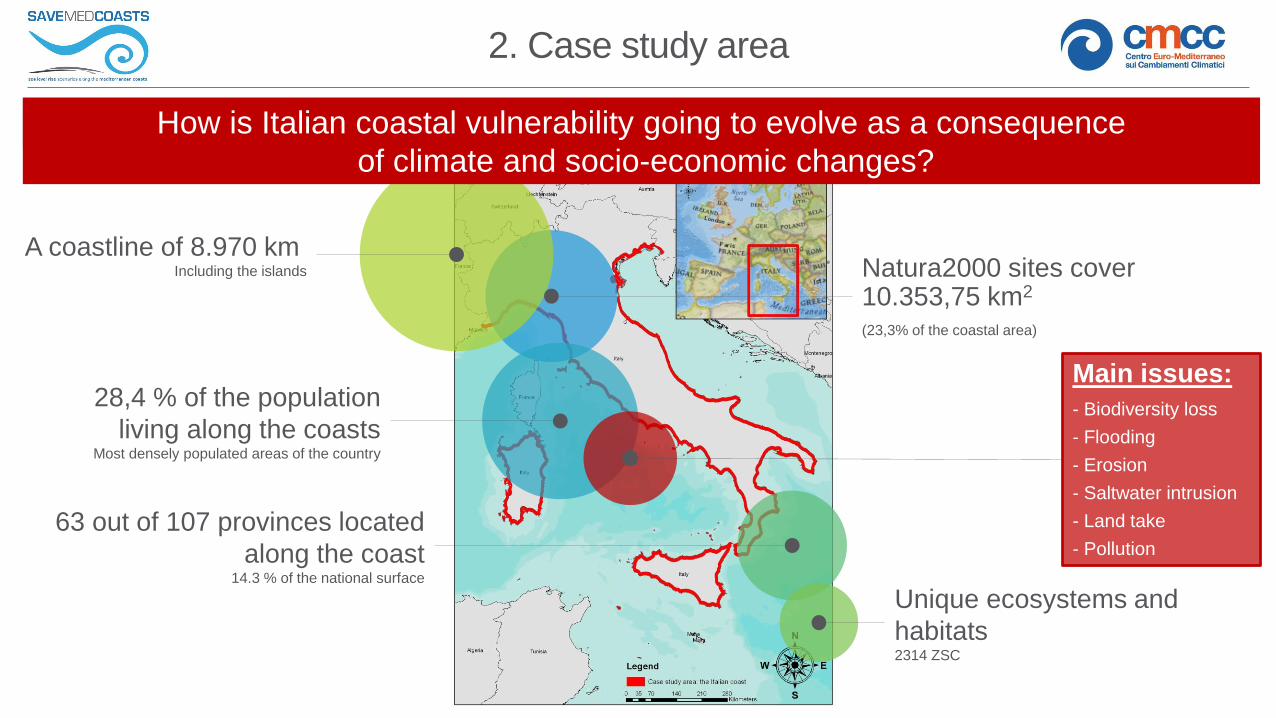
2. Case study area
Natura2000 sites cover 10.353,75 km2
(23,3% of the coastal area)
Main issues:
- Biodiversity loss
- Flooding
- Erosion
- Saltwater intrusion
- Land take
- Pollution
28,4 % of the population
living along the coastsMost densely populated areas of the country
A coastline of 8.970 km Including the islands
63 out of 107 provinces located
along the coast14.3 % of the national surface
Unique ecosystems and
habitats2314 ZSC
10-km wide band of land from the Italian coastline How is Italian coastal vulnerability going to evolve as a consequence
of climate and socio-economic changes?

3. Methodology and data
GIS
Models
Indicators
DSS
Riskassessmen
t
CVI- One of the most commonly used
method to assess coastal vulnerability to SLR
- Easy to use for a scoping or “first look” assessment
- Simplified approach useful for communication purposes
- Applicable to different geographic contexts
- Flexible for multi-scale vulnerability appraisal
- Expandable to include a variety of heterogeneous indicators
Multiple methodologies and tools to evaluate coastal vulnerability :
Ramieri et al. (2011); Zanuttigh et al. (2013); Torresan et al. (2016)
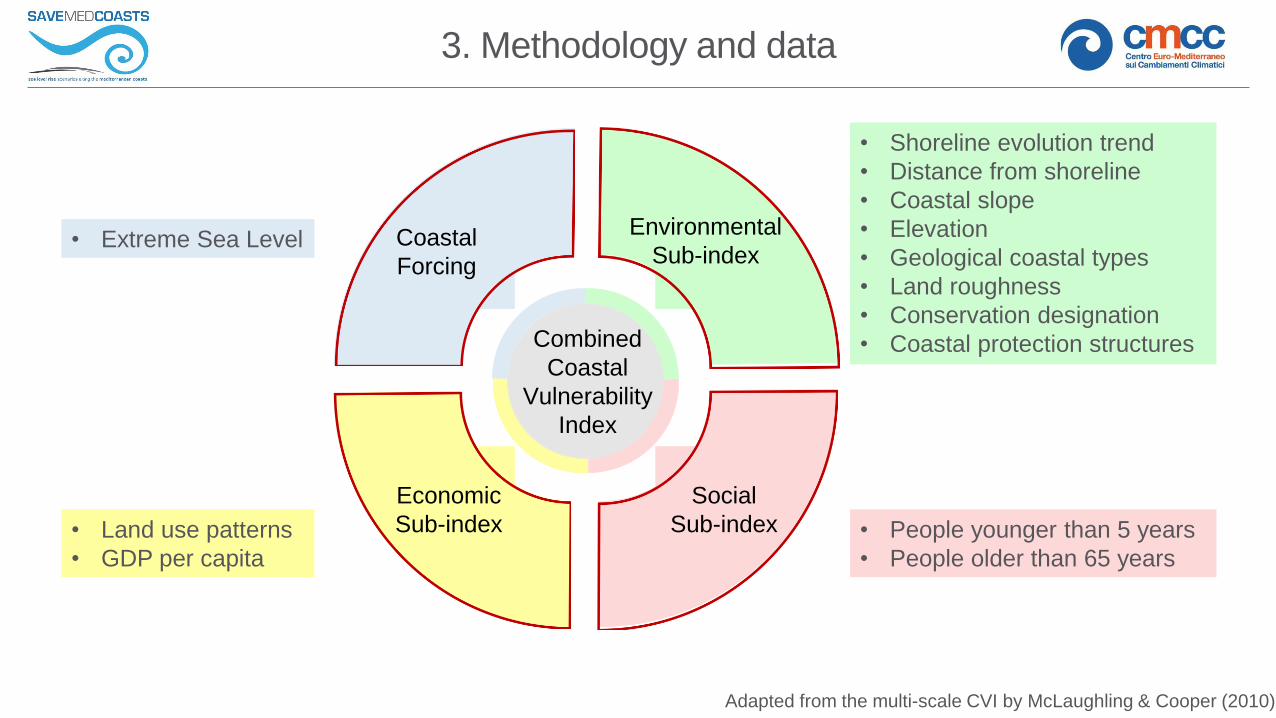
3. Methodology and data
Coastal
Forcing
Economic
Sub-index
Social
Sub-index
Environmental
Sub-index
Combined
Coastal
Vulnerability
Index
• Extreme Sea Level
• Shoreline evolution trend
• Distance from shoreline
• Coastal slope
• Elevation
• Geological coastal types
• Land roughness
• Conservation designation
• Coastal protection structures
• Land use patterns
• GDP per capita
• People younger than 5 years
• People older than 65 years
Adapted from the multi-scale CVI by McLaughling & Cooper (2010)
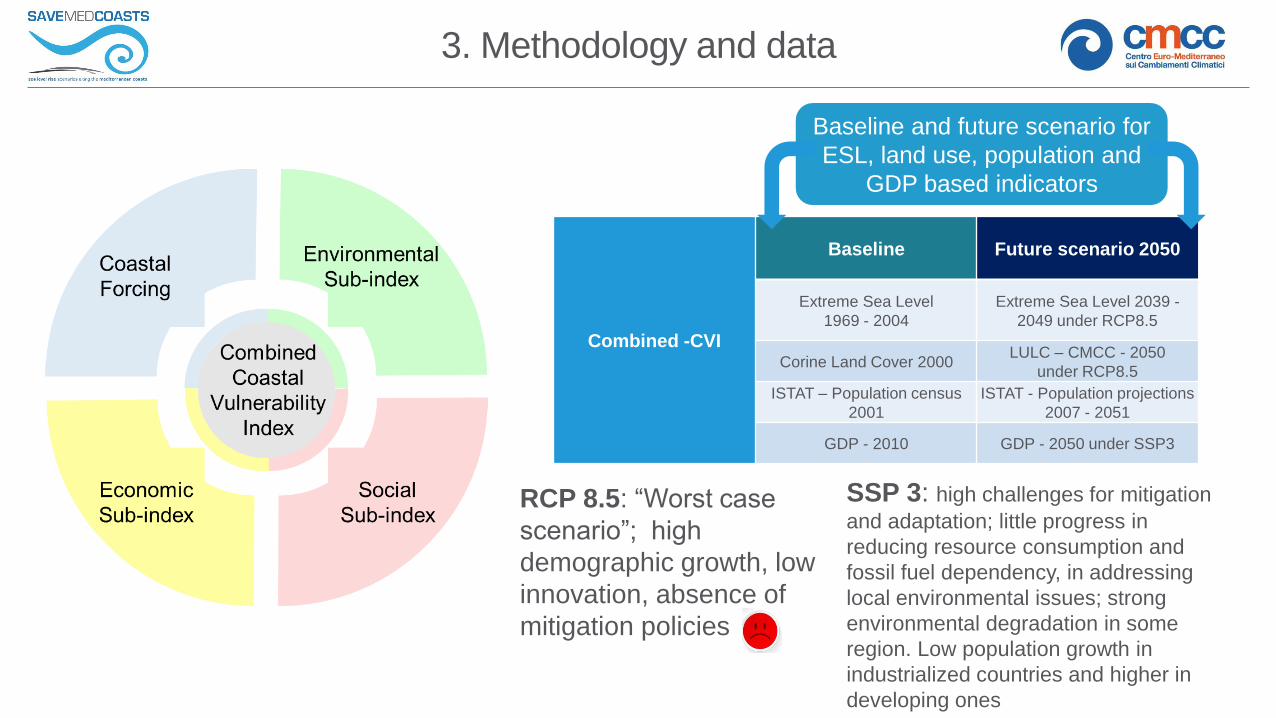
Combined -CVI
Baseline Future scenario 2050
Extreme Sea Level
1969 - 2004
Extreme Sea Level 2039 -
2049 under RCP8.5
Corine Land Cover 2000LULC – CMCC - 2050
under RCP8.5
ISTAT – Population census
2001
ISTAT - Population projections
2007 - 2051
GDP - 2010 GDP - 2050 under SSP3
3. Methodology and data
Baseline and future scenario for
ESL, land use, population and
GDP based indicators
RCP 8.5: “Worst case
scenario”; high
demographic growth, low
innovation, absence of
mitigation policies
SSP 3: high challenges for mitigation
and adaptation; little progress in
reducing resource consumption and
fossil fuel dependency, in addressing
local environmental issues; strong
environmental degradation in some
region. Low population growth in
industrialized countries and higher in
developing ones

3. Methodology and data
ESL RP 5 RP 10 RP 20 RP 50 RP 100 RP 200 RP 500 RP 1000
BASELINE
MIN 0.82 0.89 0.95 1.00 1.03 1.06 1.10 1.12
MEAN 1.17 1.26 1.33 1.43 1.51 1.58 1.67 1.74
MAX 2.10 2.34 2.59 2.94 3.22 3.52 3.93 4.27
20
50
RCP 4.5
MIN 1.03 1.10 1.16 1.20 1.24 1.27 1.30 1.33
MEAN 1.37 1.46 1.53 1.63 1.71 1.78 1.87 1.95
MAX 2.35 2.59 2.84 3.18 3.46 3.75 4.16 4.49
RCP 8.5
MIN 1.03 1.13 1.19 1.24 1.27 1.31 1.34 1.37
MEAN 1.37 1.49 1.57 1.67 1.75 1.82 1.92 1.99
MAX 2.35 2.66 2.91 3.27 3.55 3.85 4.26 4.60
Scenarios: Historical
RCP 4.5
RCP 8.5
Grid resolution: 0.2°(~ 11 km)
Temporal coverage: Baseline: 1969-2004
Future: decades among 2039-
2049 timeframe
ESL = RSLR + (tide) + (ss-w)
(Vousdoukas et al., 2017)
Climate Forcing: Extreme Sea Level scenarios (ESL)
Mean [m]
Baseline - 100 years Return Period
2039 -
2049
cm
2039-2049 2039-2049
10
3

3. Methodology and data
Land-use related indicators (i.e. land roughness and land use pattern) are based on the recent
LULC maps developed by using the LULC-CMCC model (Santini and Valentini, 2011)
Temporal coverage:
Baseline scenario 2000Future scenario 2050
Future projections based on 5 parameters constraining land use changes: - Climate model projections- Demographic change- Protected areas- Transition matrix- Neighboring influence
Emission scenario: RCP8.5
Two scenario selected for the combined-CVI:- Baseline (based on the Corine Land Cover map 2000)- Future scenario 2050, considering climate model projections, high demographic change, presence of protected areas, transition matrix and neighboring influence between land use classes
Future scenario 2050
Resolution: 500 m

3. Methodology and data
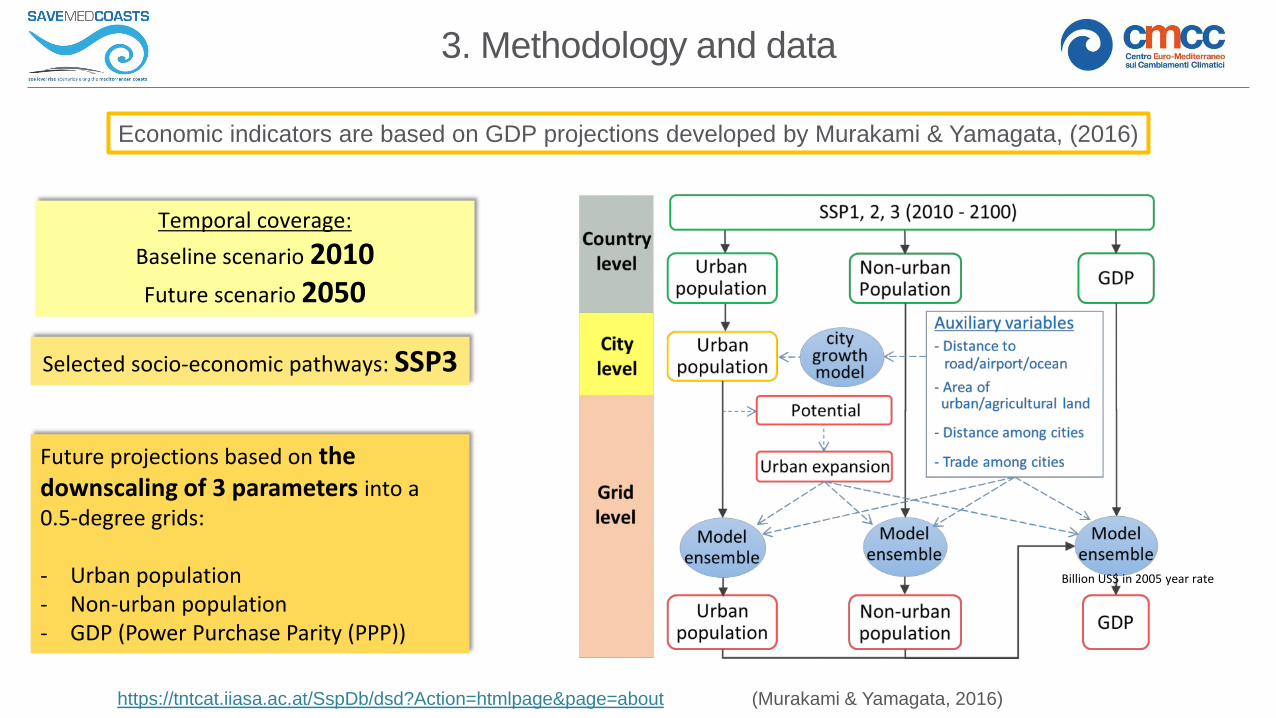
Economic indicators are based on GDP projections developed by Murakami & Yamagata, (2016)
Selected socio-economic pathways: SSP3
Future projections based on the downscaling of 3 parameters into a 0.5-degree grids:
- Urban population- Non-urban population- GDP
(Murakami & Yamagata, 2016)
Temporal coverage:
Baseline scenario 2010Future scenario 2050
Billion US$ in 2005 year rate
Baseline 2010
GDP tot 2010: 1641 billion US$

3. Methodology and data
Future scenario based on 3 demographic parameters constraining population changes: - Fertility- Survival- Migration patterns
Social indicators developed based on data collected and modelled by ISTAT, 2001 and 2008
Temporal coverage:
Baseline scenario 2001 (census data)
Future scenario 2051

3. Methodology and data
GIS-based physical, environmental and
socio-economic indicators spatially
evaluated by:
Aggregating information at the
provincial scale (nuts3 level) based on:
• Percentage
• Mean values
Reclassification of variables according to
their capacity to determine detrimental
changes to coastlines (1 – 5)

3. Methodology and data
Variable Unit
Score
Very low Low Moderate High Very high
1 2 3 4 5
Coastal forcing indicators
Extreme Sea Levels (ESL) m < 1 1 – 1.6 1.6 – 2.2 2.2 – 2.8 > 2.8
Environmental indicators
Shoreline evolution trend %
Less than 20% of the
shoreline is in erosion
or in accretion (per
region)
/
Between 20% and 60%
of the shoreline is in
erosion or in accretion
(per region)
/
More than 60% of the
shoreline is in erosion or
in accretion (per region)
Distance from shoreline m > 4500 4500 - 2100 2099 - 900 899 - 300 < 300
Coastal slope % > 1/10 1/10 - 1/20 1/20 - 1/30 1/30 - 1/50 1/50 - 1/100
Elevation m > 30 20 to < 30 10 to < 20 5 to < 10 < 5
Geological coastal type %> 70% of “likely non-
erodible segments”/
“likely non-erodible
segments” between
40% and 70%
/< 40% of “likely non-
erodible segments”
Land roughness / Urban areas Forest and water bodiesShrub land, grassland,
sparse vegetationAgriculture Bare areas
Conservation designation / Absent European international National
Coastal protection
structures%
> 50% of protected
coast
31-50% of protected
coast
21-30% of protected
coast5-20% of protected coast < 5% of protected coast
Social indicator
Population < 5 years / < 9871 9872 - 15230 15231 - 21644 21645 - 35733 > 35734
Population > 65 years / < 41243 41244 - 57008 57009 - 76078 76079 - 106784 > 106785
Economic indicators
Gross domestic product -
GDP$ > 31000 31000 – 25000 24000 - 17000 16000 - 9000 < 9000
Land use pattern /
Water bodies,
marsh/bog and moor,
sparsely vegetated
areas, bare rocks
Natural grasslands,
coastal areasForest Agriculture
Urban and industrial
infrastructure
Based on scenarios
developed by Vousdoukas et
al., 2017
Based on scenarios
developed by Santini &
Valentini, 2011Based on scenarios
developed by ISTAT, 2008Based on scenarios
developed by Murakami &
Yamagata, 2016

Coastal Forcing (CF) sub-index = [(sum of CF indicators) – 1]/4x 100
Environmental (Env) sub-index = [(sum of Env indicators) – 9]/36 x 100
Social (S) sub-index = [(sum of S indicators) – 1]/4x 100
Economic (Econ) sub-index = [(sum of Econ indicators) – 2]/8x 100
CVI = (Env sub-index + CF sub-index + S sub-index + Econ sub-index) / 4
Sum of the values of the relative
variables
Normalization of the resulting output elaborating it as percentage
of the range of scores possible (maximum and minimum)
Standardization in the range 0-100
Average of the four sub-indices values
National - Coastal Vulnerability IndexAdapted from the multi-scale CVI by McLaughling & Cooper (2010)
3. Methodology and data

4. Results and discussionNumber of
provinces with
moderate scores
increases; very high
and medium scores
expand along the
coast
RCP 8.5 scenario
confirms and worsen
the results of the
RCP4.5 in the
Adriatic coast
Very high and high
scores located along
the North Adriatic
Sea region, low
values along most of
the rest of the coastline
0
41
11
47
0
27
24
2 10
0
27
22
3 11
Coastal forcing
sub-index
Baseline Future 2050 scenario
RCP4.5
Future 2050 scenario
RCP8.5

4. Results and discussion
Very low and low scores in North-
East provinces (Trieste and
Gorizia) due to higher coasts,
steeper slopes and less dynamic
shorelines
Higher scores especially along the North
Adriatic and North Tyrrhenian coasts, all
featured by gentle slopes and low-lying coastal
areas
Baseline
Environmental
sub-index
From maps related to the
environmental indicators a great
environmental heterogeneity of the
Italian coasts is highlighted
By comparing baseline and future scenarios a
slight decrease in the overall score of the
environmental sub-index can be observed in some
areas due to land use changes
4. Results and discussion
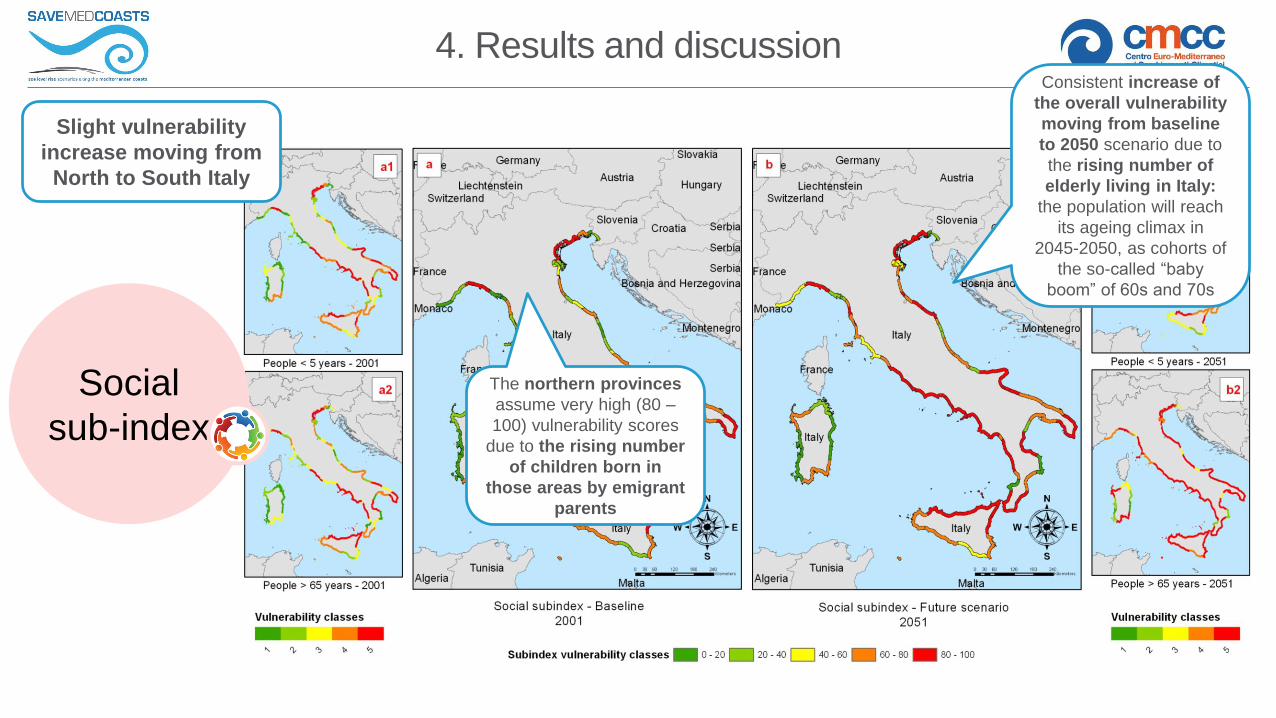
Social
sub-index
Slight vulnerability
increase moving from
North to South Italy
Consistent increase of
the overall vulnerability
moving from baseline
to 2050 scenario due to
the rising number of
elderly living in Italy:
the population will reach
its ageing climax in
2045-2050, as cohorts of
the so-called “baby
boom” of 60s and 70s
The northern provinces
assume very high (80 –
100) vulnerability scores
due to the rising number
of children born in
those areas by emigrant
parents

4. Results and discussion
Economic
sub-index
The output of the economic sub-index
highlights a great variety in
vulnerability scores among the
different provinces, mainly driven by the
GDP indicator, that strongly varies
along the country respect to the land
use pattern indicator
Comparing baseline with future
scenario, vulnerability is expected
to decrease according to the high
GDP growth projected for the
2050 scenario across most of the
Italian provinces
The reduction of the economic
vulnerability connected with the
decreasing vulnerability of the future
GDP indicator is counterbalanced by
the 2050 land use scenario: urban
areas are supposed to expand, thus
increasing the economic vulnerability of
the area of concern
4. Results and discussion
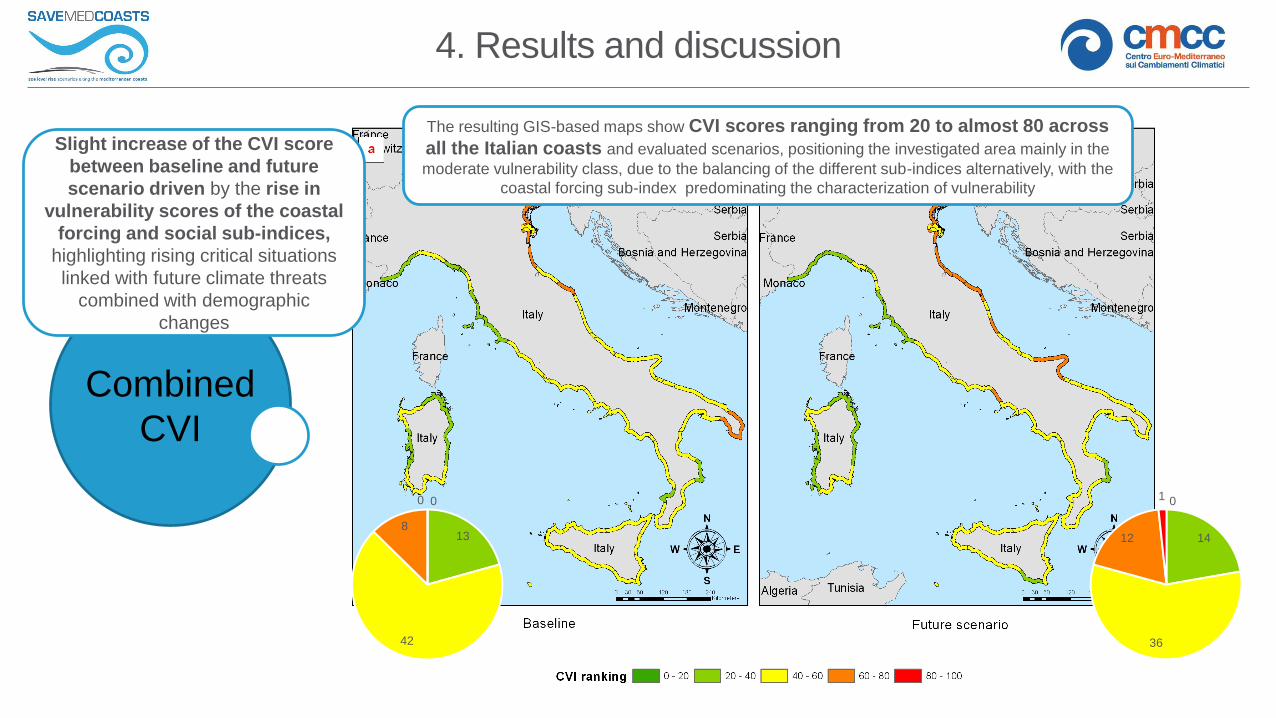
Combined
CVI
0
13
42
8
0 0
14
36
12
1
The resulting GIS-based maps show CVI scores ranging from 20 to almost 80 across
all the Italian coasts and evaluated scenarios, positioning the investigated area mainly in the
moderate vulnerability class, due to the balancing of the different sub-indices alternatively, with the
coastal forcing sub-index predominating the characterization of vulnerability
Slight increase of the CVI score
between baseline and future
scenario driven by the rise in
vulnerability scores of the coastal
forcing and social sub-indices,
highlighting rising critical situations
linked with future climate threats
combined with demographic
changes

5. Conclusions
• Implementation of social and economic projections to better investigate the interconnections of climatic hazards with changes in social and economic systems, as well as their relationship with the surrounding environment.
• Adaptable to different spatial scales of analysis and geographic context, integrating different data at higher resolutions
• Useful to easily communicate and translate knowledge between the science and practitioners interfaces and to be implemented for national adaptation policies
• Evaluation of uncertainty by integrating climate, land use and economic social scenarios from different assumptions/models
• Lack of temporal coherence among the different scenarios for all the indicators
• Low spatial resolution of economic data not supporting the evaluation of economic dynamics of coastal areas

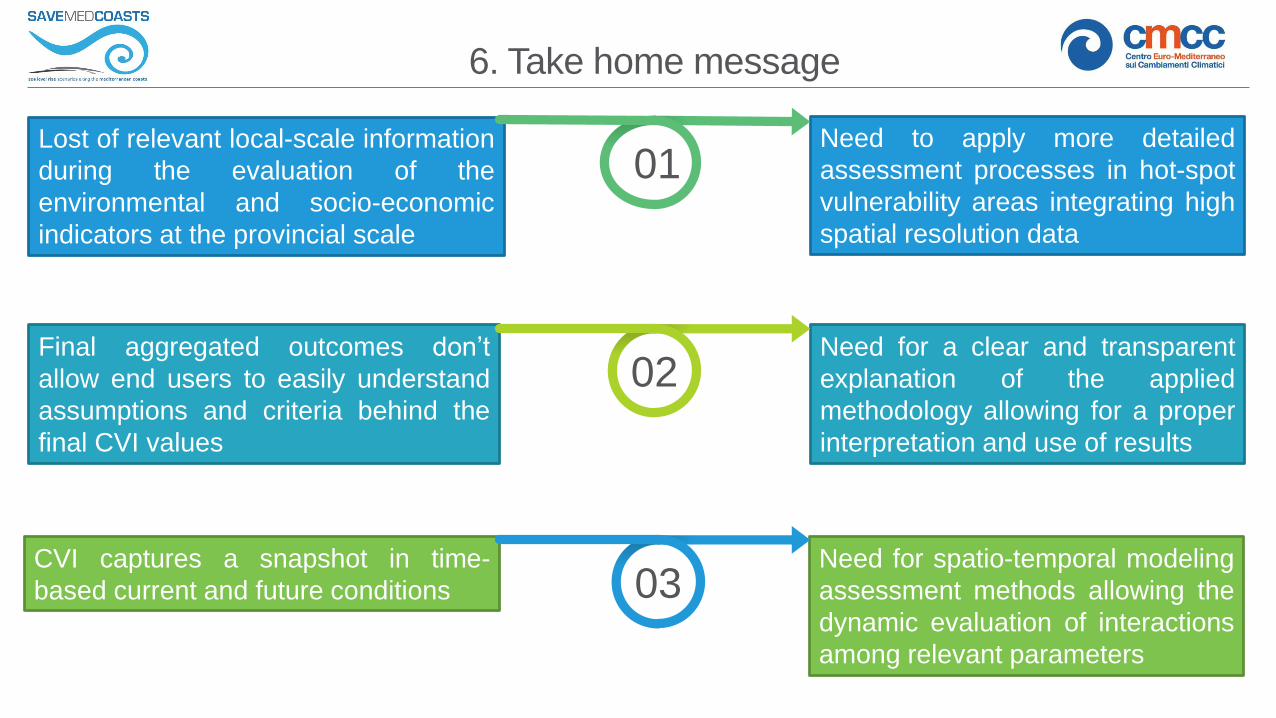
6. Take home message
Need to apply more detailed
assessment processes in hot-spot
vulnerability areas integrating high
spatial resolution data
Lost of relevant local-scale information
during the evaluation of the
environmental and socio-economic
indicators at the provincial scale
Need for a clear and transparent
explanation of the applied
methodology allowing for a proper
interpretation and use of results
Final aggregated outcomes don’t
allow end users to easily understand
assumptions and criteria behind the
final CVI values
CVI captures a snapshot in time-
based current and future conditions
Need for spatio-temporal modeling
assessment methods allowing the
dynamic evaluation of interactions
among relevant parameters
01
02
03
3. Methodology and data
Economic indicators are based on GDP projections developed by Murakami & Yamagata, (2016)
Selected socio-economic pathways: SSP3
Future projections based on the downscaling of 3 parameters into a 0.5-degree grids:
- Urban population- Non-urban population- GDP (Power Purchase Parity (PPP))
(Murakami & Yamagata, 2016)
Temporal coverage:
Baseline scenario 2010Future scenario 2050
https://tntcat.iiasa.ac.at/SspDb/dsd?Action=htmlpage&page=about
Billion US$ in 2005 year rate
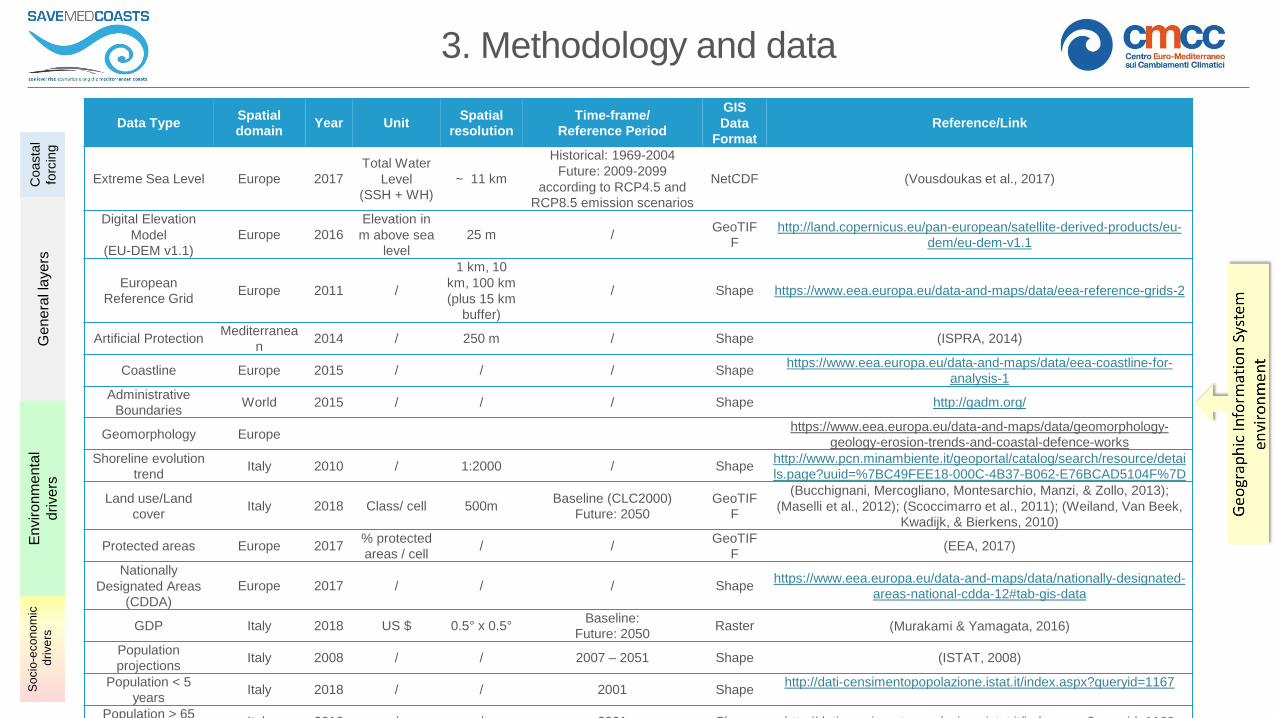
3. Methodology and data
Data TypeSpatial
domainYear Unit
Spatial
resolution
Time-frame/
Reference Period
GIS
Data
Format
Reference/Link
Extreme Sea Level Europe 2017
Total Water
Level
(SSH + WH)
~ 11 km
Historical: 1969-2004
Future: 2009-2099
according to RCP4.5 and
RCP8.5 emission scenarios
NetCDF (Vousdoukas et al., 2017)
Digital Elevation
Model
(EU-DEM v1.1)
Europe 2016
Elevation in
m above sea
level
25 m /GeoTIF
F
http://land.copernicus.eu/pan-european/satellite-derived-products/eu-
dem/eu-dem-v1.1
European
Reference GridEurope 2011 /
1 km, 10
km, 100 km
(plus 15 km
buffer)
/ Shape https://www.eea.europa.eu/data-and-maps/data/eea-reference-grids-2
Artificial ProtectionMediterranea
n2014 / 250 m / Shape (ISPRA, 2014)
Coastline Europe 2015 / / / Shapehttps://www.eea.europa.eu/data-and-maps/data/eea-coastline-for-
analysis-1
Administrative
BoundariesWorld 2015 / / / Shape http://gadm.org/
Geomorphology Europehttps://www.eea.europa.eu/data-and-maps/data/geomorphology-
geology-erosion-trends-and-coastal-defence-works
Shoreline evolution
trendItaly 2010 / 1:2000 / Shape
http://www.pcn.minambiente.it/geoportal/catalog/search/resource/detai
ls.page?uuid=%7BC49FEE18-000C-4B37-B062-E76BCAD5104F%7D
Land use/Land
coverItaly 2018 Class/ cell 500m
Baseline (CLC2000)
Future: 2050
GeoTIF
F
(Bucchignani, Mercogliano, Montesarchio, Manzi, & Zollo, 2013);
(Maselli et al., 2012); (Scoccimarro et al., 2011); (Weiland, Van Beek,
Kwadijk, & Bierkens, 2010)
Protected areas Europe 2017% protected
areas / cell/ /
GeoTIF
F(EEA, 2017)
Nationally
Designated Areas
(CDDA)
Europe 2017 / / / Shapehttps://www.eea.europa.eu/data-and-maps/data/nationally-designated-
areas-national-cdda-12#tab-gis-data
GDP Italy 2018 US $ 0.5° x 0.5°Baseline:
Future: 2050Raster (Murakami & Yamagata, 2016)
Population
projectionsItaly 2008 / / 2007 – 2051 Shape (ISTAT, 2008)
Population < 5
yearsItaly 2018 / / 2001 Shape
http://dati-censimentopopolazione.istat.it/index.aspx?queryid=1167
Population > 65
yearsItaly 2018 / / 2001 Shape http://dati-censimentopopolazione.istat.it/index.aspx?queryid=1168
Ge
ne
ral la
ye
rsC
oasta
l
forc
ing
En
viro
nm
enta
l
drive
rs
So
cio
-eco
no
mic
dri
ve
rs

Representative concentration
pathways (RCPs)
RCP 8.5 Rising radiative forcing pathway leading to 8.5 W/m² in 2100.
RCP 6Stabilization without overshoot pathway to 6 W/m² at stabilization
after 2100
RCP 4.5Stabilization without overshoot pathway to 4.5 W/m² at
stabilization after 2100
RCP 2.6 Peak in radiative forcing at ~ 3 W/m² before 2100 and decline
Radiative forcing is a measure of the energy absorbed and retained in
the lower atmosphere. It can be positive (heating) or negative (cooling)
and is affected by greenhouse gas concentration, aerosol concentration,
changes in land cover and natural drivers such as total solar irradiance.
There are 4 different RCPs and each of them defines a specific emission
trajectory and subsequent radiative forcing. The numbers in each RCP
refer to the amount of radiative forcing produced by greenhouse gases in
2100:
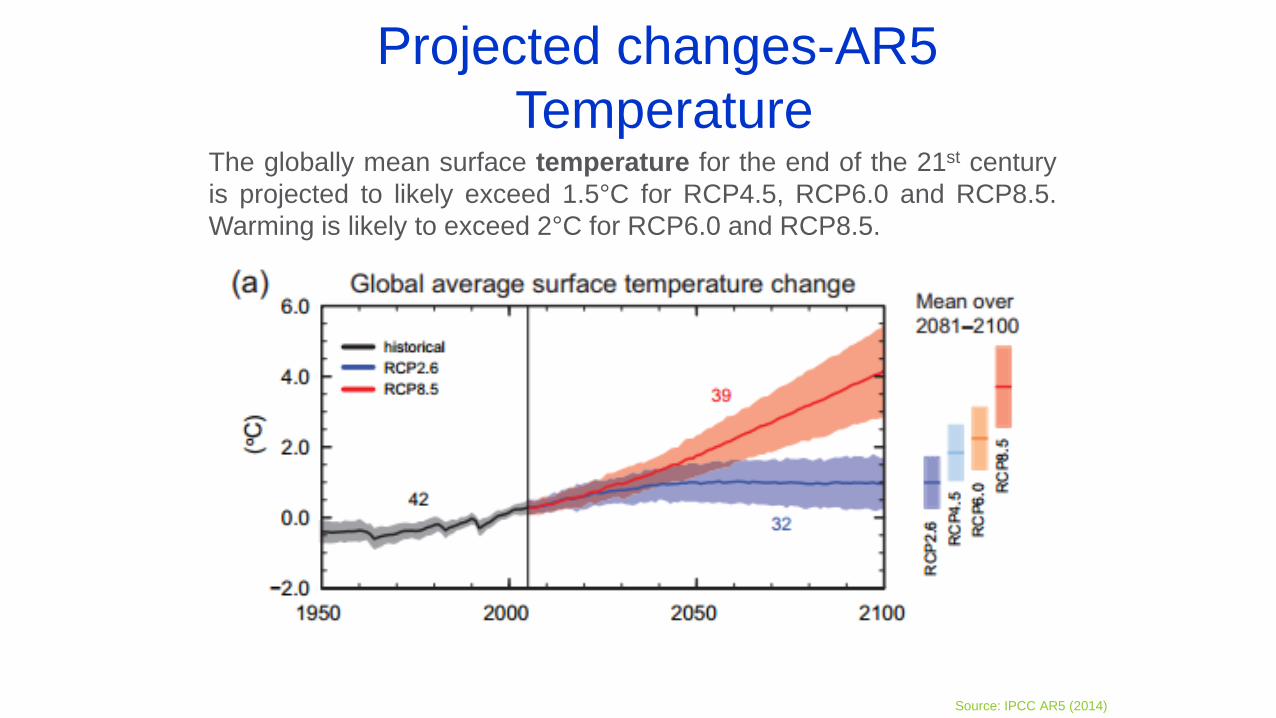
Projected changes-AR5
Temperature The globally mean surface temperature for the end of the 21st century
is projected to likely exceed 1.5°C for RCP4.5, RCP6.0 and RCP8.5.
Warming is likely to exceed 2°C for RCP6.0 and RCP8.5.
Source: IPCC AR5 (2014)

Sea level will continue to rise in the 21st century; under the RCP
scenarios, the rate of sea level rise will very likely exceed that observed
during 1971 to 2010 due to increase ocean warming and increased loss
of mass from glaciers and ice sheets.
Global mean sea level rise for
2081–2100 relative to 1986–2005
will likely be in the ranges of
0.26 to 0.55 m for RCP2.6,
0.32 to 0.63 m for RCP4.5,
0.33 to 0.63 m for RCP6.0,
0.45 to 0.82 m for RCP8.5
Projected changes – AR5
Sea level
Source: IPCC AR5 (2014)

3. Methodology and data
Grid-based scenario representing total
GDP for the Italian case study
Downscaling of gridded values at the
nuts3 level
Computation of GDP per capita by
dividing the GDP gridded values at the
nut3 level by the number of inhabitants
living in each province
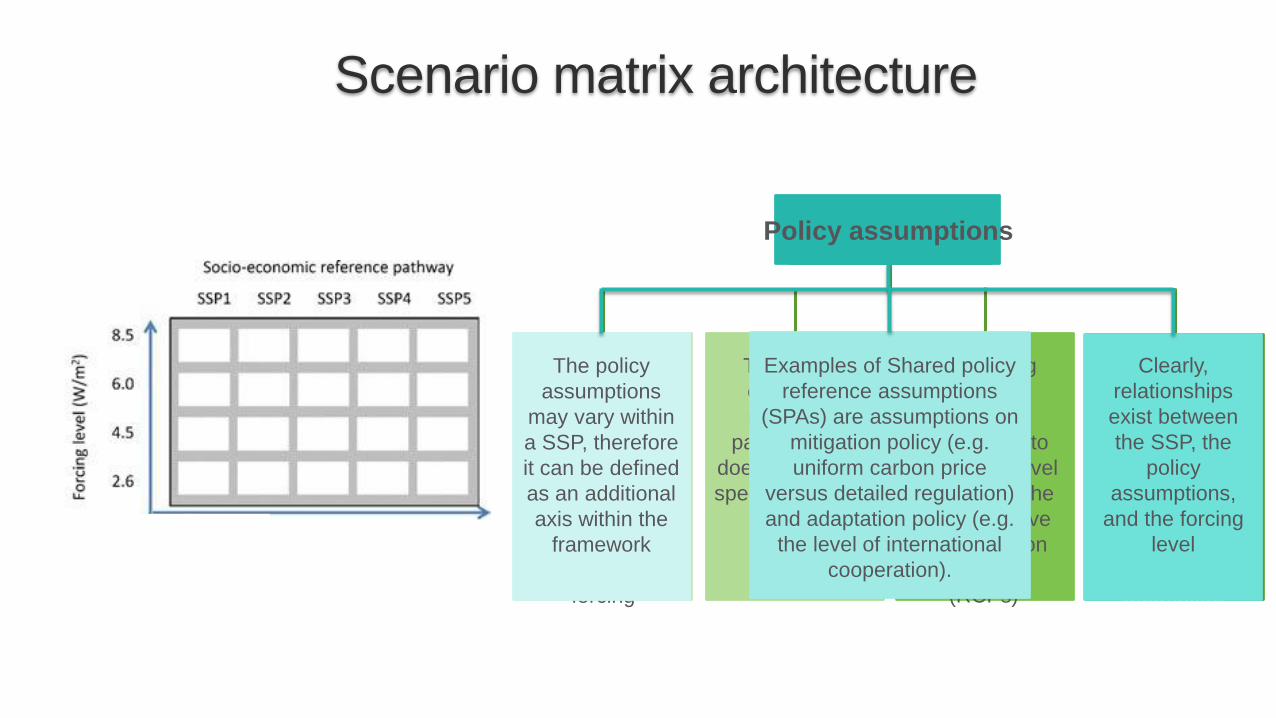
Scenario matrix architecture
The socio-
economic
reference
pathway axis
does not have a
specific direction
Combines
different socio-
economic
reference
assumptions as
described by
SSPs with
different future
levels of climate
forcing
The forcing
levels are
chosen to
correspond to
the forcing level
reached by the
representative
concentration
pathways
(RCPs)
Each cell,
combining a
SSP and forcing
level, represents
possible
scenarios that
combine
elements of
mitigation and
adaptation
policy
The architecture
The policy
assumptions
may vary within
a SSP, therefore
it can be defined
as an additional
axis within the
framework
Examples of Shared policy
reference assumptions
(SPAs) are assumptions on
mitigation policy (e.g.
uniform carbon price
versus detailed regulation)
and adaptation policy (e.g.
the level of international
cooperation).
Clearly,
relationships
exist between
the SSP, the
policy
assumptions,
and the forcing
level
Policy assumptions
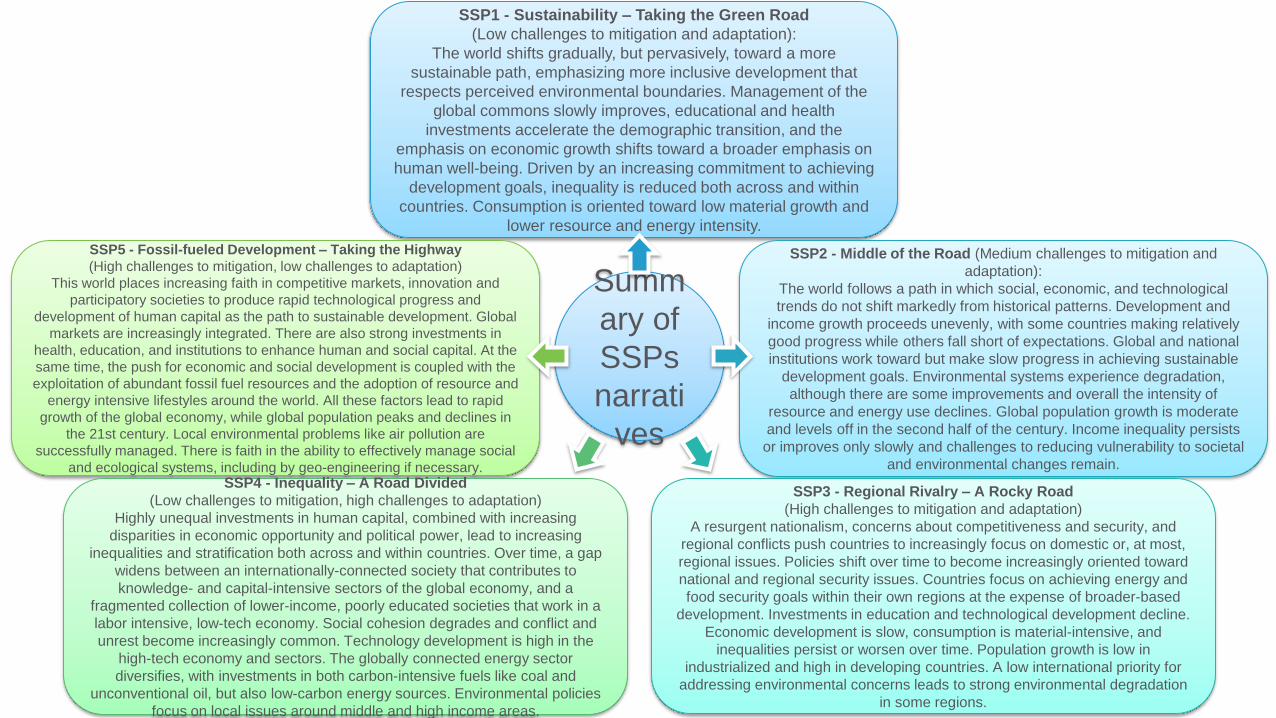
Summ
ary of
SSPs
narrati
ves
SSP1 - Sustainability – Taking the Green Road
(Low challenges to mitigation and adaptation):
The world shifts gradually, but pervasively, toward a more
sustainable path, emphasizing more inclusive development that
respects perceived environmental boundaries. Management of the
global commons slowly improves, educational and health
investments accelerate the demographic transition, and the
emphasis on economic growth shifts toward a broader emphasis on
human well-being. Driven by an increasing commitment to achieving
development goals, inequality is reduced both across and within
countries. Consumption is oriented toward low material growth and
lower resource and energy intensity.
SSP5 - Fossil-fueled Development – Taking the Highway
(High challenges to mitigation, low challenges to adaptation)
This world places increasing faith in competitive markets, innovation and
participatory societies to produce rapid technological progress and
development of human capital as the path to sustainable development. Global
markets are increasingly integrated. There are also strong investments in
health, education, and institutions to enhance human and social capital. At the
same time, the push for economic and social development is coupled with the
exploitation of abundant fossil fuel resources and the adoption of resource and
energy intensive lifestyles around the world. All these factors lead to rapid
growth of the global economy, while global population peaks and declines in
the 21st century. Local environmental problems like air pollution are
successfully managed. There is faith in the ability to effectively manage social
and ecological systems, including by geo-engineering if necessary.
SSP2 - Middle of the Road (Medium challenges to mitigation and
adaptation):
The world follows a path in which social, economic, and technological
trends do not shift markedly from historical patterns. Development and
income growth proceeds unevenly, with some countries making relatively
good progress while others fall short of expectations. Global and national
institutions work toward but make slow progress in achieving sustainable
development goals. Environmental systems experience degradation,
although there are some improvements and overall the intensity of
resource and energy use declines. Global population growth is moderate
and levels off in the second half of the century. Income inequality persists
or improves only slowly and challenges to reducing vulnerability to societal
and environmental changes remain.
SSP3 - Regional Rivalry – A Rocky Road
(High challenges to mitigation and adaptation)
A resurgent nationalism, concerns about competitiveness and security, and
regional conflicts push countries to increasingly focus on domestic or, at most,
regional issues. Policies shift over time to become increasingly oriented toward
national and regional security issues. Countries focus on achieving energy and
food security goals within their own regions at the expense of broader-based
development. Investments in education and technological development decline.
Economic development is slow, consumption is material-intensive, and
inequalities persist or worsen over time. Population growth is low in
industrialized and high in developing countries. A low international priority for
addressing environmental concerns leads to strong environmental degradation
in some regions.
SSP4 - Inequality – A Road Divided
(Low challenges to mitigation, high challenges to adaptation)
Highly unequal investments in human capital, combined with increasing
disparities in economic opportunity and political power, lead to increasing
inequalities and stratification both across and within countries. Over time, a gap
widens between an internationally-connected society that contributes to
knowledge- and capital-intensive sectors of the global economy, and a
fragmented collection of lower-income, poorly educated societies that work in a
labor intensive, low-tech economy. Social cohesion degrades and conflict and
unrest become increasingly common. Technology development is high in the
high-tech economy and sectors. The globally connected energy sector
diversifies, with investments in both carbon-intensive fuels like coal and
unconventional oil, but also low-carbon energy sources. Environmental policies
focus on local issues around middle and high income areas.

Motivations
focuses on the Prevention Priority. It aims to
respond to the need for people and assets
prevention from natural disasters and sea level rise
in Mediterranean coasts
GENERAL OBJECTIVES:
Support civil protection to produce exhaustive risk assessments for different periods;
Improving governance and raising community awareness towards the impacts of s.l. rise;
Fostering cooperation amongst science, affected communities and civil protection organizations within and
between targeted Mediterranean areas.
SPECIFIC OBJECTIVES
Scansion of the current risk management capabilities and actions to identify best practices, existing prevention
protocols, lacks and rooms for improvement.
Advanced methods to develop multi-hazard assessments and existing databases for the Mediterranean basin
and for specific case studies for areas below or at less than 1 m above s.l..
To transfer information to society, policy makers and stakeholders.

4. Results and discussion
Very low and low scores in
Trieste and Gorizia provinces due to higher coasts,
steeper slopes and less
dynamic shorelines
Higher scores along the Veneto and Emilia
Romagna coasts, the Gargano area and in
the Apulia and Tuscany regions, all featured
by gentle slopes and low-lying coastal areas
Baseline
Environmental
sub-index
A slight decrease in the overall score of the
environmental sub-index can be observed due to
land use changes expected in these areas,
influencing the spatial distribution of the connected
environmental indicator (i.e. land roughness)

Global mean sea level is rising and will continue to rise in the 21st century due to climate change
Low-lying and subsiding coasts are vulnerable to storm surges flooding and coastal erosion
Impacts on infrastructure, people safety, economic assets, cultural heritage, ecosystems.
Together with changing hazard frequency and intensity, changing patterns of exposure and vulnerability, will be
responsible of multi-risk scenarios.
Relevant EU and International policies:
- The European Flood Directive 2007/60/EC - flood risk management plans / river and coastal flooding
- The EU Strategy on adaptation to climate change - EU’s preparedness to current and future climate impacts
- The Sendai Framework for Disaster Risk Reduction 2015-2030 - need to adopt a multi-hazard approach.
- The Community Civil Protection Mechanism - coordinated, effective and efficient response to disasters, joining
prevention and preparedness actions.
Need of risk assessment protocols and tools able to deal with the complex interactions and dynamics between social and environmental systems, supporting the development climate
adaptation and risk reduction measures.
Motivations