assessing ride on’s access to jobs program · pdf fileassessing ride on’s access...
TRANSCRIPT
Assessing Ride On’s Access to Jobs Program
An Interactive Project submitted to the Faculty of
WORCESTER POLYTECHNIC INSTITUTE in partial fulfillment of the requirements for the
Degree of Bachelor of Science by
_______________________ Kenneth S. Bravman
_______________________ Timothy D. Dunn
_______________________ Corinne S. Linderman
Date: December 15th, 2005
Approved:
___________________________________ Professor Tahar El-Korchi, Co-Advisor
___________________________________ Professor Brigitte Servatius, Co-Advisor
Authorship Page
Kenneth S. Bravman Developed survey, conducted bus surveying, entered and tabulated responses Major contributions to: Abstract, Executive Summary, Literature Review, Methodology, Results, Recommendations, Survey Development
Timothy D. Dunn Developed survey, conducted bus surveying, edited paper and
presentation Major contributions to: Introduction, Literature Review, Methodology, Recommendations, Test Group
Corinne S. Linderman Developed survey, conducted bus surveying, performed analysis of
responses Major contributions to: Introduction, Literature Review, Methodology, Results, Analysis, Recommendations, Executive Summary
i
Acknowledgements We would like to thank the following people for their help during and contributions to
our project.
Ride On
Philip McLaughlin Howard Benn John Greiner Beverly Le Masters Beth Dennard Juan Ye Janeth Mora Chris Garnier Nick Garnier All the Bus Drivers
WPI
Tahar El-Korchi Brigitte Servatius Kent Rissmiller David DiBiasio
ii
Table of Contents Introduction..................................................................................................................................... 1 Background..................................................................................................................................... 5
Montgomery County Transit....................................................................................................... 5 Temporary Assistance for Needy Families (TANF) Program.................................................. 12 History of Urban Planning ........................................................................................................ 15 Other Metropolitan Area Bus Systems ..................................................................................... 16 Transportation Assessment Companies .................................................................................... 17
Development of Procedures.......................................................................................................... 20 The Survey................................................................................................................................ 20 Potential Issues.......................................................................................................................... 22 Survey Analysis ........................................................................................................................ 23
Survey Development..................................................................................................................... 24 Test Group .................................................................................................................................... 26 Results........................................................................................................................................... 28
Overall....................................................................................................................................... 29 Mornings ................................................................................................................................... 29 Nights........................................................................................................................................ 29 Spanish...................................................................................................................................... 29 Survey Questions ...................................................................................................................... 29
Question One: “What is the main purpose of your trip today?” ........................................... 30 Question Two: “Are you going to or coming from your answer to question one?” ............. 31 Question Three: “Do you use this bus route often to get to or from work?”........................ 33 Question Four: “You are:” .................................................................................................... 34 Question Five: “Did this Ride On late evening or early morning bus trip help you…”....... 35 Question Six: “If you were not taking this Ride On late evening or early morning bus trip to get to work, how would you get to this job?” ....................................................................... 36 Question Seven: “What time do you typically utilize the bus?”........................................... 38 Question Eight: “During your normal week, how many total trips do you take on Ride On?”............................................................................................................................................... 39 Question Nine: “How many bus transfers will you make to get to your destination?” ........ 40 Question Ten: “What forms of transportation will you use during your trip other than Ride On?” ...................................................................................................................................... 42 Question Eleven: “Do you have a car available to you?”..................................................... 43 Question Twelve: “How many jobs do you currently hold?”............................................... 44 Question Thirteen: “How many hours a week do you work?” ............................................. 45 Question Fourteen: “How many days per week do you work?”........................................... 46 Question Fifteen: “What is your total annual household income?”...................................... 47
Associations .............................................................................................................................. 48 Omitted Questions .................................................................................................................... 53
Analysis......................................................................................................................................... 56 Question One: “What is the main purpose of your trip today?” ............................................... 56 Question Five: “Did this Ride On Late Evening or Early Morning Bus Trip Help You…”.... 57 Question Six: “If You Were Not Taking this Ride On Late Evening or Early Morning Bus Trip to Get to Work, How Would You Get to this Job?” ................................................................. 57
iii
Associations .............................................................................................................................. 59 Analysis of Hours Worked vs. Household Income................................................................... 59 Analysis of number of Jobs vs. Income .................................................................................... 59 Response Rates ......................................................................................................................... 60 Overall Data .............................................................................................................................. 62 Comments ................................................................................................................................. 63 Verification ............................................................................................................................... 66 Times We Rode......................................................................................................................... 66
Recommendations......................................................................................................................... 69 Appendix A: Ride On Routes ....................................................................................................... 71
Route 5 ...................................................................................................................................... 71 Route 12 .................................................................................................................................... 72 Route 16 .................................................................................................................................... 73 Route 20 .................................................................................................................................... 74 Route 26 .................................................................................................................................... 75 Route 46 .................................................................................................................................... 76 Route 55 .................................................................................................................................... 77 Route 59 .................................................................................................................................... 78
Appendix B: Past Ride On Surveys .............................................................................................. 79 Customer Satisfaction Survey................................................................................................... 79 Past Access to Jobs Survey ....................................................................................................... 80
Appendix C: Our Survey .............................................................................................................. 81 English ...................................................................................................................................... 81 Spanish...................................................................................................................................... 82
Appendix D: Graphical Results .................................................................................................... 83 Route 5 ...................................................................................................................................... 83 Route 16 .................................................................................................................................... 92 Route 20 .................................................................................................................................. 101 Route 26 .................................................................................................................................. 110 Route 46 .................................................................................................................................. 119 Route 55 .................................................................................................................................. 128 Route 59 .................................................................................................................................. 137
Appendix E: Comments.............................................................................................................. 146 Bibliography ............................................................................................................................... 149
iv

List of Figures Figure 1: Annual Delay in Hours.................................................................................................... 1 Figure 2: Montgomery County Map............................................................................................... 6 Figure 3: TANF Map .................................................................................................................... 13 Figure 4: How TANF Dollars Are Spent...................................................................................... 14 Figure 5: Survey Questions from the WRTA Survey................................................................... 21 Figure 6: Response Percentage of Question One.......................................................................... 31 Figure 7: Response Percentage of Question Two......................................................................... 32 Figure 8: Response Percentage of Question Three ....................................................................... 33 Figure 9: Response Percentage of Question Four......................................................................... 34 Figure 10: Response Percentage of Question Five ....................................................................... 36 Figure 11: Response Percentage of Question Six ......................................................................... 37 Figure 12: Response Percentage of Question Seven..................................................................... 39 Figure 13: Response Percentage of Question Eight...................................................................... 40 Figure 14: Response Percentage of Question Nine....................................................................... 41 Figure 15: Response Percentage of Question Ten ........................................................................ 43 Figure 16: Response Percentage of Question Eleven ................................................................... 44 Figure 17: Response Percentage of Question Twelve .................................................................. 45 Figure 18: Response Percentage of Question Thirteen................................................................. 46 Figure 19: Response Percentage of Question Fourteen ................................................................ 47 Figure 20: Response Percentage of Question Fifteen ................................................................... 48 Figure 21: Omitted Responses by Question.................................................................................. 54
v
List of Tables Table 1: 2005 HHS Poverty Guidelines.......................................................................................... 2 Table 2: Self-Sufficiency Wages .................................................................................................... 3 Table 3: Suggested Original Routes ............................................................................................... 8 Table 4: Weekday Differences........................................................................................................ 9 Table 5: Saturday Differences ...................................................................................................... 10 Table 6: Sunday Differences......................................................................................................... 10 Table 7: Trips Surveyed................................................................................................................ 28 Table 8: Responses to Question One ............................................................................................ 30 Table 9: Responses to Question Two............................................................................................ 31 Table 10: Responses to Question Three........................................................................................ 33 Table 11: Responses to Question Four ......................................................................................... 34 Table 12: Responses to Question Five.......................................................................................... 35 Table 13: Responses to Question Six............................................................................................ 37 Table 14: Responses to Question Seven ....................................................................................... 38 Table 15: Responses to Question Eight ........................................................................................ 40 Table 16: Responses to Question Nine ......................................................................................... 41 Table 17: Responses to Question Ten........................................................................................... 42 Table 18: Responses to Question Eleven...................................................................................... 43 Table 19: Responses to Question Twelve..................................................................................... 44 Table 20: Responses to Question Thirteen ................................................................................... 45 Table 21: Responses to Question Fourteen................................................................................... 46 Table 22: Responses to Question Fifteen...................................................................................... 47 Table 23: Question One, Five, and Fifteen ................................................................................... 50 Table 24: Question One, Six, and Fifteen..................................................................................... 51 Table 25: Questions Thirteen and Fifteen..................................................................................... 52 Table 26: Questions Twelve and Fifteen ...................................................................................... 53
vi

Abstract
In 1998, Ride On, Montgomery County, Maryland's bus system, extended the span of
service on eight bus routes as part of its Access to Jobs program. Their goal was to link low-
income areas with the transit network of the Washington, D.C. metropolitan area. By surveying
the riders of these late night and early morning bus trips, we were able to evaluate these
extensions to determine how dependent peoples’ employment is on Ride On’s extended
operating hours.
vii
Executive Summary
The goal of our project is to assess the 1998 span extensions made to eight Ride On bus
routes. This increase in the span of service was part of the county’s Access to Jobs program
designed to stimulate economic growth in low-income areas of the county. In addition to the
eight routes that were extended twenty-two others were considered, however, due to funding
limitations, they were not extended. Now, in 2005, the Montgomery County Government is
looking to see if the increase in service on these eight routes accomplished its goals of linking
Temporary Assistance for Needy Families (TANF) areas to the Washington, D.C. transportation
network.
To achieve our project goal, we attempted to survey all of the riders on the first and last
trips of seven of the eight routes for two main reasons: it was the method that Ride On suggested,
and it would be the easiest way to learn about the riders and their situations. We developed our
survey prior to arriving in Washington, D.C. and finalized it with the help of Ride On’s
marketing department. We then spent eighteen mornings and eighteen nights over the course of
three weeks attempting to survey every passenger during these trips. We received completed
surveys from 508 of the 1,029 riders who ride these late night and early morning bus trips.
From our results and analysis it can be concluded that we achieved our project goals of
determining the ridership of bus trips during the extended hours, the job dependency upon this
service, and the ability of riders to get into the transportation network. A vast majority of riders
late at night and early in the morning are using the bus to get to or from work. Additionally, a
majority are using it to meet up with Metrobus and Metrorail. Riders were also quite dependant
upon the buses as just over eighty percent did not have access to a car, and one third of
respondents would not have their current job without the service.
viii
Introduction
The Washington, D.C. Metropolitan Area is home to one of the largest workforces in the
country, consisting of more than 675,000 people. The surrounding areas, specifically the
District’s neighbor to the northwest, Montgomery County, experiences the pressure that these
workers place upon the infrastructure in the form of long commute times and heavy traffic
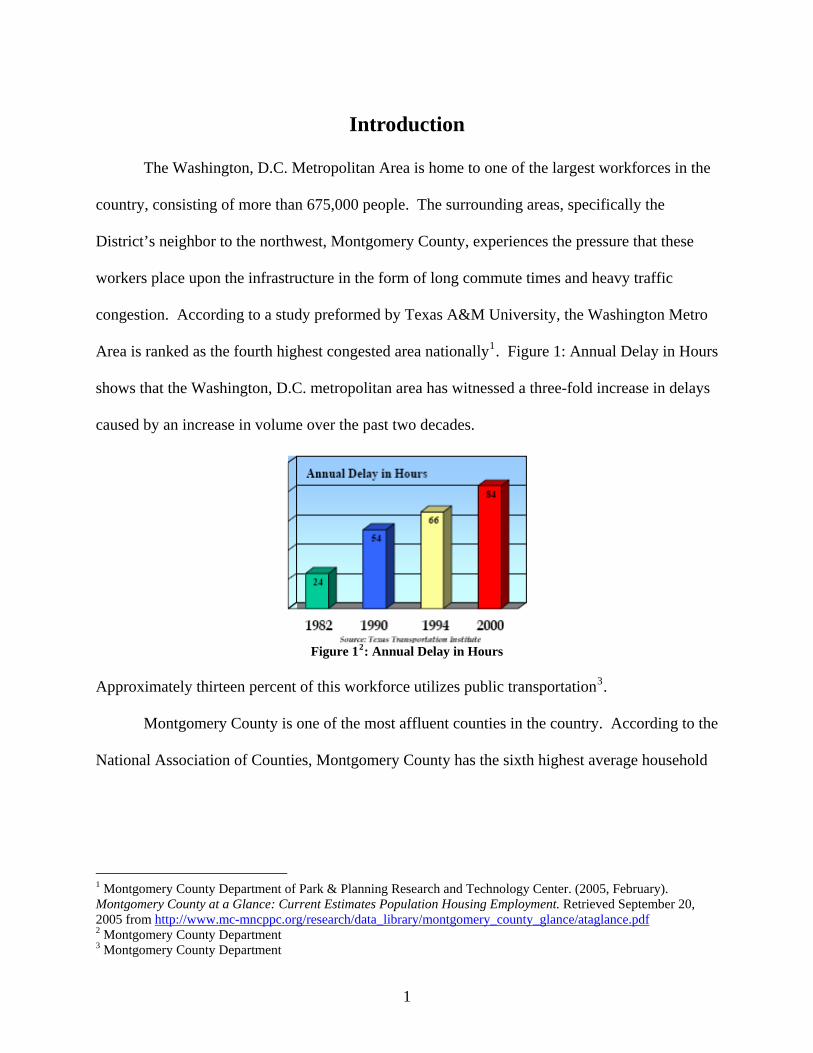
congestion. According to a study preformed by Texas A&M University, the Washington Metro
Area is ranked as the fourth highest congested area nationally1. Figure 1: Annual Delay in Hours
shows that the Washington, D.C. metropolitan area has witnessed a three-fold increase in delays
caused by an increase in volume over the past two decades.
Figure 12: Annual Delay in Hours
Approximately thirteen percent of this workforce utilizes public transportation3.
Montgomery County is one of the most affluent counties in the country. According to the
National Association of Counties, Montgomery County has the sixth highest average household
1 Montgomery County Department of Park & Planning Research and Technology Center. (2005, February). Montgomery County at a Glance: Current Estimates Population Housing Employment. Retrieved September 20, 2005 from http://www.mc-mncppc.org/research/data_library/montgomery_county_glance/ataglance.pdf2 Montgomery County Department 3 Montgomery County Department
1
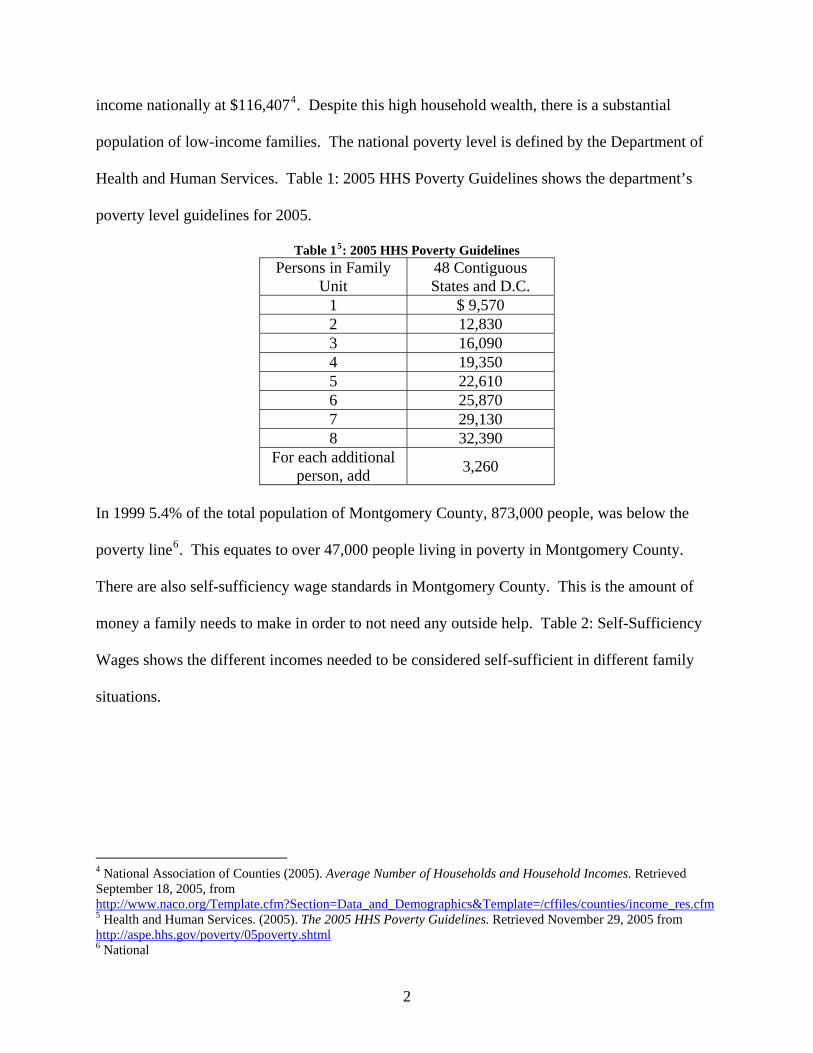
income nationally at $116,4074. Despite this high household wealth, there is a substantial
population of low-income families. The national poverty level is defined by the Department of
Health and Human Services. Table 1: 2005 HHS Poverty Guidelines shows the department’s
poverty level guidelines for 2005.
Table 15: 2005 HHS Poverty Guidelines Persons in Family
Unit 48 Contiguous States and D.C.
1 $ 9,570 2 12,830 3 16,090 4 19,350 5 22,610 6 25,870 7 29,130 8 32,390
For each additional person, add 3,260
In 1999 5.4% of the total population of Montgomery County, 873,000 people, was below the
poverty line6. This equates to over 47,000 people living in poverty in Montgomery County.
There are also self-sufficiency wage standards in Montgomery County. This is the amount of
money a family needs to make in order to not need any outside help. Table 2: Self-Sufficiency
Wages shows the different incomes needed to be considered self-sufficient in different family
situations.
4 National Association of Counties (2005). Average Number of Households and Household Incomes. Retrieved September 18, 2005, from http://www.naco.org/Template.cfm?Section=Data_and_Demographics&Template=/cffiles/counties/income_res.cfm5 Health and Human Services. (2005). The 2005 HHS Poverty Guidelines. Retrieved November 29, 2005 from http://aspe.hhs.gov/poverty/05poverty.shtml6 National
2
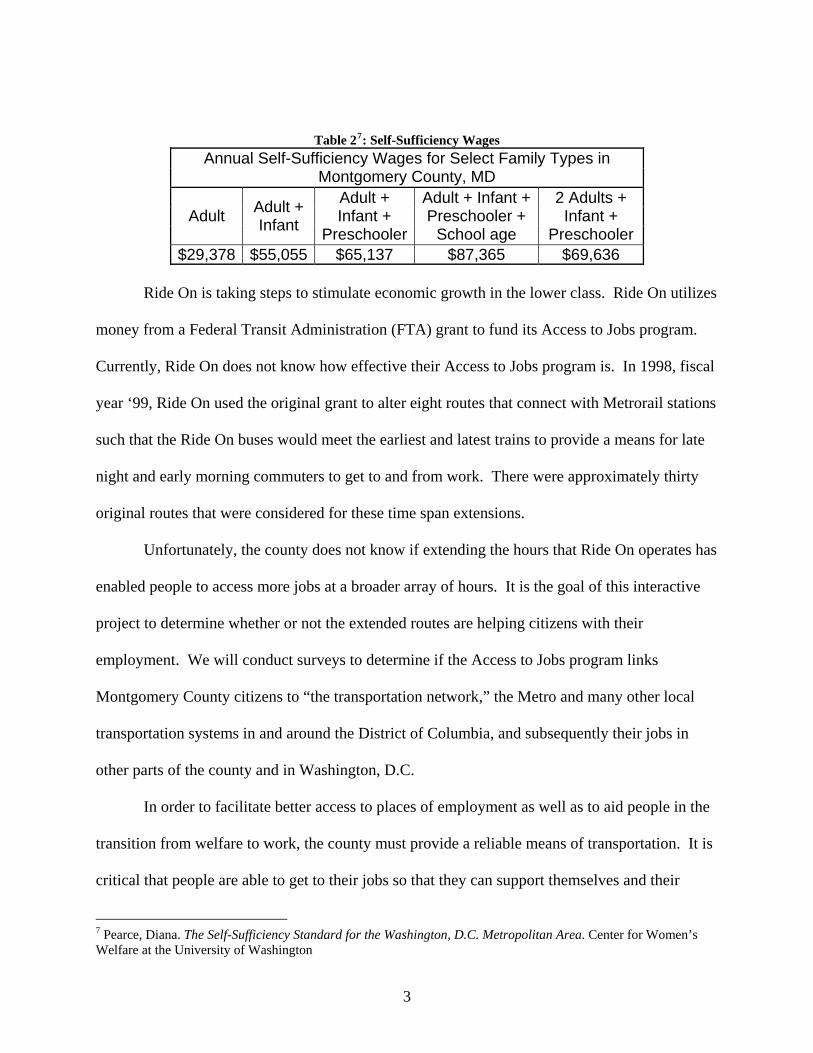
Table 27: Self-Sufficiency Wages Annual Self-Sufficiency Wages for Select Family Types in
Montgomery County, MD
Adult Adult + Infant
Adult + Infant +
Preschooler
Adult + Infant + Preschooler +
School age
2 Adults + Infant +
Preschooler $29,378 $55,055 $65,137 $87,365 $69,636
Ride On is taking steps to stimulate economic growth in the lower class. Ride On utilizes
money from a Federal Transit Administration (FTA) grant to fund its Access to Jobs program.
Currently, Ride On does not know how effective their Access to Jobs program is. In 1998, fiscal
year ‘99, Ride On used the original grant to alter eight routes that connect with Metrorail stations
such that the Ride On buses would meet the earliest and latest trains to provide a means for late
night and early morning commuters to get to and from work. There were approximately thirty
original routes that were considered for these time span extensions.
Unfortunately, the county does not know if extending the hours that Ride On operates has
enabled people to access more jobs at a broader array of hours. It is the goal of this interactive
project to determine whether or not the extended routes are helping citizens with their
employment. We will conduct surveys to determine if the Access to Jobs program links
Montgomery County citizens to “the transportation network,” the Metro and many other local
transportation systems in and around the District of Columbia, and subsequently their jobs in
other parts of the county and in Washington, D.C.
In order to facilitate better access to places of employment as well as to aid people in the
transition from welfare to work, the county must provide a reliable means of transportation. It is
critical that people are able to get to their jobs so that they can support themselves and their
7 Pearce, Diana. The Self-Sufficiency Standard for the Washington, D.C. Metropolitan Area. Center for Women’s Welfare at the University of Washington
3

families without governmental or other aid. This is the goal of the Access to Jobs program.
Through Ride On and other transportation services in the area, the entire metropolitan region is
accessible to everyone. By helping employees gain access to Metro during all of its operating
hours, weekdays from 5am to 12am and weekends from 7am to 3am, the county government has
made employment at all hours attainable, specifically for second and third shift workers, those
who work during the hours of 6pm to 9am.
Through our project research and results, we will assess how well Ride On’s Access to
Jobs program is achieving its goals of getting people, specifically second and third shift workers,
to their places of employment effectively.
4
Background Throughout the world, transportation is critical to people’s livelihood. Even in the day
and age of computers and the internet, transportation is still the backbone of society.
Nevertheless, roads are extremely congested, especially in the Washington, D.C. Metropolitan
area, and in some places rush hour may last for more than seven hours. Public transportation
systems have not met, and cannot meet, the high demands of society. Many cities and
metropolitan areas throughout the country are looking at these problems, and reassessing their
transit systems. While they address congestion they also have a chance to help the under
privileged in the areas they service. By looking at census data, governments have been doing
their best to help citizens commute. Through Access to Jobs programs, local governments are
taking an active role in addressing citizens’ needs.
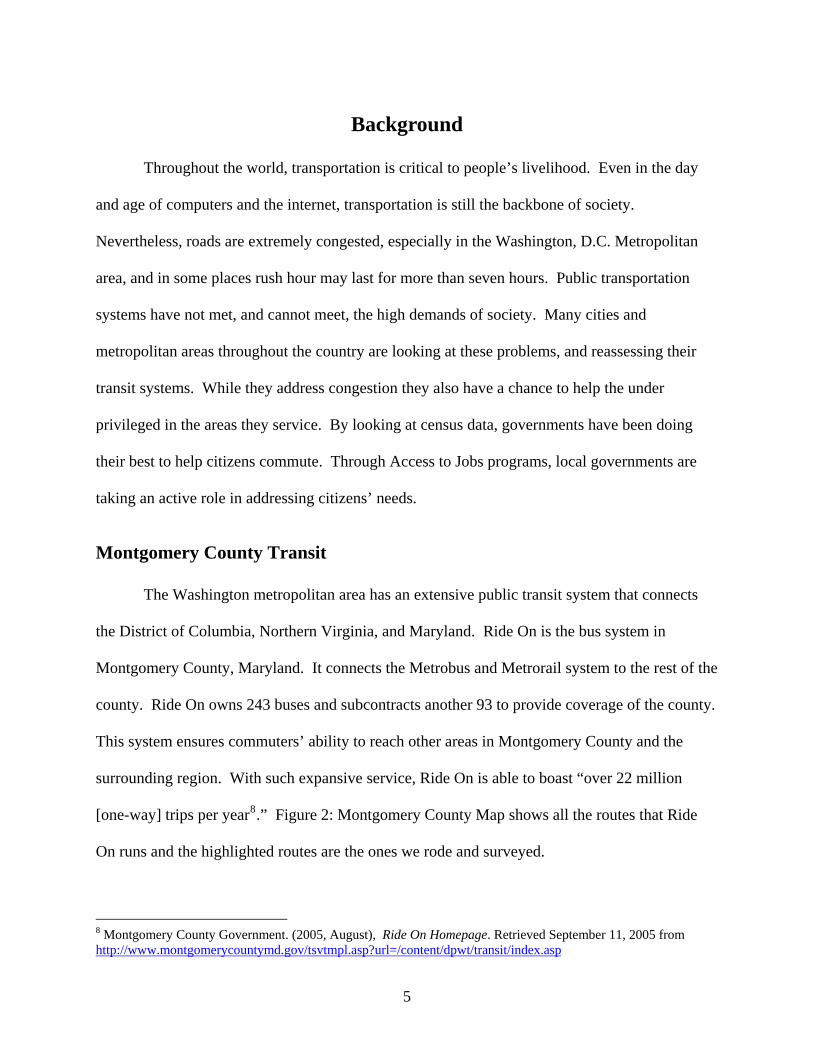
Montgomery County Transit The Washington metropolitan area has an extensive public transit system that connects
the District of Columbia, Northern Virginia, and Maryland. Ride On is the bus system in
Montgomery County, Maryland. It connects the Metrobus and Metrorail system to the rest of the
county. Ride On owns 243 buses and subcontracts another 93 to provide coverage of the county.
This system ensures commuters’ ability to reach other areas in Montgomery County and the
surrounding region. With such expansive service, Ride On is able to boast “over 22 million
[one-way] trips per year8.” Figure 2: Montgomery County Map shows all the routes that Ride
On runs and the highlighted routes are the ones we rode and surveyed.
8 Montgomery County Government. (2005, August), Ride On Homepage. Retrieved September 11, 2005 from http://www.montgomerycountymd.gov/tsvtmpl.asp?url=/content/dpwt/transit/index.asp
5
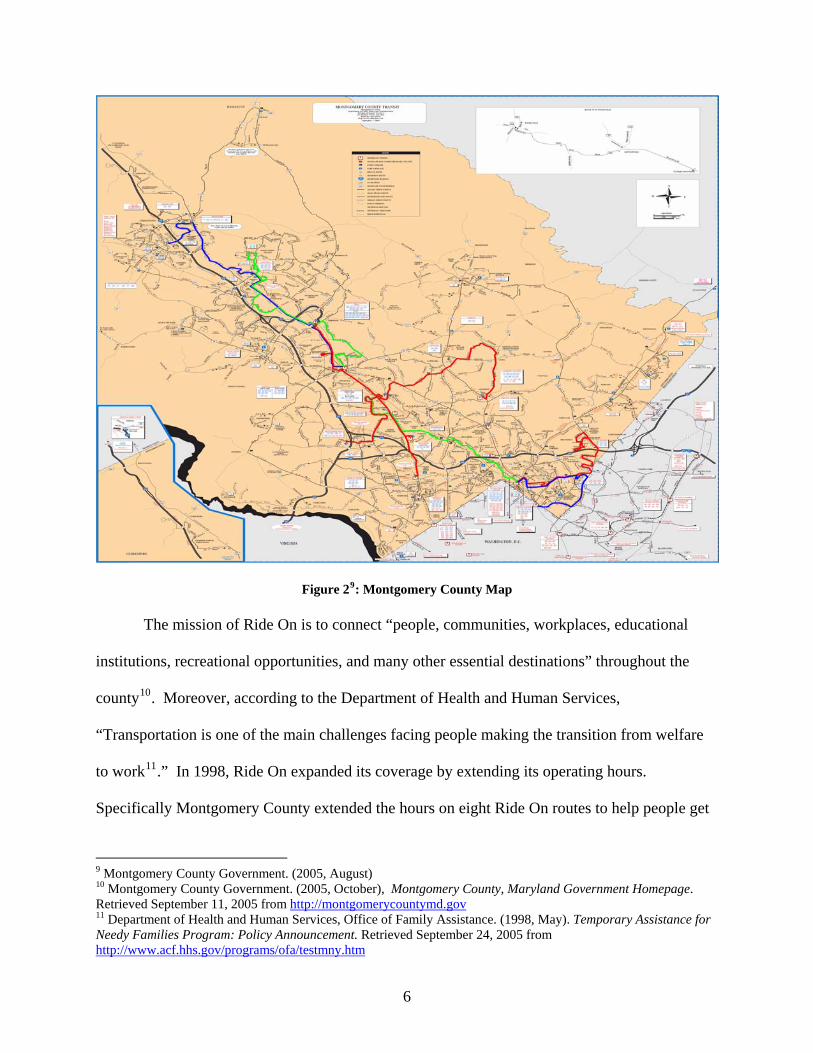
Figure 29: Montgomery County Map The mission of Ride On is to connect “people, communities, workplaces, educational
institutions, recreational opportunities, and many other essential destinations” throughout the
county10. Moreover, according to the Department of Health and Human Services,
“Transportation is one of the main challenges facing people making the transition from welfare
to work11.” In 1998, Ride On expanded its coverage by extending its operating hours.
Specifically Montgomery County extended the hours on eight Ride On routes to help people get
9 Montgomery County Government. (2005, August) 10 Montgomery County Government. (2005, October), Montgomery County, Maryland Government Homepage. Retrieved September 11, 2005 from http://montgomerycountymd.gov11 Department of Health and Human Services, Office of Family Assistance. (1998, May). Temporary Assistance for Needy Families Program: Policy Announcement. Retrieved September 24, 2005 from http://www.acf.hhs.gov/programs/ofa/testmny.htm
6
to and keep their jobs12. It funded the Access to Jobs program from an FTA grant. The funding
used for this program was originally and still is a line item in the FTA budget. Ride On annually
receives approximately $604,000. Originally, Ride On matched this money, however currently it
is overmatched.
The Ride On routes that we will focus on are the 5, 16, 20, 26, 46, 55, and 59. We will
not be riding any route 12 trips due to the amount of time we have in which to complete our
project. In addition, route 12 has the same starting and ending points as route 16. For these
reasons, we chose not to ride any route 12 trips. Similar to many routes operated by Ride On, all
seven of these terminate at a minimum of one Metrorail station. Three of the seven routes we are
looking at are based out of the Rockville Metro station, another three are based out of the Silver
Spring Metro station, while the seventh is based out of the Glenmont Metro Station. Route 5
runs east-west across the county connecting the Twinbrook and Silver Spring Metro stations.
Route 16 follows the east branch of the Metro’s Redline and has terminal stops at the Silver
Spring and Takoma Metro stations. Connecting the Silver Spring Metro station to the Hillandale
Shopping Center, located northeast of the Metro stop, is route 20. Route 26 runs cross-county,
connecting Montgomery Mall, located in Bethesda, Maryland, with the last stop on the east
branch of the Metro’s Red line, Glenmont. Route 46 follows Rockville Pike, a major north-south
thoroughfare running the entire span of Montgomery County, ending at Montgomery College
and the Medical Center Metro station. Routes 55 and 59 share a terminal station at Rockville,
however, route 55 runs to Montgomery Village Center in Gaithersburg, Maryland, while route 59
runs farther northwest to the Germantown Transit Center in Germantown, Maryland.
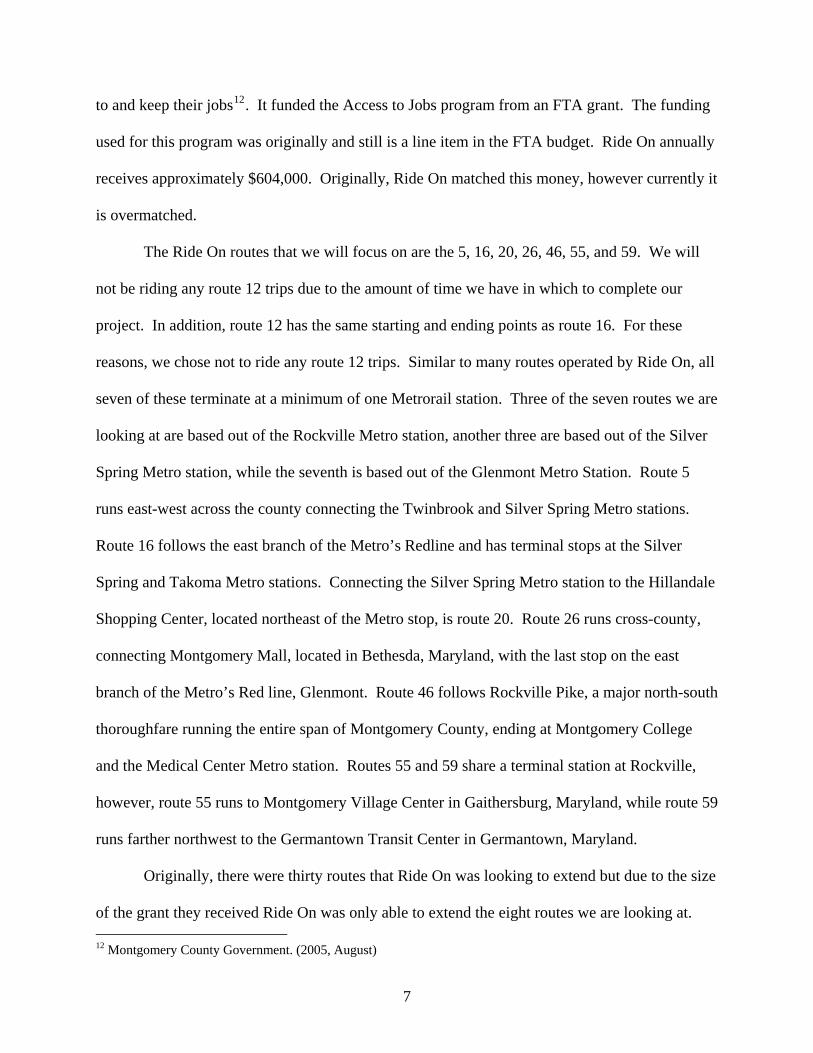
Originally, there were thirty routes that Ride On was looking to extend but due to the size
of the grant they received Ride On was only able to extend the eight routes we are looking at. 12 Montgomery County Government. (2005, August)
7
The original thirty were chosen because they go through Temporary Assistance for Needy
Family (TANF) neighborhoods. Of the original thirty routes, eight were chosen because at the
time those were the ones that were “most likely to succeed.” Table 3: Suggested Original Routes
shows the other twenty-two routes and the change that Ride On wanted to make. “Longer peak
hours” refer to rush hour lasting longer. “Reverse Commute” refers to adding bus trips that help
commuters that live in the city and work outside of it. “More Midday Service” is adding more
trips between rush hours.
Table 3: Suggested Original Routes Other 22
Route Change 6 Longer Peak Hours
13 Longer Peak Hours 19 Reverse Commute 22 Longer Peak Hours 24 Reverse Commute 32 Longer Peak Hours 33 Longer Peak Hours 37 Longer Peak Hours 39 Reverse Commute 44 Longer Peak Hours 52 Longer Peak Hours 53 Longer Peak Hours 60 Reverse Commute 65 Reverse Commute 70 Longer Peak Hours 71 Reverse Commute 72 Reverse Commute 73 Longer Peak Hours 74 Longer Peak Hours 75 Longer Peak Hours 77 Longer Peak Hours 90 More Midday Service
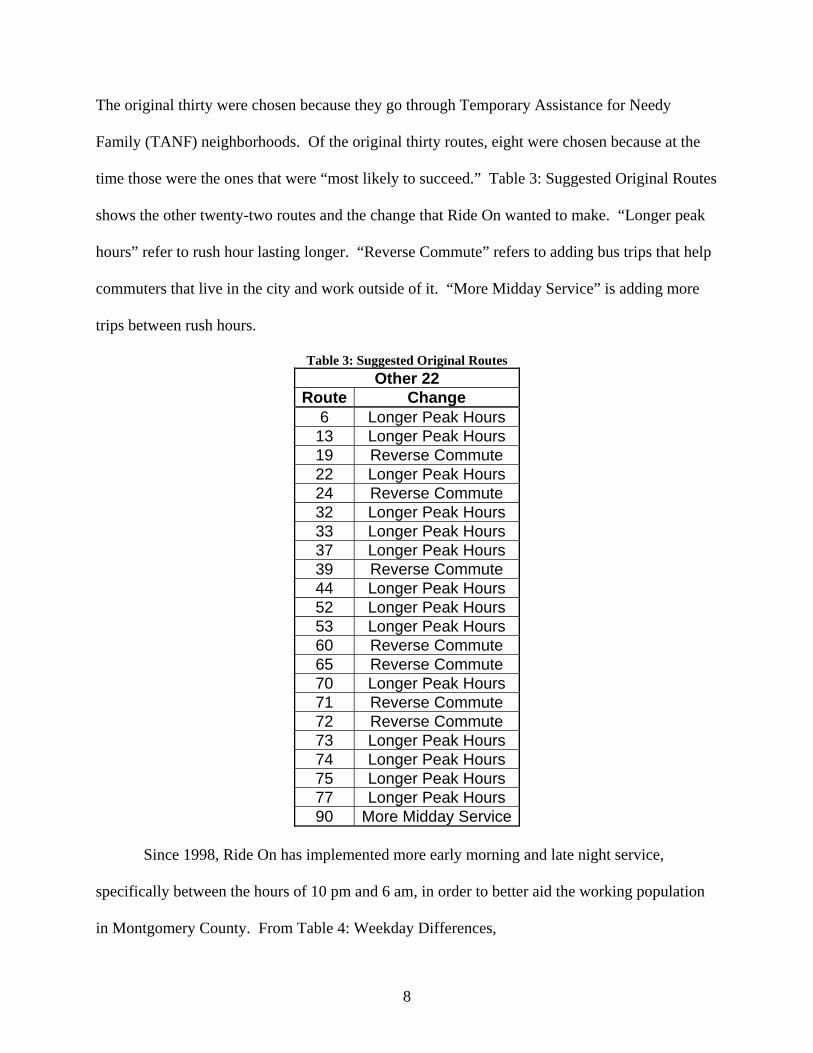
Since 1998, Ride On has implemented more early morning and late night service,
specifically between the hours of 10 pm and 6 am, in order to better aid the working population
in Montgomery County. From Table 4: Weekday Differences,
8
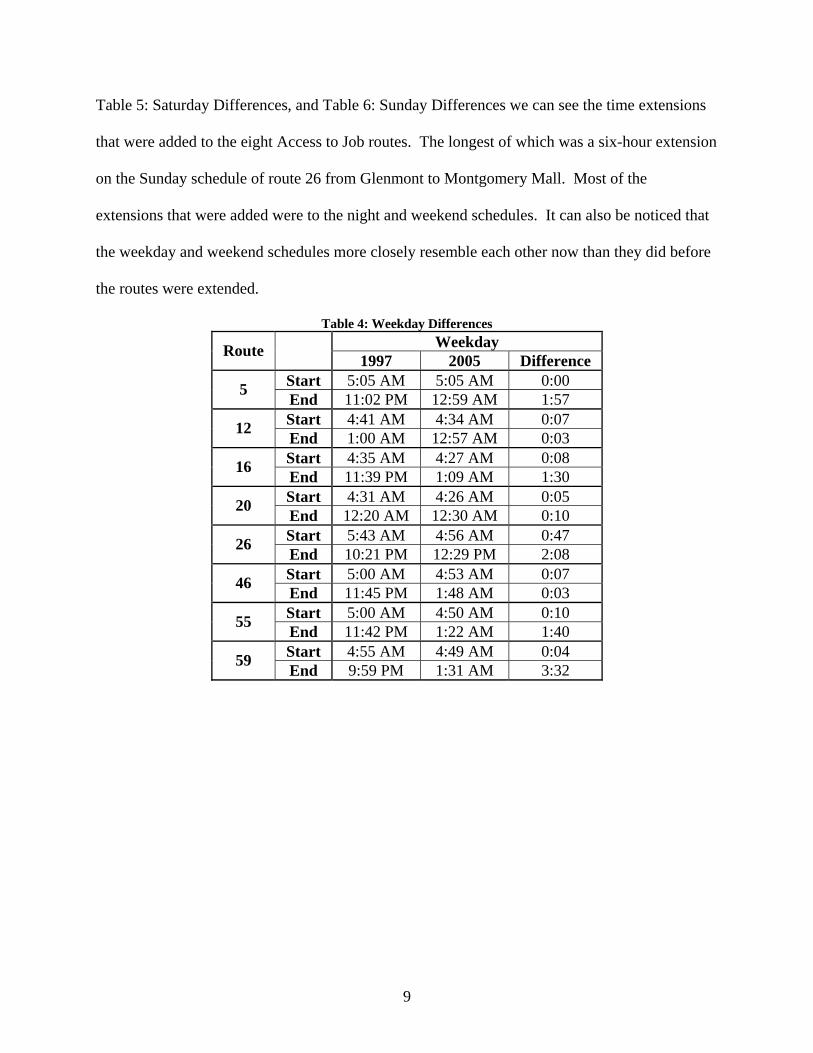
Table 5: Saturday Differences, and Table 6: Sunday Differences we can see the time extensions
that were added to the eight Access to Job routes. The longest of which was a six-hour extension
on the Sunday schedule of route 26 from Glenmont to Montgomery Mall. Most of the
extensions that were added were to the night and weekend schedules. It can also be noticed that
the weekday and weekend schedules more closely resemble each other now than they did before
the routes were extended.
Table 4: Weekday Differences Weekday Route 1997 2005 Difference
Start 5:05 AM 5:05 AM 0:00 5 End 11:02 PM 12:59 AM 1:57 Start 4:41 AM 4:34 AM 0:07 12 End 1:00 AM 12:57 AM 0:03 Start 4:35 AM 4:27 AM 0:08 16 End 11:39 PM 1:09 AM 1:30 Start 4:31 AM 4:26 AM 0:05 20 End 12:20 AM 12:30 AM 0:10 Start 5:43 AM 4:56 AM 0:47 26 End 10:21 PM 12:29 PM 2:08 Start 5:00 AM 4:53 AM 0:07 46 End 11:45 PM 1:48 AM 0:03 Start 5:00 AM 4:50 AM 0:10 55 End 11:42 PM 1:22 AM 1:40 Start 4:55 AM 4:49 AM 0:04 59 End 9:59 PM 1:31 AM 3:32
9
Table 5: Saturday Differences Saturday Route 1997 2005 Difference
Start 6:00 AM 5:30 AM 0:30 5 End 8:13 PM 12:58 AM 4:45 Start 6:14 AM 5:00 AM 1:14 12 End 11:37 PM 12:52 AM 1:25 Start 6:45 AM 5:01 AM 1:44 16 End 10:40 PM 1:12 AM 2:32 Start 5:05 AM 5:00 AM 0:05 20 End 10:50 PM 12:55 AM 2:05 Start 7:15 AM 5:17 AM 1:58 26 End 8:27 PM 1:00 AM 4:33 Start 5:40 AM 5:09 AM 0:31 46 End 12:02 AM 1:07 AM 1:05 Start 6:06 AM 5:00 AM 1:06 55 End 11:20 PM 12:42 AM 1:22 Start 6:14 AM 5:17 AM 0:57 59 End 9:04 PM 12:25 AM 3:21
Table 6: Sunday Differences
Sunday Route 1997 2005 Difference Start 6:32 AM 5:33 AM 1:01 5 End 7:13 PM 12:58 AM 5:45 Start 6:25 AM 5:26 AM 0:59 12 End 11:17 PM 12:49 AM 1:32 Start 7:47 AM 5:17 AM 2:30 16 End 9:12 PM 12:53 AM 3:41 Start 6:00 AM 5:00 AM 1:00 20 End 8:22 PM 12:52 AM 4:30 Start 7:43 AM 5:17 AM 2:26 26 End 7:01 PM 12:59 AM 5:58 Start 5:46 AM 5:05 AM 0:41 46 End 11:05 PM 12:41 AM 1:36 Start 7:26 AM 5:30 AM 1:56 55 End 7:43 PM 12:43 AM 5:00 Start 6:07 AM 5:30 AM 0:37 59 End 9:02 PM 1:06 AM 4:04
Through the coalition of Ride On, Access to Jobs, and the FTA, Montgomery County is
evaluating the needs of its citizens and taking steps to address those needs.
10
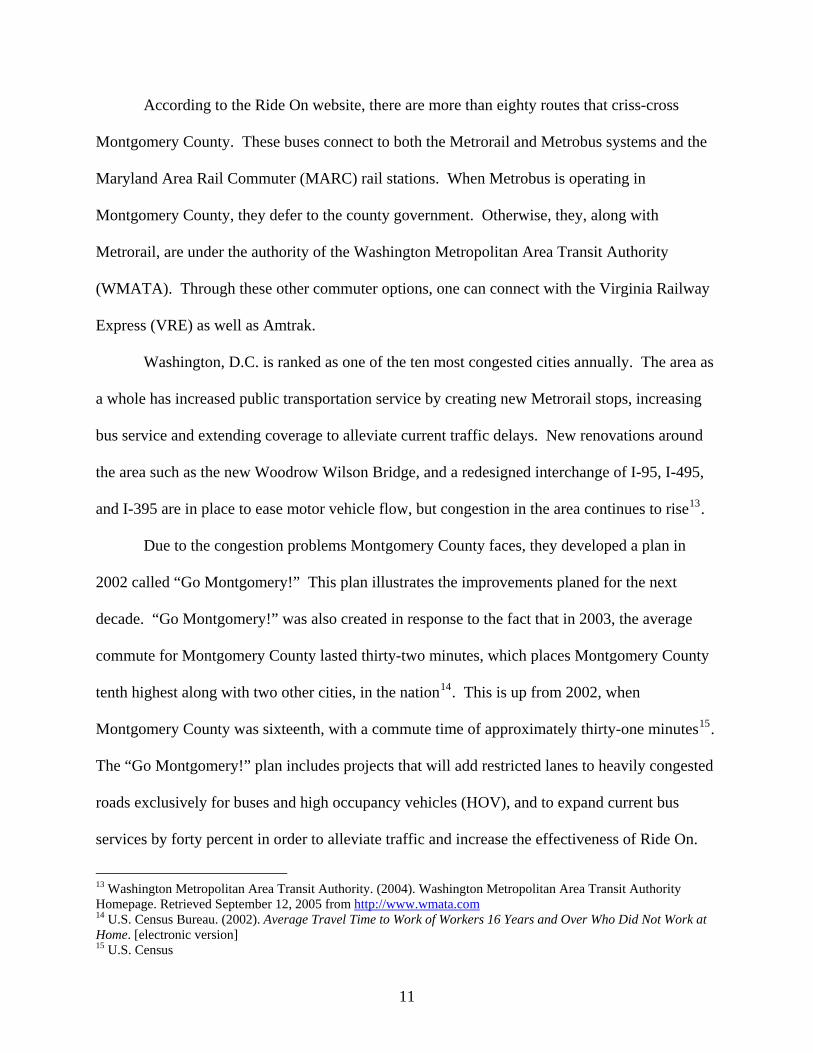
According to the Ride On website, there are more than eighty routes that criss-cross
Montgomery County. These buses connect to both the Metrorail and Metrobus systems and the
Maryland Area Rail Commuter (MARC) rail stations. When Metrobus is operating in
Montgomery County, they defer to the county government. Otherwise, they, along with
Metrorail, are under the authority of the Washington Metropolitan Area Transit Authority
(WMATA). Through these other commuter options, one can connect with the Virginia Railway
Express (VRE) as well as Amtrak.
Washington, D.C. is ranked as one of the ten most congested cities annually. The area as
a whole has increased public transportation service by creating new Metrorail stops, increasing
bus service and extending coverage to alleviate current traffic delays. New renovations around
the area such as the new Woodrow Wilson Bridge, and a redesigned interchange of I-95, I-495,
and I-395 are in place to ease motor vehicle flow, but congestion in the area continues to rise13.
Due to the congestion problems Montgomery County faces, they developed a plan in
2002 called “Go Montgomery!” This plan illustrates the improvements planed for the next
decade. “Go Montgomery!” was also created in response to the fact that in 2003, the average
commute for Montgomery County lasted thirty-two minutes, which places Montgomery County
tenth highest along with two other cities, in the nation14. This is up from 2002, when
Montgomery County was sixteenth, with a commute time of approximately thirty-one minutes15.
The “Go Montgomery!” plan includes projects that will add restricted lanes to heavily congested
roads exclusively for buses and high occupancy vehicles (HOV), and to expand current bus
services by forty percent in order to alleviate traffic and increase the effectiveness of Ride On.
13 Washington Metropolitan Area Transit Authority. (2004). Washington Metropolitan Area Transit Authority Homepage. Retrieved September 12, 2005 from http://www.wmata.com14 U.S. Census Bureau. (2002). Average Travel Time to Work of Workers 16 Years and Over Who Did Not Work at Home. [electronic version]15 U.S. Census
11
Temporary Assistance for Needy Families (TANF) Program
The Temporary Assistance for Needy Families (TANF) program was created in 1996 as
part of the Personal Responsibility and Work Opportunity Reconciliation Act passed by
Congress16. This replaced the Aid to Families with Dependent Children (AFDC), the Job
Opportunities and Basic Skills Training (JOBS), and the Emergency Assistance (EA) programs17
18. The AFDC supported low-income families and organizations from 1935 to 1996. TANF is a
block grant where states and tribes are allocated federal funds to cover benefits, administrative
expenses, and services to needy families19 20. A block grant is an amount of money allocated for
a social services project. These projects include activities such as helping families, children, and
care for the elderly. Each state is allotted a set amount of funding based on a predetermined
formula and the specific program in question.
Currently all eight of the Access to Jobs route run through areas where TANF families
reside. Figure 3 shows how many TANF cases reside in three areas of Montgomery County.
16 Coven, Martha. (2003, October). An Introduction To TANF. Retrieved September 20, 2005 from http://www.cbpp.org/1-22-02tanf2.htm17 Coven 18 Department of Health and Human Services. (2005, August). Office of Family Assistance Homepage. Retrieved September 24, 2005 from http://www.acf.hhs.gov/opa/fact_sheets/tanf_factsheet.html19 Department of Health and Human Services. (2005, August) 20 House Ways and Means. (2000). Green Book: Social Services Block Grant. Retrieved October 10, 2005 from http://www.policyalmanac.org/social_welfare/archive/ssbg.shtml
12

Figure 3: TANF Map The yellow area is Germantown, which has 235 TANF cases, red is Rockville which has 215
cases, and the dark blue is the Silver Spring which has 238 cases. Currently in Montgomery
County, there are 688 TANF cases.
Any funding distributed through the TANF program must be allocated to fulfill one of
four purposes. A portion of the TANF funding must be spent on transportation because one of
the purposes is to “end the dependence of needy parents on government benefits by promoting
job preparation, work, and marriage21.” Although throughout the United States, only two
21 Coven
13
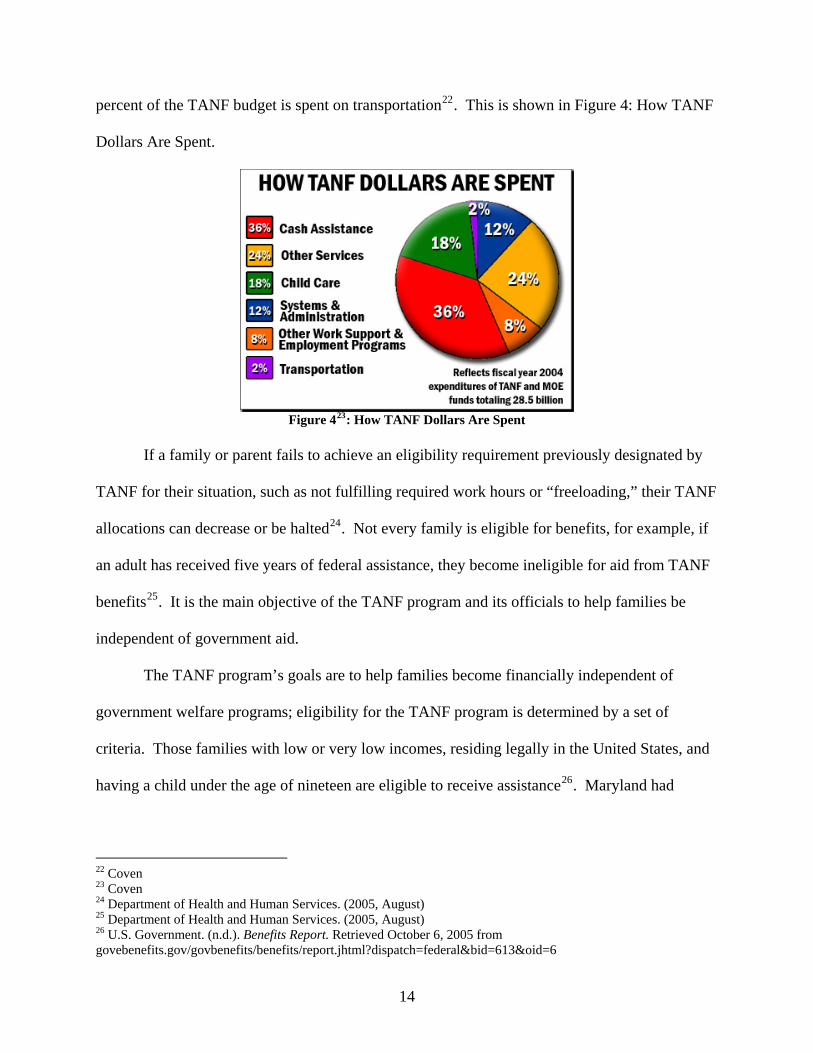
percent of the TANF budget is spent on transportation22. This is shown in Figure 4: How TANF
Dollars Are Spent.
Figure 423: How TANF Dollars Are Spent
If a family or parent fails to achieve an eligibility requirement previously designated by
TANF for their situation, such as not fulfilling required work hours or “freeloading,” their TANF
allocations can decrease or be halted24. Not every family is eligible for benefits, for example, if
an adult has received five years of federal assistance, they become ineligible for aid from TANF
benefits25. It is the main objective of the TANF program and its officials to help families be
independent of government aid.
The TANF program’s goals are to help families become financially independent of
government welfare programs; eligibility for the TANF program is determined by a set of
criteria. Those families with low or very low incomes, residing legally in the United States, and
having a child under the age of nineteen are eligible to receive assistance26. Maryland had
22 Coven 23 Coven 24 Department of Health and Human Services. (2005, August) 25 Department of Health and Human Services. (2005, August) 26 U.S. Government. (n.d.). Benefits Report. Retrieved October 6, 2005 from govebenefits.gov/govbenefits/benefits/report.jhtml?dispatch=federal&bid=613&oid=6
14
59,362 TANF recipients in the 2004 Fiscal Year; the United States had 4,784,042 recipients 27.
In the 2003 fiscal year, Maryland had fewer than four percent of families receiving funding from
TANF for more than five years as compared to less than two percent, which is the national
percentage28.
History of Urban Planning
Transportation service problems exist in every metropolitan area. There is no way to
eliminate these problems, only to lessen their effects. Congestion, a mounting problem, is
something must be lived with. There is no way to build enough roads to end congestion. This
problem is discussed in John Dickey's book, Metropolitan Transportation Planning29. Other
problems associated with transit systems in large metropolitan areas include inadequate capacity
and a high user cost. Along with these potential problems, Dickey suggests a ten step problem-
solving process that may be very beneficial to our group during this project. The process begins
with identifying the problem as precisely as possible. Next is setting goals and hypothesizing
where and why the problem developed. Data collection and the development of a model of the
problems follow and evaluation of possible solutions is step six, with one of the possible
solutions always being if "no changes are made." Finishing the ten steps are modifying,
planning and implementation of the best solution30. This process is what we plan on following
during the course of our project.
27 Department of Health and Human Services. (2005). Office of Family Assistance: Temporary Assistance to Needy Families; Separate State Program- Maintenance of Effort; Aid to Families with Dependant Children. Caseload Data. [Electronic Version] 28 Department of Health and Human Services. (2005, October). Office of Family Assistance: TANF Federal Five-Year Time Limit; Fiscal Year 2003. [Electronic Version] 29 Dickey, John W. Metropolitan Transportation Planning (2nd ed). New York: Hemisphere, 1983. 30 Dickey
15

Sigurd Grava brings up many good points in his text Urban Transportation Systems.
Here Grava elaborates on not only the effectiveness of buses but on their importance to a multi-
model system. He discusses how buses are the backbone of any mass transit system. In
Montgomery County, Ride On is the bus system that is the backbone of the public transportation
system. Ride On connects with the Washington, D.C. Metro system, the MARC train system, as
well as the MTA bus system. Our project is looking specifically at how well the Ride On system
moves people into the transportation network. Buses are cost effective and have the potential to
open new job opportunities, where they previously would not have existed or been available to
everyone, by making these areas more accessible to the population31.
Peter Newman and Jeffrey Kenworthy suggest that wealth has a direct correlation to
automobile usage in their text Sustainability and Cities 32. This has not been shown to be
entirely true but those who are wealthy enough to afford a car will typically use one. By making,
this assumption we can also form the compliment assumption that those who cannot afford a car
will rely heavily on public transportation. We want to know why people are using the bus during
these odd hours. Possible reasons include they do not own a car or they do not want to use their
car. Most of all we are concerned with getting odd hour workers into the larger transportation
network and whether Ride On is taking the riders needs into consideration when proposing new
services.
Other Metropolitan Area Bus Systems The Worcester Regional Transit Authority (WRTA) recently finished a comprehensive
redesign study of its bus system. Effective January 2006, bus routes with the least activity will
31 Grava, Sigurd. Urban Transportation Systems: Choices for Communities. New York: McGraw-Hill, 2003. 32 Newman, Peter & Jeffrey Kenworthy. Sustainability and Cities: Overcoming Automobile Dependence. Washington D.C.: Island Press, 1999.
16
be changed in order to maximize service to areas that need bus service the most: low-income
areas and places of business. This study was used to create a five-year transportation plan for
Worcester and its surrounding areas. Surveys were given to citizens who ride the WRTA buses
throughout Worcester, with such key questions as “how many transfers does it take to get to your
destination?”, “what are your typical destinations?”, and “what is the purpose of your trip?”
There is also general information regarding transportation in and around Worcester33.
Los Angeles currently has short and long-range plans for its transportation system that
address their average commute time of 28.5 minutes34 35. Currently their buses service over
1,400 square miles daily, and assist 1.4 million riders in getting to and from work daily36. Plans
are in place to improve the reliability and to expand the current service37. Los Angeles is hoping
that this, in collaboration with extending their rail lines, improving highways, introducing more
High Occupancy Vehicle (HOV) lanes and other improvements will decrease congestion, and
help their citizens get to and from work38.
Transportation Assessment Companies Urbitran is a company that offers planning services. They evaluate transportation
systems such as bus and multi-modal systems, and perform traffic engineering, transportation
modeling, and planning projects. Urbitran conducted the study for the Worcester Regional
Transit Authority’s bus system refurbishment. They have conducted similar studies in other
33 Worcester Regional Transit Authority. (2005, March). Worcester Regional Transit Authority. Retrieved September 13, 2005 from http://therta.com34 Los Angeles County Metropolitan Transportation Authority. (2005). Transit Services and Information for Los Angeles County. Retrieved September 25, 2005 from http://www.mta.net/default.asp35 U.S. Census Bureau. (2002). Average Travel Time to Work of Workers 16 Years and Over Who Did Not Work at Home. [electronic version]36 Los Angeles 37 Los Angeles 38 Los Angeles
17

metropolitan areas such as New York City, Nashville, and for the Maryland Mass Transit
Administration39.
One of Urbitran’s clients was the New York City Department of Transportation (NYC
DOT). Urbitran performed a study of bus operators, and “…is providing [the] New York City
Department of Transportation with a comprehensive review and analysis of its local and express
network40.” Urbitran conducted these studies by sampling riders on all of the buses in which
NYC DOT was concerned. They use this data in collaboration with background research to give
recommendations about routes and to improve service to the riders.
Urbitran has also consulted for New Jersey Transit. The studies were conducted for
multiple counties concerned with the Work First New Jersey program. Work First New Jersey is
New Jersey’s version of the Access to Jobs program, and is funded by the TANF program.
Urbitran helped New Jersey Transit assess where bus routes should be to aid welfare families in
their everyday lives.
Currently, major cities across the nation have been focusing on improving their
transportation systems throughout their communities. Suburbs such as Montgomery County are
expanding and with this comes an increasing demand for public transportation. Some cities and
suburbs have chosen to focus on expanding old and building new roads, while others have
chosen to re-examine and reroute their mass transit systems. Montgomery County is doing both.
Much of what has been done was initiated because of the growing needs of low-income families,
specifically their transportation needs. Government agencies are trying to not only help the
average citizen, but also those most in need and get this section of the population where they
39 Los Angeles 40 Urbitran. (2003). Urbitran Homepage. Retrieved September 13, 2005 from http://63.240.68.126/~urbitran.com/index.cfm
18

need to be effectively and efficiently. Improving the effectiveness of bus and transit systems
allows people mobility and with that, new and better opportunities.
19

Development of Procedures
In order to evaluate whether people’s jobs are dependent upon the Ride On extensions we
will utilize a survey to collect the information we are interested in. By surveying the riders, we
will be able to determine whether Ride On is successful in getting people to and from work. The
focus of our study will be seven of the original eight routes that were extended in 1998. Route
12 was omitted because it was only extended on the weekends, and due to time constraints, we
were unable to survey this route. Maps of these routes are located in Appendix A: Ride On
Routes. In addition, much of our project deals with personal situations and Ride On’s level of
effectiveness for individual citizens. Therefore, it will be to our advantage to survey riders on
these bus routes as their personal narratives and opinions will matter greatly to our study.
The Survey
We will use past surveys in collaboration with background research, to determine what
types of questions to ask and the most appropriate wording of these questions to obtain the
information we wish to gather. Inoffensive questions need to be developed in order to obtain the
best results. Additionally, to ensure consistency between our survey and Ride On’s past surveys,
we will look over and utilize some of their past questions on our survey. This will enable Ride
On to possibly use this data in conjunction with future surveys to examine trends.
After looking at previous studies of transit systems, we have found a collection of
potential questions for our survey. The main hurdle is diction; we need to word our questions in
such a way as to obtain meaningful responses while not offending people due to the particularity
of the questions. The hardest questions to word will be those dealing with the respondent’s
household income or job specifications. Personal income is a private matter that may cause our
20

response rate to decrease. To obtain a maximum number of useable responses, we will ask
potentially offensive questions towards the end of the survey to gather as much data as we can.
Figure 5: Survey Questions from the WRTA Survey shows a selection of survey questions
developed for the Worcester Regional Transit Authority, which will help serve as a guide for our
study:
1. In a typical week on how many days do you use WRTA? 7 6 5 4 3 2 1 less than 1 2. How many times do you have to transfer to get to where you are going on this trip?
(counting ones you already made) 0 1 3. What is the zip code at your home? _____________________ 4. What is your total household income? less than $10,000 $10,000 – $14,999 $15,000 – $19,999 $20,000 – $24,999 $25,000 – $34,999 $35,000 – $49,000 $50,000 – $74,000 $75,000 – $100,000 more than $100,000 5. Which of the following applies to you? employed for pay outside your home (if so, answer questions a-j below) employed for pay inside your home student homemaker not employed because of disability retired unemployed 5a. How many days do you work at this job? 1 2 3 4 5 6 7 5b. Do you work on Saturday? yes no 5c. Do you work on Sunday? yes no 5d. How many days a week do you take the bus to work? 0 1 2 3 4 5 6 7 5e. What is the zip code of your place of work? __________ 5f. Most days, what time does your job start? __________ AM or PM? 5g. Most days, what time do you leave work? __________ AM or PM? 5h. Which is the closest to the amount you earn per hour before taxes are taken out? $6 $7 $10 $12 $15 $20 more than $20 5h. Which is the closest to the number of hours per week you work at this job? less than 10 10 20 30 40 more than 40 5j. In the past year, about how many months have you been employed? 12 11 10 9 8 7 6 5 4 3 2 1 0
Figure 541: Survey Questions from the WRTA Survey
Surveying will be most beneficial to our project because we are focusing around the
following research problem: are the extensions of the Ride On lines succeeding in helping late
night and early morning workers get to and from work?
41 Worcester
21
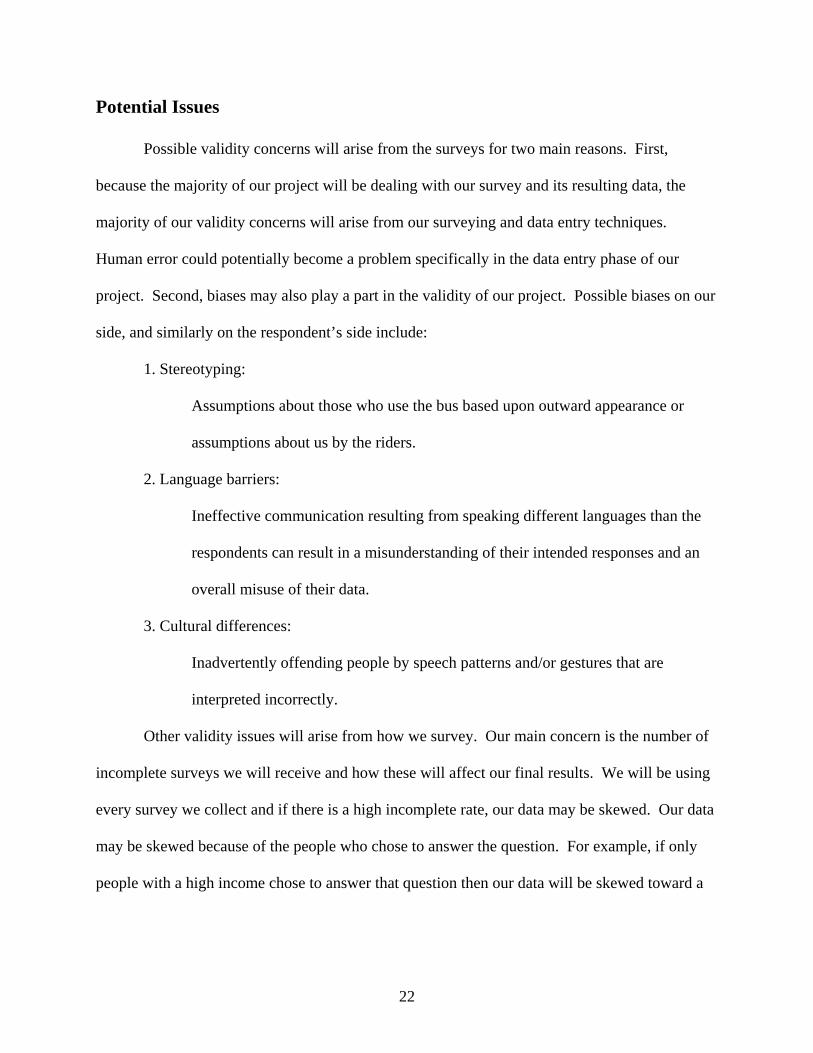
Potential Issues Possible validity concerns will arise from the surveys for two main reasons. First,
because the majority of our project will be dealing with our survey and its resulting data, the
majority of our validity concerns will arise from our surveying and data entry techniques.
Human error could potentially become a problem specifically in the data entry phase of our
project. Second, biases may also play a part in the validity of our project. Possible biases on our
side, and similarly on the respondent’s side include:
1. Stereotyping:
Assumptions about those who use the bus based upon outward appearance or
assumptions about us by the riders.
2. Language barriers:
Ineffective communication resulting from speaking different languages than the
respondents can result in a misunderstanding of their intended responses and an
overall misuse of their data.
3. Cultural differences:
Inadvertently offending people by speech patterns and/or gestures that are
interpreted incorrectly.
Other validity issues will arise from how we survey. Our main concern is the number of
incomplete surveys we will receive and how these will affect our final results. We will be using
every survey we collect and if there is a high incomplete rate, our data may be skewed. Our data
may be skewed because of the people who chose to answer the question. For example, if only
people with a high income chose to answer that question then our data will be skewed toward a
22
higher average household income. Similarly, we will not have a one hundred percent response
rate and our data may be skewed for this reason.
To alleviate the impact of offensive questions and other validity issues, we will try out
our survey on a test group. This test group will provide us a way to gauge the response rate and
show us how we need to tailor the survey and our behavior in order to obtain the most responses.
Survey Analysis Once we have collected the data, we need to analyze it so that we can fulfill our project
objectives. We will assign numerical values for each response of each question. By coding the
data in this way, we can present tallied responses to questions to preserve the context from which
we gathered data. We will also be able to use Microsoft Access to associate the responses we get
back. This will allow us to look at the survey as a whole rather than at the individual responses.
The results of the surveys will allow us to determine whether bus routes are succeeding in
transporting people to their places of employment. The surveys will focus on whether people
would still have their jobs if the bus system were not readily available to them. It will also cover
whether Montgomery County citizens would have access to better jobs or working hours if the
routes went to other places or were at different times.
While there are potential problems in our project, it is our goal, by using a survey to
obtain data in evaluating Ride On’s overall effectiveness as it relates to the Access to Jobs
extensions to minimize their effects. Effectiveness will be determined by many different
variables such as purpose of trip, number of transfers, and the necessity of the service. We plan
to address validity concerns early in our project, though we understand that they cannot be
removed entirely. Throughout our project, we will remain conscientious of validity issues and
take actions to minimize their impact upon the project as a whole.
23
Survey Development We developed this survey, however, it was inspired by questions appearing on a recent
Worcester Regional Transit Administration bus survey as seen in Figure 5: Survey Questions
from the WRTA Survey. Upon arriving in Montgomery County, a meeting was arranged to go
over the questions on our survey. Ride On wanted to ensure that our survey would yield
responses that would aid in determining the success of their Access to Jobs program.
Representatives from the marketing department, who were familiar with past Ride On surveys
and surveying in general, as well as employees of the Division of Transit Services were present
to lend their expertise. Wording was the main topic in the meeting because Ride On wanted a
survey that would not only assess their Access to Jobs program, but would also generate
responses that would be comparable to surveys done in the past. Each proposed question was
scrutinized and the resulting survey was viewed as complete.
During the meeting, Ride On requested that our survey would incorporate certain aspects
of past surveys to ensure riders’ familiarity with the forms. The majority of questions that dealt
with work or with numbers of transfers or trips mimicked past Ride On surveys. Specifically
income brackets and alternate modes of transportation were copied from previous Ride On
surveys. The Ride On surveys that we used to format our questions were the 2004 customer
satisfaction survey and a pervious Access to Jobs survey. Both of these past Ride On surveys are
available in Appendix B: Past Ride On Surveys.
Once the changes to our original survey were finalized, the next step was to determine
what physical form the survey should take. It was determined that the main limiting factor of our
survey would be time. In order for riders to be able to complete the entire survey, we limited the
survey to one side of standard eight and a half by eleven-inch sheet of paper. In order to do this
24
and still fit all the necessary questions, we manipulated the text size of the questions and
responses. We printed the questions in a larger, bolder font than the responses to make them
easier to read on the dimly lit buses. Also by limiting the survey to one side allowed for a
Spanish copy of the survey to be printed on the reverse side. By printing the survey in both
English and Spanish, we hoped to give the majority of riders a copy of the survey in a language
they understood and could read. According to a past Ride On customer satisfaction survey, the
majority of riders speak English, while the second most populous language represented is
Spanish, which represents 20.8% of riders42. The lack of hard surfaces to write on also came
into play when deciding how to print up our survey. For this reason we had the survey printed
on thick paper so it would be easier to fill out on the bus. A copy of both our English and
Spanish survey is in Appendix C: Our Survey.
42 National
25

Test Group In order to get a feel for the way we would survey these buses we decided it would be
best to utilize a test group. A test group is a group, in this case of riders on certain bus trips,
whose results are not added to the final data. These are extra trips for our benefit only. We
decided to ride a bus on two of the seven routes we are studying, one evening trip and one
morning trip. We decided upon a route 26 bus for our night trip and a route 47 bus for our
morning trip because of when these buses started. The times were within the window we were
studying, after 10 pm and before 6 am. Since route 26 does not travel by our office in Rockville,
Maryland, we rode route 47 from Rockville to Montgomery Mall Transit Center where route 26
would begin its trip.
We surveyed the route 47 trip to practice asking riders to take our survey before we rode
the route 26 and 55 buses. On the route 47 bus, there were four riders, all of which were willing
to take the survey. Upon arriving at the Montgomery Mall Transit Center, we saw a number of
people waiting for the bus and thought that it would be beneficial to begin surveying before the
bus arrived. Once we got on the bus, we realized that this was to our disadvantage, as we would
not remember whom we had previously asked. On the route 26 bus trip, there were fifty-three
riders, twenty-five of which were willing to take our survey. The following morning, we
surveyed a route 55 bus trip that originated in Rockville and went to the Germantown Transit
Center. There were forty-seven riders and twenty-two filled out surveys on this bus trip.
We encountered some problems during the execution of our test group. One problem
was that riders had to stand because seats were unavailable. Another problem was that we could
not approach people when they were on cell phone.
26
Our test group greatly helped us form the method in which we would conduct this survey.
We found that it would be most beneficial to designate one person to the front and one to the
back of the bus. These surveyors would ask riders to participate and they would hand out the
surveys along with golf pencils. From our test group we found that asking people individually
once they sat down rather than as they stepped onto the bus would help increase our response
rate because it would be more personal. Also by dividing the bus between surveyors, it helped
us from asking people to take the survey more than once. The third person would sit in the
middle of the bus and collect the surveys in an envelope specifically for that day, route, and trip.
This third person would also keep track of the total number of people on the bus for that trip.
We knew before we started surveying that a number of Ride On passengers would not
speak English. After passing out surveys, we realized that we would need to communicate with
people who spoke Spanish. By stating, “yo no hablo español,” I do not speak Spanish, and
“Gracias,” thank you, people who speak Spanish would be less suspicious of us, and generally
more at ease and open to taking and filling out a survey.
After surveying three separate trips we felt more confident with the routine, especially
how to approach riders and ask them to fill out a survey. We identified two questions that
needed to be reworded and learned a few Spanish phrases. Also from the number of responses
that we collected our response rate was close to fifty percent. We felt confident that this
response rate would remain constant throughout the duration of our survey because the trips we
chose were close in time to the ones we would be surveying to gather data. From the experience
and what we learned, the test group was viewed as a success.
27
Results After riding Ride On buses for eighteen nights and eighteen mornings, we have collected
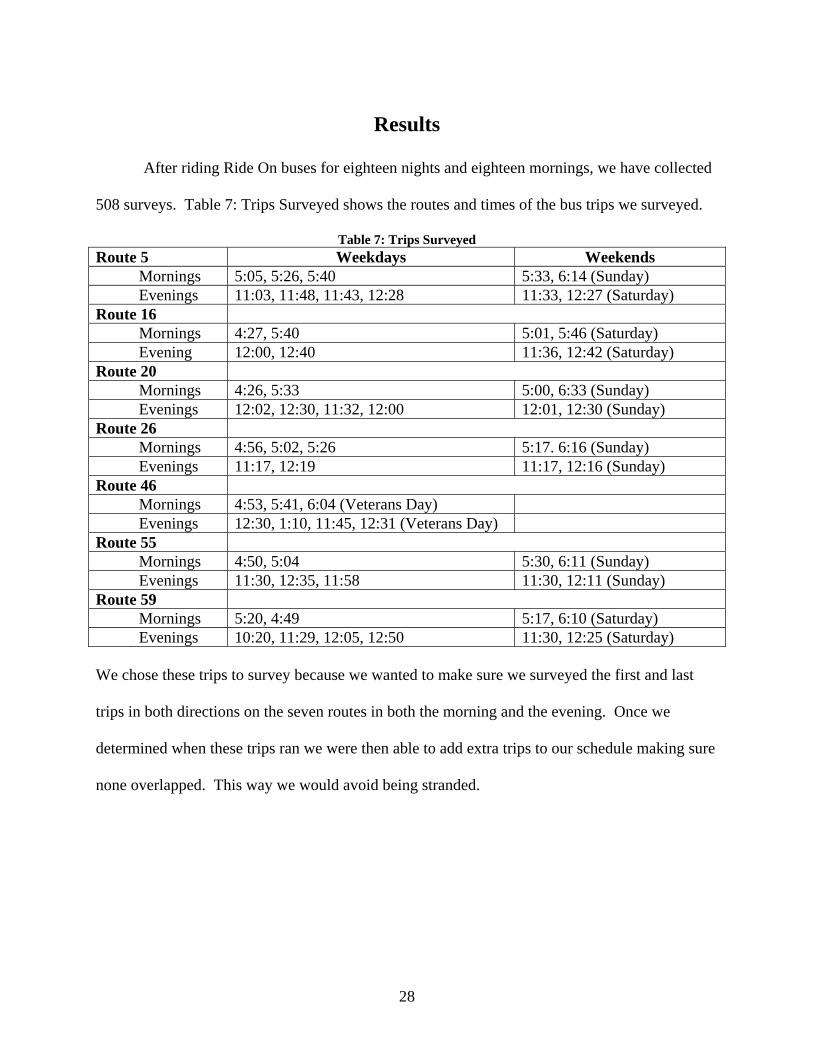
508 surveys. Table 7: Trips Surveyed shows the routes and times of the bus trips we surveyed.
Table 7: Trips Surveyed Route 5 Weekdays Weekends Mornings 5:05, 5:26, 5:40 5:33, 6:14 (Sunday) Evenings 11:03, 11:48, 11:43, 12:28 11:33, 12:27 (Saturday) Route 16 Mornings 4:27, 5:40 5:01, 5:46 (Saturday) Evening 12:00, 12:40 11:36, 12:42 (Saturday) Route 20 Mornings 4:26, 5:33 5:00, 6:33 (Sunday) Evenings 12:02, 12:30, 11:32, 12:00 12:01, 12:30 (Sunday) Route 26 Mornings 4:56, 5:02, 5:26 5:17. 6:16 (Sunday) Evenings 11:17, 12:19 11:17, 12:16 (Sunday) Route 46 Mornings 4:53, 5:41, 6:04 (Veterans Day) Evenings 12:30, 1:10, 11:45, 12:31 (Veterans Day) Route 55 Mornings 4:50, 5:04 5:30, 6:11 (Sunday) Evenings 11:30, 12:35, 11:58 11:30, 12:11 (Sunday) Route 59 Mornings 5:20, 4:49 5:17, 6:10 (Saturday) Evenings 10:20, 11:29, 12:05, 12:50 11:30, 12:25 (Saturday)
We chose these trips to survey because we wanted to make sure we surveyed the first and last
trips in both directions on the seven routes in both the morning and the evening. Once we
determined when these trips ran we were then able to add extra trips to our schedule making sure
none overlapped. This way we would avoid being stranded.
28
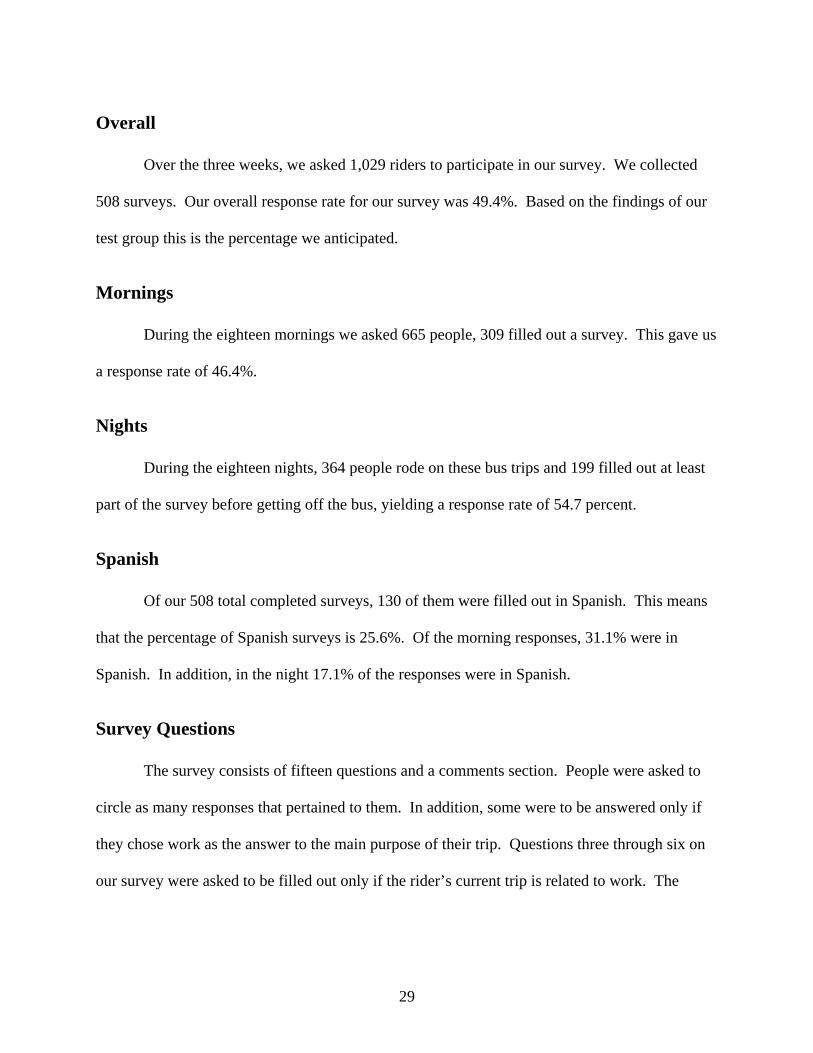
Overall Over the three weeks, we asked 1,029 riders to participate in our survey. We collected
508 surveys. Our overall response rate for our survey was 49.4%. Based on the findings of our
test group this is the percentage we anticipated.
Mornings During the eighteen mornings we asked 665 people, 309 filled out a survey. This gave us
a response rate of 46.4%.
Nights During the eighteen nights, 364 people rode on these bus trips and 199 filled out at least
part of the survey before getting off the bus, yielding a response rate of 54.7 percent.
Spanish
Of our 508 total completed surveys, 130 of them were filled out in Spanish. This means
that the percentage of Spanish surveys is 25.6%. Of the morning responses, 31.1% were in
Spanish. In addition, in the night 17.1% of the responses were in Spanish.
Survey Questions
The survey consists of fifteen questions and a comments section. People were asked to
circle as many responses that pertained to them. In addition, some were to be answered only if
they chose work as the answer to the main purpose of their trip. Questions three through six on
our survey were asked to be filled out only if the rider’s current trip is related to work. The
29
survey in both English and Spanish is available in Appendix C: Our Survey. The following
results were obtained from all of our collected surveys.
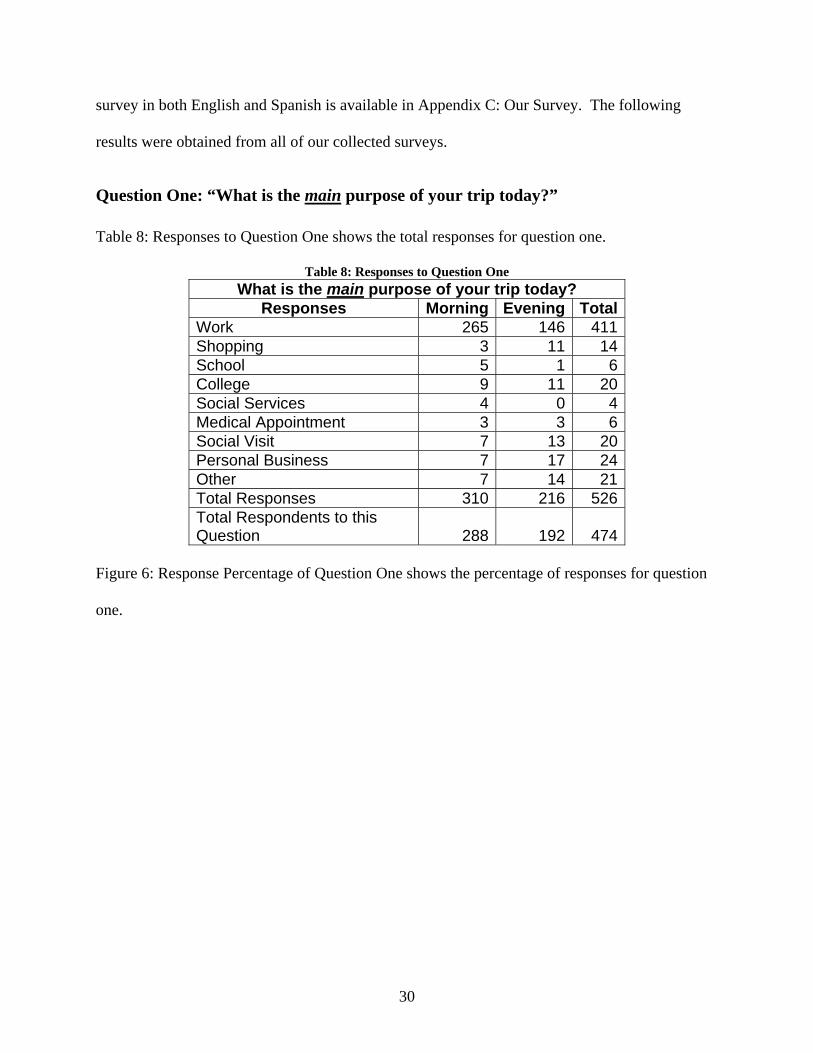
Question One: “What is the main purpose of your trip today?” Table 8: Responses to Question One shows the total responses for question one.
Table 8: Responses to Question One What is the main purpose of your trip today?
Responses Morning Evening Total Work 265 146 411 Shopping 3 11 14 School 5 1 6 College 9 11 20 Social Services 4 0 4 Medical Appointment 3 3 6 Social Visit 7 13 20 Personal Business 7 17 24 Other 7 14 21 Total Responses 310 216 526 Total Respondents to this Question 288 192 474
Figure 6: Response Percentage of Question One shows the percentage of responses for question
one.
30
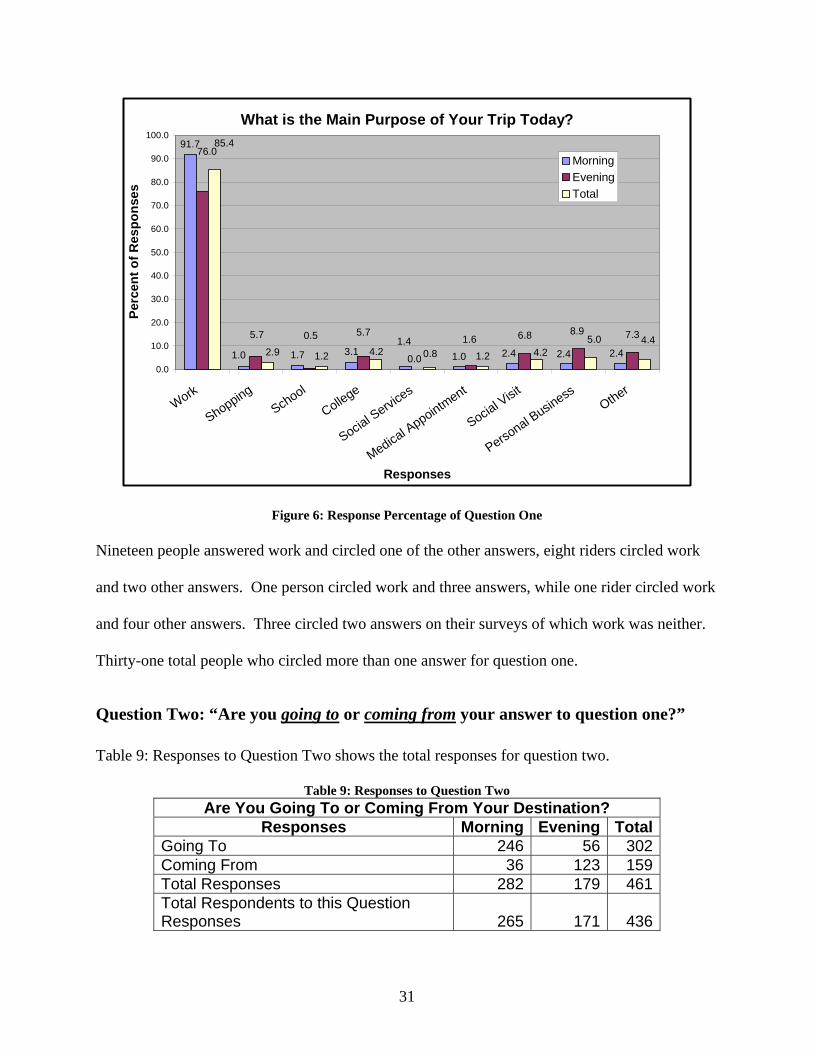
What is the Main Purpose of Your Trip Today?91.7
1.7 3.1 1.01.2 1.21.0 2.42.42.41.4 7.38.96.81.6
0.0
5.70.55.7
76.0
2.94.45.0
4.20.84.2
85.4
0.0
10.0
20.0
30.0
40.0
50.0
60.0
70.0
80.0
90.0
100.0
Work
ShoppingSchool
College
Social Services
Medical Appointment
Social Visit
Personal Business
Other
Responses
Perc
ent o
f Res
pons
es
MorningEveningTotal
Figure 6: Response Percentage of Question One Nineteen people answered work and circled one of the other answers, eight riders circled work
and two other answers. One person circled work and three answers, while one rider circled work
and four other answers. Three circled two answers on their surveys of which work was neither.
Thirty-one total people who circled more than one answer for question one.
Question Two: “Are you going to or coming from your answer to question one?” Table 9: Responses to Question Two shows the total responses for question two.
Table 9: Responses to Question Two Are You Going To or Coming From Your Destination?
Responses Morning Evening Total Going To 246 56 302 Coming From 36 123 159 Total Responses 282 179 461 Total Respondents to this Question Responses 265 171 436
31
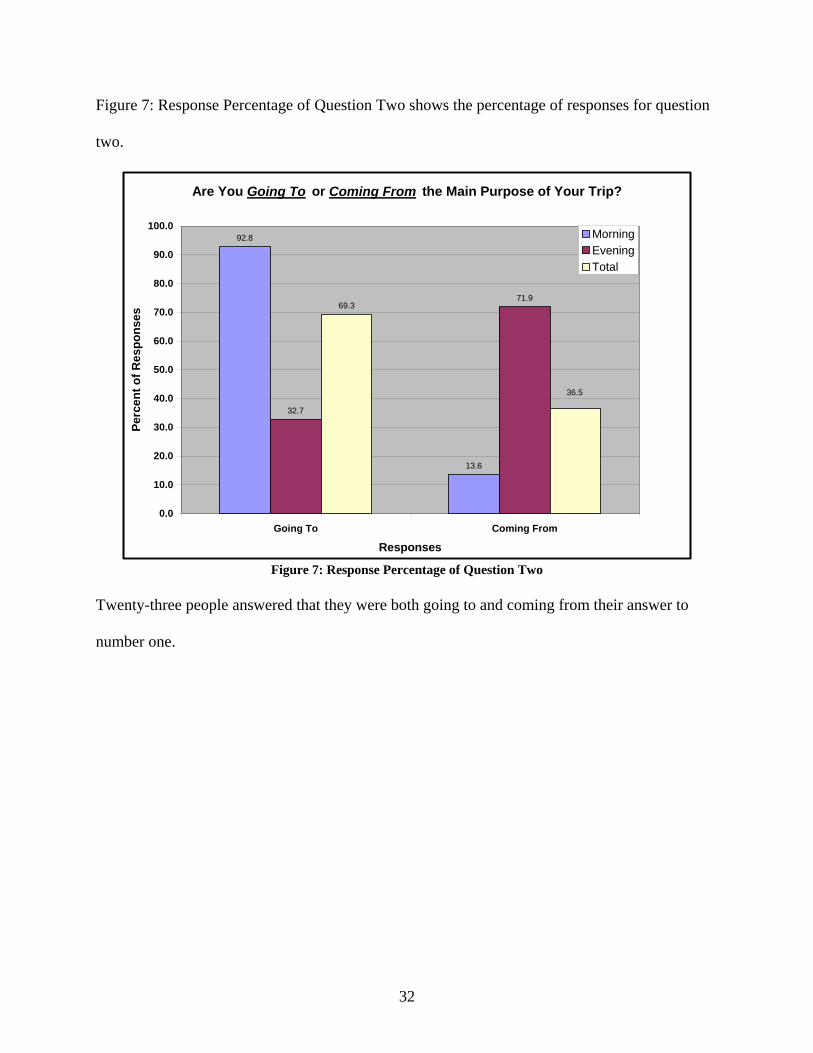
Figure 7: Response Percentage of Question Two shows the percentage of responses for question
two.
Are You Going To or Coming From the Main Purpose of Your Trip?
92.8
13.6
32.7
71.969.3
36.5
0.0
10.0
20.0
30.0
40.0
50.0
60.0
70.0
80.0
90.0
100.0
Going To Coming From
Responses
Perc
ent o
f Res
pons
es
MorningEveningTotal
Figure 7: Response Percentage of Question Two
Twenty-three people answered that they were both going to and coming from their answer to
number one.
32
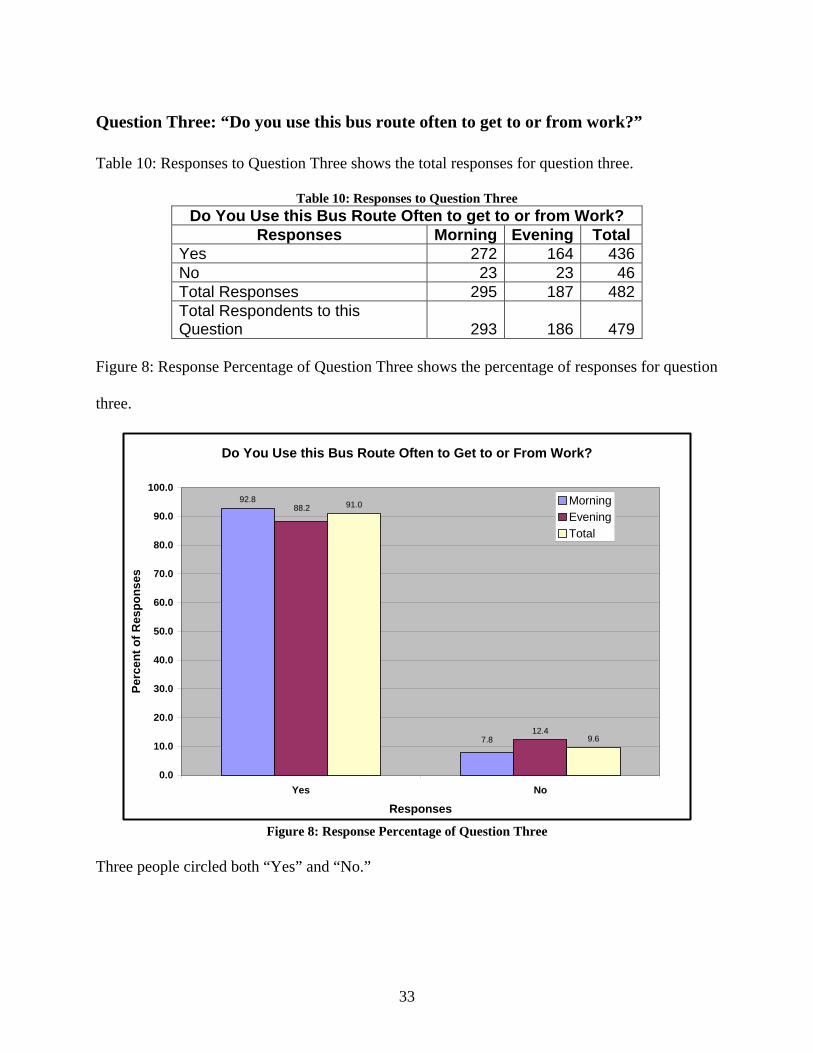
Question Three: “Do you use this bus route often to get to or from work?” Table 10: Responses to Question Three shows the total responses for question three.
Table 10: Responses to Question Three Do You Use this Bus Route Often to get to or from Work?
Responses Morning Evening Total Yes 272 164 436 No 23 23 46 Total Responses 295 187 482 Total Respondents to this Question 293 186 479
Figure 8: Response Percentage of Question Three shows the percentage of responses for question
three.
Do You Use this Bus Route Often to Get to or From Work?
92.8
12.4
91.0
9.67.8
88.2
0.0
10.0
20.0
30.0
40.0
50.0
60.0
70.0
80.0
90.0
100.0
Yes No
Responses
Perc
ent o
f Res
pons
es
MorningEveningTotal
Figure 8: Response Percentage of Question Three
Three people circled both “Yes” and “No.”
33
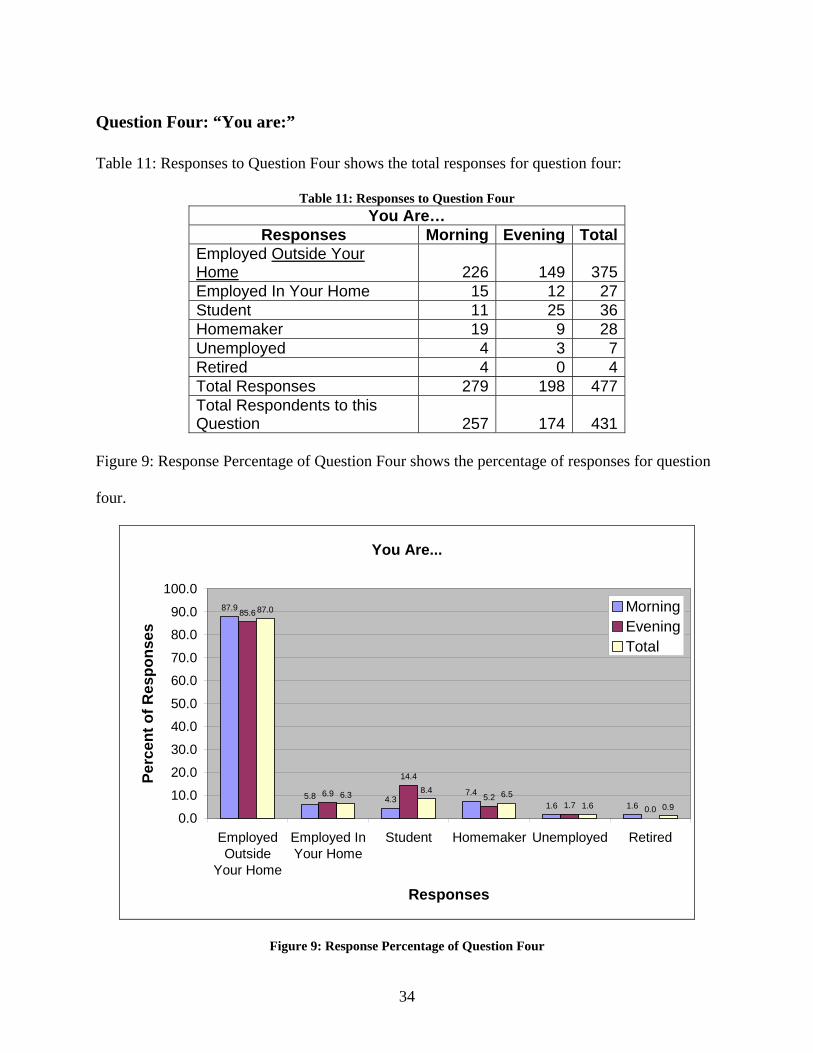
Question Four: “You are:” Table 11: Responses to Question Four shows the total responses for question four:
Table 11: Responses to Question Four You Are…
Responses Morning Evening Total Employed Outside Your Home 226 149 375 Employed In Your Home 15 12 27 Student 11 25 36 Homemaker 19 9 28 Unemployed 4 3 7 Retired 4 0 4 Total Responses 279 198 477 Total Respondents to this Question 257 174 431
Figure 9: Response Percentage of Question Four shows the percentage of responses for question
four.
You Are...
87.9
5.8 4.37.4
1.6 1.6
85.6
6.9
14.4
5.21.7 0.0
87.0
6.3 8.4 6.51.6 0.9
0.0
10.0
20.0
30.0
40.0
50.0
60.0
70.0
80.0
90.0
100.0
EmployedOutside
Your Home
Employed InYour Home
Student Homemaker Unemployed Retired
Responses
Perc
ent o
f Res
pons
es
MorningEveningTotal
Figure 9: Response Percentage of Question Four
34
Forty-two people circled two answers, and two people circled three answers on question four.
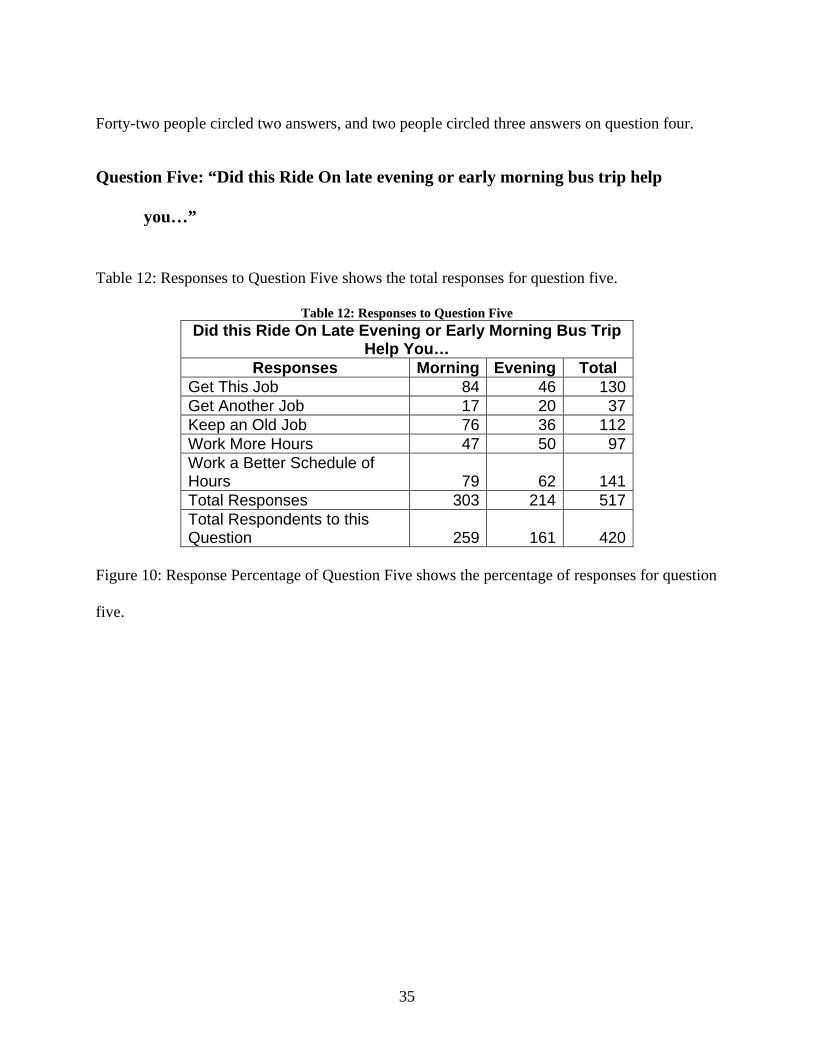
Question Five: “Did this Ride On late evening or early morning bus trip help
you…”
Table 12: Responses to Question Five shows the total responses for question five.
Table 12: Responses to Question Five Did this Ride On Late Evening or Early Morning Bus Trip
Help You… Responses Morning Evening Total
Get This Job 84 46 130 Get Another Job 17 20 37 Keep an Old Job 76 36 112 Work More Hours 47 50 97 Work a Better Schedule of Hours 79 62 141 Total Responses 303 214 517 Total Respondents to this Question 259 161 420
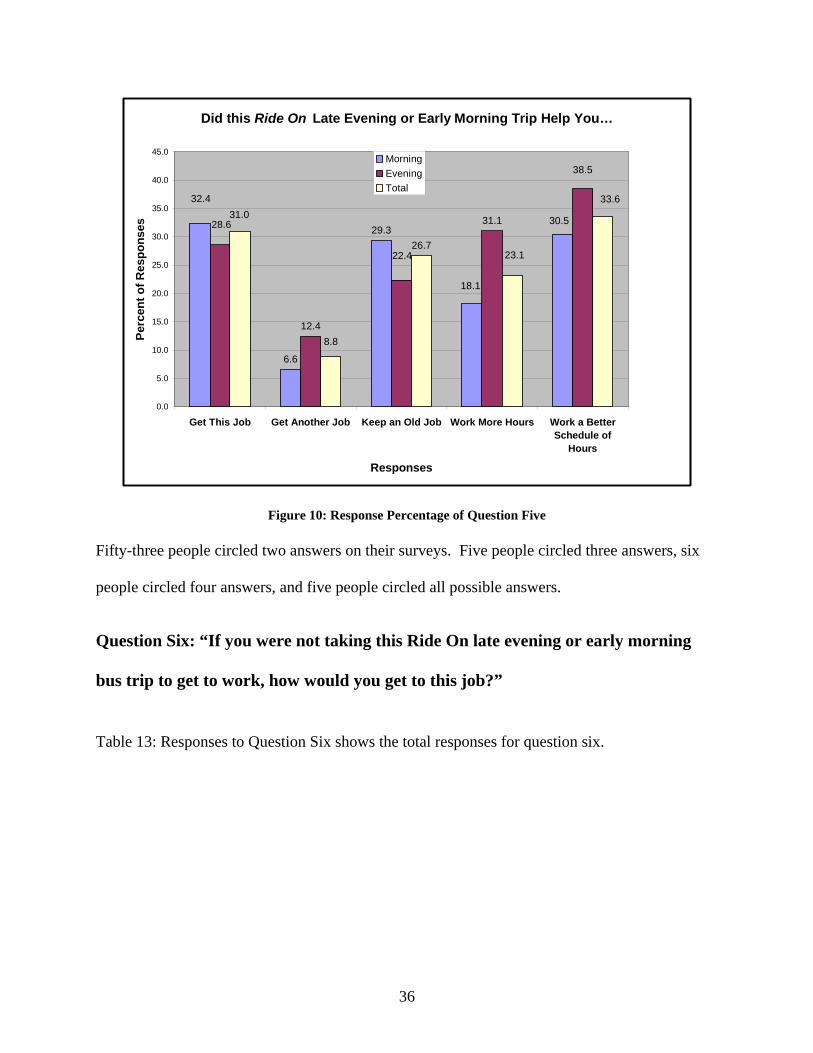
Figure 10: Response Percentage of Question Five shows the percentage of responses for question
five.
35
Did this Ride On Late Evening or Early Morning Trip Help You…
6.6
29.3
12.4
31.1
26.7
30.5
18.1
32.4
22.4
38.5
28.6
33.6
23.1
8.8
31.0
0.0
5.0
10.0
15.0
20.0
25.0
30.0
35.0
40.0
45.0
Get This Job Get Another Job Keep an Old Job Work More Hours Work a BetterSchedule of
Hours
Responses
Perc
ent o
f Res
pons
esMorningEveningTotal
Figure 10: Response Percentage of Question Five Fifty-three people circled two answers on their surveys. Five people circled three answers, six
people circled four answers, and five people circled all possible answers.
Question Six: “If you were not taking this Ride On late evening or early morning
bus trip to get to work, how would you get to this job?”
Table 13: Responses to Question Six shows the total responses for question six.
36
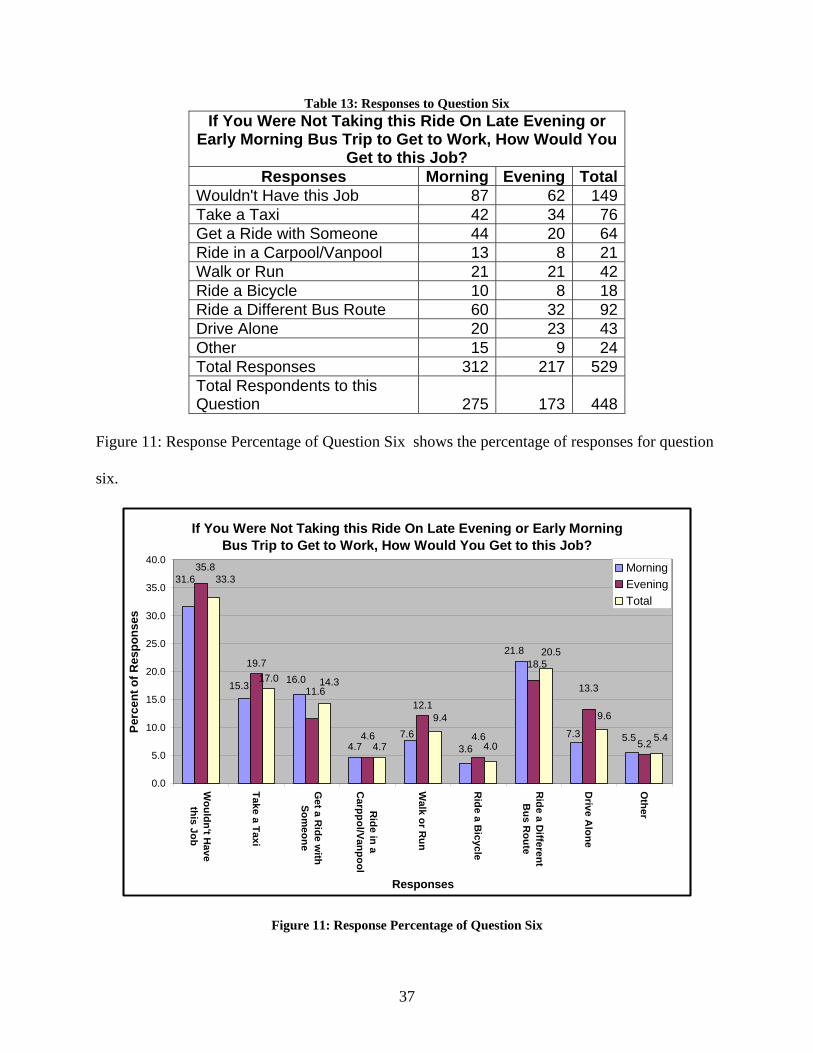
Table 13: Responses to Question Six If You Were Not Taking this Ride On Late Evening or
Early Morning Bus Trip to Get to Work, How Would You Get to this Job?
Responses Morning Evening Total Wouldn't Have this Job 87 62 149 Take a Taxi 42 34 76 Get a Ride with Someone 44 20 64 Ride in a Carpool/Vanpool 13 8 21 Walk or Run 21 21 42 Ride a Bicycle 10 8 18 Ride a Different Bus Route 60 32 92 Drive Alone 20 23 43 Other 15 9 24 Total Responses 312 217 529 Total Respondents to this Question 275 173 448
Figure 11: Response Percentage of Question Six shows the percentage of responses for question
six.
If You Were Not Taking this Ride On Late Evening or Early Morning Bus Trip to Get to Work, How Would You Get to this Job?
4.7
19.7
12.1
5.2
17.0
4.7
31.6
15.3 16.0
7.63.6
21.8
7.3 5.5
35.8
11.6
4.6 4.6
18.5
13.3
33.3
14.3
9.4
4.0
20.5
9.6
5.4
0.0
5.0
10.0
15.0
20.0
25.0
30.0
35.0
40.0
Wouldn't H
avethis Job
Take a Taxi
Get a R
ide with
Someone
Ride in a
Carppol/Vanpool
Walk or R
un
Ride a B
icycle
Ride a D
ifferentB
us Route
Drive A
lone
Other
Responses
Perc
ent o
f Res
pons
es
MorningEveningTotal
Figure 11: Response Percentage of Question Six
37
Forty people circled two answers for question six. Seventeen people circled three answers, and
two people circled five answers.
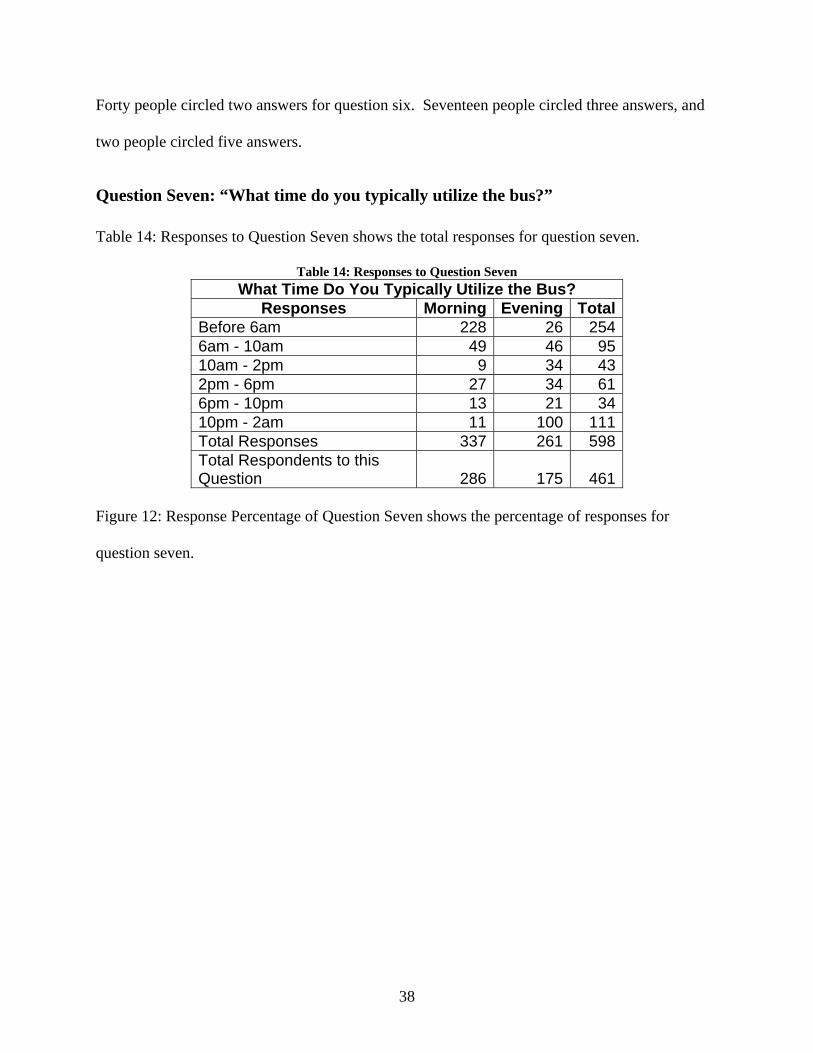
Question Seven: “What time do you typically utilize the bus?” Table 14: Responses to Question Seven shows the total responses for question seven.
Table 14: Responses to Question Seven What Time Do You Typically Utilize the Bus?
Responses Morning Evening Total Before 6am 228 26 254 6am - 10am 49 46 95 10am - 2pm 9 34 43 2pm - 6pm 27 34 61 6pm - 10pm 13 21 34 10pm - 2am 11 100 111 Total Responses 337 261 598 Total Respondents to this Question 286 175 461
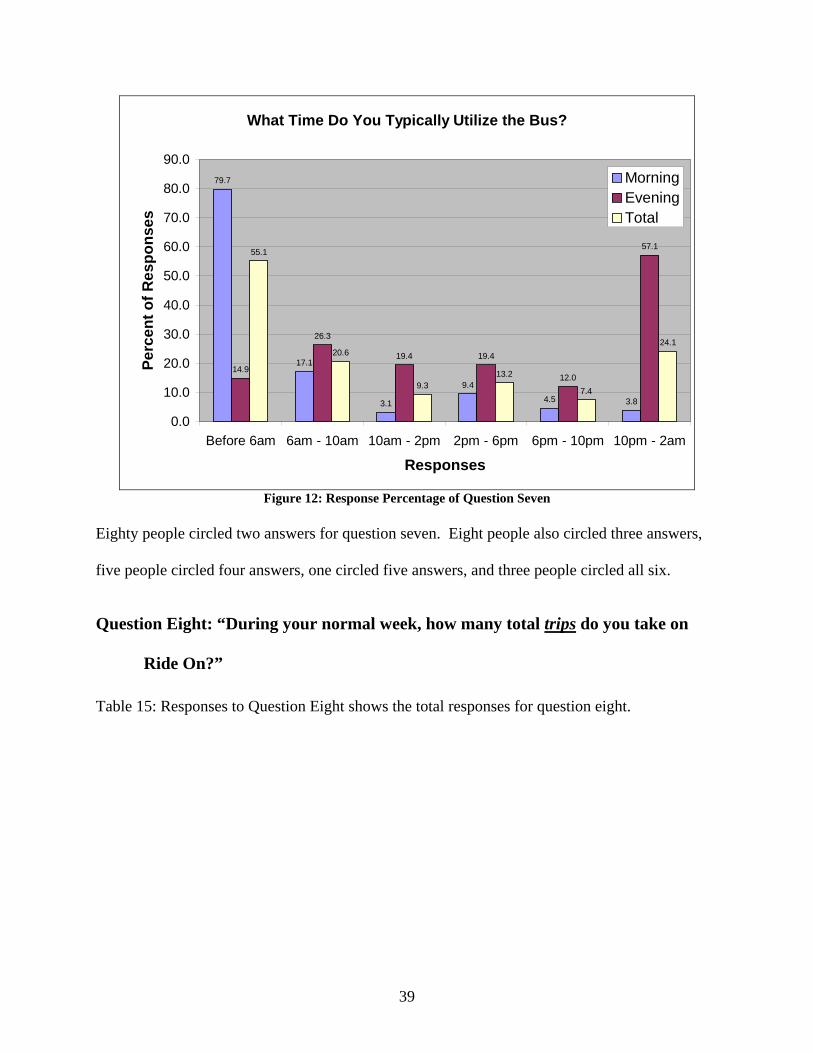
Figure 12: Response Percentage of Question Seven shows the percentage of responses for
question seven.
38
What Time Do You Typically Utilize the Bus?
79.7
17.1
3.1
9.4
4.5 3.8
14.9
26.3
19.4 19.4
12.0
57.155.1
20.6
9.313.2
7.4
24.1
0.0
10.0
20.0
30.0
40.0
50.0
60.0
70.0
80.0
90.0
Before 6am 6am - 10am 10am - 2pm 2pm - 6pm 6pm - 10pm 10pm - 2am
Responses
Perc
ent o
f Res
pons
es
MorningEveningTotal
Figure 12: Response Percentage of Question Seven
Eighty people circled two answers for question seven. Eight people also circled three answers,
five people circled four answers, one circled five answers, and three people circled all six.
Question Eight: “During your normal week, how many total trips do you take on
Ride On?”
Table 15: Responses to Question Eight shows the total responses for question eight.
39
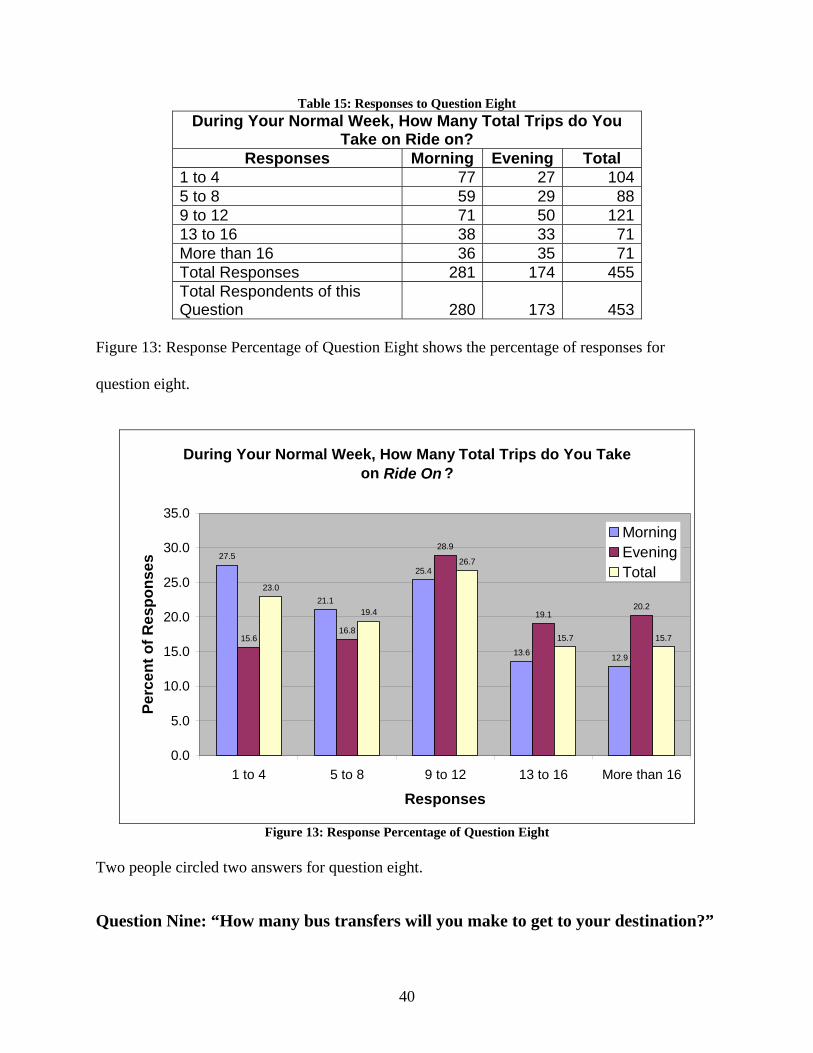
Table 15: Responses to Question Eight During Your Normal Week, How Many Total Trips do You
Take on Ride on? Responses Morning Evening Total
1 to 4 77 27 104 5 to 8 59 29 88 9 to 12 71 50 121 13 to 16 38 33 71 More than 16 36 35 71 Total Responses 281 174 455 Total Respondents of this Question 280 173 453
Figure 13: Response Percentage of Question Eight shows the percentage of responses for
question eight.
During Your Normal Week, How Many Total Trips do You Take on Ride On ?
27.5
21.1
25.4
13.6 12.9
15.616.8
28.9
19.120.2
23.0
19.4
26.7
15.7 15.7
0.0
5.0
10.0
15.0
20.0
25.0
30.0
35.0
1 to 4 5 to 8 9 to 12 13 to 16 More than 16
Responses
Perc
ent o
f Res
pons
es
MorningEveningTotal
Figure 13: Response Percentage of Question Eight
Two people circled two answers for question eight.
Question Nine: “How many bus transfers will you make to get to your destination?”
40
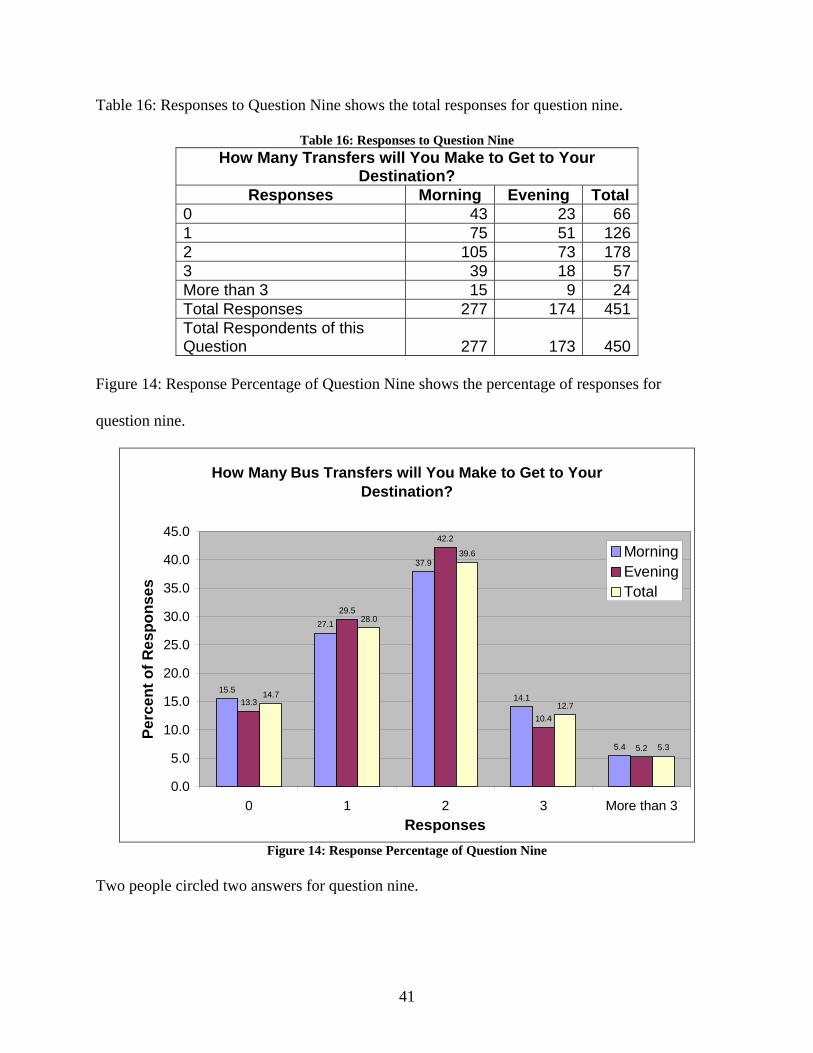
Table 16: Responses to Question Nine shows the total responses for question nine.
Table 16: Responses to Question Nine How Many Transfers will You Make to Get to Your
Destination? Responses Morning Evening Total
0 43 23 66 1 75 51 126 2 105 73 178 3 39 18 57 More than 3 15 9 24 Total Responses 277 174 451 Total Respondents of this Question 277 173 450
Figure 14: Response Percentage of Question Nine shows the percentage of responses for
question nine.
How Many Bus Transfers will You Make to Get to Your Destination?
15.5
27.1
37.9
14.1
5.4
13.3
29.5
42.2
10.4
5.2
14.7
28.0
39.6
12.7
5.3
0.0
5.0
10.0
15.0
20.0
25.0
30.0
35.0
40.0
45.0
0 1 2 3 More than 3Responses
Perc
ent o
f Res
pons
es
MorningEveningTotal
Figure 14: Response Percentage of Question Nine
Two people circled two answers for question nine.
41
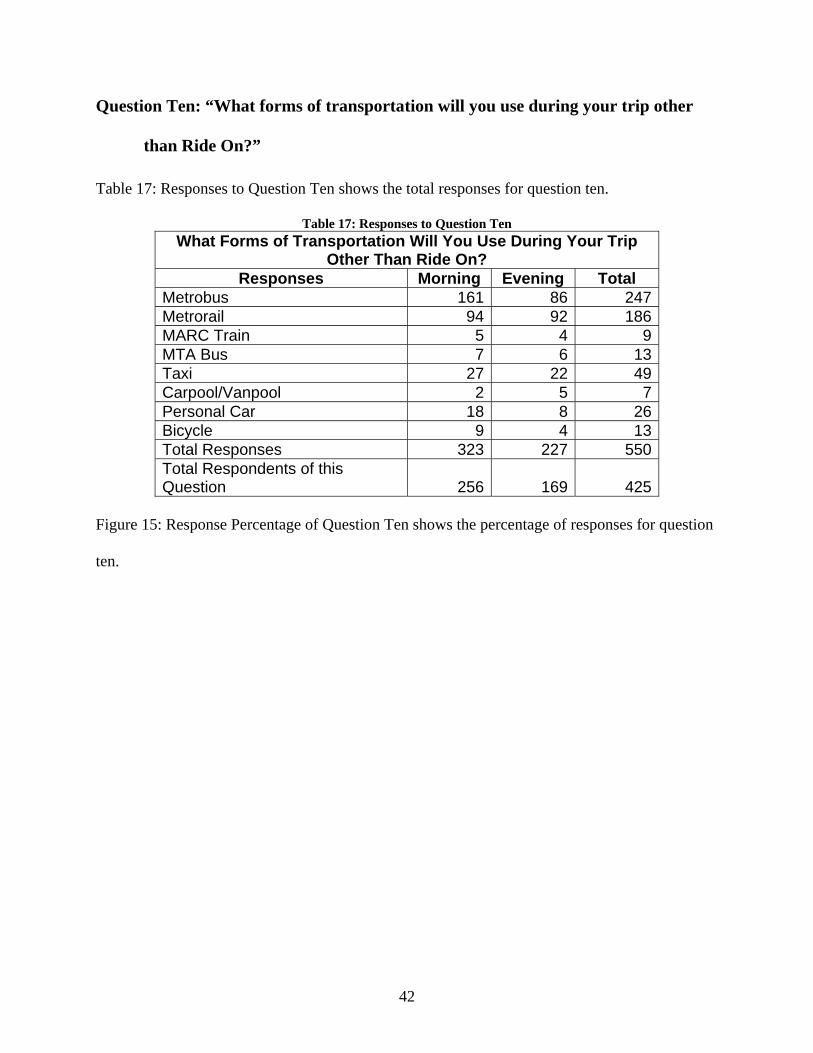
Question Ten: “What forms of transportation will you use during your trip other
than Ride On?”
Table 17: Responses to Question Ten shows the total responses for question ten.
Table 17: Responses to Question Ten What Forms of Transportation Will You Use During Your Trip
Other Than Ride On? Responses Morning Evening Total
Metrobus 161 86 247 Metrorail 94 92 186 MARC Train 5 4 9 MTA Bus 7 6 13 Taxi 27 22 49 Carpool/Vanpool 2 5 7 Personal Car 18 8 26 Bicycle 9 4 13 Total Responses 323 227 550 Total Respondents of this Question 256 169 425
Figure 15: Response Percentage of Question Ten shows the percentage of responses for question
ten.
42
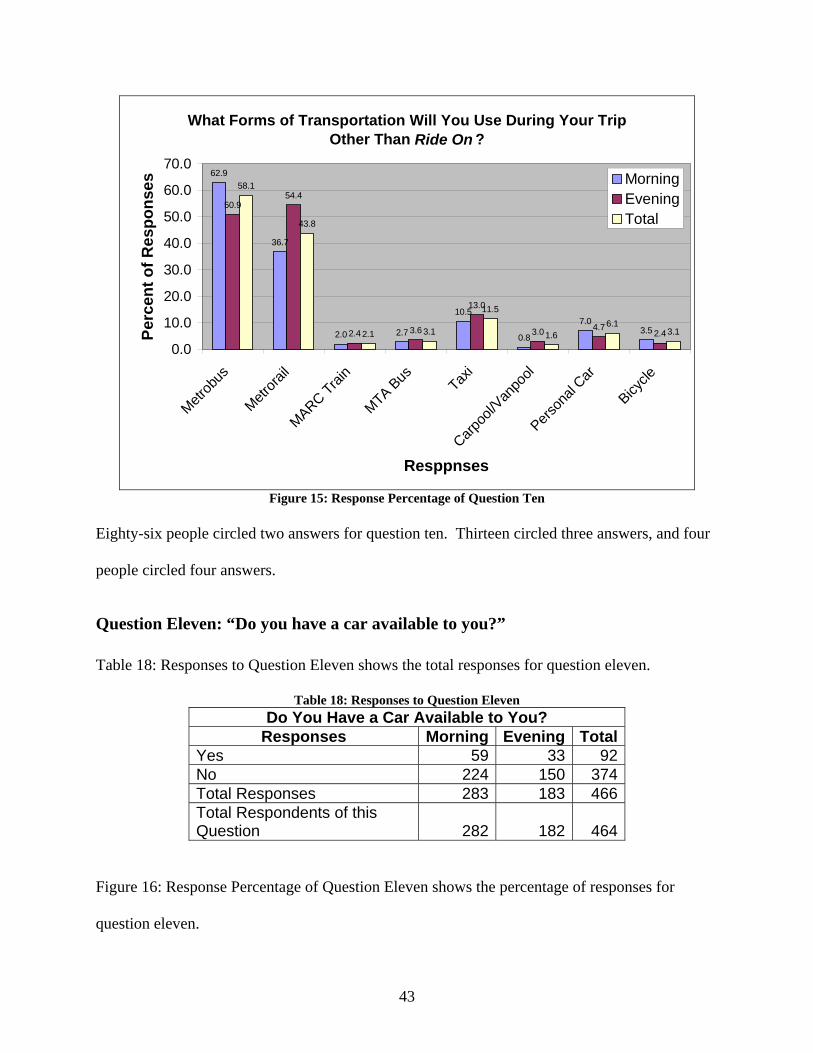
What Forms of Transportation Will You Use During Your Trip Other Than Ride On ?
62.9
36.7
2.0 2.7
10.5
0.8
7.03.5
50.954.4
2.4 3.6
13.0
3.0 4.72.4
58.1
43.8
2.1 3.1
11.5
1.66.1
3.1
0.0
10.0
20.0
30.0
40.0
50.0
60.0
70.0
Metrob
us
Metrora
il
MARC Train
MTA Bus Tax
i
Carpoo
l/Van
pool
Person
al Car
Bicycle
Resppnses
Perc
ent o
f Res
pons
es MorningEveningTotal
Figure 15: Response Percentage of Question Ten
Eighty-six people circled two answers for question ten. Thirteen circled three answers, and four
people circled four answers.
Question Eleven: “Do you have a car available to you?” Table 18: Responses to Question Eleven shows the total responses for question eleven.
Table 18: Responses to Question Eleven Do You Have a Car Available to You?
Responses Morning Evening Total Yes 59 33 92 No 224 150 374 Total Responses 283 183 466 Total Respondents of this Question 282 182 464
Figure 16: Response Percentage of Question Eleven shows the percentage of responses for
question eleven.
43
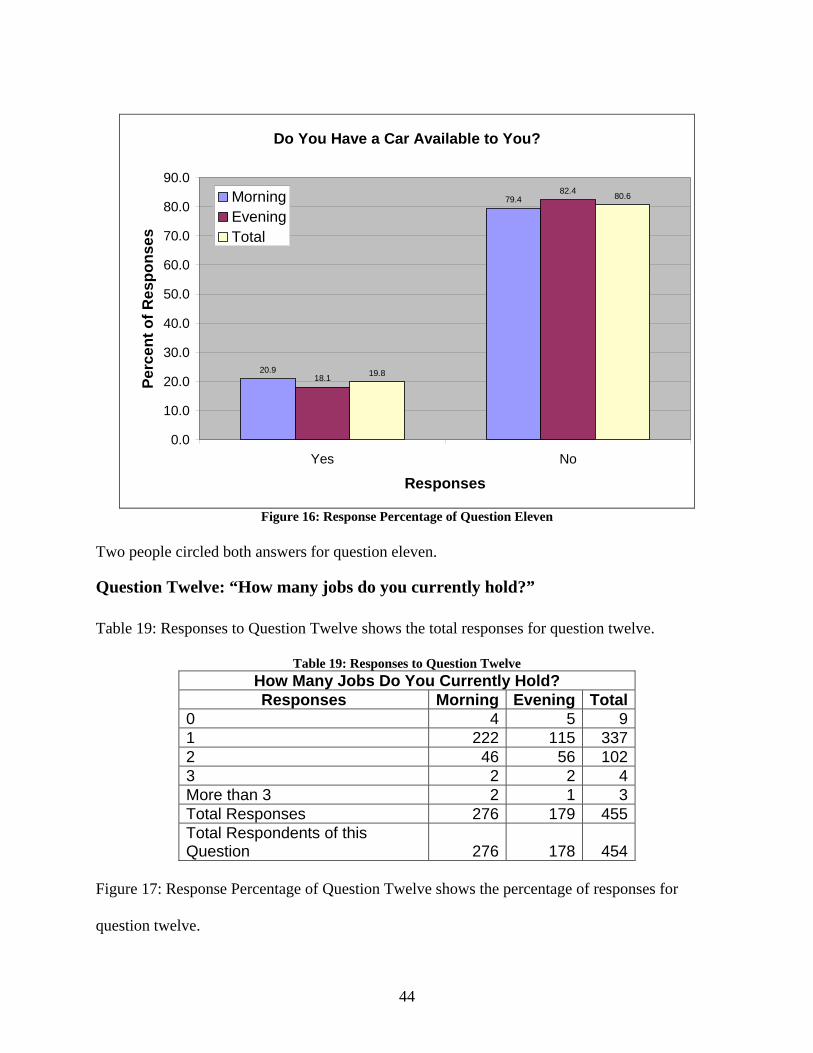
Do You Have a Car Available to You?
20.9
79.4
18.1
82.4
19.8
80.6
0.0
10.0
20.0
30.0
40.0
50.0
60.0
70.0
80.0
90.0
Yes No
Responses
Perc
ent o
f Res
pons
es
MorningEveningTotal
Figure 16: Response Percentage of Question Eleven
Two people circled both answers for question eleven.
Question Twelve: “How many jobs do you currently hold?” Table 19: Responses to Question Twelve shows the total responses for question twelve.
Table 19: Responses to Question Twelve How Many Jobs Do You Currently Hold? Responses Morning Evening Total
0 4 5 9 1 222 115 337 2 46 56 102 3 2 2 4 More than 3 2 1 3 Total Responses 276 179 455 Total Respondents of this Question 276 178 454
Figure 17: Response Percentage of Question Twelve shows the percentage of responses for
question twelve.
44
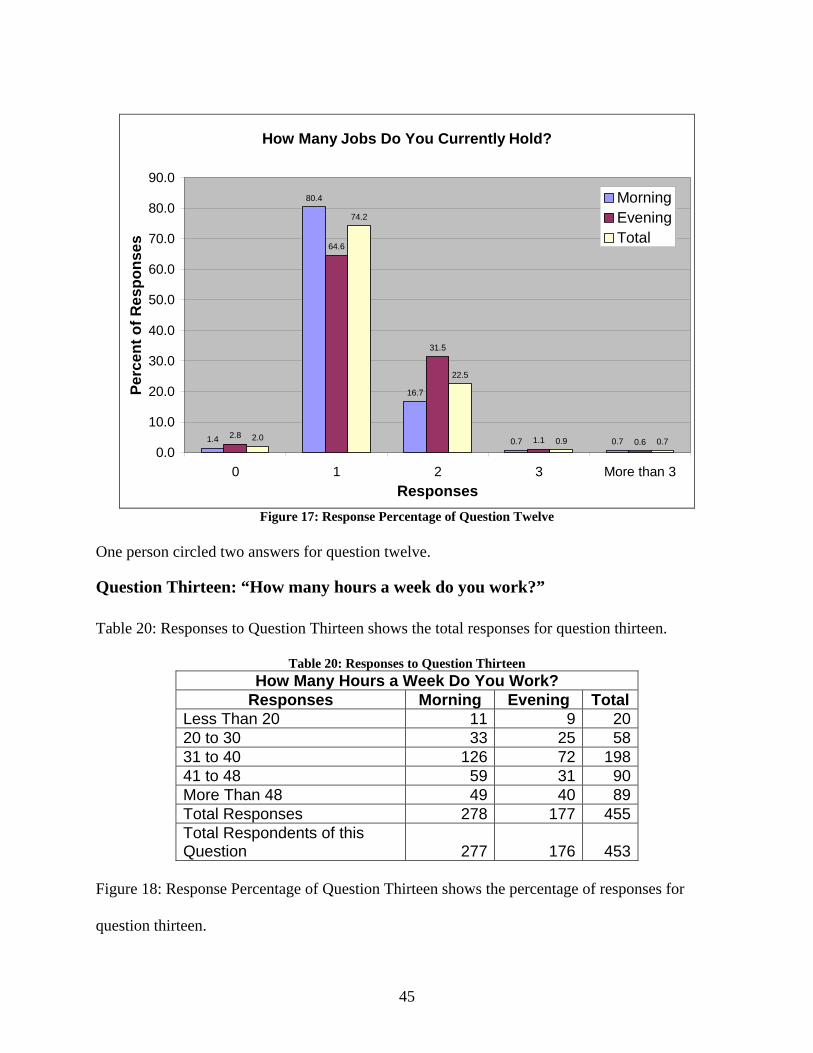
How Many Jobs Do You Currently Hold?
1.4
80.4
16.7
0.7 0.72.8
64.6
31.5
1.1 0.62.0
74.2
22.5
0.9 0.70.0
10.0
20.0
30.0
40.0
50.0
60.0
70.0
80.0
90.0
0 1 2 3 More thResponses
Perc
ent o
f Res
pons
es
an 3
MorningEveningTotal
Figure 17: Response Percentage of Question Twelve
One person circled two answers for question twelve.
Question Thirteen: “How many hours a week do you work?” Table 20: Responses to Question Thirteen shows the total responses for question thirteen.
Table 20: Responses to Question Thirteen How Many Hours a Week Do You Work?
Responses Morning Evening Total Less Than 20 11 9 20 20 to 30 33 25 58 31 to 40 126 72 198 41 to 48 59 31 90 More Than 48 49 40 89 Total Responses 278 177 455 Total Respondents of this Question 277 176 453
Figure 18: Response Percentage of Question Thirteen shows the percentage of responses for
question thirteen.
45
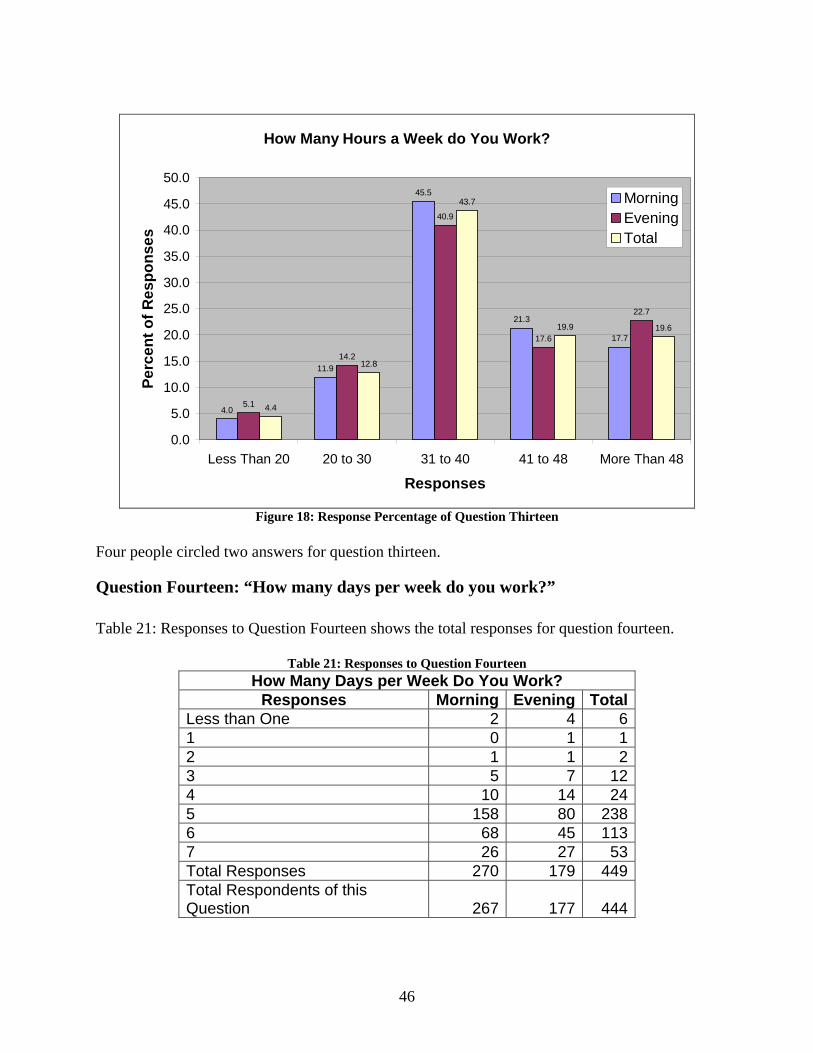
How Many Hours a Week do You Work?
4.0
11.9
45.5
21.3
17.7
5.1
14.2
40.9
17.6
22.7
4.4
12.8
43.7
19.9 19.6
0.0
5.0
10.0
15.0
20.0
25.0
30.0
35.0
40.0
45.0
50.0
Less Than 20 20 to 30 31 to 40 41 to 48 More Than 48
Responses
Perc
ent o
f Res
pons
es
MorningEveningTotal
Figure 18: Response Percentage of Question Thirteen
Four people circled two answers for question thirteen.
Question Fourteen: “How many days per week do you work?” Table 21: Responses to Question Fourteen shows the total responses for question fourteen.
Table 21: Responses to Question Fourteen How Many Days per Week Do You Work?
Responses Morning Evening Total Less than One 2 4 6 1 0 1 1 2 1 1 2 3 5 7 12 4 10 14 24 5 158 80 238 6 68 45 113 7 26 27 53 Total Responses 270 179 449 Total Respondents of this Question 267 177 444
46
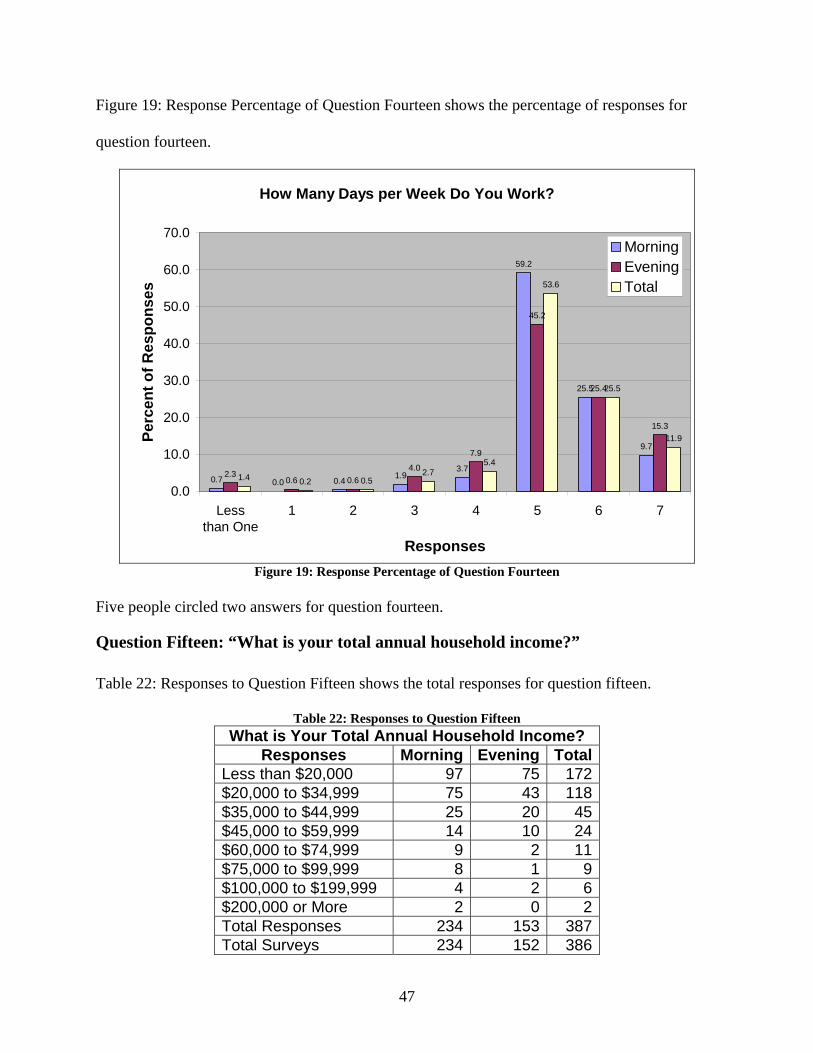
Figure 19: Response Percentage of Question Fourteen shows the percentage of responses for
question fourteen.
How Many Days per Week Do You Work?
0.7 0.0 0.4 1.93.7
59.2
25.5
9.7
2.30.6 0.6
4.0
7.9
45.2
25.4
15.3
1.4 0.2 0.52.7
5.4
53.6
25.5
11.9
0.0
10.0
20.0
30.0
40.0
50.0
60.0
70.0
Lessthan One
1 2 3 4 5 6 7
Responses
Perc
ent o
f Res
pons
es
MorningEveningTotal
Figure 19: Response Percentage of Question Fourteen
Five people circled two answers for question fourteen.
Question Fifteen: “What is your total annual household income?” Table 22: Responses to Question Fifteen shows the total responses for question fifteen.
Table 22: Responses to Question Fifteen What is Your Total Annual Household Income?
Responses Morning Evening Total Less than $20,000 97 75 172 $20,000 to $34,999 75 43 118 $35,000 to $44,999 25 20 45 $45,000 to $59,999 14 10 24 $60,000 to $74,999 9 2 11 $75,000 to $99,999 8 1 9 $100,000 to $199,999 4 2 6 $200,000 or More 2 0 2 Total Responses 234 153 387 Total Surveys 234 152 386
47
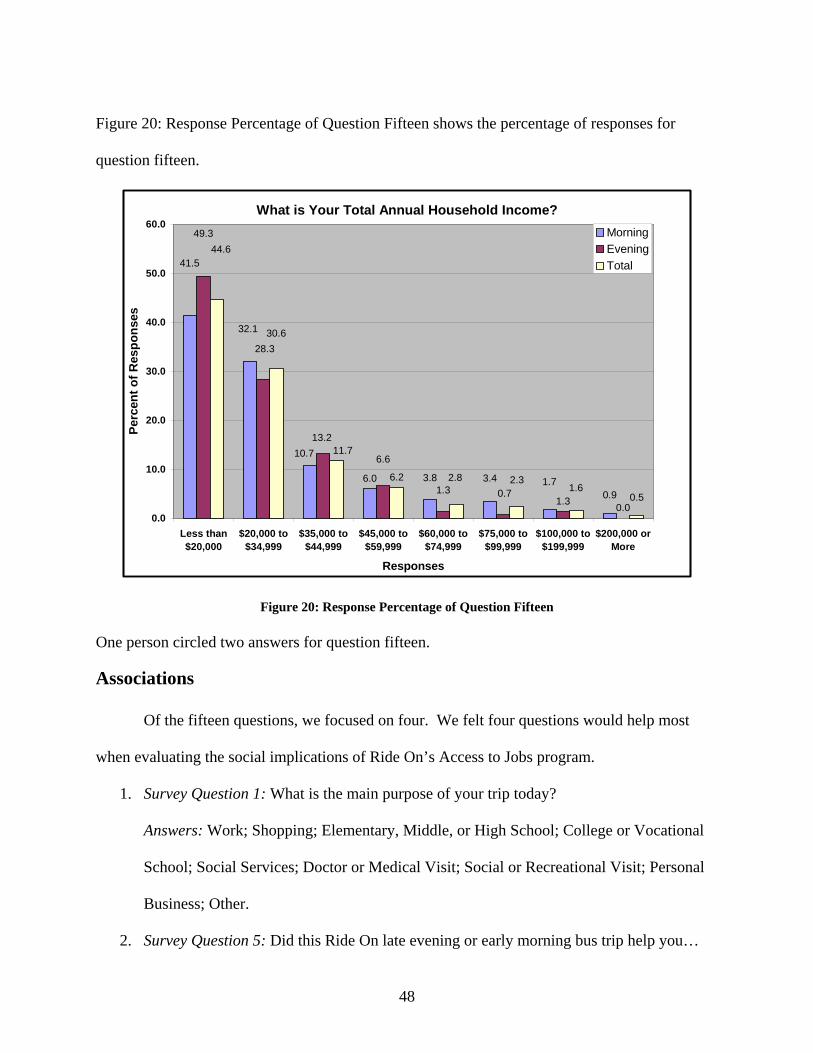
Figure 20: Response Percentage of Question Fifteen shows the percentage of responses for
question fifteen.
What is Your Total Annual Household Income?
6.0
1.3 0.0
6.2
41.5
32.1
10.7
3.8 3.4 1.70.9
49.3
28.3
13.2
6.6
1.3 0.7
44.6
30.6
11.7
2.8 2.31.6
0.5
0.0
10.0
20.0
30.0
40.0
50.0
60.0
Less than$20,000
$20,000 to$34,999
$35,000 to$44,999
$45,000 to$59,999
$60,000 to$74,999
$75,000 to$99,999
$100,000 to$199,999
$200,000 orMore
Responses
Perc
ent o
f Res
pons
es
MorningEveningTotal
Figure 20: Response Percentage of Question Fifteen One person circled two answers for question fifteen.
Associations
Of the fifteen questions, we focused on four. We felt four questions would help most
when evaluating the social implications of Ride On’s Access to Jobs program.
1. Survey Question 1: What is the main purpose of your trip today?
Answers: Work; Shopping; Elementary, Middle, or High School; College or Vocational
School; Social Services; Doctor or Medical Visit; Social or Recreational Visit; Personal
Business; Other.
2. Survey Question 5: Did this Ride On late evening or early morning bus trip help you…
48
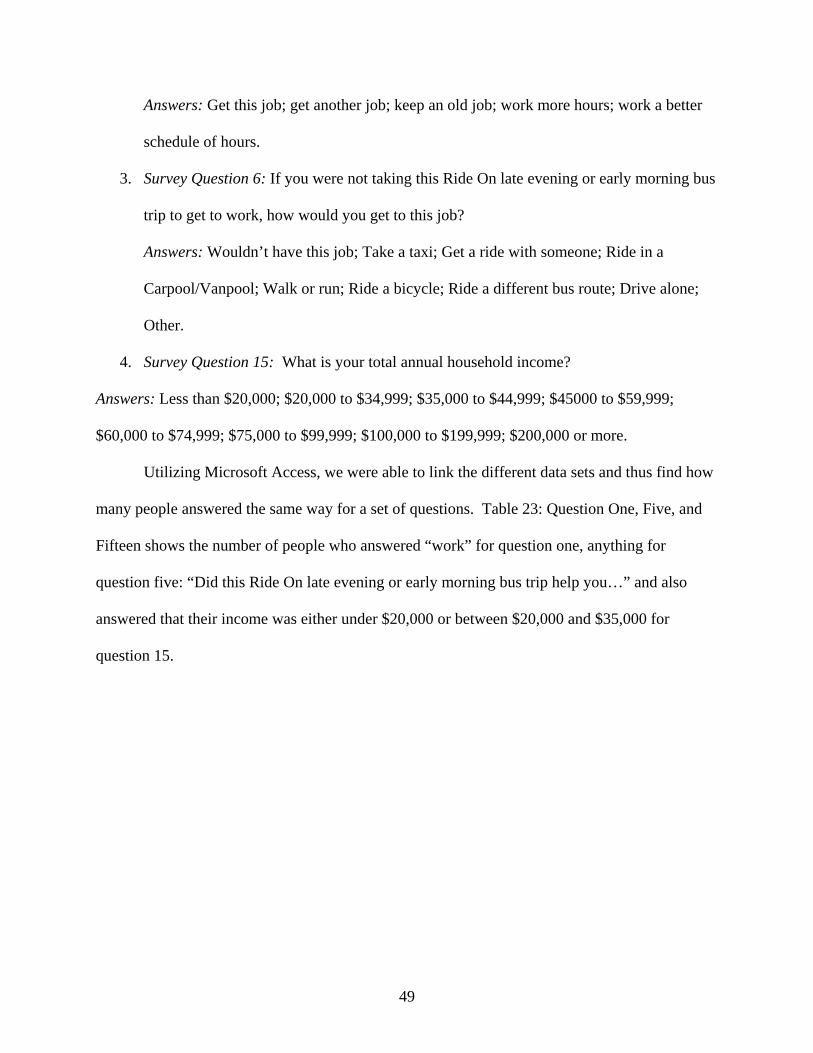
Answers: Get this job; get another job; keep an old job; work more hours; work a better
schedule of hours.
3. Survey Question 6: If you were not taking this Ride On late evening or early morning bus
trip to get to work, how would you get to this job?
Answers: Wouldn’t have this job; Take a taxi; Get a ride with someone; Ride in a
Carpool/Vanpool; Walk or run; Ride a bicycle; Ride a different bus route; Drive alone;
Other.
4. Survey Question 15: What is your total annual household income?
Answers: Less than $20,000; $20,000 to $34,999; $35,000 to $44,999; $45000 to $59,999;
$60,000 to $74,999; $75,000 to $99,999; $100,000 to $199,999; $200,000 or more.
Utilizing Microsoft Access, we were able to link the different data sets and thus find how
many people answered the same way for a set of questions. Table 23: Question One, Five, and
Fifteen shows the number of people who answered “work” for question one, anything for
question five: “Did this Ride On late evening or early morning bus trip help you…” and also
answered that their income was either under $20,000 or between $20,000 and $35,000 for
question 15.
49
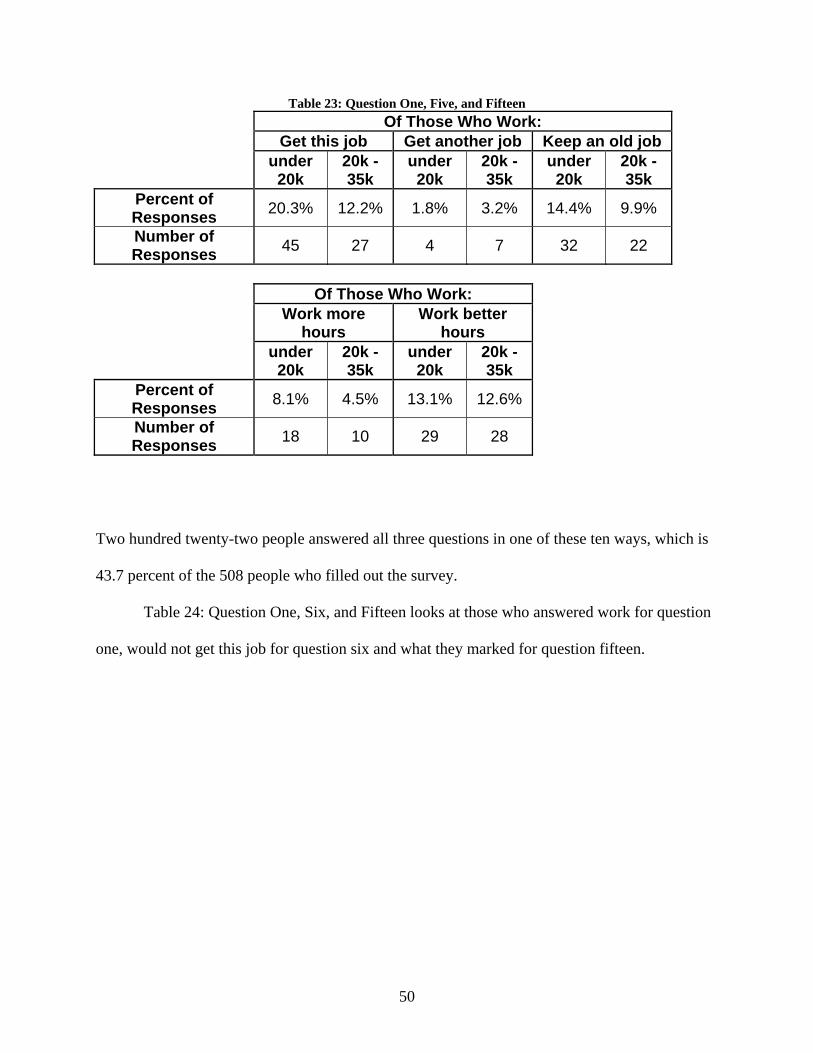
Table 23: Question One, Five, and Fifteen Of Those Who Work: Get this job Get another job Keep an old job
under 20k
20k - 35k
under 20k
20k - 35k
under 20k
20k - 35k
Percent of Responses 20.3% 12.2% 1.8% 3.2% 14.4% 9.9%
Number of Responses 45 27 4 7 32 22
Of Those Who Work:
Work more hours
Work better hours
under 20k
20k - 35k
under 20k
20k - 35k
Percent of Responses 8.1% 4.5% 13.1% 12.6%
Number of Responses 18 10 29 28
Two hundred twenty-two people answered all three questions in one of these ten ways, which is
43.7 percent of the 508 people who filled out the survey.
Table 24: Question One, Six, and Fifteen looks at those who answered work for question
one, would not get this job for question six and what they marked for question fifteen.
50

Table 24: Question One, Six, and Fifteen
Those who answered work for question one
And wouldn't have this job for question six
Under 20k
20k - 35k
35k - 45k
45k - 60k
60k - 75k
Percentage of Responses 39.5% 25.6% 13.2% 3.9% 0.8%
Number of responses 51 33 17 5 1
Those who answered work for question one
And wouldn't have this job for question six
75k - 100k
100k - 200k
200k or More Omitted
Percentage of Responses 0.0% 0.8% 0.0% 16.3%
Number of Responses 0 1 0 21
One hundred twenty-nine people fell in these categories, which is 25.4 percent of the total
number of people who filled out the survey.
We also look at hours worked per week, question thirteen, and household income:
question fifteen. These results are viewable in Table 25: Questions Thirteen and Fifteen.
51
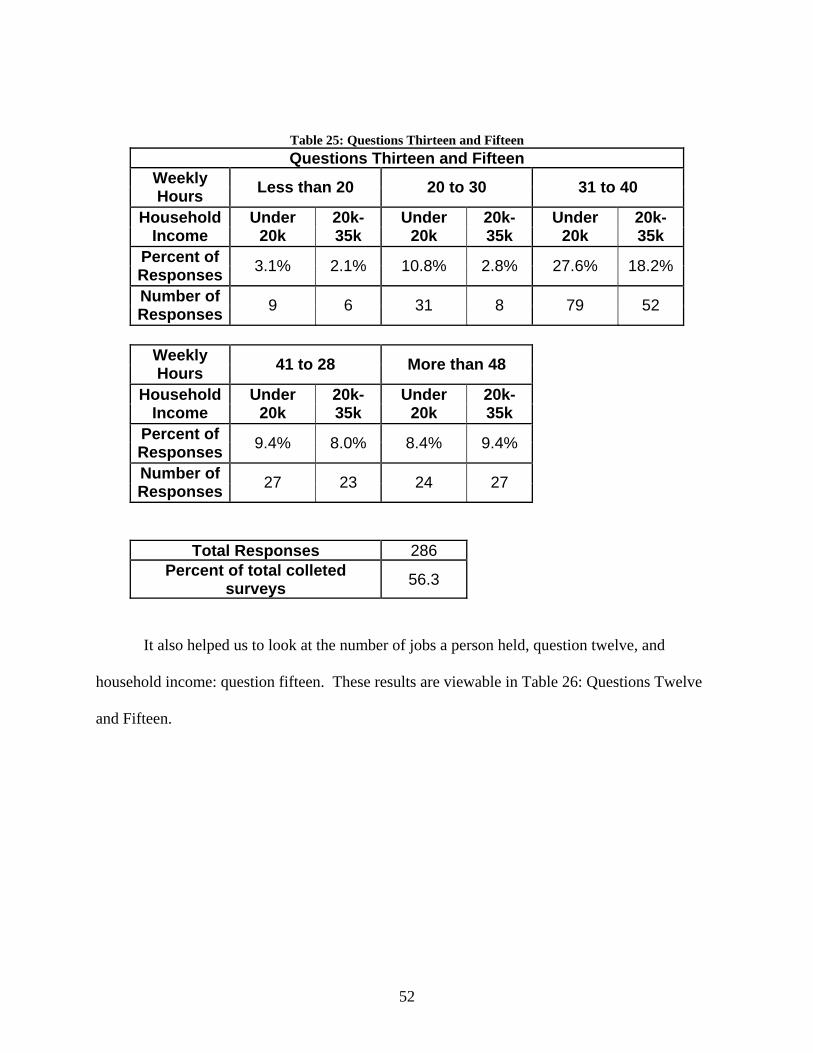
Table 25: Questions Thirteen and Fifteen Questions Thirteen and Fifteen
Weekly Hours Less than 20 20 to 30 31 to 40
Household Income
Under 20k
20k-35k
Under 20k
20k-35k
Under 20k
20k-35k
Percent of Responses 3.1% 2.1% 10.8% 2.8% 27.6% 18.2%
Number of Responses 9 6 31 8 79 52
Weekly
Hours 41 to 28 More than 48 Household
Income Under
20k 20k-35k
Under 20k
20k-35k
Percent of Responses 9.4% 8.0% 8.4% 9.4%
Number of Responses 27 23 24 27
Total Responses 286 Percent of total colleted
surveys 56.3
It also helped us to look at the number of jobs a person held, question twelve, and
household income: question fifteen. These results are viewable in Table 26: Questions Twelve
and Fifteen.
52
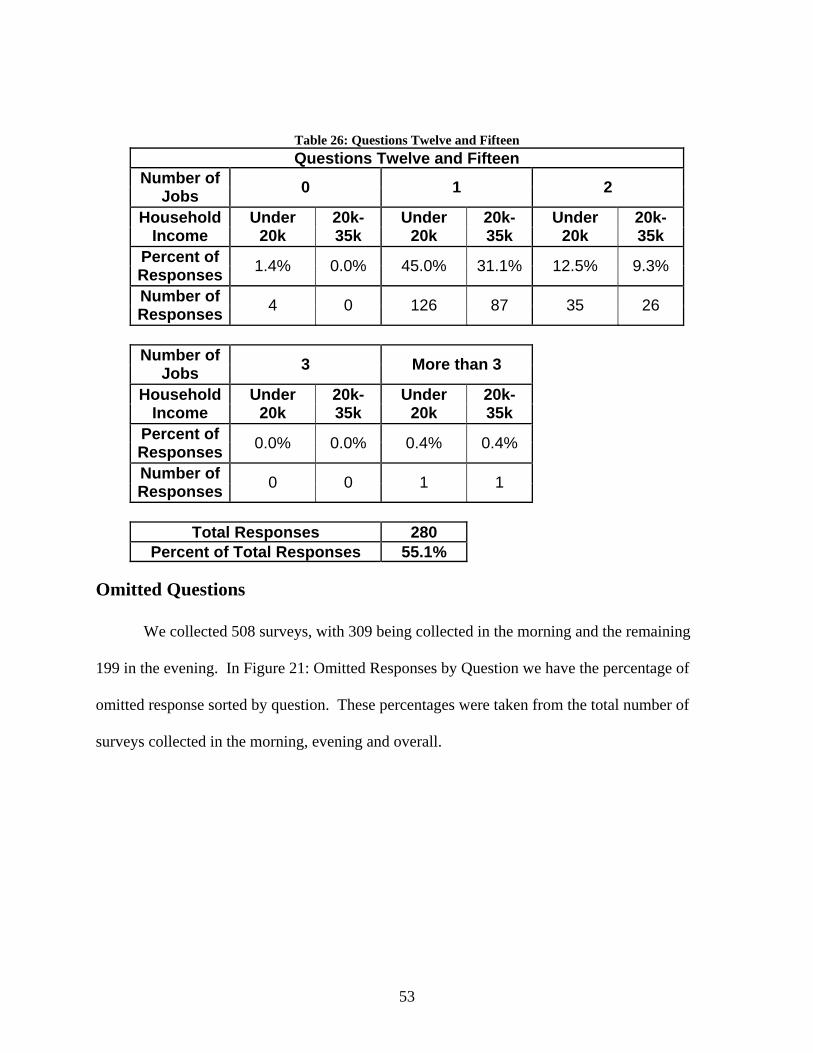
Table 26: Questions Twelve and Fifteen Questions Twelve and Fifteen
Number of Jobs 0 1 2
Household Income
Under 20k
20k-35k
Under 20k
20k-35k
Under 20k
20k-35k
Percent of Responses 1.4% 0.0% 45.0% 31.1% 12.5% 9.3%
Number of Responses 4 0 126 87 35 26
Number of
Jobs 3 More than 3 Household
Income Under
20k 20k-35k
Under 20k
20k-35k
Percent of Responses 0.0% 0.0% 0.4% 0.4%
Number of Responses 0 0 1 1
Total Responses 280
Percent of Total Responses 55.1%
Omitted Questions We collected 508 surveys, with 309 being collected in the morning and the remaining
199 in the evening. In Figure 21: Omitted Responses by Question we have the percentage of
omitted response sorted by question. These percentages were taken from the total number of
surveys collected in the morning, evening and overall.
53
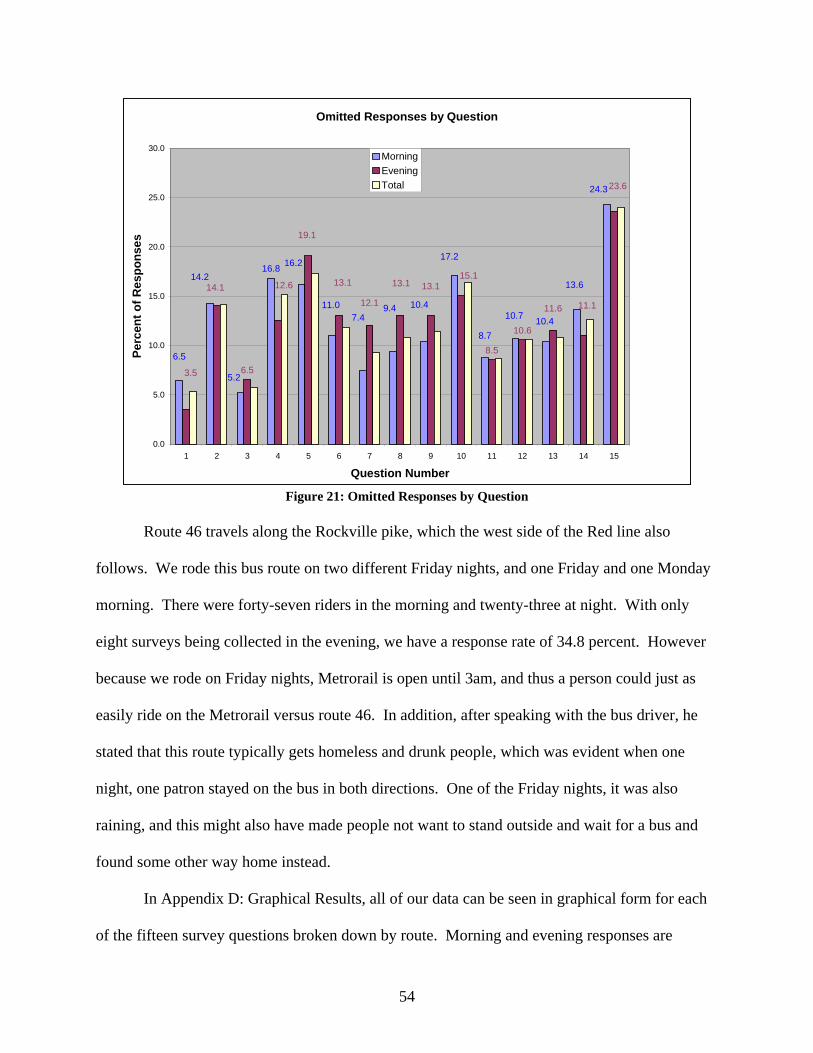
Omitted Responses by Question
16.8
6.5
8.5
10.6
24.3
13.6
10.410.7
8.7
17.2
10.49.47.4
11.0
16.2
5.2
6.5
14.2
23.6
11.111.6
15.113.113.1
12.1
13.1
19.1
12.6
3.5
14.1
0.0
5.0
10.0
15.0
20.0
25.0
30.0
1 2 3 4 5 6 7 8 9 10 11 12 13 14 15
Question Number
Perc
ent o
f Res
pons
esMorningEveningTotal
Figure 21: Omitted Responses by Question
Route 46 travels along the Rockville pike, which the west side of the Red line also
follows. We rode this bus route on two different Friday nights, and one Friday and one Monday
morning. There were forty-seven riders in the morning and twenty-three at night. With only
eight surveys being collected in the evening, we have a response rate of 34.8 percent. However
because we rode on Friday nights, Metrorail is open until 3am, and thus a person could just as
easily ride on the Metrorail versus route 46. In addition, after speaking with the bus driver, he
stated that this route typically gets homeless and drunk people, which was evident when one
night, one patron stayed on the bus in both directions. One of the Friday nights, it was also
raining, and this might also have made people not want to stand outside and wait for a bus and
found some other way home instead.
In Appendix D: Graphical Results, all of our data can be seen in graphical form for each
of the fifteen survey questions broken down by route. Morning and evening responses are
54

displayed on the same graph for each question, as well as the combined total. These graphs are
in percentages of responses.
55
Analysis
We will be analyzing the data collected from our survey focusing on the four questions
we feel most address our project goals. We will be looking at associations between different
questions to be able to draw stronger conclusions and recommendations. As there was no
significant difference in ridership between weekends and weekdays, the data was combined into
nights and mornings.
Question One: “What is the main purpose of your trip today?”
As seen in Figure 6: Response Percentage of Question One approximately seventy-six
percent of surveys collected in the evenings and approximately ninety percent of those collected
in the mornings ‘work’ for question one which leads us to believe that Ride On is achieving its
goal of helping citizens get to and from work. Furthermore, when the funding was allocated in
1998 it was used to extend the routes’ span of service into the morning and night, and it was
meant to help second and third shift workers work better hours, and not be stranded. Thus with
411 out of 481 people indicating work as their main purpose for their trip, we can conclude that
Ride On is achieving its goals of getting people into the transportation network, and to their jobs,
and other opportunities. By looking exclusively at question one, we know that Ride On is
instrumental in getting people to work, because people are using the bus during the early
morning and late evening hours for this purpose.
56
Question Five: “Did this Ride On Late Evening or Early Morning Bus Trip
Help You…”
Having forty-six riders in the evenings, and eighty-four people in the morning respond
that they were able to get their current job because of the bus service, we can deduce that
extending the span of service was a success. In addition to more jobs, people also answered they
were able to work more and better hours.
Unfortunately, we do not know how long the people using the bus were at their current
job, and thus cannot determine if the early morning or late evening hours are the only reason they
were able to keep their jobs.
Question Six: “If You Were Not Taking this Ride On Late Evening or Early
Morning Bus Trip to Get to Work, How Would You Get to this Job?”
Of the total evening responses to this question, approximately thirty-five percent
answered that they would not have their job without the addition of late night trips. With over
thirty percent unable to hold their current job, it is clear that Ride On is important to many
people.
Of those that would still be able to get to work, 20.5 percent had the option of riding a
different bus route, and seventeen percent in the morning would take a taxi. However, a taxi can
get extremely expensive. As one person whom we surveyed shared with us that if he missed the
bus (which was the last trip of the night), he would have to pay eighteen dollars for a taxi ride
home. If the service were not there at all, that would amount to ninety dollars per week.
57
One third of responses in both the evening and the morning were that the rider would not
have their job. Without their job, they might not have been able to afford to live where they do,
and therefore have to spend more money on housing so that they were somewhere where public
transportation, such as the Ride On or Metrobus, was available.
Therefore, we can conclude that the late evening and early morning service is necessary,
if for the sole purpose of economic betterment. Paying $1.25, the one-way bus trip fare, versus
$18 for a taxi to get home saves a family a substantial amount of money. The household then
has more money to spend on other necessities such as food, clothing, and shelter.
Question Fifteen: “What is Your Total Annual Household Income?”
While living on less than $20,000 a year is difficult anywhere, it is especially difficult in
an affluent suburb of a major metropolitan area, such as Montgomery County, where the
minimum annual self-sufficiency wages for a household consisting of a single adult is
approximately thirty thousand dollars43.
However, we do not know how many people live in each person’s household. If they
were making less than $20,000 and had two people in the family working, with two dependents,
then they would be having a hard time getting by, as the self-sufficiency for this family would be
approximately seventy thousand dollars. Thus with 290 riders (Table 22: Responses to Question
Fifteen) with a household income under $35,000 annually, and not knowing how many people
there are in each family, working or dependant, it is shown that more than seventy-five people
are dependant upon the extended span of service of Ride On.
43 Pearce
58
Associations When looking at Table 23: Question One, Five, and Fifteen, of those who answered
work, what the bus helped them to do (answer to question five), and whether their income fell
into the ‘$20,000 to $35,000’ or ‘under $20,000’ income bracket, almost thirty percent were able
to get their job because of the bus service. Slightly less than twenty percent were able to work
more hours, and approximately twenty-five percent were able to work better hours.
Table 24: Question One, Six, and Fifteen links those who answered that they were using
the bus for work, answered would not have this job for question six, and what their respective
incomes are. Over sixty-five percent of responses were with an income of under $35,000.
Analysis of Hours Worked vs. Household Income As seen in Table 25: Questions Thirteen and Fifteen the 27.6% of people whose
household income was under $20,000, were working forty hours a week, were not making
enough money annually to be considered self-sufficient, according to the Self Sufficiency
Standards for the Washington, D.C. Metropolitan Area44. The 18.2% making under $35,000
were only considered self sufficient if they were the only one in their household. If they had a
spouse or child, they would not be making enough money to be considered self-sufficient in
Montgomery County.
Analysis of number of Jobs vs. Income As seen in Table 26: Questions Twelve and Fifteen about thirteen percent of respondents
hold two jobs, and still make an annual household income of less than $20,000. This is under the
self-sufficiency standards for a single adult. An additional nine percent work two jobs, and earn 44 Pearce
59
between $20,000 and $35,000. This classifies as meeting self-sufficient standards for a
household with one adult, but not for one with an adult and a child, or two adults.
These associations show that the late night and early morning time expansions are crucial
in helping people enter into the transportation network and through the network, connect to their
jobs. If they are not making enough money to be considered self sufficient, they certainly are not
going to be able to afford a car. The alternative is utilizing the public transportation network,
especially the Ride On system, which is clearly being used. One dollar twenty-five cents for a
bus trip plus unlimited transfers for up to two hours is much more economical for someone who
is not earning what they need to be considered self-sufficient.
Response Rates With an overall response rate of 49.4%, we received as many completed surveys as we
expected based on our test group and past Ride On surveys. However, with many of the people
on the bus speaking Spanish, or a language other than English as their primary language, we
were unable to communicate effectively with everyone. Both having our survey printed in
Spanish and English, and showing people who said “Si” when asked if they spoke Spanish that
the survey was also printed in Spanish, helped to increase our chances of soliciting a response.
However, we did not have the survey available in every language we encountered so we were
unable to communicate with everyone.
Our initial problem was a lack of hard surfaces. We were unable to provide clipboards to
participants, and initially started out with the surveys printed on a sheet of standard letter-sized
paper. We upgraded later in the week to thicker paper.
There was also a problem with literacy, which made our response rate decline. There
were a number of riders do not read very well, or at all, and because of this, it took them a long
60
time to fill out the survey compared to other respondents. Many times this led to not having
adequate time to complete the entire survey before getting off the bus. However, our most
important questions were in the front of our survey and typically were answered.
Other people declined to take it on principle. Many people stated that they never took
surveys and were not going to take this one either. We thanked them for their time and went on
to the next person. In the mornings, a fair number of people would not take it because they were
too tired, and it was too early.
We also had a problem with the lighting on the bus. The bus driver typically had the
light in the very front of the bus off, so he would be able to see well. When we asked some
people sitting in the front of the bus, they said they could not see the survey, and more times than
not, there was no other place to sit. Others needed their glasses to fill out the survey, and did not
have their glasses with them. Still others wished to take it home with them and send it back to
us. This was not feasible for our survey due to time constraints.
There was also a noticeable difference in who actually surveyed the respective bus riders.
As Tim was asked once if he was a police officer, it was quite apparent that the riders were a bit
more suspicious of Tim and Kenny as opposed to Corinne. In addition to this, it was noticed that
people in the front of the bus were more receptive to being surveyed as opposed to those back of
the bus.
With all of these factors, it can be concluded that if one of us had spoken Spanish, we
would have collected more surveys. In addition, if we had at least one more person on our team,
we could have read the surveys to people who were unable to read, had problems with the light,
or forgot their glasses if they were willing to participate. Also by having a fourth person in the
61
group we could have rode more buses. Despite all these challenges, we still had a respectable
response rate of 49.4%.
We were unable to count how many people were speaking Spanish or another language
on the respective bus trips. However, according to the customer satisfaction survey conducted
by Ride On in December of 2004, twenty-four percent of all riders were Hispanic. A quarter of
the surveys we received were in Spanish. However, this number seems low based on whom we
noticed on the buses. We are sure that if one of us had spoken Spanish that these people would
have been less suspicious of us, and thus been more inclined to fill out the survey. Some were
also bilingual and might have filled it out in English as opposed to Spanish. In addition, when
we passed out the survey, we did not always have the Spanish side showing. Thus, they might
have thought it was only in English and declined to take it.
Overall Data As seen in Figure 16: Response Percentage of Question Eleven almost seventy-five
percent of responders do not have a car available to them. This means that these riders rely
heavily on public transportation. Thus, we see how important Ride On is for people who are
trying to get into the transportation network.
Looking at Figure 21: Omitted Responses by Question we see that there were a large
percentage of omitted responses for every question. However, questions three through six were
only to be answered by those whose current bus trip was related to work. Out of 508 collected
surveys, question three had twenty-nine omits, question four had seventy-seven, question five
had eighty-eight, and question six had sixty. If the data set was perfect, and everyone who was
using the bus for work filled out every question, the omitted answers for questions three through
six would be the same. However, they are not. There are a few reasons that may explain these
62
discrepancies lie. As people willingly filled out the survey, they may have chosen to leave
certain questions blank because they might have thought it was too intrusive, or for personal
reasons. They also may have assumed which questions were the most important to us, and just
skipped certain questions because it was thought to be irrelevant. Some may also have started to
fill out the survey and then realized that they had to get off the bus quicker than they thought.
This would account for why questions four, five, and six had more omits than question three.
However, they are also more intrusive questions, which lead to people being less willing to
answer them.
The latter questions on the survey may also have a greater amount of omits due to being
placed later on the survey. People that got off the bus early would not answer them, and the
most intrusive question was last. Thus for the most part, the number of omits gradually
increased over the survey questions.
Question ten also had many omitted responses. This question asked what other forms of
transportation were used during ones trip other than Ride On. There was not a place to circle
that they only used Ride On, and thus if they only used Ride On, then they left it blank.
Question fifteen had the greatest percentage of omits at about twenty-four percent. A few
reasons that this occurred include that it was the last question on the survey, and is the most
intrusive. Many people do not wish to share their income levels, even on an anonymous survey.
Comments
Our survey contained a place for riders to voice any additional comments not covered by
a previous question. Some of the riders that refused to fill out surveys volunteered comments,
which were written down. Some of the responses were "keep up the good work" and "be on
time.” Comments on the survey were left in both English and Spanish, and the most numerous
63
comment was "be on time.” Many riders expressed an interest in having higher capacity buses
during rush hour, and/or having buses come more frequently. Both of these are solutions to ease
crowding. Additionally, many riders requested an express bus connecting the Lakeforest Transit
Center and the Shady Grove Metro Station, two of the busiest stops on a route, where a majority
of people boarded or disembarked the bus. Another frequent comment was to have the busses’
schedules coordinate better so that connections were not as tight with Metrorail, Metrobus, and
other Ride On routes.
There were many comments expressing a desire for further expansion of the span of
service. Three people wanted twenty-four hour service, but the majority wanted certain routes to
run later or earlier. Due to the fact that Metro has expanded its operating hours since these
extension went into effect, these buses no longer meet the first or last trains, and should therefore
be rescheduled so that the do. This can be seen in the comments that suggest “start[ing] at 4 am
everyday” or “earlier service.” If a bus route took approximately forty-five minutes to complete,
and began at 4:00 am, the bus would meet with the first train of the day at 5:00 am.
Aside from the routes that we specifically rode, passengers expressed only one route that
corresponded with any of the original routes targeted in 1998 to have their times extended. This
was route 75, which in 1999 serviced the Urbana Park and Ride lot and the Shady Grove Metro
Station. The route has since changed to service the Urbana Park and Ride and the Germantown
Transit Center (GTC).
It is interesting and important to note the extensive growth that Germantown has
experienced in recent years. There are currently eight bus routes that service the GTC. The
GTC is the central place where the Germantown routes come to, to then move people into the
transportation network. This is accomplished through either route 100, which is an express bus
64
from the GTC to the Shady Grove Metro Station or by a normal route, which transports
passengers south towards the District. There are also 232 TANF cases in Germantown at this
time according to the Health and Human Services of Montgomery County45. This is seventeen
more than Rockville, which has been a developed area much longer.
The route 75 bus, which someone expressed an interest in increasing its span of service,
travels north, past Germantown. In general, the farther one lives from the District of Columbia,
the cheaper housing becomes. With this in mind, it can be seen why people would live so far
from Washington, D.C., yet still commute to the city via Ride On.
The other routes with time extensions requests were routes 10, 48, 49, 54, 57, 58, and 64.
These routes service some of the same areas that the eight studied routes did. Interestingly, four
of these routes have unique starting and ending points. The other four are not unique and start
and end at the same place as other routes currently in the program. Two of the ‘unique’ routes
mentioned both had the same starting and ending points, while no other Ride On route did.
These routes begin and end at places already serviced by other buses with extended hours;
however, they travel into different areas that these buses. One of the zip codes was 20886, which
according to Health and Human services had thirty-one TANF cases alone. Bus routes 57 or 58
service areas within the 20879 zip code where there are twenty-eight TANF cases. With this
additional information, we can see why these riders would want to extend the time span on these
bus routes.
With Montgomery County ever changing, the TANF areas originally outlined may not
hold true today. This is a good indicator to why only one of the original routes other than the
ones already with time extensions was mentioned with requests for later or earlier service. In
addition, with three of the original routes no longer in service, and eight others with changes to 45 Pearce
65
the routes, they are no longer going to the same places they were in 1998 when they were
originally targeted.
All of the routes we rode traveled through TANF neighborhoods. Our data of where
TANF cases were is by zip code, and thus we cannot pinpoint exactly where the TANF cases are
with respect to the bus routes. However, with these routes originally chosen as the most likely to
succeed, based on our results and analysis of income and all the other factors we see that Ride
On was correct in this assumption. All comments can be found in Appendix E: Comments.
Verification There were 508 total surveys returned, 309 of which were in the morning, and 199 in the
evening. When looking at the data in these respective groups from a statistical point, we have
enough data for this to be considered a valid representation of the late evening and early morning
ridership population as a whole.
We manually imputed all of our data, and thus human error is a potential source of error.
However, we realized that it would be better to have multiple sets of eyes look over the imputed
data and check for mistakes. One of us imputed the data while another looked over the data once
it was inputted to make sure there were no discrepancies.
Trips We Rode
With the Ride On master book of routes, we were able to determine the percent of times
we rode each bus route in the morning before 6 am, and the ones in the evening based on the
original times given to us. Approximately forty percent of the overall routes in the morning were
ridden and surveyed. With their being forty-one possible trips before 6 am, we feel that having
ridden sixteen of them was a good representation of the whole. A lot of the trips lasted so long,
66

that riding them on the way back to our original point would have been during rush hour, and
thus out of the times we were supposed to be surveying. Also with fifteen weekday mornings,
the fact that we surveyed sixteen shows that we surveyed one route every morning, and two on
one morning.
In the evenings, we ended up riding over forty-five percent of the routes. It was slightly
harder to determine the number of potential routes to ride, as the info sheet on the extended hour
routes had some as early as 8:00pm, where others were not until 11:00 pm. It was determined
that there were a total of forty-five routes we could have ridden, and we rode twenty-one of
these.
The weekends were harder to schedule, as we only had six mornings and six evenings of
possible surveying. Since Saturdays and Sundays follow different schedules, we really only had
three Sunday mornings and evenings and three Saturday mornings and evenings. This in turn
meant that one route would not be covered on the weekends. This route ended up being the 46.
In addition, because the routes are not always the same bus going there and back, it was much
harder to cover all the routes. However, Saturday morning we covered 54.5 percent of the routes
outline for the 16, 20 and 59. Saturday night we rode routes 5, 16, and 59, where we covered
18.2 percent. Sunday morning, we covered about thirty-eight percent of the routes.
With the low percentages of coverage on weekends, we would not have enough data for it
to be considered statistically valid. With additional time to carry out the surveys, we would then
have sufficient data, but it can be assumed that if Ride On extended the time span on these
routes, that they are being used for work, and to get into the transportation network. When
looking at just weekdays however, we wish we could have collected more data.
67
When looking at all of the factors, such as income, whether ride on helped riders to get
their job, if riders have access to a car or not, we know that Ride On is helping people get into
the transportation network for work during the late evening and early morning hours. When
taking in to account the self sufficiency standards, and seventy-five percent having an income of
less than $35,000, we know that their livelihood is dependant upon public transportation as only
a single adult can be considered self sufficient when making almost $30,000 in Montgomery
County. Without Ride On’s early morning and late evening service, people would have to spend
more money on transportation and may no longer be able to afford other necessities.
68

Recommendations
Based on the results and analysis of survey responses and comments written on the surveys
we are making the following recommendations to Ride On:
• Re-examine where current TANF areas are in the county.
• Evaluate the feasibility of increasing the span of service on the seven routes we rode as
well as on other routes that go through the updated TANF area: Specifically the thirty
routes originally looked at for this service, and the additional eight routes mentioned by
riders.
• Make the first trips of the current eight routes earlier allowing these buses to meet the
first Metrorail trains of the day.
• Increase the size of the buses, especially during rush hour, and investigate the possibility
of using articulating buses.
• Increase the frequency of buses during the morning rush hour on the seven routes we
rode, especially routes 55 and 59.
• Add an express route from the Lakeforest Transit Center to Shady Grove Metro Station.
Additionally, we recommend that the wording of some questions from past Ride On
surveys be altered. For example, question five from our survey Appendix C: Our Survey was
taken from a pervious Ride On Access to Jobs program survey. The response “get another job”
can be interpreted different ways: that this service helped them get a second or third job, or it
can be interpreted as this service helped them get a completely new job.
If certain questions are only to be answered by those who answered a previous question,
the dependent questions should be visually designated as such. For example, indenting this
section, or putting these questions in a box would accomplish this.
69
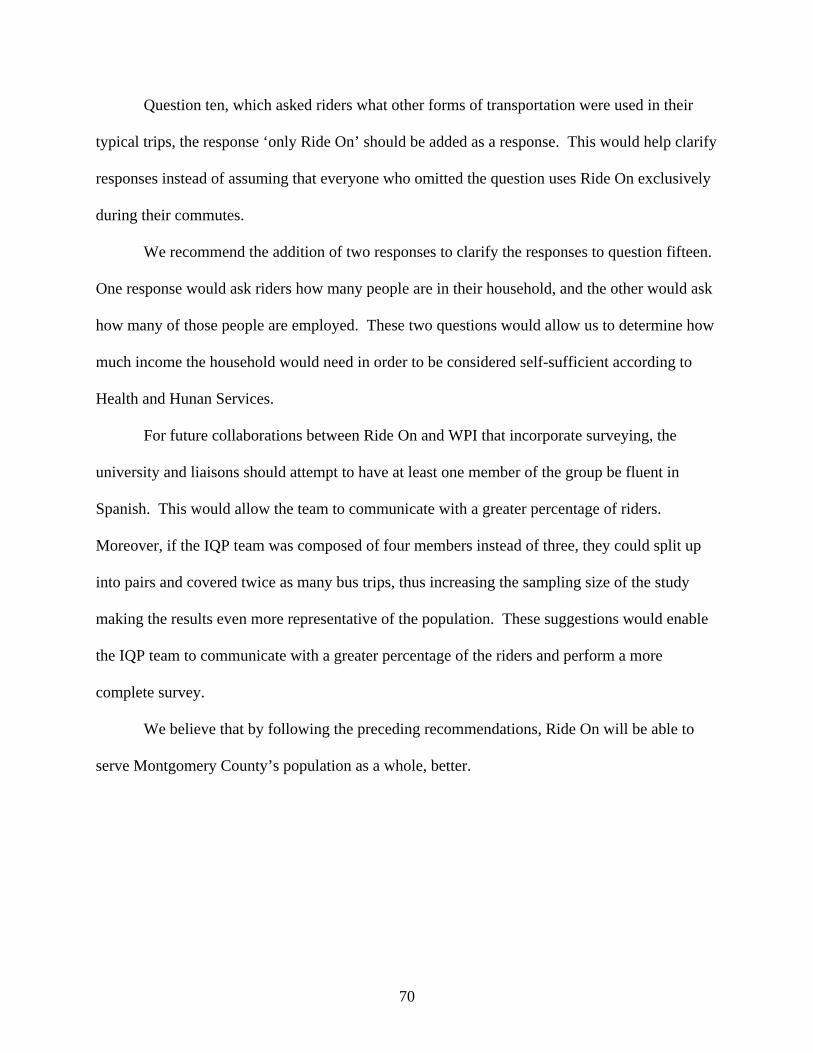
Question ten, which asked riders what other forms of transportation were used in their
typical trips, the response ‘only Ride On’ should be added as a response. This would help clarify
responses instead of assuming that everyone who omitted the question uses Ride On exclusively
during their commutes.
We recommend the addition of two responses to clarify the responses to question fifteen.
One response would ask riders how many people are in their household, and the other would ask
how many of those people are employed. These two questions would allow us to determine how
much income the household would need in order to be considered self-sufficient according to
Health and Hunan Services.
For future collaborations between Ride On and WPI that incorporate surveying, the
university and liaisons should attempt to have at least one member of the group be fluent in
Spanish. This would allow the team to communicate with a greater percentage of riders.
Moreover, if the IQP team was composed of four members instead of three, they could split up
into pairs and covered twice as many bus trips, thus increasing the sampling size of the study
making the results even more representative of the population. These suggestions would enable
the IQP team to communicate with a greater percentage of the riders and perform a more
complete survey.
We believe that by following the preceding recommendations, Ride On will be able to
serve Montgomery County’s population as a whole, better.
70
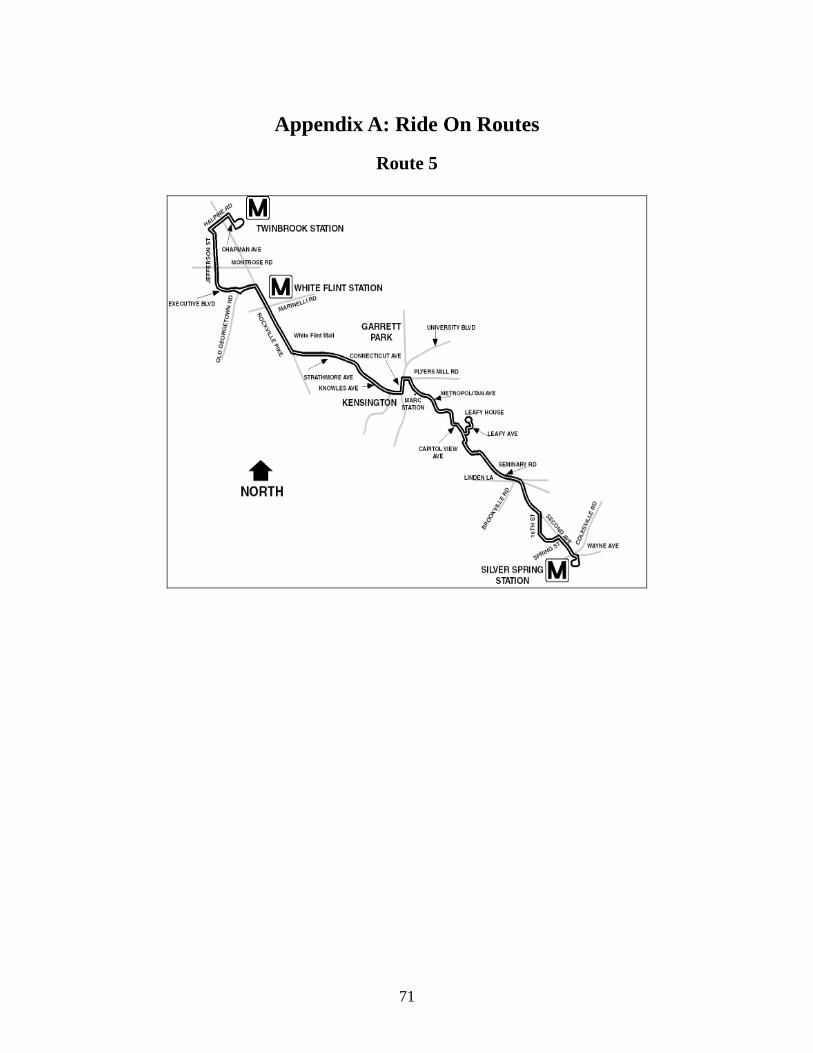
Appendix A: Ride On Routes
Route 5
71
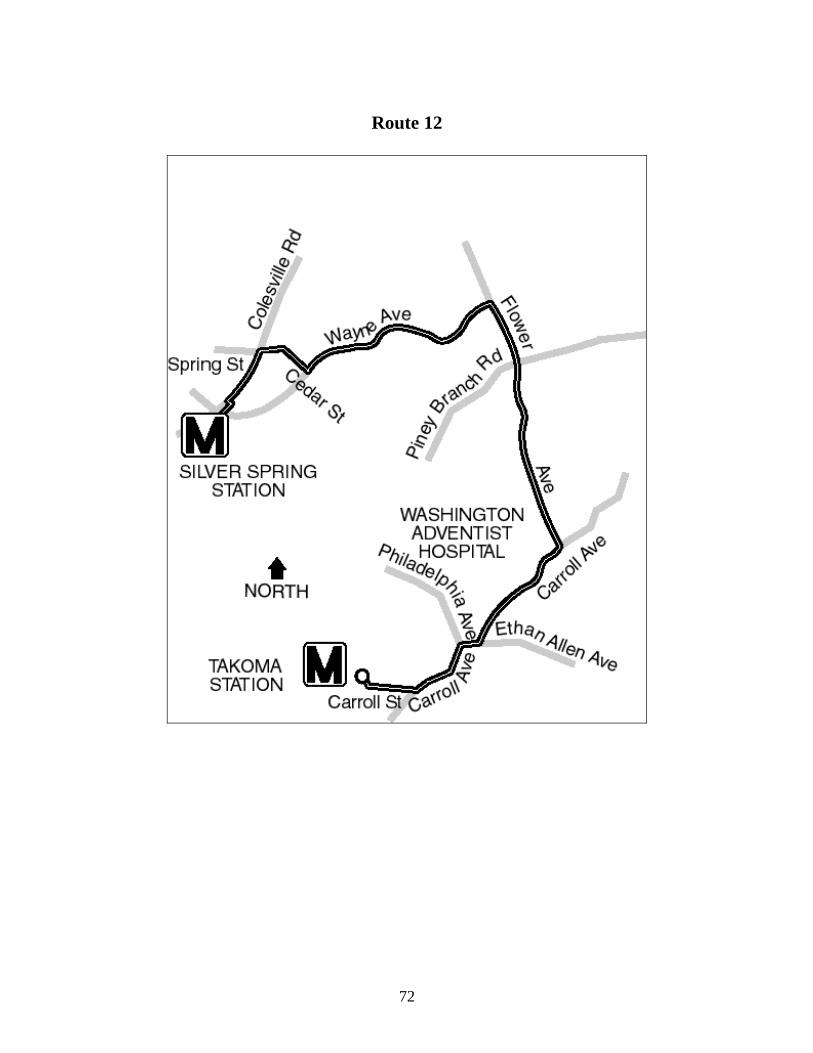
Route 12
72
Route 16
73
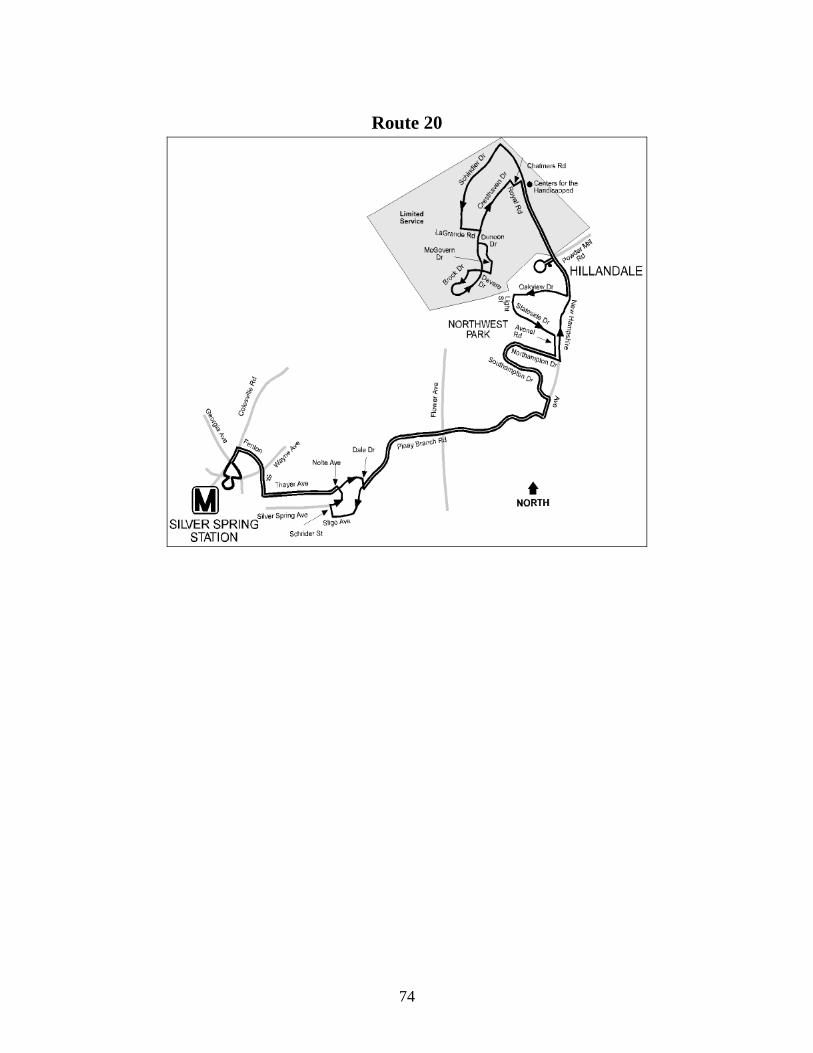
Route 20
74
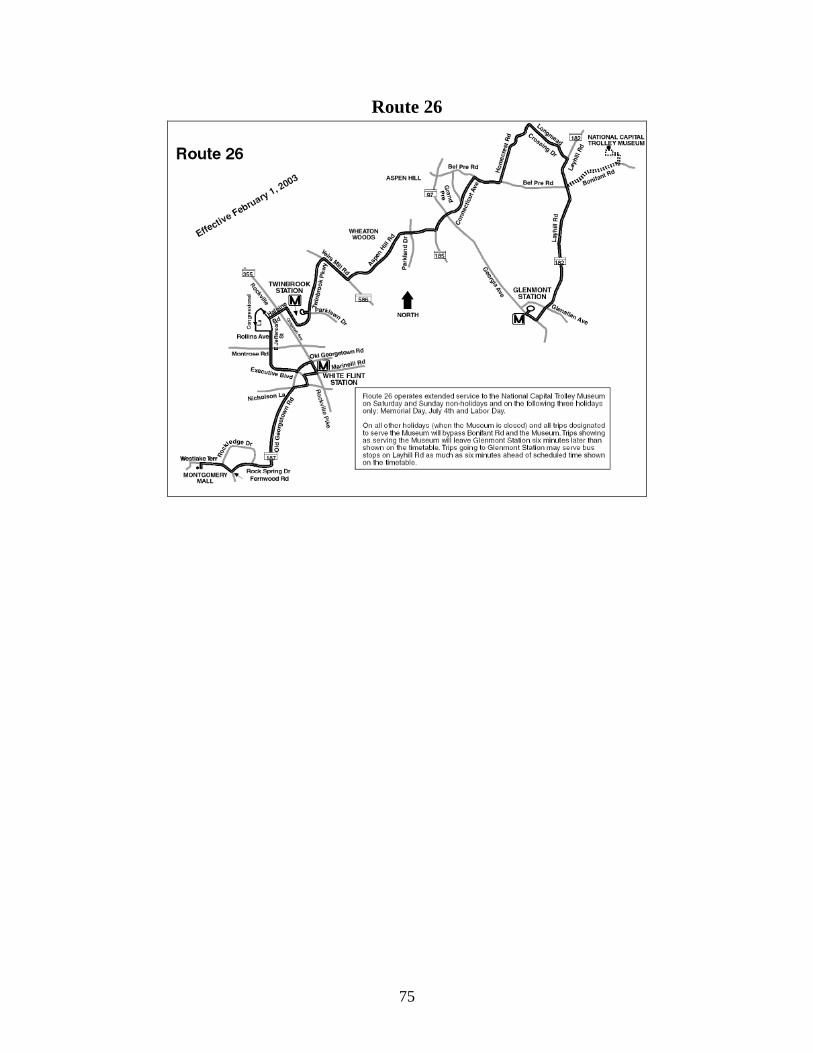
Route 26
75
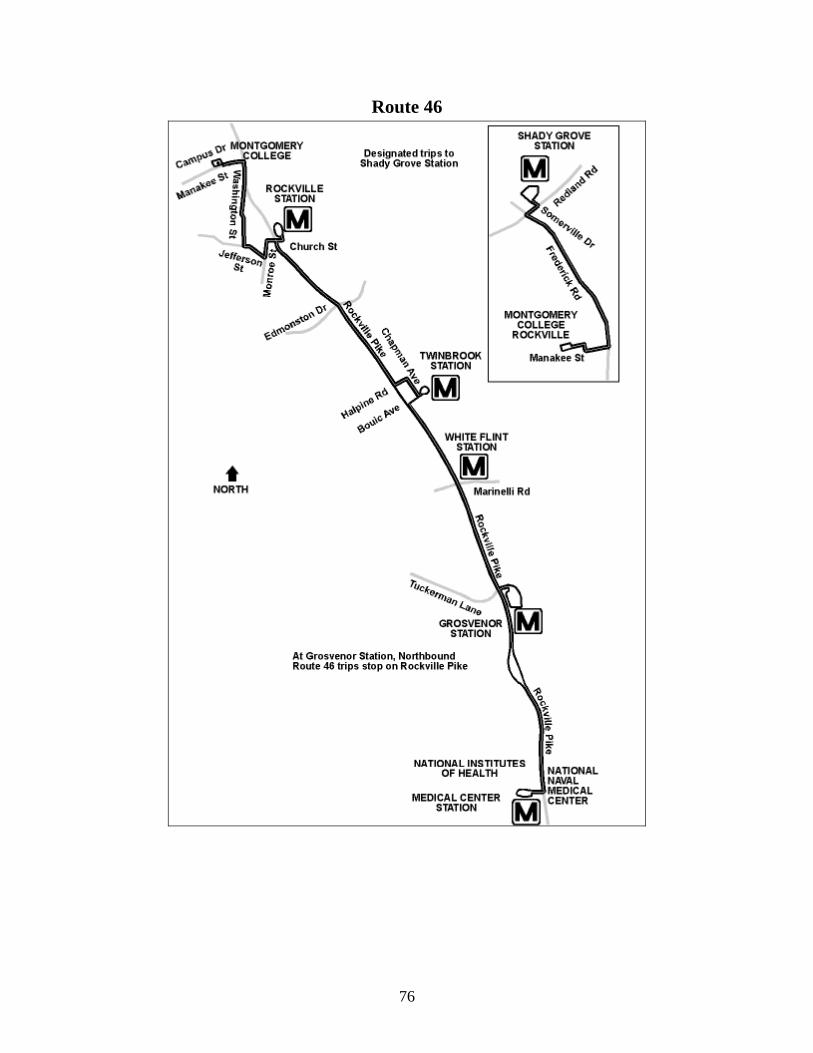
Route 46
76
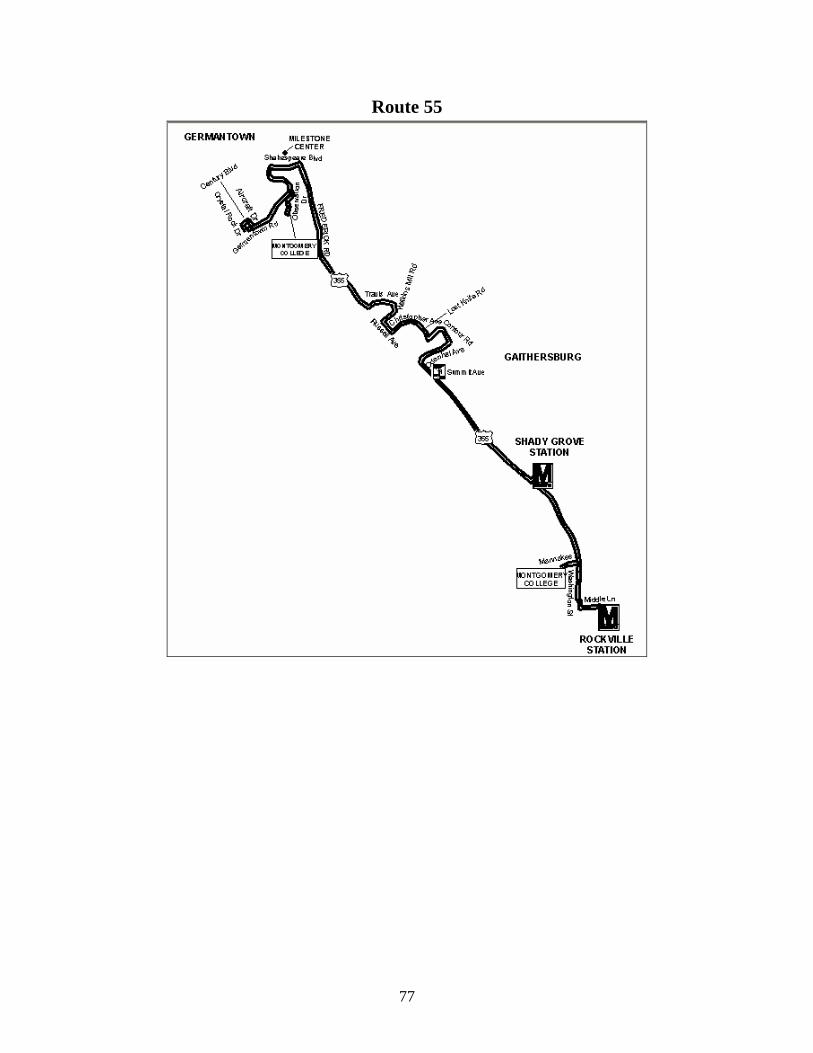
Route 55
77
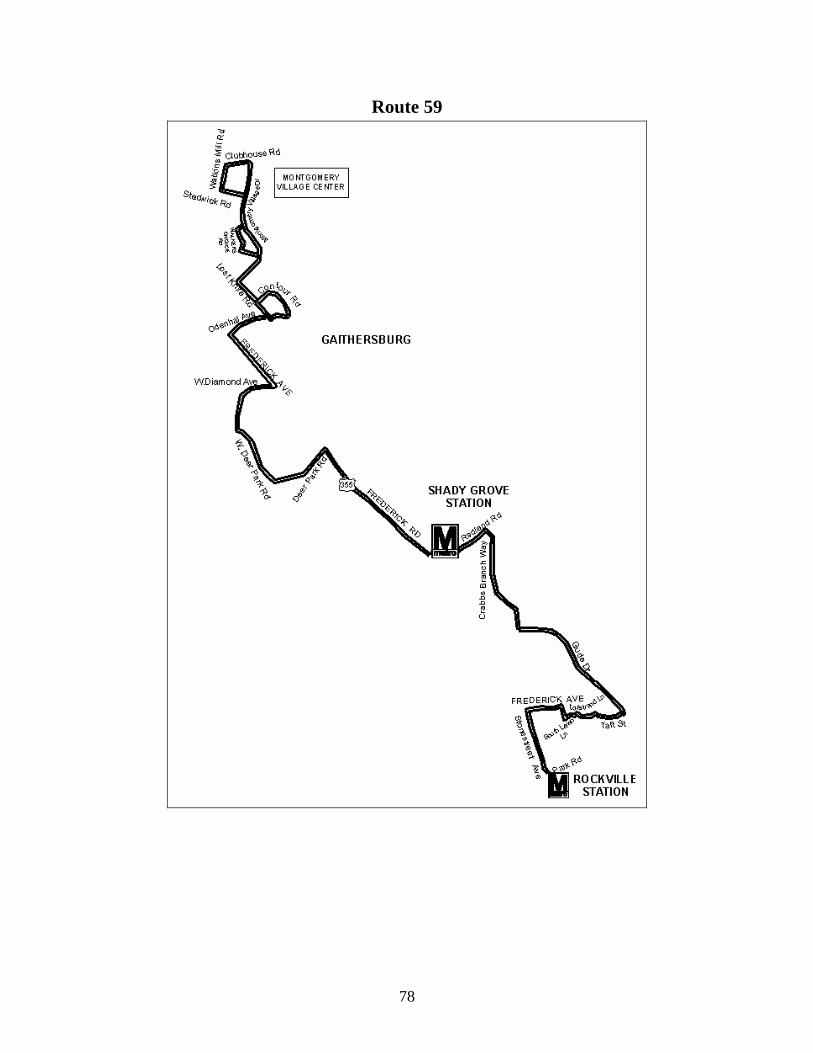
Route 59
78

Appendix B: Past Ride On Surveys
Customer Satisfaction Survey
79
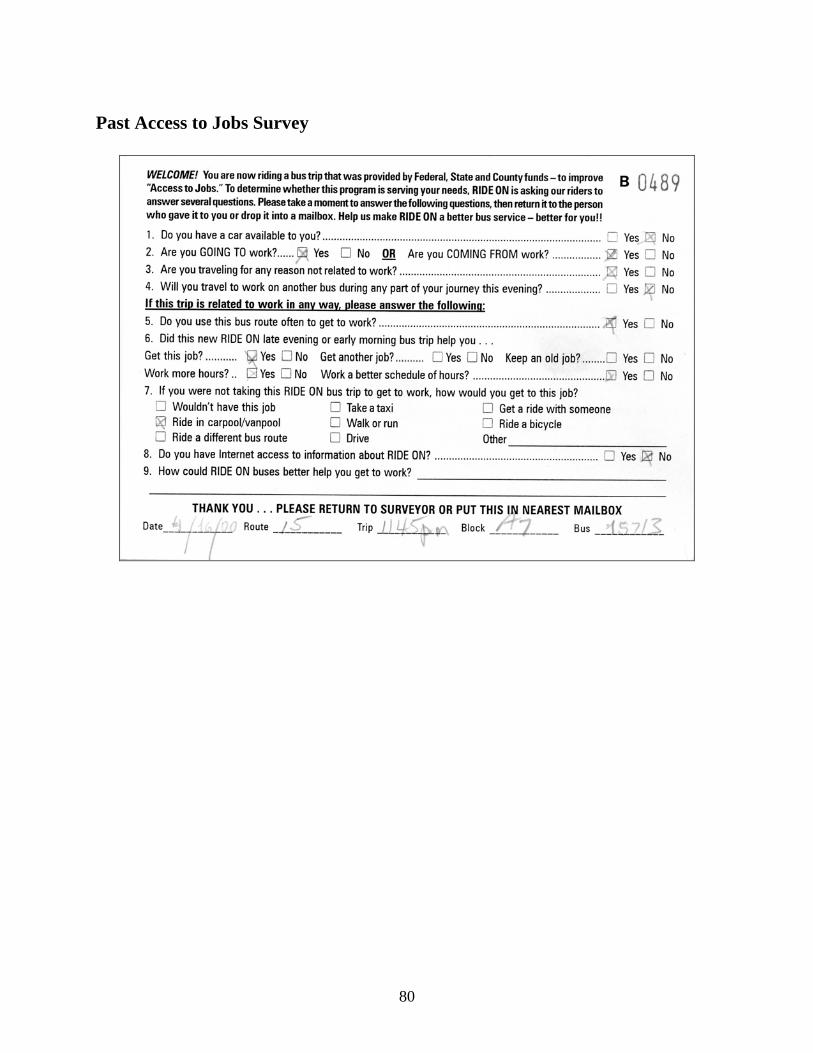
Past Access to Jobs Survey
80
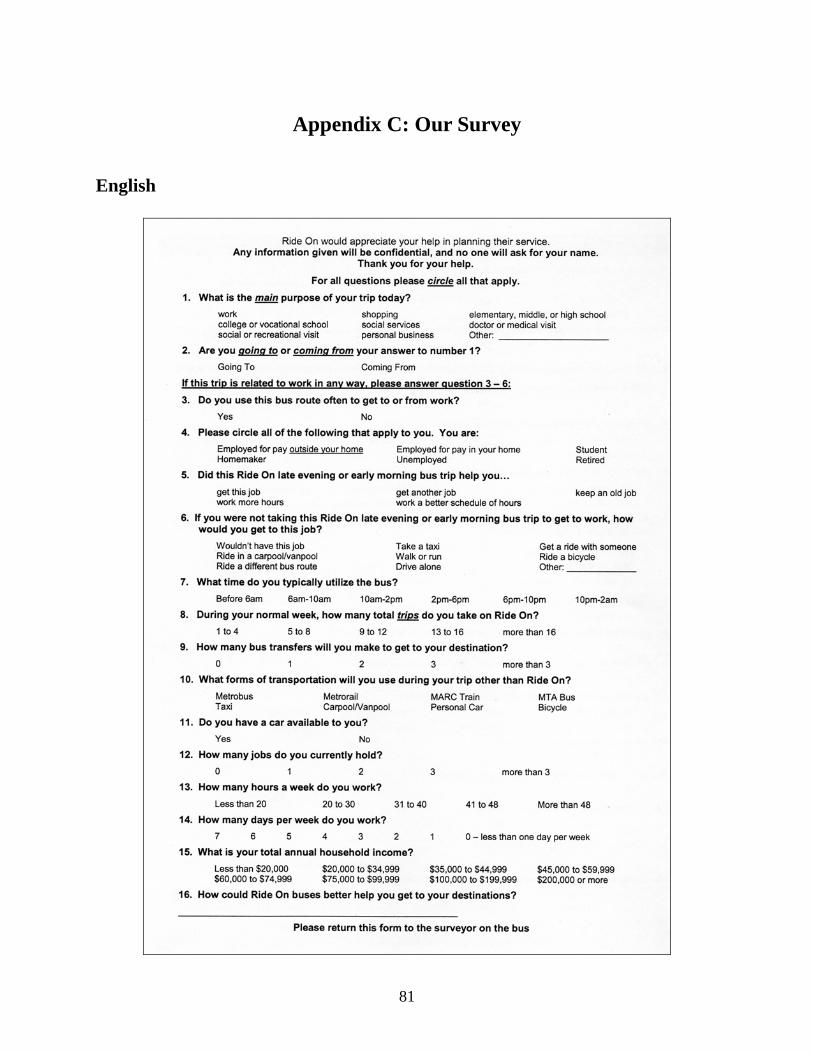
Appendix C: Our Survey
English
81
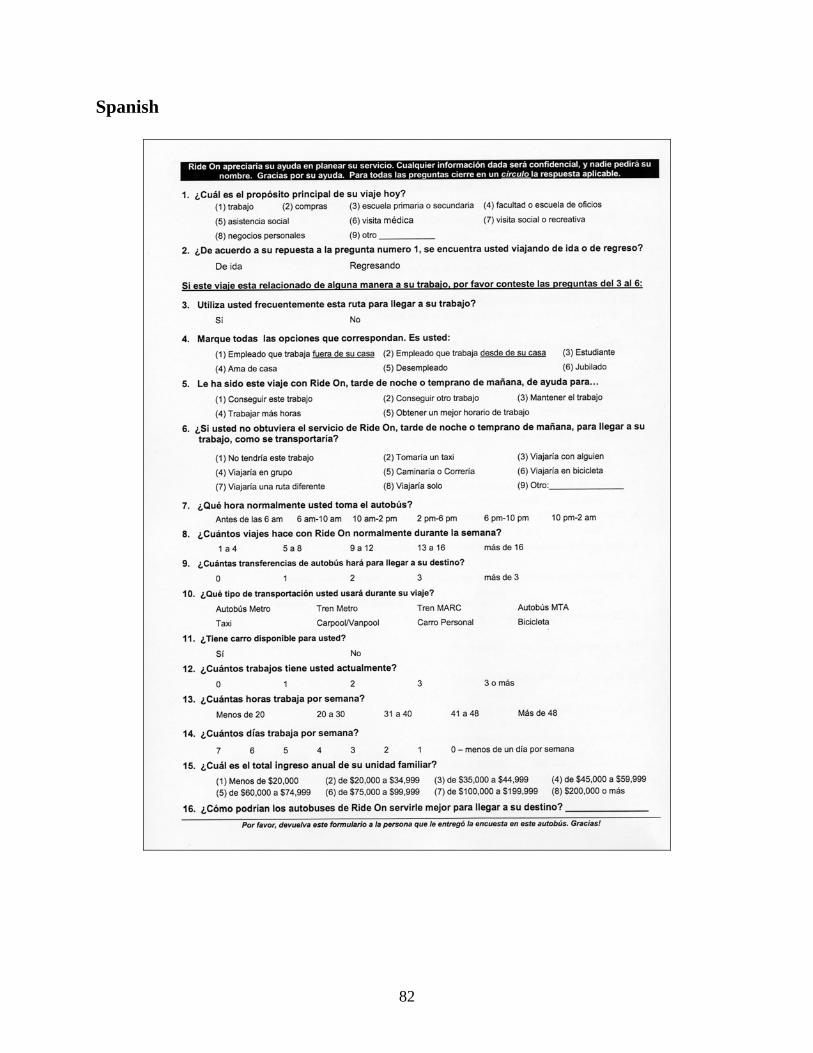
Spanish
82
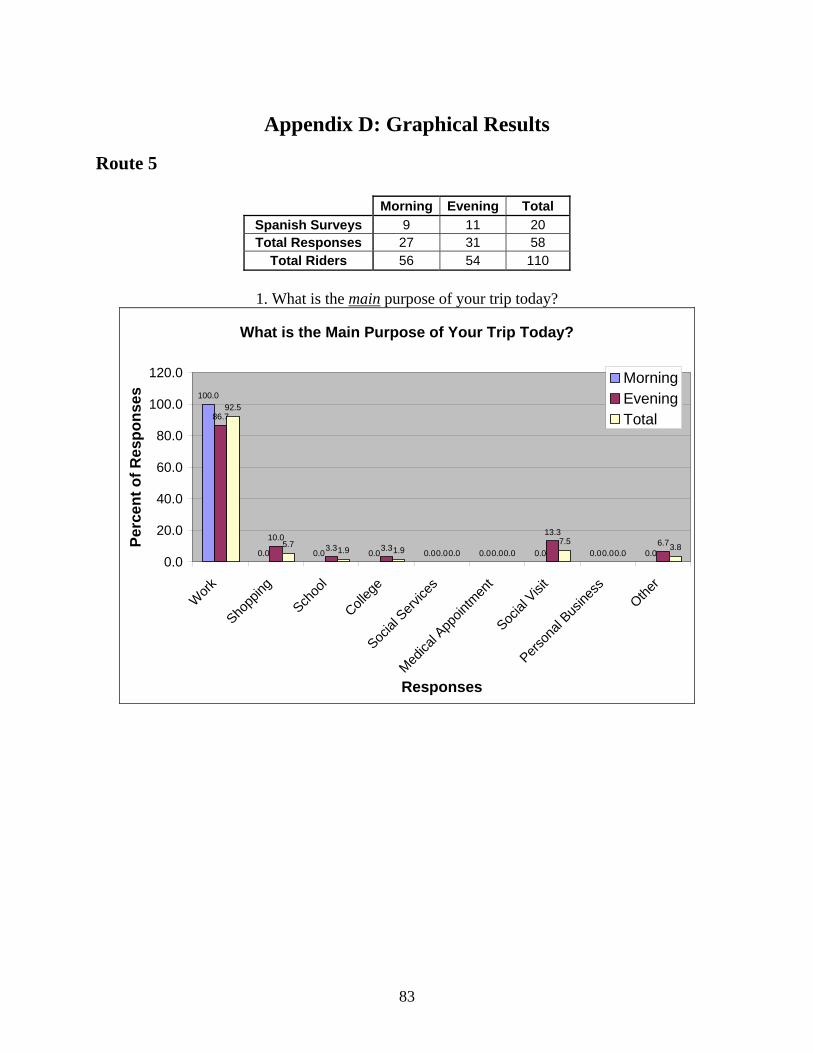
Appendix D: Graphical Results
Route 5
Morning Evening Total Spanish Surveys 9 11 20 Total Responses 27 31 58
Total Riders 56 54 110
1. What is the main purpose of your trip today?
What is the Main Purpose of Your Trip Today?
100.0
0.0 0.0 0.0 0.0 0.0 0.0 0.0 0.0
86.7
10.03.3 3.3 0.0 0.0
13.3
0.06.7
92.5
5.71.9 1.9 0.0 0.0
7.50.0
3.8
0.0
20.0
40.0
60.0
80.0
100.0
120.0
Work
Shopp
ing
Schoo
l
Colleg
e
Social
Serv
ices
Medica
l App
ointm
ent
Social
Visi
t
Person
al Bus
iness
Other
Responses
Perc
ent o
f Res
pons
es
MorningEveningTotal
83

2. Are you going to or coming from the main purpose of your trip?
Are You Going To or Coming From the Main Purpose of Your Trip?
100.0
0.0
50.053.8
73.5
28.6
0.0
20.0
40.0
60.0
80.0
100.0
120.0
Going To Coming From
Responses
Perc
ent o
f Res
pons
es
MorningEveningTotal
3. Do you use this bus route often to get to or from work?
Do You Use this Bus Route Often to Get to or From Work?
100.0
0.0
93.5
6.5
96.5
3.5
0.0
20.0
40.0
60.0
80.0
100.0
120.0
Yes No
Responses
Perc
ent o
f Res
pons
es
MorningEveningTotal
84
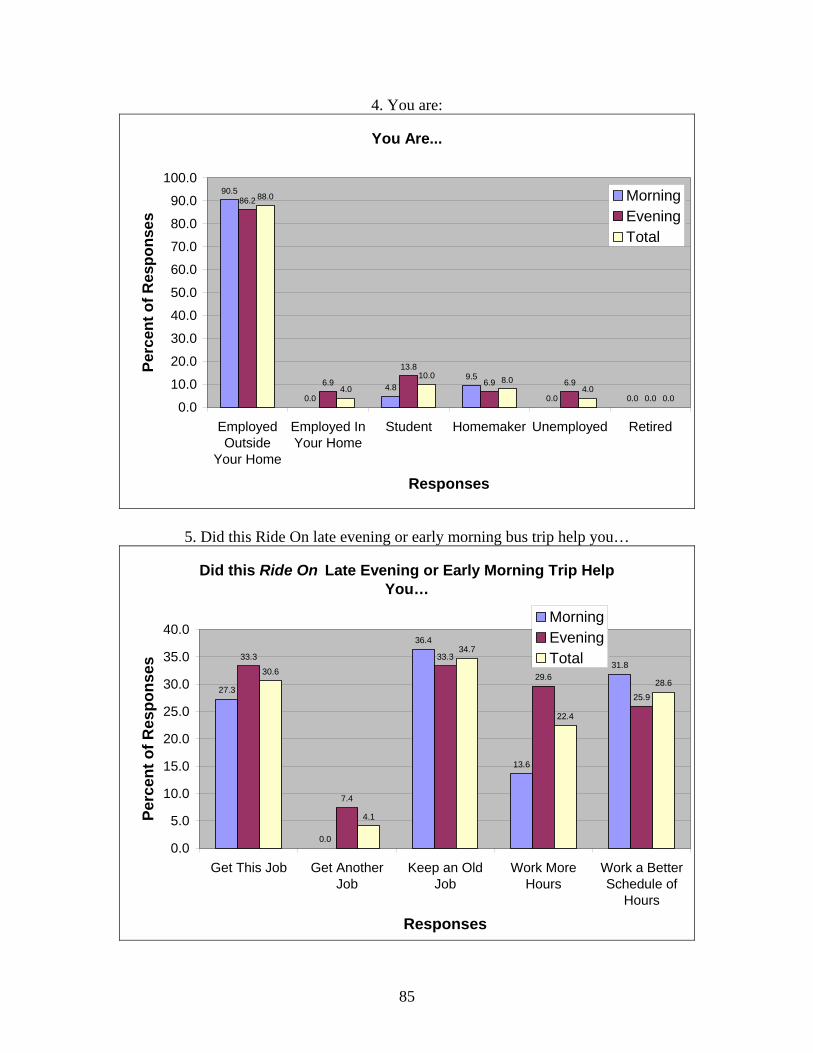
4. You are:
You Are...
90.5
0.04.8
9.5
0.0 0.0
86.2
6.9
13.8
6.9 6.9
0.0
88.0
4.010.0 8.0
4.00.0
0.0
10.0
20.0
30.0
40.0
50.0
60.0
70.0
80.0
90.0
100.0
EmployedOutside
Your Home
Employed InYour Home
Student Homemaker Unemployed Retired
Responses
Perc
ent o
f Res
pons
es
MorningEveningTotal
5. Did this Ride On late evening or early morning bus trip help you…
Did this Ride On Late Evening or Early Morning Trip Help You…
27.3
0.0
36.4
13.6
31.833.3
7.4
33.3
29.6
25.9
30.6
4.1
34.7
22.4
28.6
0.0
5.0
10.0
15.0
20.0
25.0
30.0
35.0
40.0
Get This Job Get AnotherJob
Keep an OldJob
Work MoreHours
Work a BetterSchedule of
Hours
Responses
Perc
ent o
f Res
pons
es
MorningEveningTotal
85
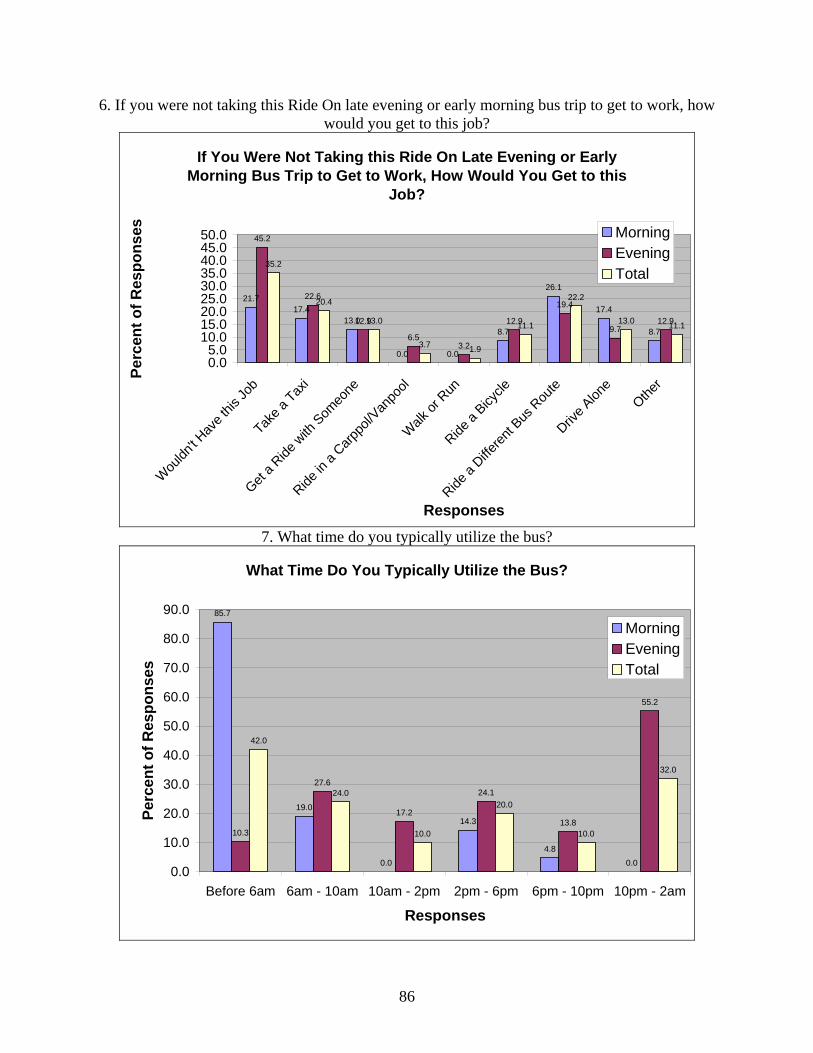
6. If you were not taking this Ride On late evening or early morning bus trip to get to work, how would you get to this job?
If You Were Not Taking this Ride On Late Evening or Early Morning Bus Trip to Get to Work, How Would You Get to this
Job?
21.717.4
13.0
0.0 0.0
8.7
26.1
17.4
8.7
45.2
22.6
12.9
6.53.2
12.9
19.4
9.712.9
35.2
20.4
13.0
3.7 1.9
11.1
22.2
13.0 11.1
0.05.0
10.015.020.025.030.035.040.045.050.0
Wou
ldn't H
ave t
his Jo
b
Take a
Taxi
Get a R
ide w
ith S
omeo
ne
Ride in
a Carp
pol/V
anpo
ol
Walk
or R
un
Ride a
Bicycle
Ride a
Differen
t Bus
Rou
te
Drive A
lone
Other
Responses
Perc
ent o
f Res
pons
es MorningEveningTotal
7. What time do you typically utilize the bus?
What Time Do You Typically Utilize the Bus?
85.7
19.0
0.0
14.3
4.80.0
10.3
27.6
17.2
24.1
13.8
55.2
42.0
24.0
10.0
20.0
10.0
32.0
0.0
10.0
20.0
30.0
40.0
50.0
60.0
70.0
80.0
90.0
Before 6am 6am - 10am 10am - 2pm 2pm - 6pm 6pm - 10pm 10pm - 2am
Responses
Perc
ent o
f Res
pons
es
MorningEveningTotal
86
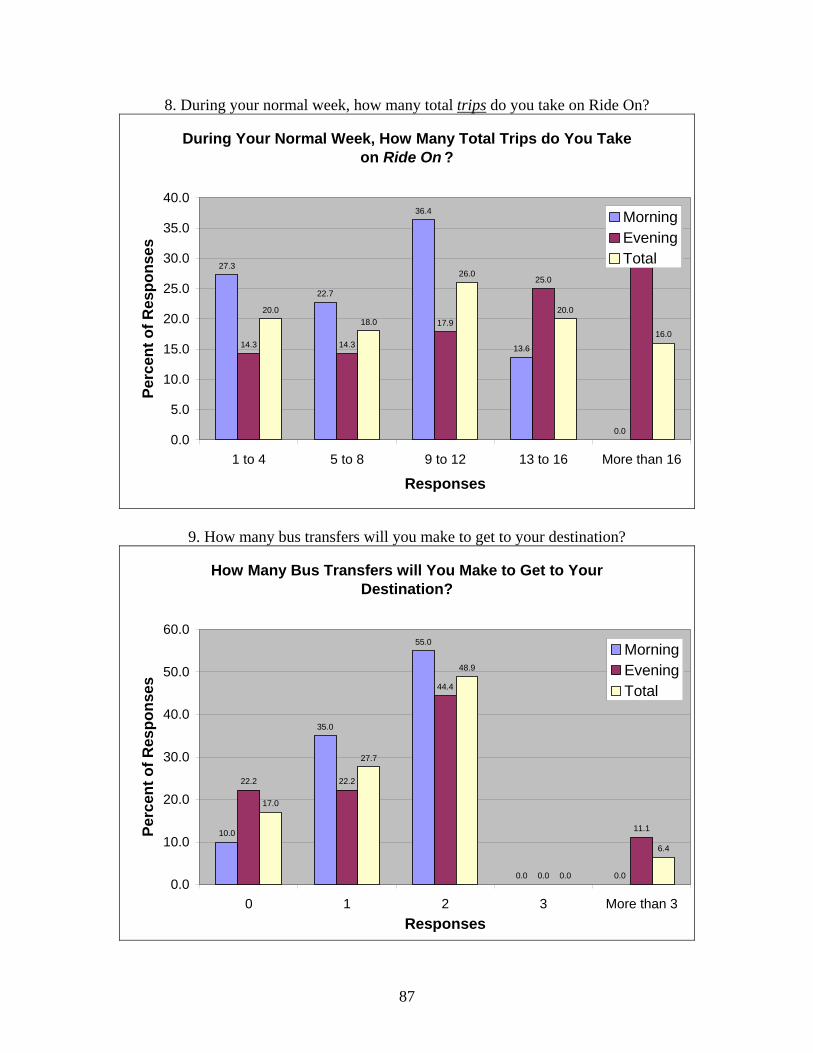
8. During your normal week, how many total trips do you take on Ride On?
During Your Normal Week, How Many Total Trips do You Take on Ride On ?
27.3
22.7
36.4
13.6
0.0
14.3 14.3
17.9
25.0
28.6
20.018.0
26.0
20.0
16.0
0.0
5.0
10.0
15.0
20.0
25.0
30.0
35.0
40.0
1 to 4 5 to 8 9 to 12 13 to 16 More than 16
Responses
Perc
ent o
f Res
pons
es
MorningEveningTotal
9. How many bus transfers will you make to get to your destination?
How Many Bus Transfers will You Make to Get to Your Destination?
10.0
35.0
55.0
0.0 0.0
22.2 22.2
44.4
0.0
11.1
17.0
27.7
48.9
0.0
6.4
0.0
10.0
20.0
30.0
40.0
50.0
60.0
0 1 2 3 More than 3Responses
Perc
ent o
f Res
pons
es
MorningEveningTotal
87
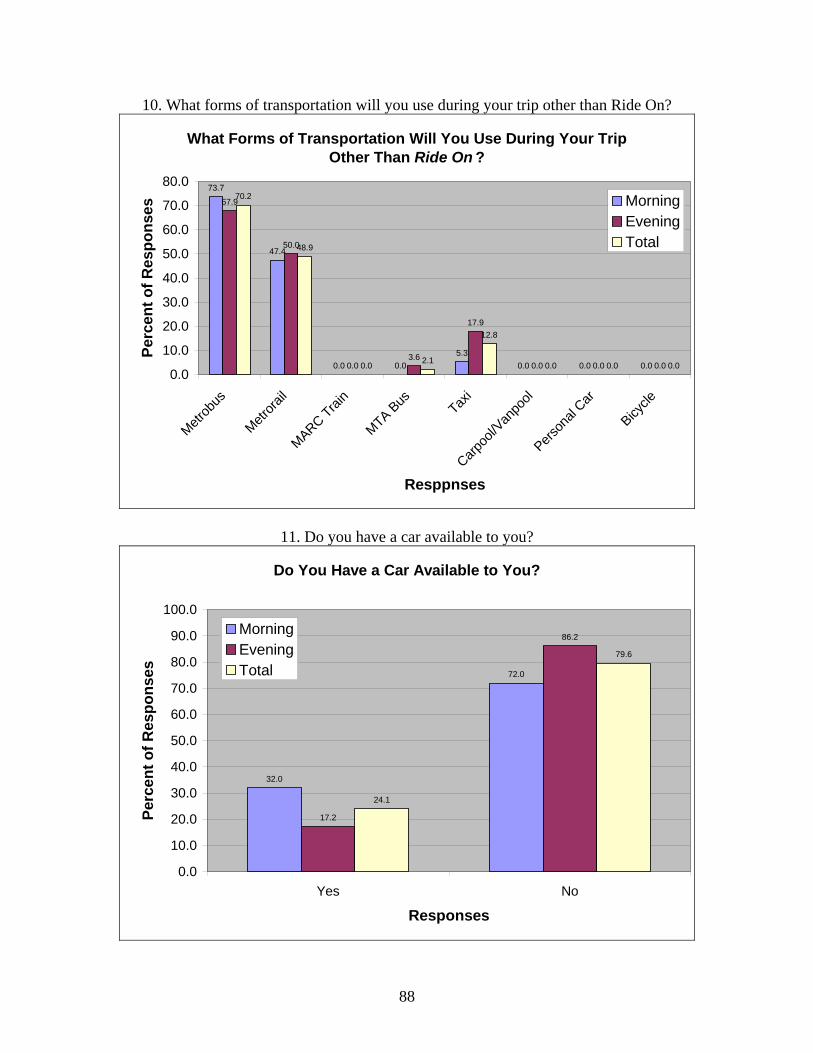
10. What forms of transportation will you use during your trip other than Ride On?
What Forms of Transportation Will You Use During Your Trip Other Than Ride On ?
73.7
47.4
0.0 0.05.3
0.0 0.0 0.0
67.9
50.0
0.03.6
17.9
0.0 0.0 0.0
70.2
48.9
0.0 2.1
12.8
0.0 0.0 0.00.0
10.0
20.0
30.0
40.0
50.0
60.0
70.0
80.0
Metrob
us
Metrora
il
MARC Train
MTA Bus Taxi
Carpoo
l/Van
pool
Person
al Car
Bicycle
Resppnses
Perc
ent o
f Res
pons
es MorningEveningTotal
11. Do you have a car available to you?
Do You Have a Car Available to You?
32.0
72.0
17.2
86.2
24.1
79.6
0.0
10.0
20.0
30.0
40.0
50.0
60.0
70.0
80.0
90.0
100.0
Yes No
Responses
Perc
ent o
f Res
pons
es
MorningEveningTotal
88
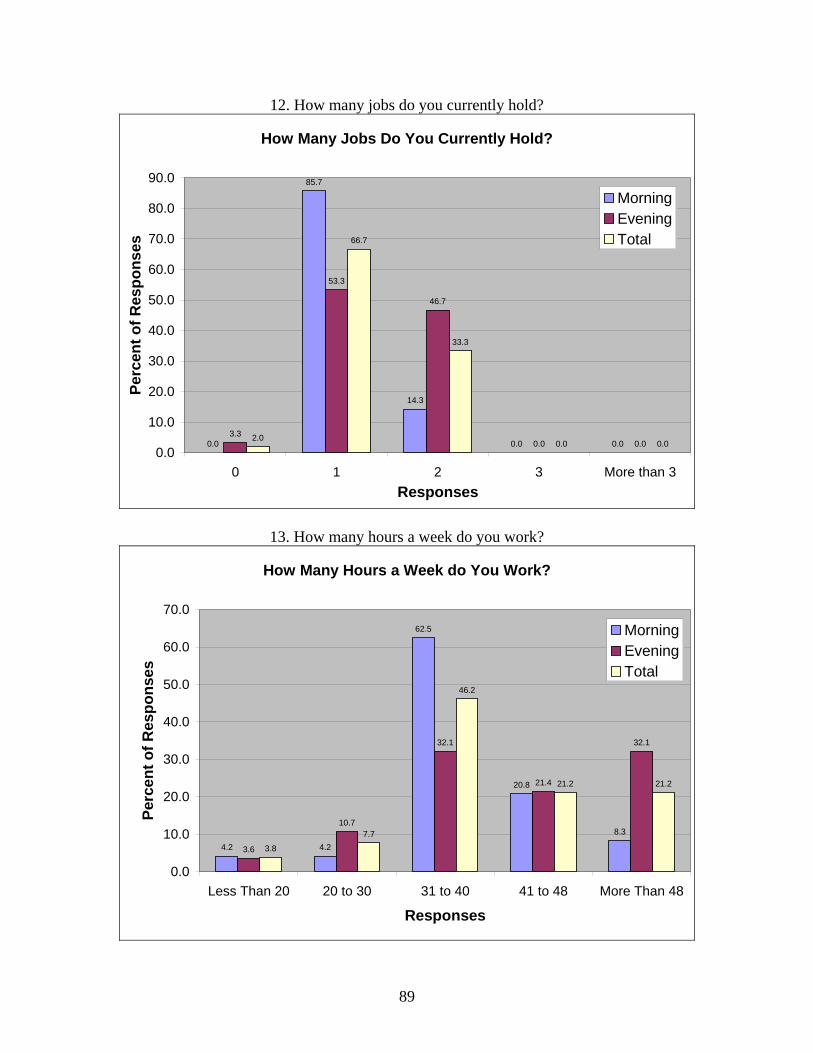
12. How many jobs do you currently hold?
How Many Jobs Do You Currently Hold?
0.0
85.7
14.3
0.0 0.03.3
53.3
46.7
0.0 0.02.0
66.7
33.3
0.0 0.00.0
10.0
20.0
30.0
40.0
50.0
60.0
70.0
80.0
90.0
0 1 2 3 More than 3Responses
Perc
ent o
f Res
pons
es
MorningEveningTotal
13. How many hours a week do you work?
How Many Hours a Week do You Work?
4.2 4.2
62.5
20.8
8.3
3.6
10.7
32.1
21.4
32.1
3.8
7.7
46.2
21.2 21.2
0.0
10.0
20.0
30.0
40.0
50.0
60.0
70.0
Less Than 20 20 to 30 31 to 40 41 to 48 More Than 48
Responses
Perc
ent o
f Res
pons
es
MorningEveningTotal
89
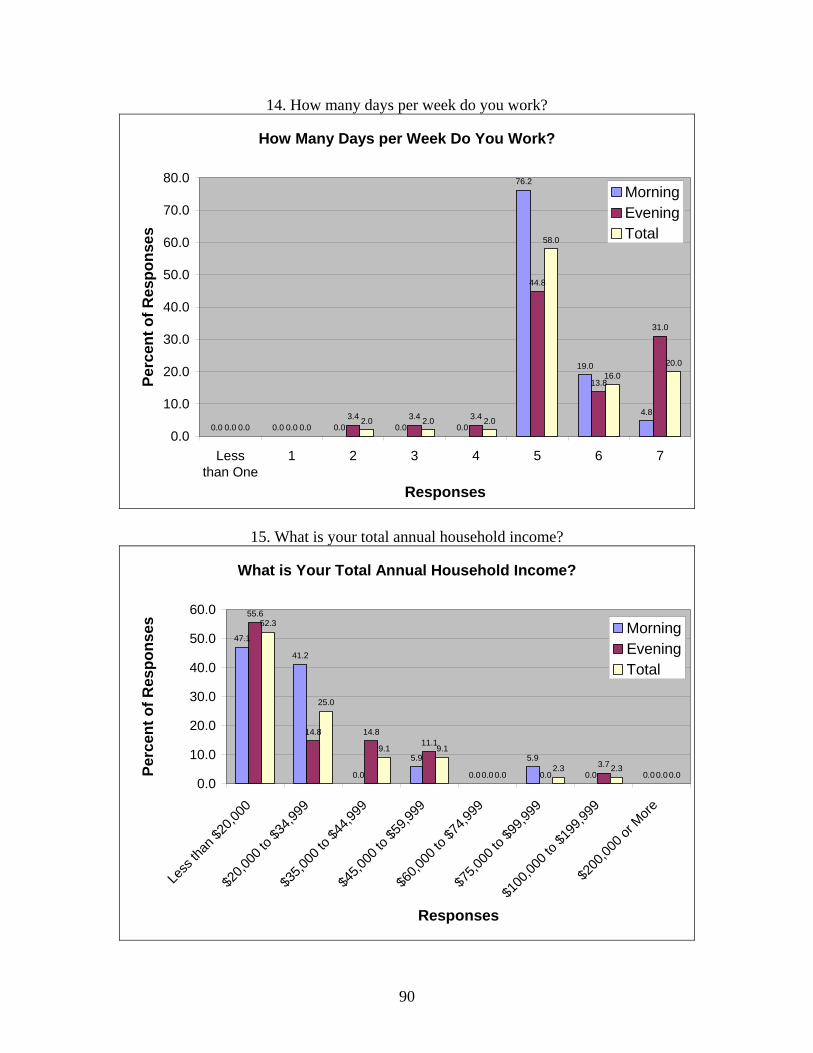
14. How many days per week do you work?
How Many Days per Week Do You Work?
0.0 0.0 0.0 0.0 0.0
76.2
19.0
4.8
0.0 0.03.4 3.4 3.4
44.8
13.8
31.0
0.0 0.02.0 2.0 2.0
58.0
16.020.0
0.0
10.0
20.0
30.0
40.0
50.0
60.0
70.0
80.0
Lessthan One
1 2 3 4 5 6 7
Responses
Perc
ent o
f Res
pons
es
MorningEveningTotal
15. What is your total annual household income?
What is Your Total Annual Household Income?
47.1
41.2
0.0
5.9
0.0
5.9
0.0 0.0
55.6
14.8 14.811.1
0.0 0.03.7
0.0
52.3
25.0
9.1 9.1
0.02.3 2.3
0.00.0
10.0
20.0
30.0
40.0
50.0
60.0
Less
than
$20,0
00
$20,0
00 to
$34,9
99
$35,0
00 to
$44,9
99
$45,0
00 to
$59,9
99
$60,0
00 to
$74,9
99
$75,0
00 to
$99,9
99
$100
,000 t
o $19
9,999
$200
,000 o
r More
Responses
Perc
ent o
f Res
pons
es MorningEveningTotal
90
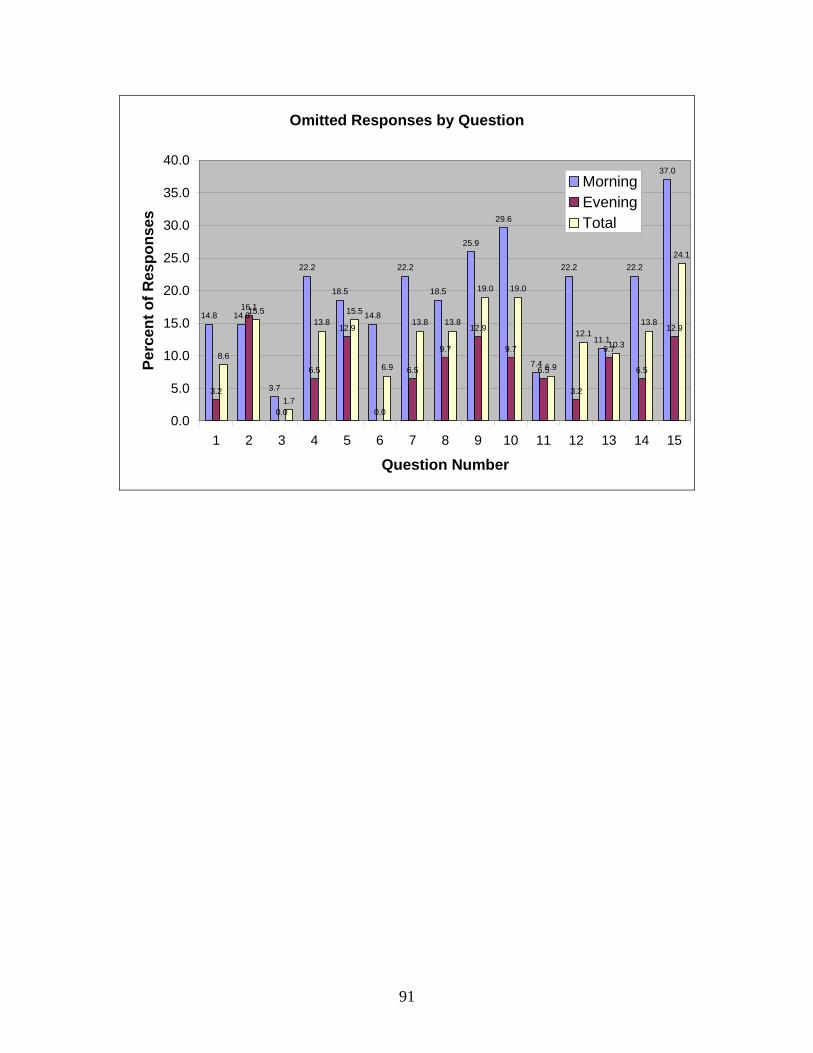
Omitted Responses by Question
14.8 14.8
3.7
22.2
18.5
14.8
22.2
18.5
25.9
29.6
7.4
22.2
11.1
22.2
37.0
3.2
16.1
0.0
6.5
12.9
0.0
6.5
9.7
12.9
9.7
6.5
3.2
9.7
6.5
12.9
8.6
15.5
1.7
13.815.5
6.9
13.8 13.8
19.0 19.0
6.9
12.110.3
13.8
24.1
0.0
5.0
10.0
15.0
20.0
25.0
30.0
35.0
40.0
1 2 3 4 5 6 7 8 9 10 11 12 13 14 15
Question Number
Perc
ent o
f Res
pons
es
MorningEveningTotal
91
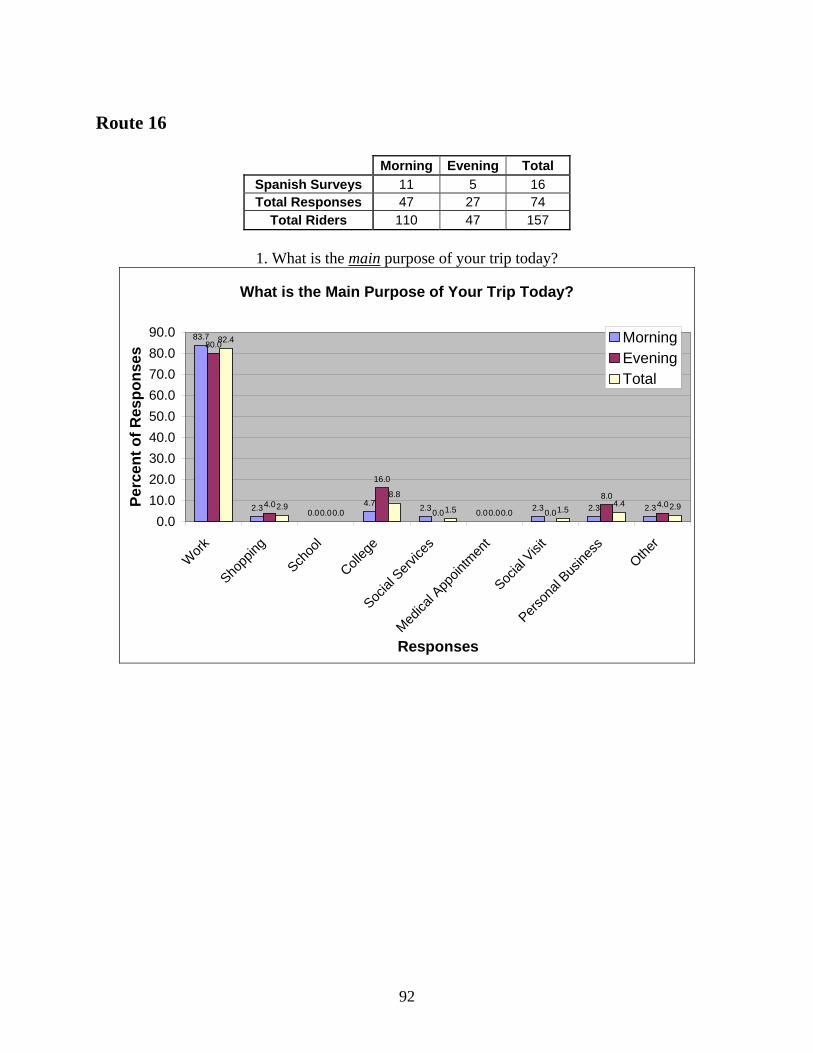
Route 16
Morning Evening Total Spanish Surveys 11 5 16 Total Responses 47 27 74
Total Riders 110 47 157
1. What is the main purpose of your trip today?
What is the Main Purpose of Your Trip Today?
83.7
2.3 0.04.7 2.3 0.0 2.3 2.3 2.3
80.0
4.00.0
16.0
0.0 0.0 0.0
8.04.0
82.4
2.90.0
8.8
1.5 0.0 1.54.4 2.9
0.010.020.030.040.050.060.070.080.090.0
Work
Shopp
ing
Schoo
l
Colleg
e
Social
Serv
ices
Medica
l App
ointm
ent
Social
Visi
t
Person
al Bus
iness
Other
Responses
Perc
ent o
f Res
pons
es
MorningEveningTotal
92
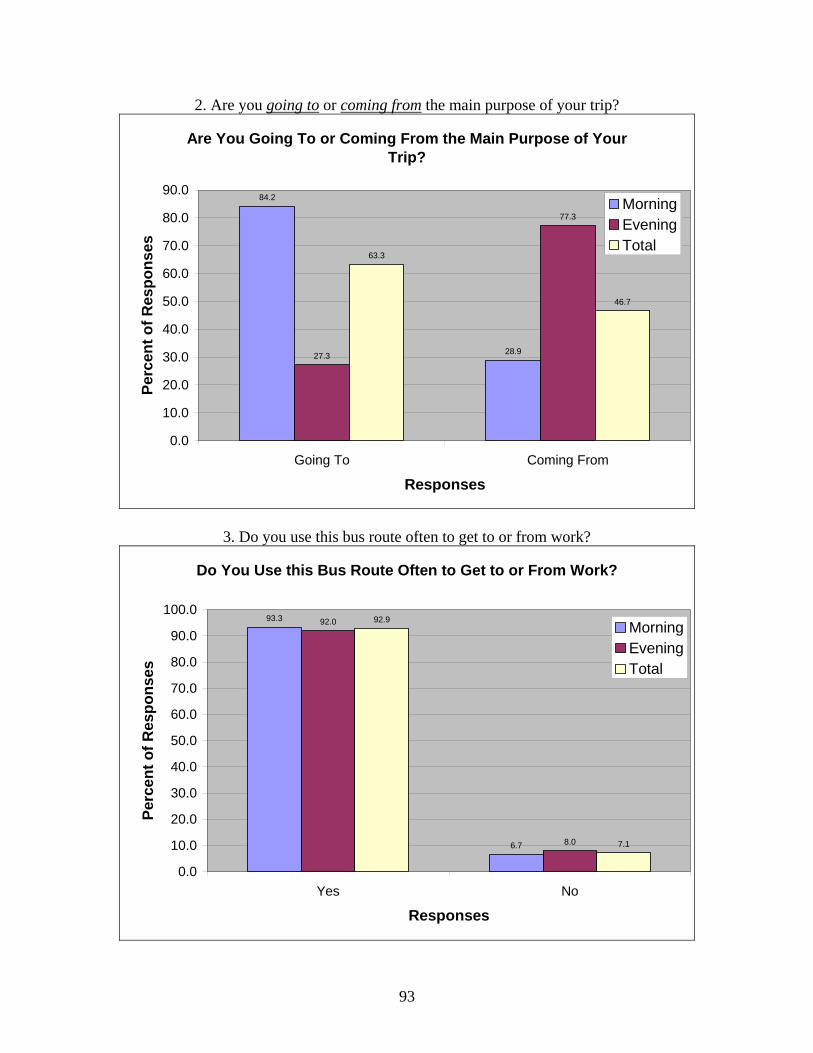
2. Are you going to or coming from the main purpose of your trip?
Are You Going To or Coming From the Main Purpose of Your Trip?
84.2
28.927.3
77.3
63.3
46.7
0.0
10.0
20.0
30.0
40.0
50.0
60.0
70.0
80.0
90.0
Going To Coming From
Responses
Perc
ent o
f Res
pons
es
MorningEveningTotal
3. Do you use this bus route often to get to or from work?
Do You Use this Bus Route Often to Get to or From Work?
93.3
6.7
92.0
8.0
92.9
7.1
0.0
10.0
20.0
30.0
40.0
50.0
60.0
70.0
80.0
90.0
100.0
Yes No
Responses
Perc
ent o
f Res
pons
es
MorningEveningTotal
93

4. You are:
You Are...
81.6
13.2
5.32.6 2.6 2.6
82.6
4.3
17.4
8.7
0.0 0.0
82.0
9.8 9.84.9
1.6 1.6
0.0
10.0
20.0
30.0
40.0
50.0
60.0
70.0
80.0
90.0
EmployedOutside
Your Home
Employed InYour Home
Student Homemaker Unemployed Retired
Responses
Perc
ent o
f Res
pons
es
MorningEveningTotal
5. Did this Ride On late evening or early morning bus trip help you…
Did this Ride On Late Evening or Early Morning Trip Help You…
32.6
7.0
27.9
9.3
30.230.4
13.0
21.7
39.1
43.5
31.8
9.1
25.8
19.7
34.8
0.05.0
10.015.020.025.030.035.040.045.050.0
Get This Job Get AnotherJob
Keep an OldJob
Work MoreHours
Work a BetterSchedule of
Hours
Responses
Perc
ent o
f Res
pons
es
MorningEveningTotal
94
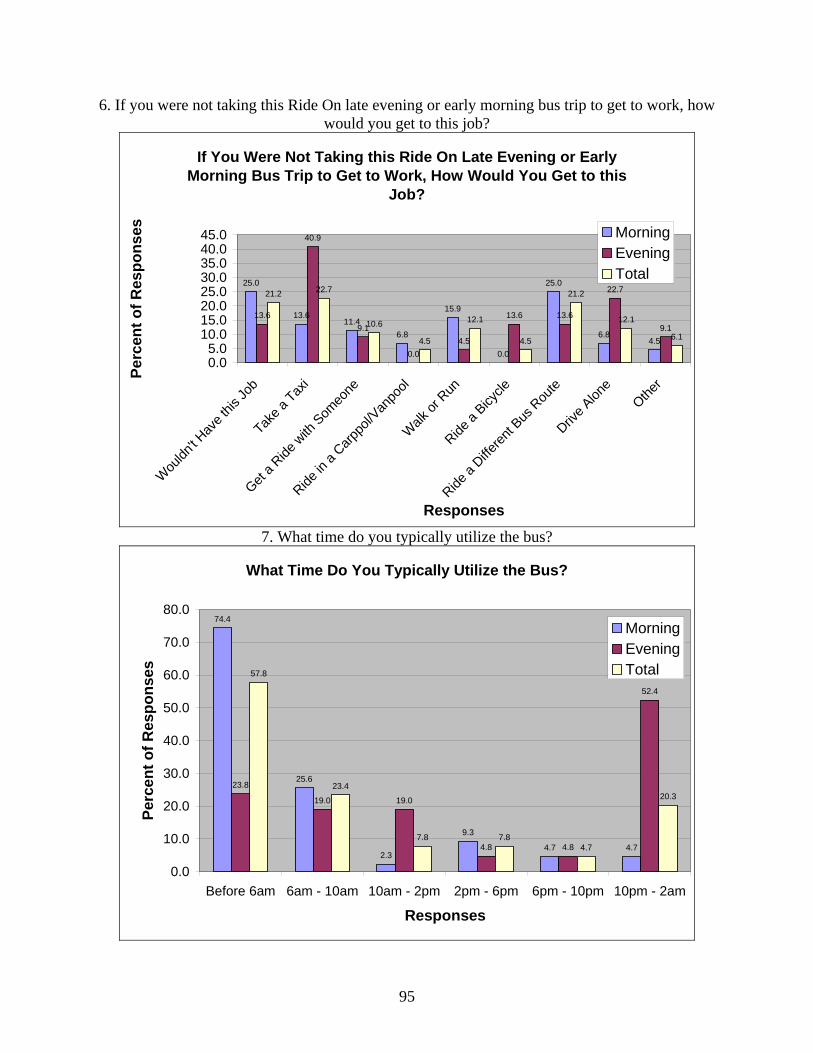
6. If you were not taking this Ride On late evening or early morning bus trip to get to work, how would you get to this job?
If You Were Not Taking this Ride On Late Evening or Early Morning Bus Trip to Get to Work, How Would You Get to this
Job?
25.0
13.611.4
6.8
15.9
0.0
25.0
6.84.5
13.6
40.9
9.1
0.04.5
13.6 13.6
22.7
9.1
21.2 22.7
10.6
4.5
12.1
4.5
21.2
12.1
6.1
0.05.0
10.015.020.025.030.035.040.045.0
Wou
ldn't H
ave t
his Jo
b
Take a
Taxi
Get a R
ide w
ith S
omeo
ne
Ride in
a Carp
pol/V
anpo
ol
Walk
or R
un
Ride a
Bicycle
Ride a
Differen
t Bus
Rou
te
Drive A
lone
Other
Responses
Perc
ent o
f Res
pons
es MorningEveningTotal
7. What time do you typically utilize the bus?
What Time Do You Typically Utilize the Bus?
74.4
25.6
2.3
9.3
4.7 4.7
23.8
19.0 19.0
4.8 4.8
52.4
57.8
23.4
7.8 7.84.7
20.3
0.0
10.0
20.0
30.0
40.0
50.0
60.0
70.0
80.0
Before 6am 6am - 10am 10am - 2pm 2pm - 6pm 6pm - 10pm 10pm - 2am
Responses
Perc
ent o
f Res
pons
es
MorningEveningTotal
95

8. During your normal week, how many total trips do you take on Ride On?
During Your Normal Week, How Many Total Trips do You Take on Ride On ?
31.1
20.0
22.2
11.1
15.614.3 14.3
23.8
14.3
33.3
25.8
18.2
22.7
12.1
21.2
0.0
5.0
10.0
15.0
20.0
25.0
30.0
35.0
1 to 4 5 to 8 9 to 12 13 to 16 More than 16
Responses
Perc
ent o
f Res
pons
es
MorningEveningTotal
9. How many bus transfers will you make to get to your destination?
How Many Bus Transfers will You Make to Get to Your Destination?
11.6
18.6
41.9
18.6
9.39.5
33.3 33.3
19.0
4.8
10.9
23.4
39.1
18.8
7.8
0.0
5.0
10.0
15.0
20.0
25.0
30.0
35.0
40.0
45.0
0 1 2 3 More than 3Responses
Perc
ent o
f Res
pons
es
MorningEveningTotal
96
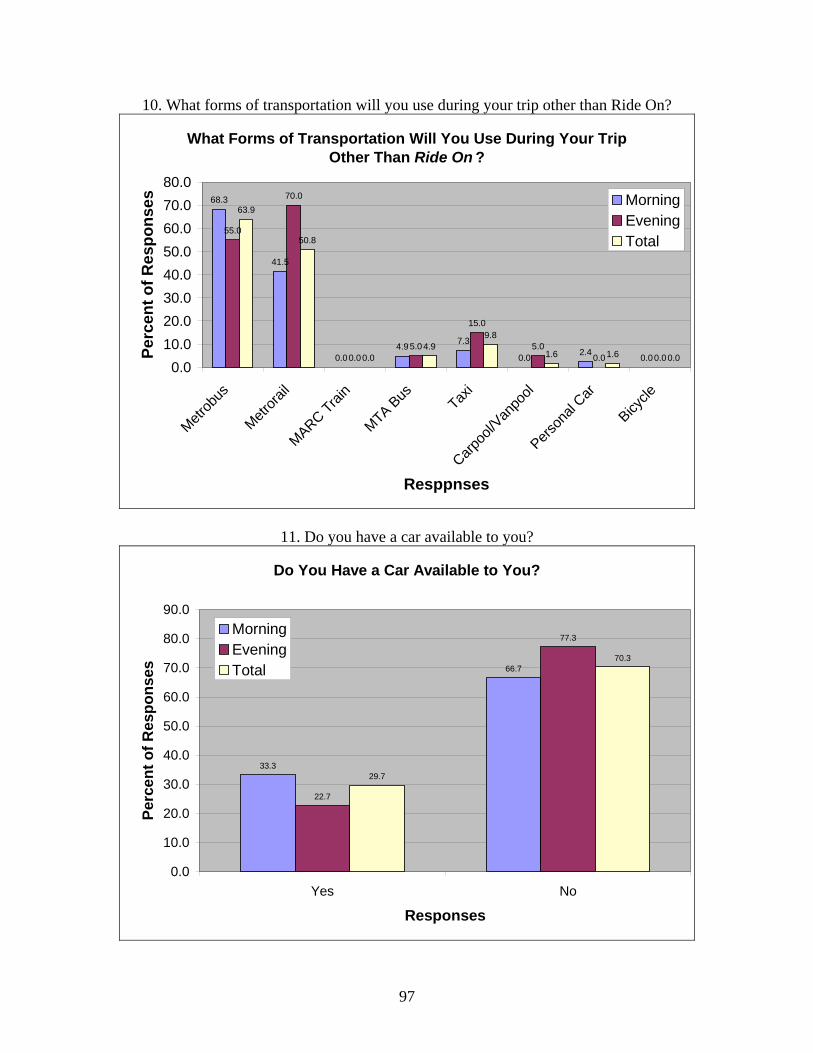
10. What forms of transportation will you use during your trip other than Ride On?
What Forms of Transportation Will You Use During Your Trip Other Than Ride On ?
68.3
41.5
0.04.9 7.3
0.0 2.4 0.0
55.0
70.0
0.05.0
15.0
5.00.0 0.0
63.9
50.8
0.04.9
9.8
1.6 1.6 0.00.0
10.020.030.040.050.060.070.080.0
Metrob
us
Metrora
il
MARC Train
MTA Bus Tax
i
Carpoo
l/Van
pool
Person
al Car
Bicycle
Resppnses
Perc
ent o
f Res
pons
es MorningEveningTotal
11. Do you have a car available to you?
Do You Have a Car Available to You?
33.3
66.7
22.7
77.3
29.7
70.3
0.0
10.0
20.0
30.0
40.0
50.0
60.0
70.0
80.0
90.0
Yes No
Responses
Perc
ent o
f Res
pons
es
MorningEveningTotal
97

12. How many jobs do you currently hold?
How Many Jobs Do You Currently Hold?
0.0
79.1
18.6
2.30.00.0
50.045.5
4.50.00.0
69.2
27.7
3.10.0
0.0
10.0
20.0
30.0
40.0
50.0
60.0
70.0
80.0
90.0
0 1 2 3 More than 3Responses
Perc
ent o
f Res
pons
es
MorningEveningTotal
13. How many hours a week do you work?
How Many Hours a Week do You Work?
4.5
9.1
50.0
27.3
11.413.6
4.5
36.4
22.7 22.7
7.6 7.6
45.5
25.8
15.2
0.0
10.0
20.0
30.0
40.0
50.0
60.0
Less Than 20 20 to 30 31 to 40 41 to 48 More Than 48
Responses
Perc
ent o
f Res
pons
es
MorningEveningTotal
98

14. How many days per week do you work?
How Many Days per Week Do You Work?
2.40.0 0.0
2.44.9
68.3
22.0
2.40.0
5.0
0.0
5.0 5.0
50.0
25.0
10.0
1.6 1.6 0.03.3 4.9
62.3
23.0
4.9
0.0
10.0
20.0
30.0
40.0
50.0
60.0
70.0
80.0
Lessthan One
1 2 3 4 5 6 7
Responses
Perc
ent o
f Res
pons
es
MorningEveningTotal
15. What is your total annual household income?
What is Your Total Annual Household Income?
50.0
22.2
2.8
8.3 8.3
2.80.0
5.6
38.9 38.9
11.1
5.6
0.0 0.0
5.6
0.0
46.3
27.8
5.6 7.4 5.61.9 1.9 3.7
0.0
10.0
20.0
30.0
40.0
50.0
60.0
Less
than
$20,0
00
$20,0
00 to
$34,9
99
$35,0
00 to
$44,9
99
$45,0
00 to
$59,9
99
$60,0
00 to
$74,9
99
$75,0
00 to
$99,9
99
$100
,000 t
o $19
9,999
$200
,000 o
r More
Responses
Perc
ent o
f Res
pons
es MorningEveningTotal
99
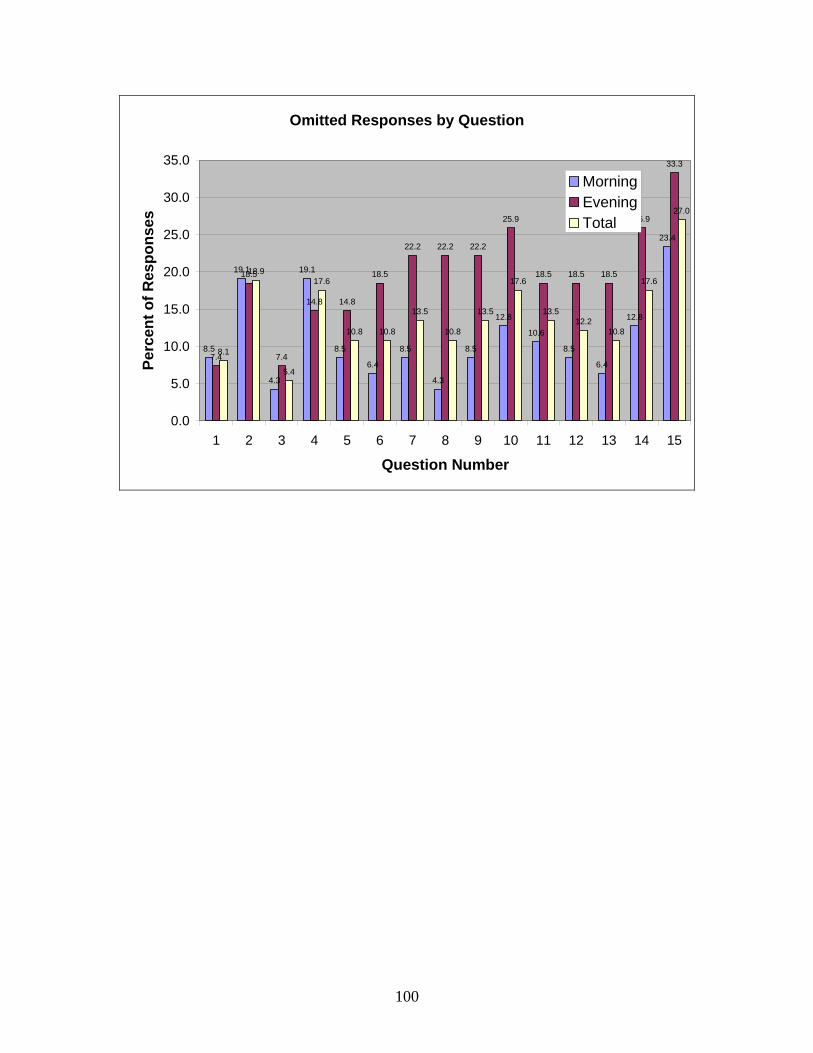
Omitted Responses by Question
8.5
19.1
4.3
19.1
8.5
6.4
8.5
4.3
8.5
12.8
10.6
8.5
6.4
12.8
23.4
7.4
18.5
7.4
14.8 14.8
18.5
22.2 22.2 22.2
25.9
18.5 18.5 18.5
25.9
33.3
8.1
18.9
5.4
17.6
10.8 10.8
13.5
10.8
13.5
17.6
13.512.2
10.8
17.6
27.0
0.0
5.0
10.0
15.0
20.0
25.0
30.0
35.0
1 2 3 4 5 6 7 8 9 10 11 12 13 14 15
Question Number
Perc
ent o
f Res
pons
es
MorningEveningTotal
100
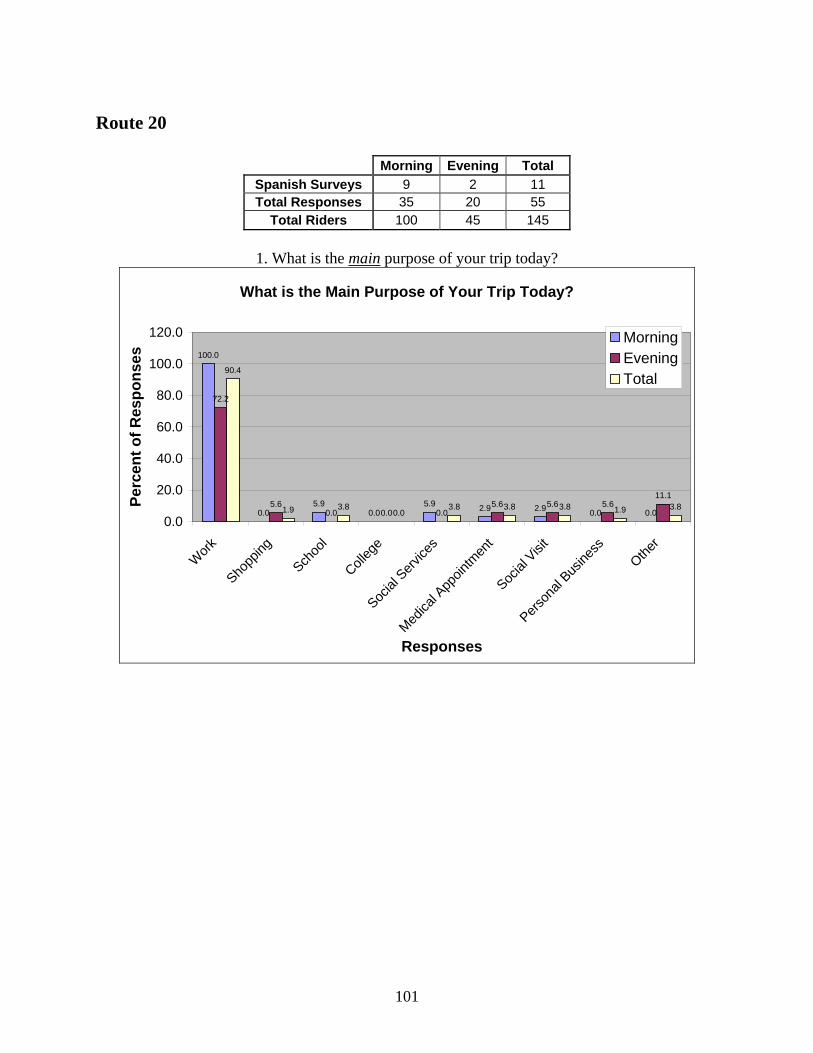
Route 20
Morning Evening Total Spanish Surveys 9 2 11 Total Responses 35 20 55
Total Riders 100 45 145
1. What is the main purpose of your trip today?
What is the Main Purpose of Your Trip Today?
100.0
0.05.9
0.05.9 2.9 2.9 0.0 0.0
72.2
5.60.0 0.0 0.0
5.6 5.6 5.611.1
90.4
1.9 3.80.0
3.8 3.8 3.8 1.9 3.8
0.0
20.0
40.0
60.0
80.0
100.0
120.0
Work
Shopp
ing
Schoo
l
Colleg
e
Social
Serv
ices
Medica
l App
ointm
ent
Social
Visi
t
Person
al Bus
iness
Other
Responses
Perc
ent o
f Res
pons
es
MorningEveningTotal
101

2. Are you going to or coming from the main purpose of your trip?
Are You Going To or Coming From the Main Purpose of Your Trip?
93.5
19.4
26.7
86.7
71.7
41.3
0.0
10.0
20.0
30.0
40.0
50.0
60.0
70.0
80.0
90.0
100.0
Going To Coming From
Responses
Perc
ent o
f Res
pons
es
MorningEveningTotal
3. Do you use this bus route often to get to or from work?
Do You Use this Bus Route Often to Get to or From Work?
91.4
11.4
100.0
0.0
94.1
7.8
0.0
20.0
40.0
60.0
80.0
100.0
120.0
Yes No
Responses
Perc
ent o
f Res
pons
es
MorningEveningTotal
102
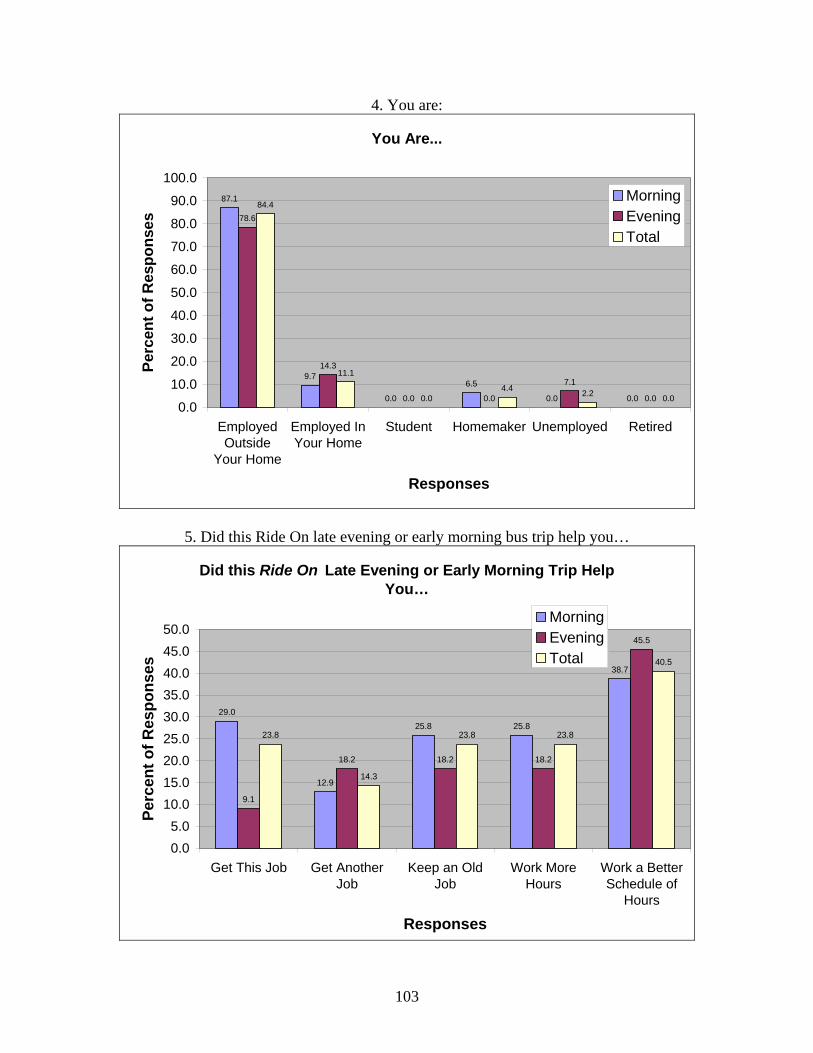
4. You are:
You Are...
87.1
9.7
0.0
6.5
0.0 0.0
78.6
14.3
0.0 0.0
7.1
0.0
84.4
11.1
0.04.4 2.2 0.0
0.0
10.0
20.0
30.0
40.0
50.0
60.0
70.0
80.0
90.0
100.0
EmployedOutside
Your Home
Employed InYour Home
Student Homemaker Unemployed Retired
Responses
Perc
ent o
f Res
pons
es
MorningEveningTotal
5. Did this Ride On late evening or early morning bus trip help you…
Did this Ride On Late Evening or Early Morning Trip Help You…
29.0
12.9
25.8 25.8
38.7
9.1
18.2 18.2 18.2
45.5
23.8
14.3
23.8 23.8
40.5
0.05.0
10.015.020.025.030.035.040.045.050.0
Get This Job Get AnotherJob
Keep an OldJob
Work MoreHours
Work a BetterSchedule of
Hours
Responses
Perc
ent o
f Res
pons
es
MorningEveningTotal
103
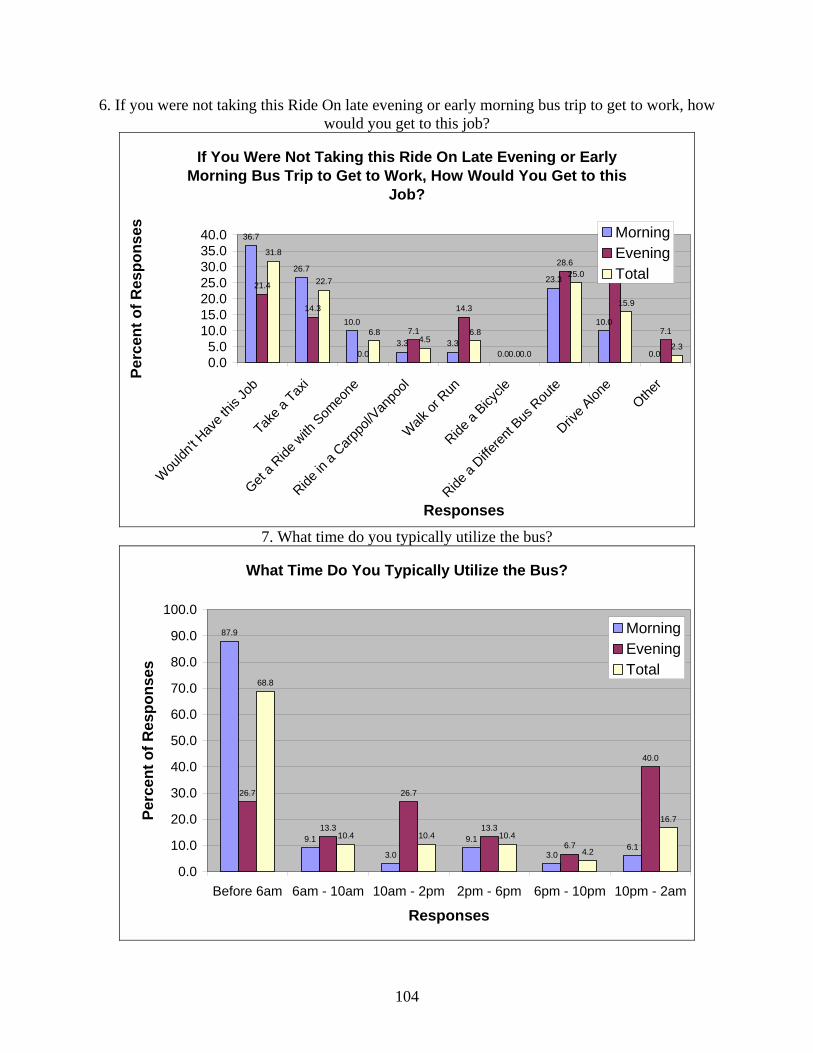
6. If you were not taking this Ride On late evening or early morning bus trip to get to work, how would you get to this job?
If You Were Not Taking this Ride On Late Evening or Early Morning Bus Trip to Get to Work, How Would You Get to this
Job?
36.7
26.7
10.0
3.3 3.30.0
23.3
10.0
0.0
21.4
14.3
0.0
7.1
14.3
0.0
28.6 28.6
7.1
31.8
22.7
6.84.5
6.8
0.0
25.0
15.9
2.3
0.05.0
10.015.020.025.030.035.040.0
Wou
ldn't H
ave t
his Jo
b
Take a
Taxi
Get a R
ide w
ith S
omeo
ne
Ride in
a Carp
pol/V
anpo
ol
Walk
or R
un
Ride a
Bicycle
Ride a
Differen
t Bus
Rou
te
Drive A
lone
Other
Responses
Perc
ent o
f Res
pons
es MorningEveningTotal
7. What time do you typically utilize the bus?
What Time Do You Typically Utilize the Bus?
87.9
9.1
3.0
9.1
3.06.1
26.7
13.3
26.7
13.3
6.7
40.0
68.8
10.4 10.4 10.4
4.2
16.7
0.0
10.0
20.0
30.0
40.0
50.0
60.0
70.0
80.0
90.0
100.0
Before 6am 6am - 10am 10am - 2pm 2pm - 6pm 6pm - 10pm 10pm - 2am
Responses
Perc
ent o
f Res
pons
es
MorningEveningTotal
104
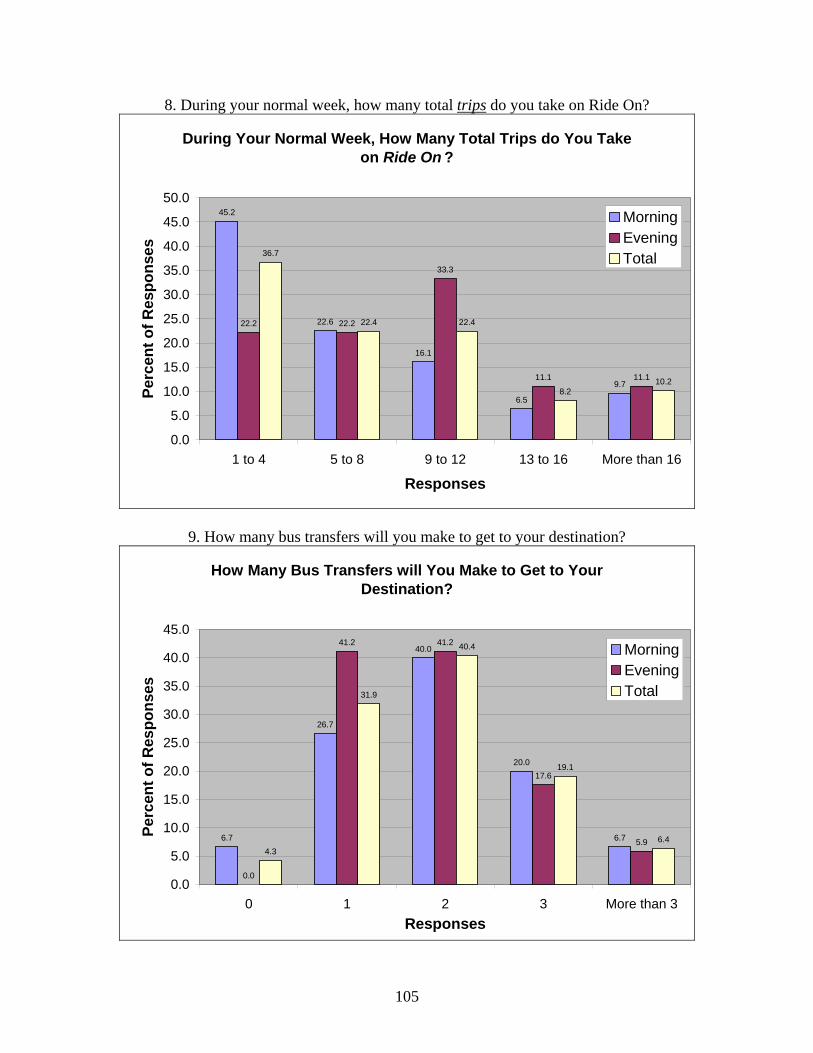
8. During your normal week, how many total trips do you take on Ride On?
During Your Normal Week, How Many Total Trips do You Take on Ride On ?
45.2
22.6
16.1
6.5
9.7
22.2 22.2
33.3
11.1 11.1
36.7
22.4 22.4
8.210.2
0.0
5.0
10.0
15.0
20.0
25.0
30.0
35.0
40.0
45.0
50.0
1 to 4 5 to 8 9 to 12 13 to 16 More than 16
Responses
Perc
ent o
f Res
pons
es
MorningEveningTotal
9. How many bus transfers will you make to get to your destination?
How Many Bus Transfers will You Make to Get to Your Destination?
6.7
26.7
40.0
20.0
6.7
0.0
41.2 41.2
17.6
5.94.3
31.9
40.4
19.1
6.4
0.0
5.0
10.0
15.0
20.0
25.0
30.0
35.0
40.0
45.0
0 1 2 3 More than 3Responses
Perc
ent o
f Res
pons
es
MorningEveningTotal
105
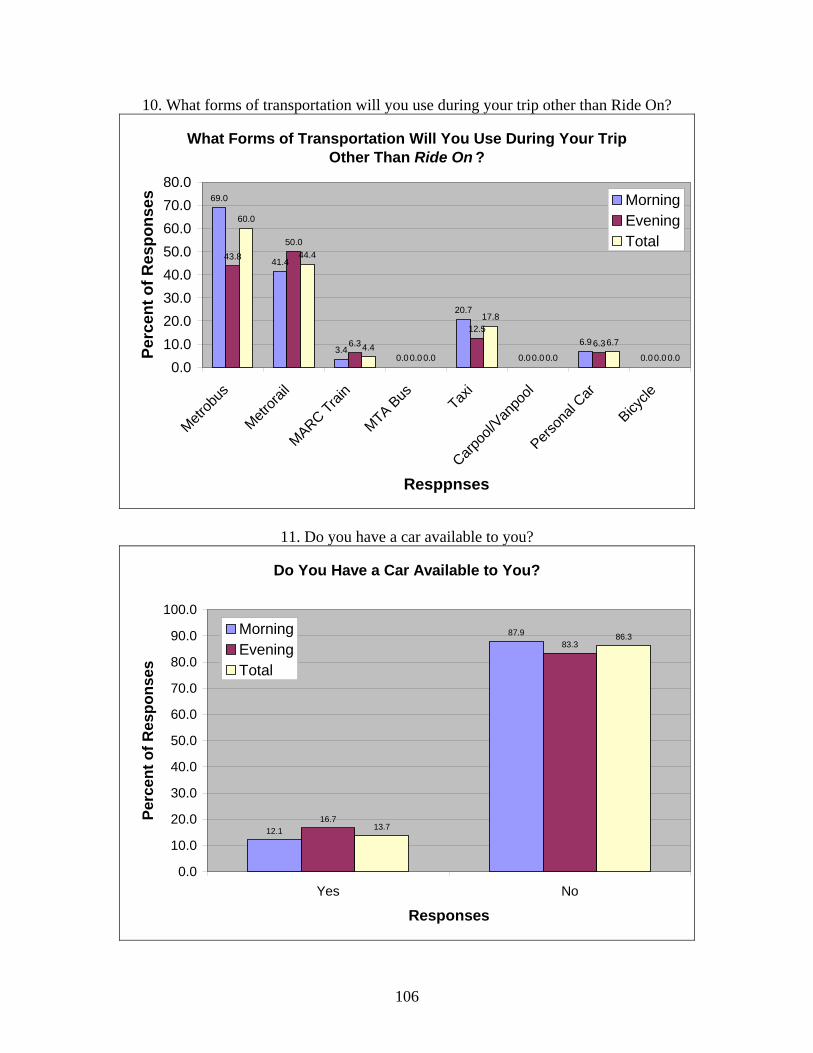
10. What forms of transportation will you use during your trip other than Ride On?
What Forms of Transportation Will You Use During Your Trip Other Than Ride On ?
69.0
41.4
3.40.0
20.7
0.0
6.9
0.0
43.850.0
6.30.0
12.5
0.06.3
0.0
60.0
44.4
4.40.0
17.8
0.0
6.7
0.00.0
10.020.030.040.050.060.070.080.0
Metrob
us
Metrora
il
MARC Train
MTA Bus Tax
i
Carpoo
l/Van
pool
Person
al Car
Bicycle
Resppnses
Perc
ent o
f Res
pons
es MorningEveningTotal
11. Do you have a car available to you?
Do You Have a Car Available to You?
12.1
87.9
16.7
83.3
13.7
86.3
0.0
10.0
20.0
30.0
40.0
50.0
60.0
70.0
80.0
90.0
100.0
Yes No
Responses
Perc
ent o
f Res
pons
es
MorningEveningTotal
106
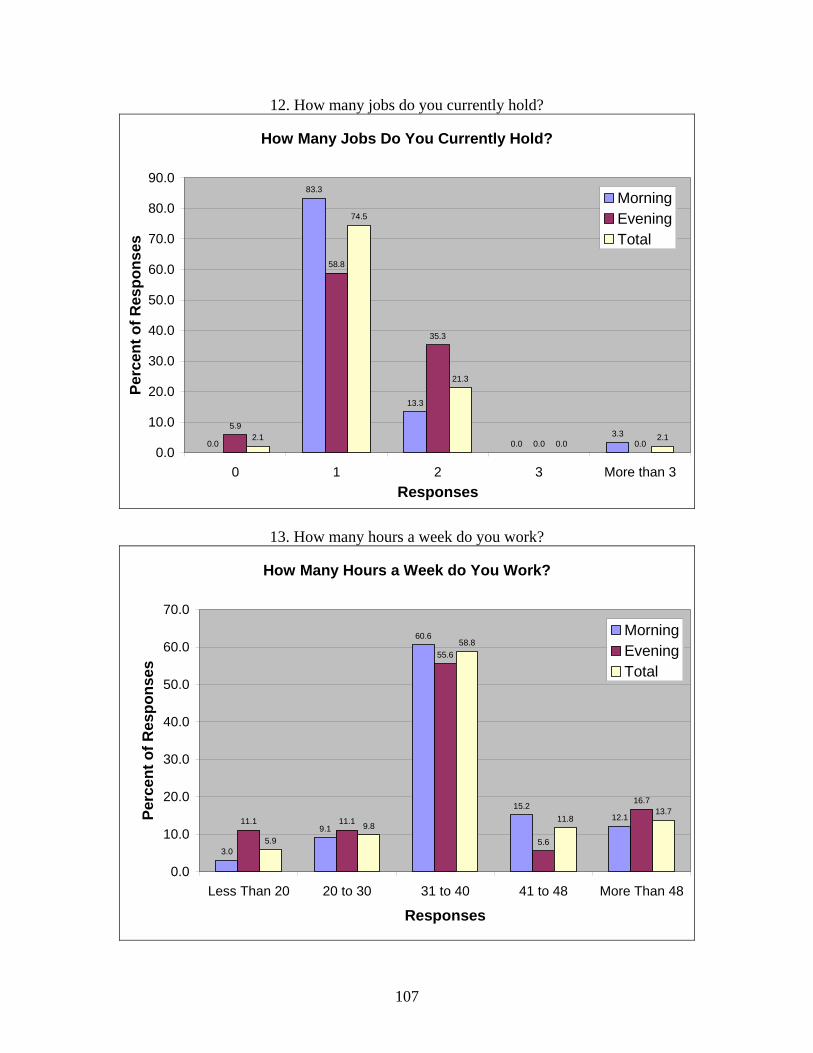
12. How many jobs do you currently hold?
How Many Jobs Do You Currently Hold?
0.0
83.3
13.3
0.03.3
5.9
58.8
35.3
0.0 0.02.1
74.5
21.3
0.02.1
0.0
10.0
20.0
30.0
40.0
50.0
60.0
70.0
80.0
90.0
0 1 2 3 More than 3Responses
Perc
ent o
f Res
pons
es
MorningEveningTotal
13. How many hours a week do you work?
How Many Hours a Week do You Work?
3.0
9.1
60.6
15.212.111.1 11.1
55.6
5.6
16.7
5.9
9.8
58.8
11.813.7
0.0
10.0
20.0
30.0
40.0
50.0
60.0
70.0
Less Than 20 20 to 30 31 to 40 41 to 48 More Than 48
Responses
Perc
ent o
f Res
pons
es
MorningEveningTotal
107
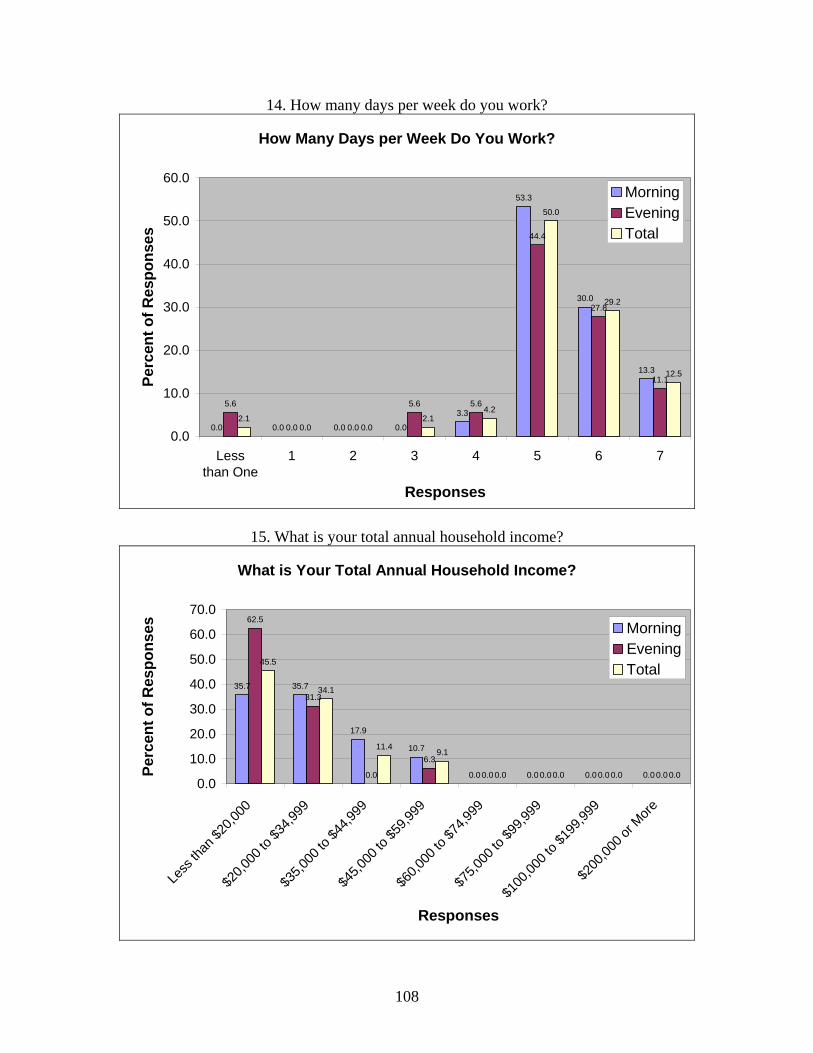
14. How many days per week do you work?
How Many Days per Week Do You Work?
0.0 0.0 0.0 0.0
3.3
53.3
30.0
13.3
5.6
0.0 0.0
5.6 5.6
44.4
27.8
11.1
2.10.0 0.0
2.14.2
50.0
29.2
12.5
0.0
10.0
20.0
30.0
40.0
50.0
60.0
Lessthan One
1 2 3 4 5 6 7
Responses
Perc
ent o
f Res
pons
es
MorningEveningTotal
15. What is your total annual household income?
What is Your Total Annual Household Income?
35.7 35.7
17.9
10.7
0.0 0.0 0.0 0.0
62.5
31.3
0.0
6.3
0.0 0.0 0.0 0.0
45.5
34.1
11.49.1
0.0 0.0 0.0 0.00.0
10.0
20.0
30.0
40.0
50.0
60.0
70.0
Less
than
$20,0
00
$20,0
00 to
$34,9
99
$35,0
00 to
$44,9
99
$45,0
00 to
$59,9
99
$60,0
00 to
$74,9
99
$75,0
00 to
$99,9
99
$100
,000 t
o $19
9,999
$200
,000 o
r More
Responses
Perc
ent o
f Res
pons
es MorningEveningTotal
108

Omitted Responses by Question
2.9
11.4
0.0
11.4 11.4
14.3
5.7
11.4
14.3
17.1
5.7
14.3
5.7
14.3
20.0
10.0
25.0
20.0
30.0
45.0
30.0
25.0
10.0
15.0
20.0
10.0
15.0
10.0 10.0
20.0
5.5
16.4
7.3
18.2
23.6
20.0
12.710.9
14.5
18.2
7.3
14.5
7.3
12.7
20.0
0.0
5.0
10.0
15.0
20.0
25.0
30.0
35.0
40.0
45.0
50.0
1 2 3 4 5 6 7 8 9 10 11 12 13 14 15
Question Number
Perc
ent o
f Res
pons
es
MorningEveningTotal
109

Route 26
Morning Evening Total Spanish Surveys 21 7 28 Total Responses 53 25 78
Total Riders 102 39 141
1. What is the main purpose of your trip today?
What is the Main Purpose of Your Trip Today?
98.0
0.0 0.05.9
0.0 0.0 2.0 2.0 0.0
87.5
4.20.0
4.20.0 0.0
4.2 4.20.0
94.7
1.3 0.05.3
0.0 0.0 2.7 2.7 0.00.0
20.0
40.0
60.0
80.0
100.0
120.0
Work
Shopp
ing
Schoo
l
Colleg
e
Social
Serv
ices
Medica
l App
ointm
ent
Social
Visi
t
Person
al Bus
iness
Other
Responses
Perc
ent o
f Res
pons
es
MorningEveningTotal
110
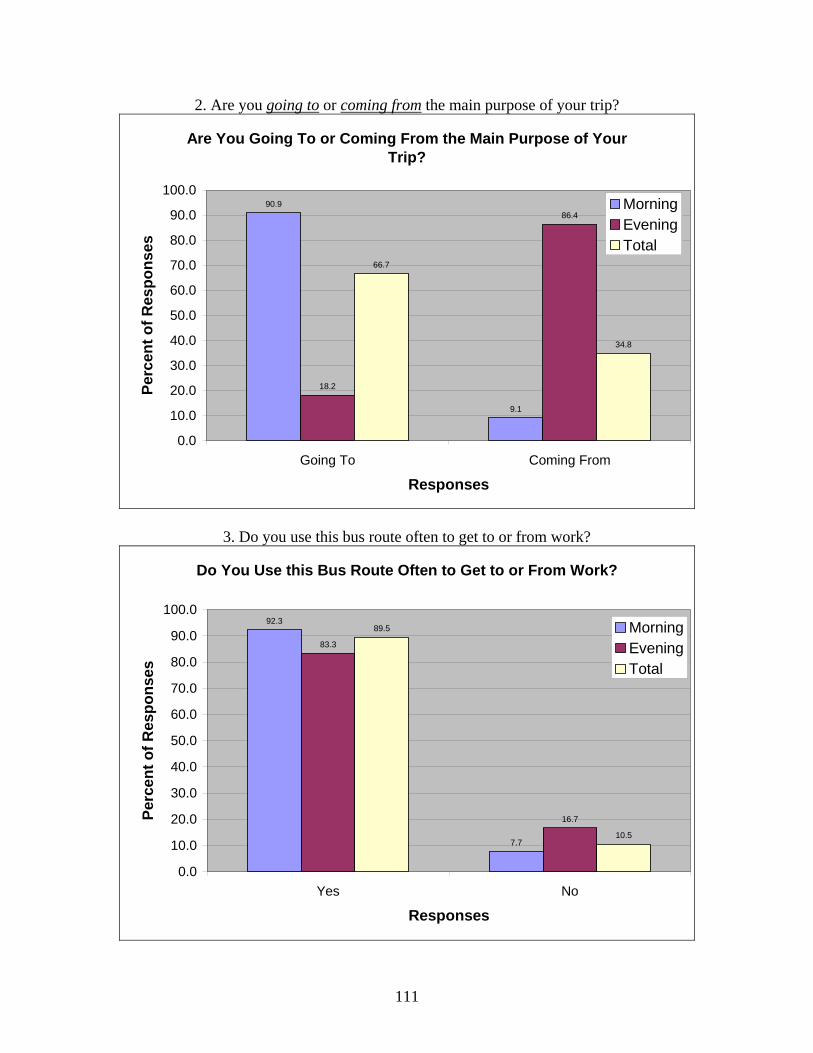
2. Are you going to or coming from the main purpose of your trip?
Are You Going To or Coming From the Main Purpose of Your Trip?
90.9
9.1
18.2
86.4
66.7
34.8
0.0
10.0
20.0
30.0
40.0
50.0
60.0
70.0
80.0
90.0
100.0
Going To Coming From
Responses
Perc
ent o
f Res
pons
es
MorningEveningTotal
3. Do you use this bus route often to get to or from work?
Do You Use this Bus Route Often to Get to or From Work?
92.3
7.7
83.3
16.7
89.5
10.5
0.0
10.0
20.0
30.0
40.0
50.0
60.0
70.0
80.0
90.0
100.0
Yes No
Responses
Perc
ent o
f Res
pons
es
MorningEveningTotal
111
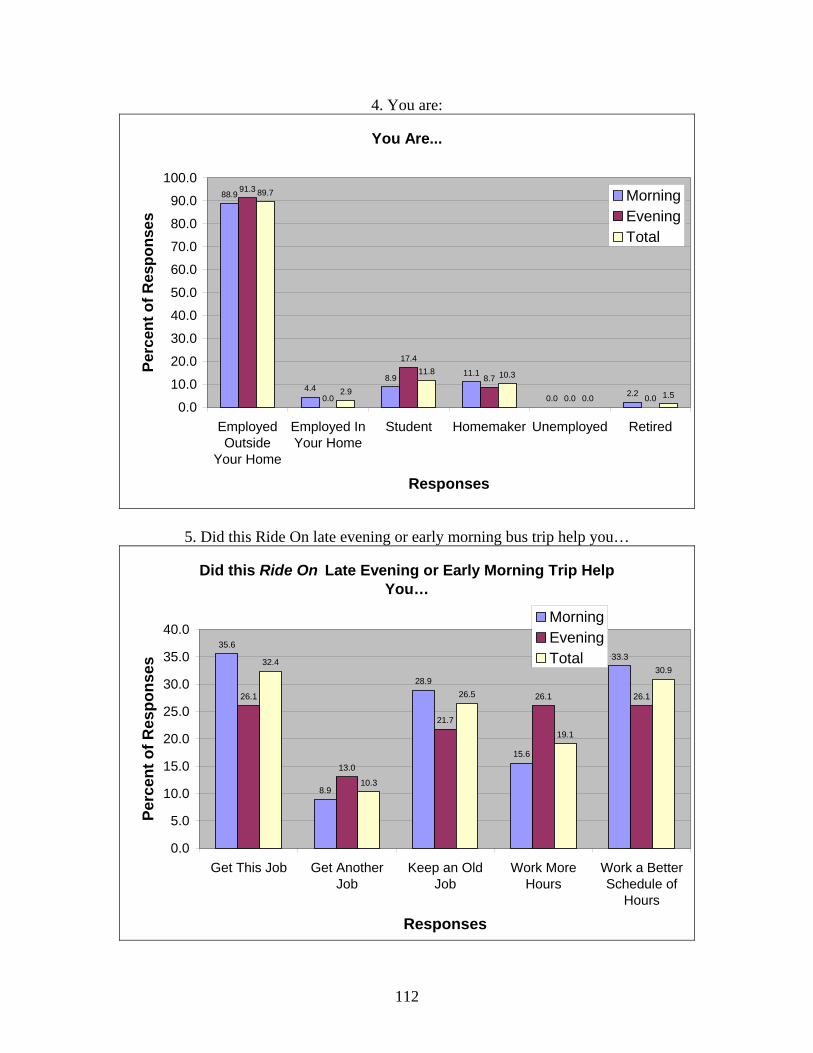
4. You are:
You Are...
88.9
4.48.9 11.1
0.0 2.2
91.3
0.0
17.4
8.7
0.0 0.0
89.7
2.9
11.8 10.3
0.0 1.50.0
10.0
20.0
30.0
40.0
50.0
60.0
70.0
80.0
90.0
100.0
EmployedOutside
Your Home
Employed InYour Home
Student Homemaker Unemployed Retired
Responses
Perc
ent o
f Res
pons
es
MorningEveningTotal
5. Did this Ride On late evening or early morning bus trip help you…
Did this Ride On Late Evening or Early Morning Trip Help You…
35.6
8.9
28.9
15.6
33.3
26.1
13.0
21.7
26.1 26.1
32.4
10.3
26.5
19.1
30.9
0.0
5.0
10.0
15.0
20.0
25.0
30.0
35.0
40.0
Get This Job Get AnotherJob
Keep an OldJob
Work MoreHours
Work a BetterSchedule of
Hours
Responses
Perc
ent o
f Res
pons
es
MorningEveningTotal
112
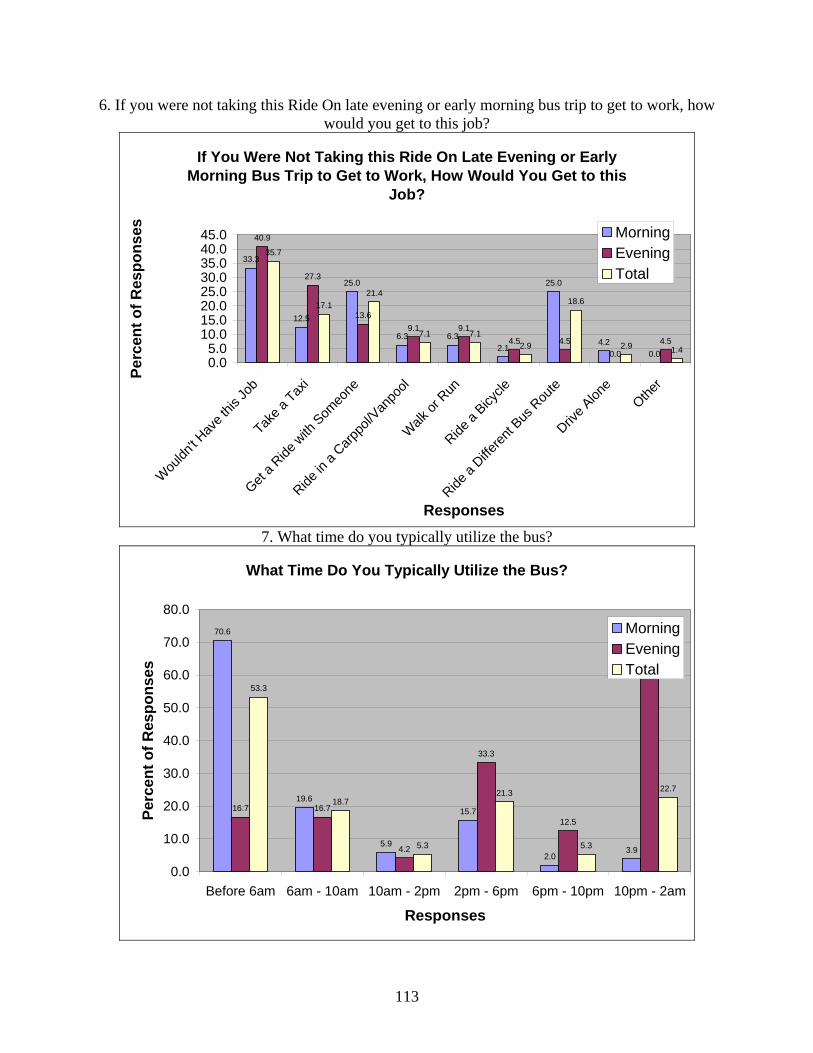
6. If you were not taking this Ride On late evening or early morning bus trip to get to work, how would you get to this job?
If You Were Not Taking this Ride On Late Evening or Early Morning Bus Trip to Get to Work, How Would You Get to this
Job?
33.3
12.5
25.0
6.3 6.32.1
25.0
4.20.0
40.9
27.3
13.69.1 9.1
4.5 4.50.0
4.5
35.7
17.121.4
7.1 7.12.9
18.6
2.9 1.4
0.05.0
10.015.020.025.030.035.040.045.0
Wou
ldn't H
ave t
his Jo
b
Take a
Taxi
Get a R
ide w
ith S
omeo
ne
Ride in
a Carp
pol/V
anpo
ol
Walk
or R
un
Ride a
Bicycle
Ride a
Differen
t Bus
Rou
te
Drive A
lone
Other
Responses
Perc
ent o
f Res
pons
es MorningEveningTotal
7. What time do you typically utilize the bus?
What Time Do You Typically Utilize the Bus?
70.6
19.6
5.9
15.7
2.03.9
16.7 16.7
4.2
33.3
12.5
62.5
53.3
18.7
5.3
21.3
5.3
22.7
0.0
10.0
20.0
30.0
40.0
50.0
60.0
70.0
80.0
Before 6am 6am - 10am 10am - 2pm 2pm - 6pm 6pm - 10pm 10pm - 2am
Responses
Perc
ent o
f Res
pons
es
MorningEveningTotal
113
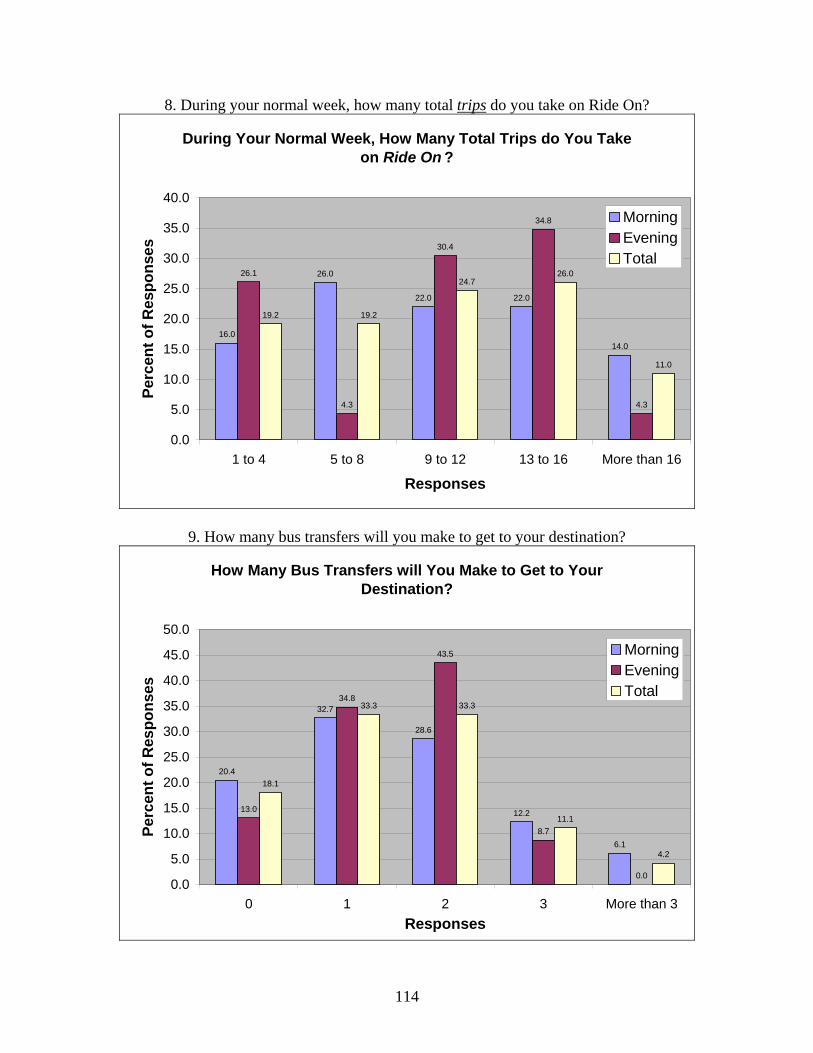
8. During your normal week, how many total trips do you take on Ride On?
During Your Normal Week, How Many Total Trips do You Take on Ride On ?
16.0
26.0
22.0 22.0
14.0
26.1
4.3
30.4
34.8
4.3
19.2 19.2
24.726.0
11.0
0.0
5.0
10.0
15.0
20.0
25.0
30.0
35.0
40.0
1 to 4 5 to 8 9 to 12 13 to 16 More than 16
Responses
Perc
ent o
f Res
pons
es
MorningEveningTotal
9. How many bus transfers will you make to get to your destination?
How Many Bus Transfers will You Make to Get to Your Destination?
20.4
32.7
28.6
12.2
6.1
13.0
34.8
43.5
8.7
0.0
18.1
33.3 33.3
11.1
4.2
0.0
5.0
10.0
15.0
20.0
25.0
30.0
35.0
40.0
45.0
50.0
0 1 2 3 More than 3Responses
Perc
ent o
f Res
pons
es
MorningEveningTotal
114
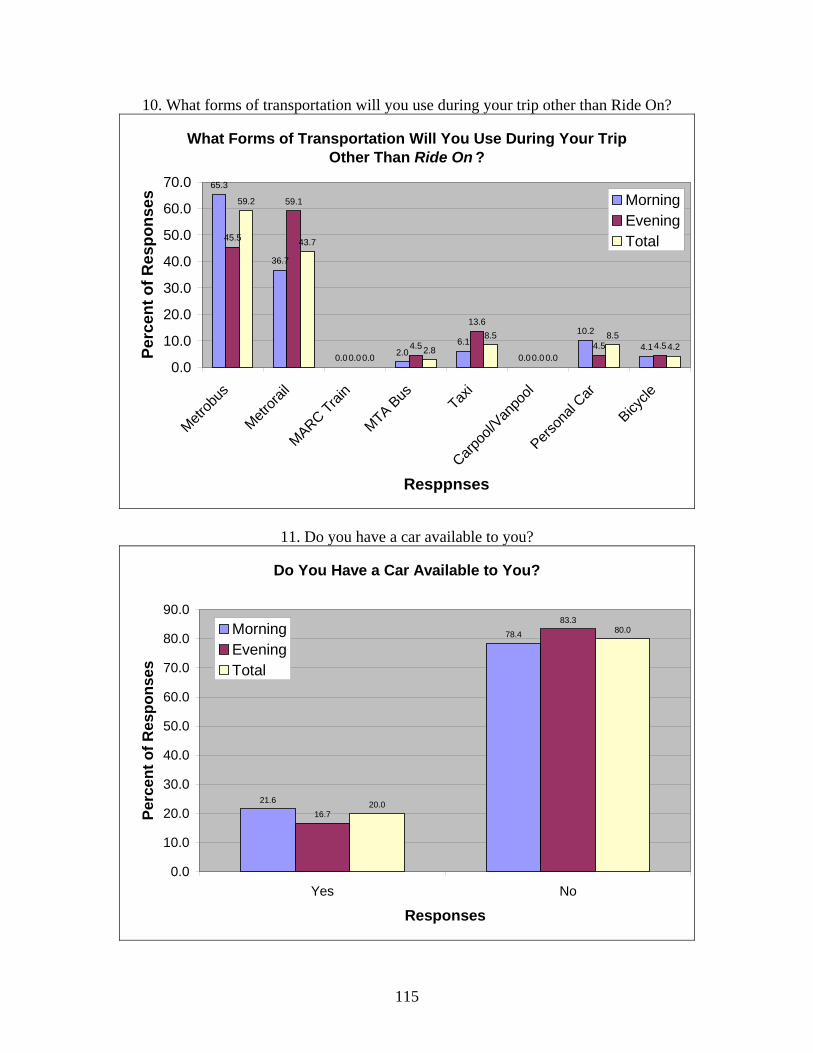
10. What forms of transportation will you use during your trip other than Ride On?
What Forms of Transportation Will You Use During Your Trip Other Than Ride On ?
65.3
36.7
0.0 2.06.1
0.0
10.2
4.1
45.5
59.1
0.04.5
13.6
0.04.5 4.5
59.2
43.7
0.02.8
8.5
0.0
8.54.2
0.0
10.0
20.0
30.0
40.0
50.0
60.0
70.0
Metrob
us
Metrora
il
MARC Train
MTA Bus Tax
i
Carpoo
l/Van
pool
Person
al Car
Bicycle
Resppnses
Perc
ent o
f Res
pons
es MorningEveningTotal
11. Do you have a car available to you?
Do You Have a Car Available to You?
21.6
78.4
16.7
83.3
20.0
80.0
0.0
10.0
20.0
30.0
40.0
50.0
60.0
70.0
80.0
90.0
Yes No
Responses
Perc
ent o
f Res
pons
es
MorningEveningTotal
115

12. How many jobs do you currently hold?
How Many Jobs Do You Currently Hold?
2.0
71.4
26.5
0.0 0.0
8.3
62.5
29.2
0.0 0.0
4.1
68.5
27.4
0.0 0.00.0
10.0
20.0
30.0
40.0
50.0
60.0
70.0
80.0
0 1 2 3 More than 3Responses
Perc
ent o
f Res
pons
es
MorningEveningTotal
13. How many hours a week do you work?
How Many Hours a Week do You Work?
6.0
14.0
40.0
18.0
22.0
0.0
13.0
47.8
26.1
17.4
4.1
13.7
42.5
20.5 20.5
0.0
10.0
20.0
30.0
40.0
50.0
60.0
Less Than 20 20 to 30 31 to 40 41 to 48 More Than 48
Responses
Perc
ent o
f Res
pons
es
MorningEveningTotal
116
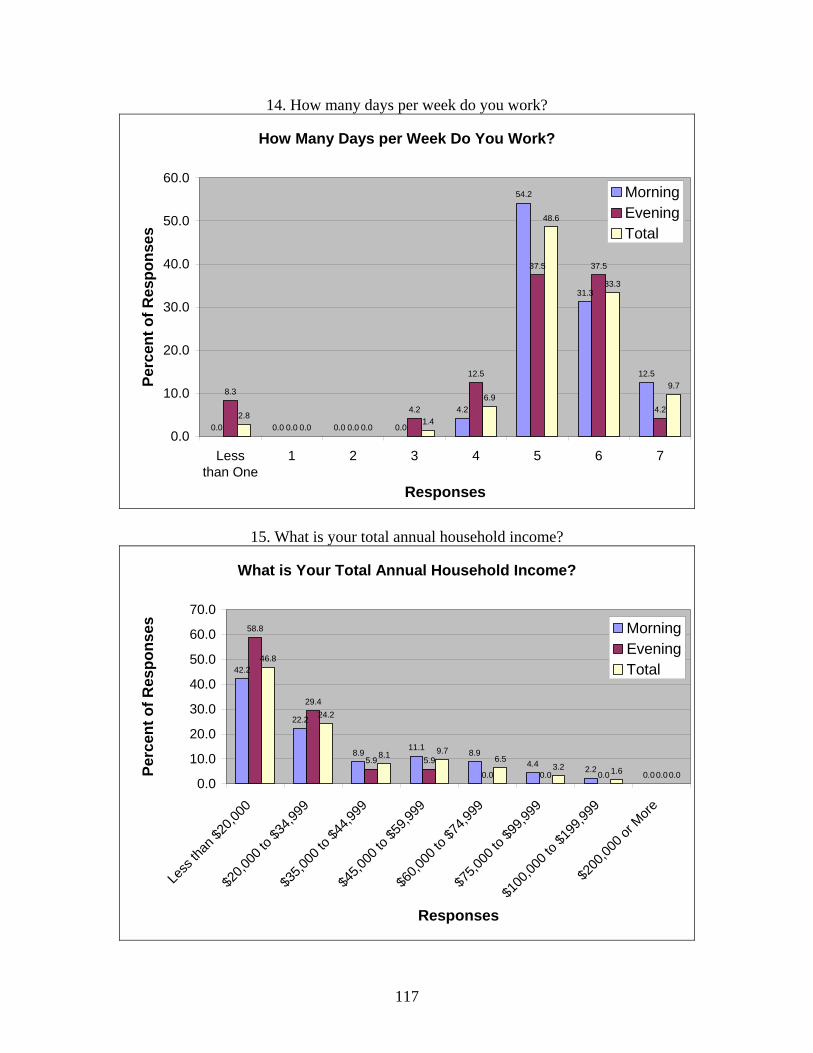
14. How many days per week do you work?
How Many Days per Week Do You Work?
0.0 0.0 0.0 0.0
4.2
54.2
31.3
12.5
8.3
0.0 0.0
4.2
12.5
37.5 37.5
4.22.8
0.0 0.01.4
6.9
48.6
33.3
9.7
0.0
10.0
20.0
30.0
40.0
50.0
60.0
Lessthan One
1 2 3 4 5 6 7
Responses
Perc
ent o
f Res
pons
es
MorningEveningTotal
15. What is your total annual household income?
What is Your Total Annual Household Income?
42.2
22.2
8.9 11.1 8.94.4 2.2 0.0
58.8
29.4
5.9 5.9
0.0 0.0 0.0 0.0
46.8
24.2
8.1 9.76.5
3.2 1.6 0.00.0
10.0
20.0
30.0
40.0
50.0
60.0
70.0
Less
than
$20,0
00
$20,0
00 to
$34,9
99
$35,0
00 to
$44,9
99
$45,0
00 to
$59,9
99
$60,0
00 to
$74,9
99
$75,0
00 to
$99,9
99
$100
,000 t
o $19
9,999
$200
,000 o
r More
Responses
Perc
ent o
f Res
pons
es MorningEveningTotal
117
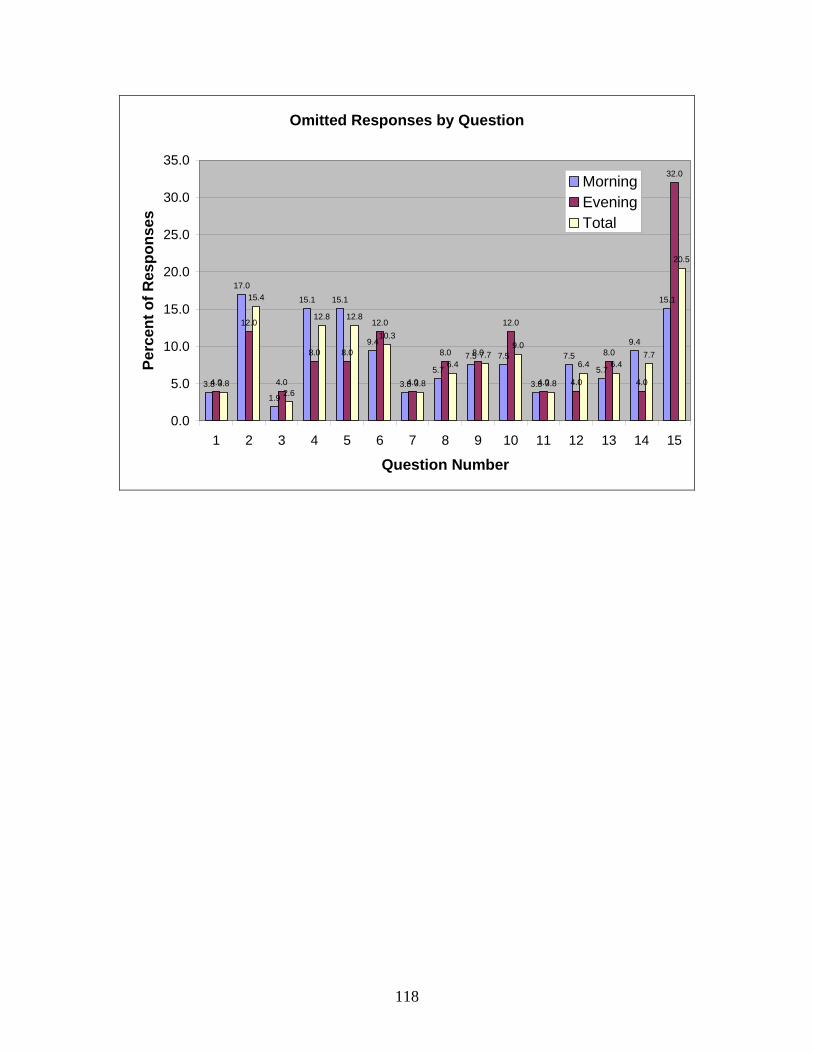
Omitted Responses by Question
3.8
17.0
1.9
15.1 15.1
9.4
3.8
5.7
7.5 7.5
3.8
7.5
5.7
9.4
15.1
4.0
12.0
4.0
8.0 8.0
12.0
4.0
8.0 8.0
12.0
4.0 4.0
8.0
4.0
32.0
3.8
15.4
2.6
12.8 12.8
10.3
3.8
6.47.7
9.0
3.8
6.4 6.47.7
20.5
0.0
5.0
10.0
15.0
20.0
25.0
30.0
35.0
1 2 3 4 5 6 7 8 9 10 11 12 13 14 15
Question Number
Perc
ent o
f Res
pons
es
MorningEveningTotal
118
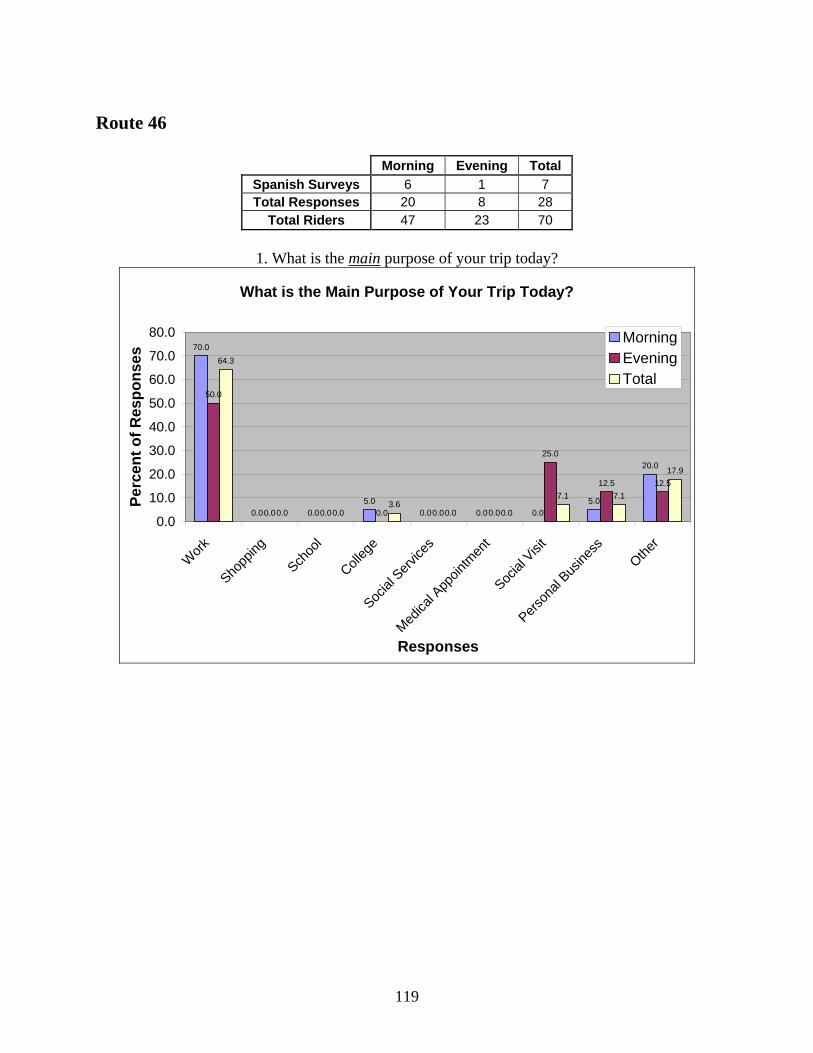
Route 46
Morning Evening Total Spanish Surveys 6 1 7 Total Responses 20 8 28
Total Riders 47 23 70
1. What is the main purpose of your trip today?
What is the Main Purpose of Your Trip Today?
70.0
0.0 0.05.0
0.0 0.0 0.05.0
20.0
50.0
0.0 0.0 0.0 0.0 0.0
25.0
12.5 12.5
64.3
0.0 0.03.6
0.0 0.0
7.1 7.1
17.9
0.0
10.0
20.0
30.0
40.0
50.0
60.0
70.0
80.0
Work
Shopp
ing
Schoo
l
Colleg
e
Social
Serv
ices
Medica
l App
ointm
ent
Social
Visi
t
Person
al Bus
iness
Other
Responses
Perc
ent o
f Res
pons
es
MorningEveningTotal
119
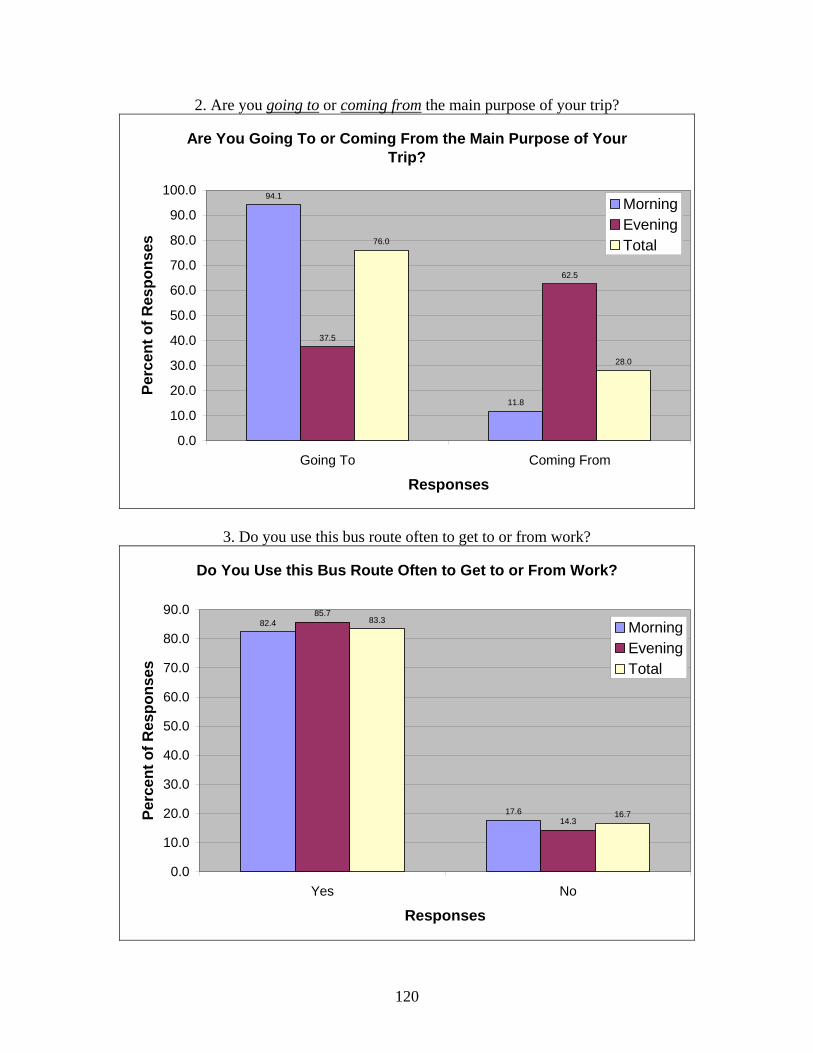
2. Are you going to or coming from the main purpose of your trip?
Are You Going To or Coming From the Main Purpose of Your Trip?
94.1
11.8
37.5
62.5
76.0
28.0
0.0
10.0
20.0
30.0
40.0
50.0
60.0
70.0
80.0
90.0
100.0
Going To Coming From
Responses
Perc
ent o
f Res
pons
es
MorningEveningTotal
3. Do you use this bus route often to get to or from work?
Do You Use this Bus Route Often to Get to or From Work?
82.4
17.6
85.7
14.3
83.3
16.7
0.0
10.0
20.0
30.0
40.0
50.0
60.0
70.0
80.0
90.0
Yes No
Responses
Perc
ent o
f Res
pons
es
MorningEveningTotal
120

4. You are:
You Are...
86.7
6.7
0.0 0.0 0.0
6.7
71.4
0.0
42.9
0.0 0.0 0.0
81.8
4.5
13.6
0.0 0.04.5
0.0
10.0
20.0
30.0
40.0
50.0
60.0
70.0
80.0
90.0
100.0
EmployedOutside
Your Home
Employed InYour Home
Student Homemaker Unemployed Retired
Responses
Perc
ent o
f Res
pons
es
MorningEveningTotal
5. Did this Ride On late evening or early morning bus trip help you…
Did this Ride On Late Evening or Early Morning Trip Help You…
35.7
7.1
21.4
14.3
28.6
20.0
0.0 0.0
20.0
60.0
31.6
5.3
15.8 15.8
36.8
0.0
10.0
20.0
30.0
40.0
50.0
60.0
70.0
Get This Job Get AnotherJob
Keep an OldJob
Work MoreHours
Work a BetterSchedule of
Hours
Responses
Perc
ent o
f Res
pons
es
MorningEveningTotal
121
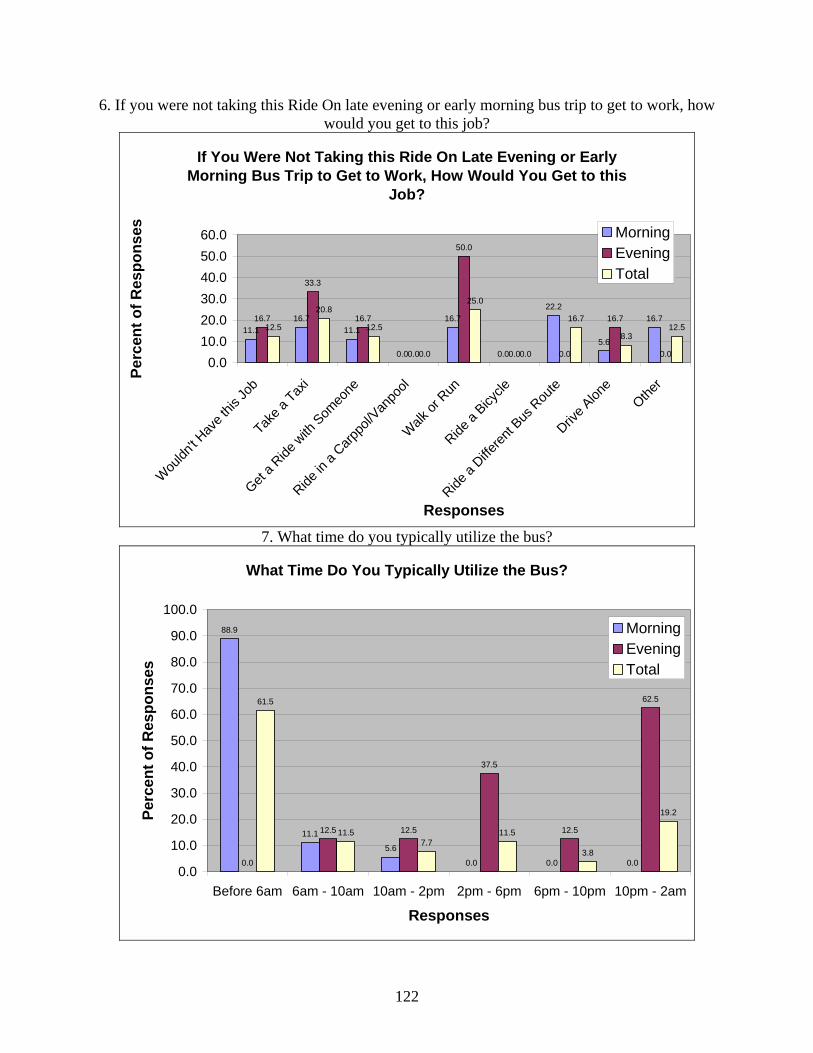
6. If you were not taking this Ride On late evening or early morning bus trip to get to work, how would you get to this job?
If You Were Not Taking this Ride On Late Evening or Early Morning Bus Trip to Get to Work, How Would You Get to this
Job?
11.116.7
11.1
0.0
16.7
0.0
22.2
5.6
16.716.7
33.3
16.7
0.0
50.0
0.0 0.0
16.7
0.0
12.5
20.8
12.5
0.0
25.0
0.0
16.7
8.312.5
0.010.020.030.040.050.060.0
Wou
ldn't H
ave t
his Jo
b
Take a
Taxi
Get a R
ide w
ith S
omeo
ne
Ride in
a Carp
pol/V
anpo
ol
Walk
or R
un
Ride a
Bicycle
Ride a
Differen
t Bus
Rou
te
Drive A
lone
Other
Responses
Perc
ent o
f Res
pons
es MorningEveningTotal
7. What time do you typically utilize the bus?
What Time Do You Typically Utilize the Bus?
88.9
11.1
5.6
0.0 0.0 0.00.0
12.5 12.5
37.5
12.5
62.561.5
11.57.7
11.5
3.8
19.2
0.0
10.0
20.0
30.0
40.0
50.0
60.0
70.0
80.0
90.0
100.0
Before 6am 6am - 10am 10am - 2pm 2pm - 6pm 6pm - 10pm 10pm - 2am
Responses
Perc
ent o
f Res
pons
es
MorningEveningTotal
122
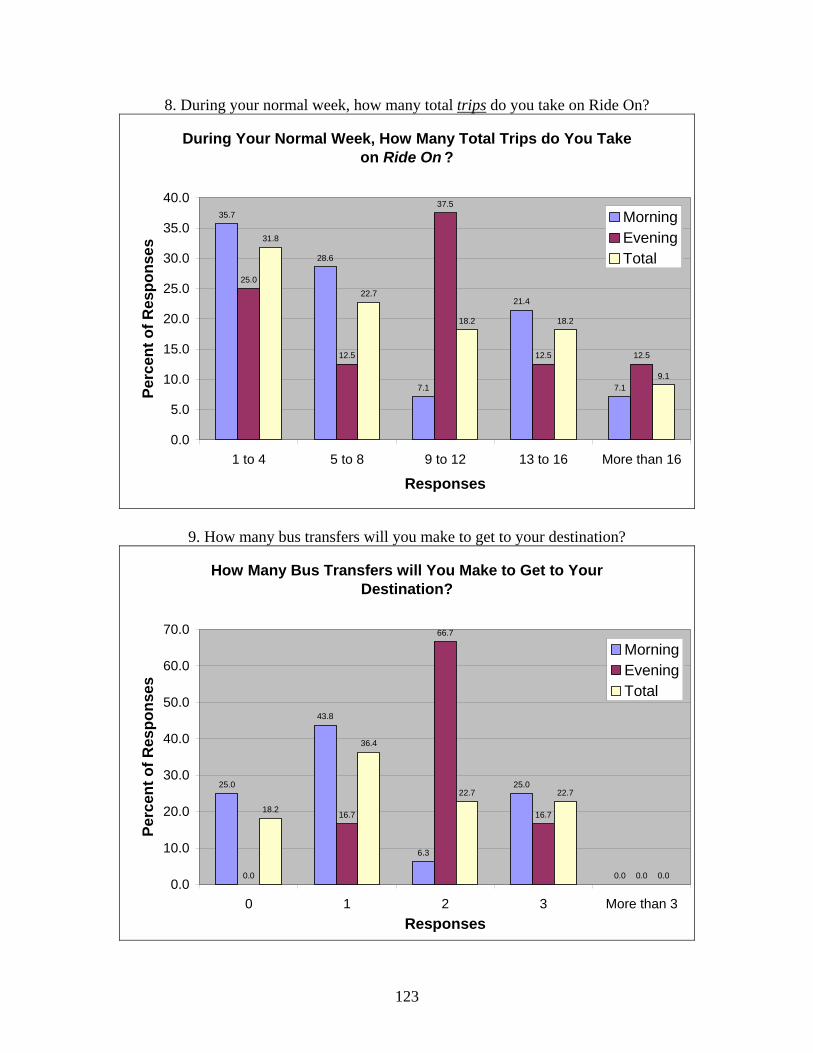
8. During your normal week, how many total trips do you take on Ride On?
During Your Normal Week, How Many Total Trips do You Take on Ride On ?
35.7
28.6
7.1
21.4
7.1
25.0
12.5
37.5
12.5 12.5
31.8
22.7
18.2 18.2
9.1
0.0
5.0
10.0
15.0
20.0
25.0
30.0
35.0
40.0
1 to 4 5 to 8 9 to 12 13 to 16 More than 16
Responses
Perc
ent o
f Res
pons
es
MorningEveningTotal
9. How many bus transfers will you make to get to your destination?
How Many Bus Transfers will You Make to Get to Your Destination?
25.0
43.8
6.3
25.0
0.00.0
16.7
66.7
16.7
0.0
18.2
36.4
22.7 22.7
0.00.0
10.0
20.0
30.0
40.0
50.0
60.0
70.0
0 1 2 3 More than 3Responses
Perc
ent o
f Res
pons
es
MorningEveningTotal
123
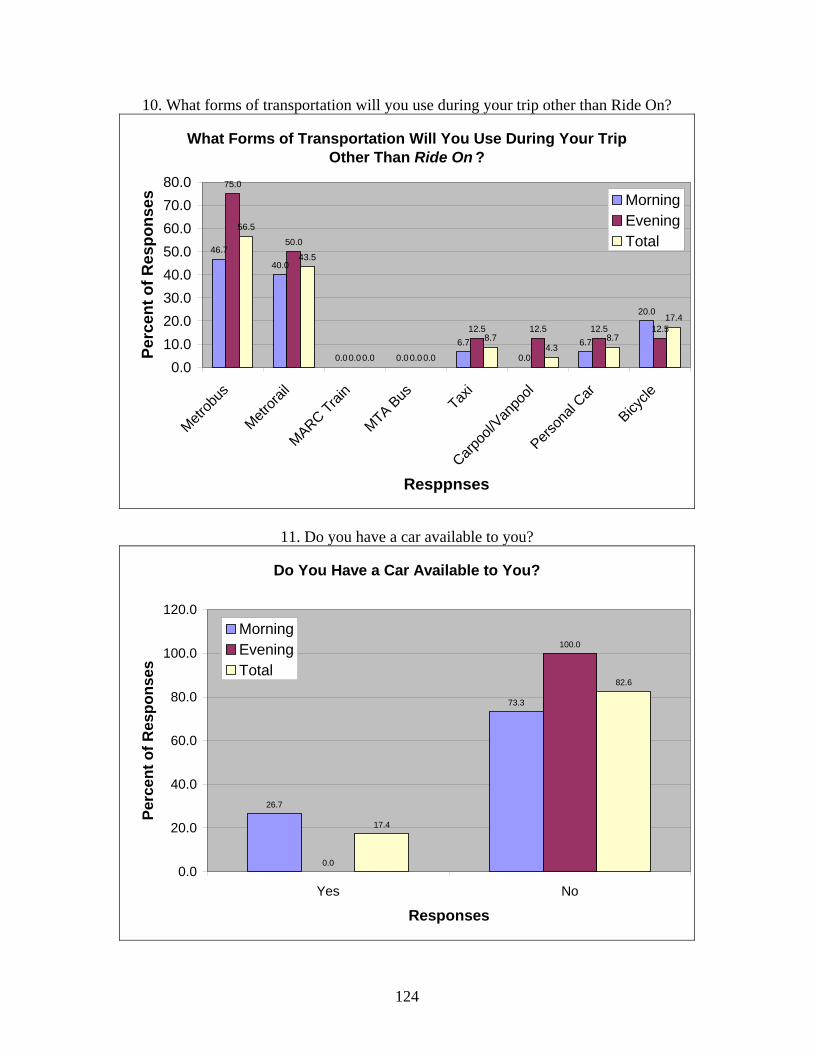
10. What forms of transportation will you use during your trip other than Ride On?
What Forms of Transportation Will You Use During Your Trip Other Than Ride On ?
46.7
40.0
0.0 0.0
6.7
0.0
6.7
20.0
75.0
50.0
0.0 0.0
12.5 12.5 12.5 12.5
56.5
43.5
0.0 0.0
8.74.3
8.7
17.4
0.010.020.030.040.050.060.070.080.0
Metrob
us
Metrora
il
MARC Train
MTA Bus Tax
i
Carpoo
l/Van
pool
Person
al Car
Bicycle
Resppnses
Perc
ent o
f Res
pons
es MorningEveningTotal
11. Do you have a car available to you?
Do You Have a Car Available to You?
26.7
73.3
0.0
100.0
17.4
82.6
0.0
20.0
40.0
60.0
80.0
100.0
120.0
Yes No
Responses
Perc
ent o
f Res
pons
es
MorningEveningTotal
124
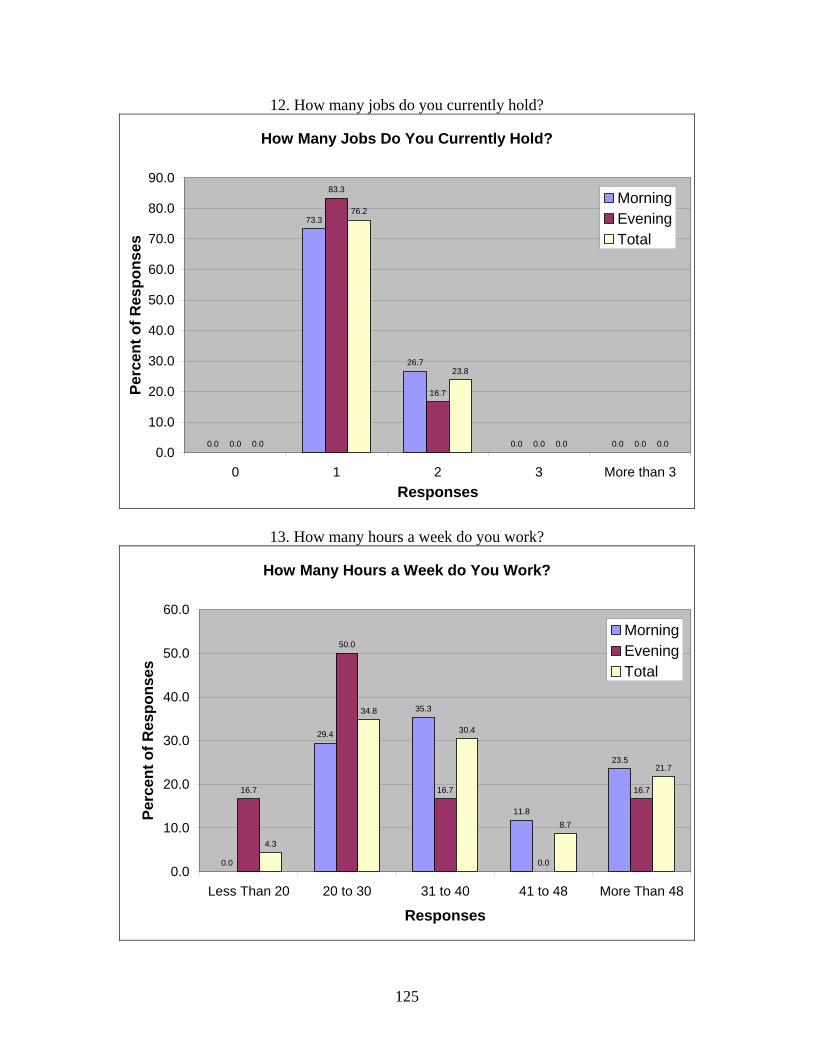
12. How many jobs do you currently hold?
How Many Jobs Do You Currently Hold?
0.0
73.3
26.7
0.0 0.00.0
83.3
16.7
0.0 0.00.0
76.2
23.8
0.0 0.00.0
10.0
20.0
30.0
40.0
50.0
60.0
70.0
80.0
90.0
0 1 2 3 More than 3Responses
Perc
ent o
f Res
pons
es
MorningEveningTotal
13. How many hours a week do you work?
How Many Hours a Week do You Work?
0.0
29.4
35.3
11.8
23.5
16.7
50.0
16.7
0.0
16.7
4.3
34.8
30.4
8.7
21.7
0.0
10.0
20.0
30.0
40.0
50.0
60.0
Less Than 20 20 to 30 31 to 40 41 to 48 More Than 48
Responses
Perc
ent o
f Res
pons
es
MorningEveningTotal
125
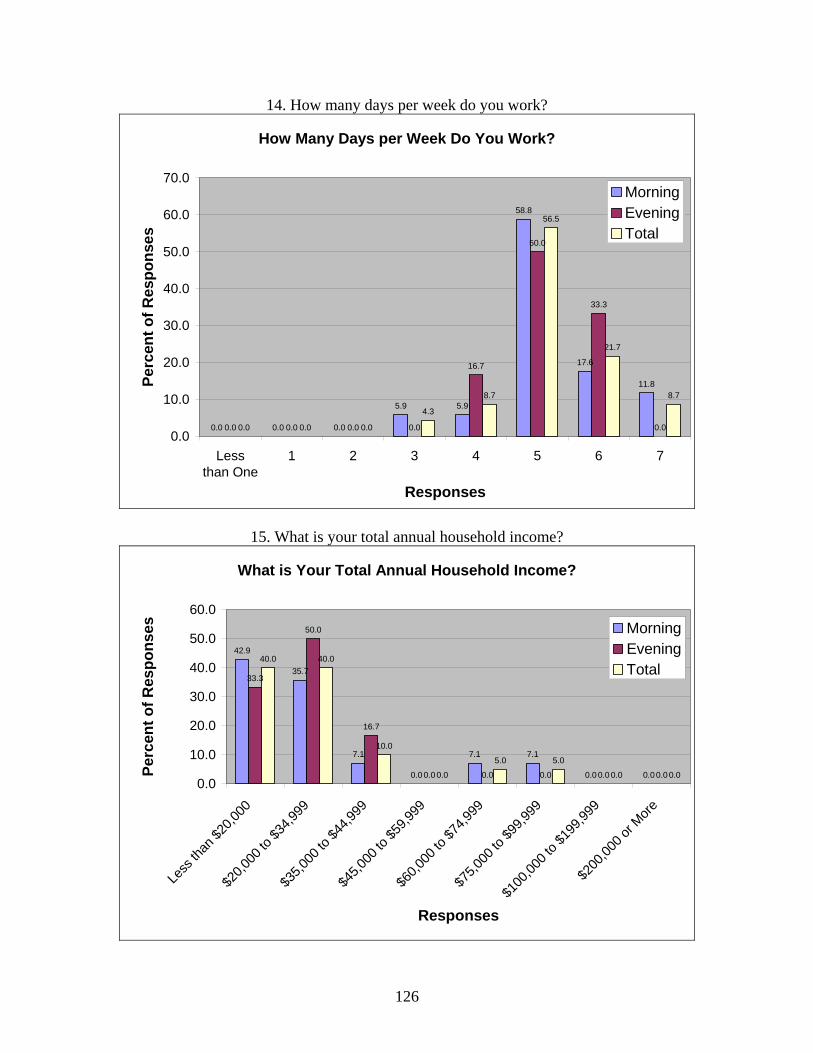
14. How many days per week do you work?
How Many Days per Week Do You Work?
0.0 0.0 0.0
5.9 5.9
58.8
17.6
11.8
0.0 0.0 0.0 0.0
16.7
50.0
33.3
0.00.0 0.0 0.0
4.3
8.7
56.5
21.7
8.7
0.0
10.0
20.0
30.0
40.0
50.0
60.0
70.0
Lessthan One
1 2 3 4 5 6 7
Responses
Perc
ent o
f Res
pons
es
MorningEveningTotal
15. What is your total annual household income?
What is Your Total Annual Household Income?
42.9
35.7
7.1
0.0
7.1 7.1
0.0 0.0
33.3
50.0
16.7
0.0 0.0 0.0 0.0 0.0
40.0 40.0
10.0
0.0
5.0 5.0
0.0 0.00.0
10.0
20.0
30.0
40.0
50.0
60.0
Less
than
$20,0
00
$20,0
00 to
$34,9
99
$35,0
00 to
$44,9
99
$45,0
00 to
$59,9
99
$60,0
00 to
$74,9
99
$75,0
00 to
$99,9
99
$100
,000 t
o $19
9,999
$200
,000 o
r More
Responses
Perc
ent o
f Res
pons
es MorningEveningTotal
126

Omitted Responses by Question
0.0
15.0 15.0
25.0
30.0
10.0 10.0
30.0
20.0
25.0 25.0 25.0
15.0 15.0
30.0
0.0 0.0
12.5 12.5
37.5
25.0
0.0 0.0
25.0
0.0 0.0
25.0 25.0 25.0 25.0
0.0
10.7
14.3
21.4
32.1
14.3
7.1
21.4 21.4
17.9 17.9
25.0
17.9 17.9
28.6
0.0
5.0
10.0
15.0
20.0
25.0
30.0
35.0
40.0
1 2 3 4 5 6 7 8 9 10 11 12 13 14 15
Question Number
Perc
ent o
f Res
pons
es
MorningEveningTotal
127

Route 55
Morning Evening Total Spanish Surveys 10 2 12 Total Responses 43 36 79
Total Riders 78 56 134
1. What is the main purpose of your trip today?
What is the Main Purpose of Your Trip Today?
95.0
2.5 0.0 0.0 0.0 2.5 2.5 2.5 0.0
82.9
2.9 0.05.7
0.0 2.9 2.98.6 5.7
89.3
2.7 0.0 2.7 0.0 2.7 2.7 5.3 2.7
0.010.020.030.040.050.060.070.080.090.0
100.0
Work
Shopp
ing
Schoo
l
Colleg
e
Social
Serv
ices
Medica
l App
ointm
ent
Social
Visi
t
Person
al Bus
iness
Other
Responses
Perc
ent o
f Res
pons
es
MorningEveningTotal
128
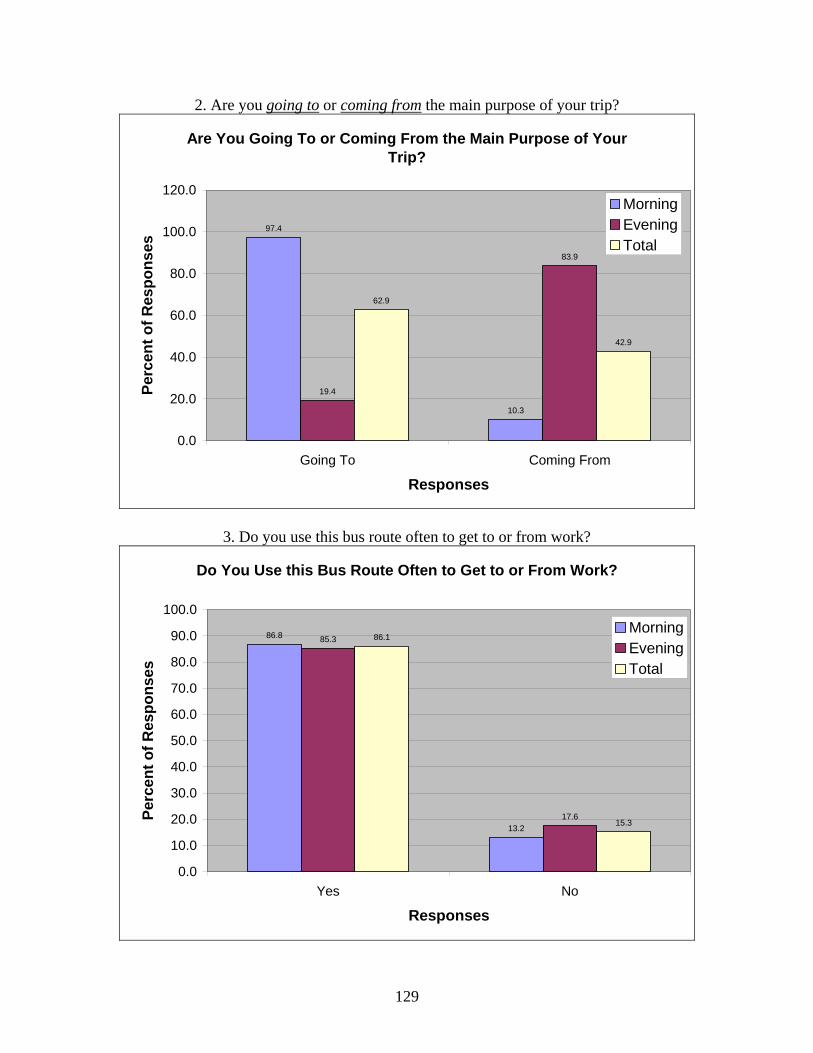
2. Are you going to or coming from the main purpose of your trip?
Are You Going To or Coming From the Main Purpose of Your Trip?
97.4
10.3
19.4
83.9
62.9
42.9
0.0
20.0
40.0
60.0
80.0
100.0
120.0
Going To Coming From
Responses
Perc
ent o
f Res
pons
es
MorningEveningTotal
3. Do you use this bus route often to get to or from work?
Do You Use this Bus Route Often to Get to or From Work?
86.8
13.2
85.3
17.6
86.1
15.3
0.0
10.0
20.0
30.0
40.0
50.0
60.0
70.0
80.0
90.0
100.0
Yes No
Responses
Perc
ent o
f Res
pons
es
MorningEveningTotal
129
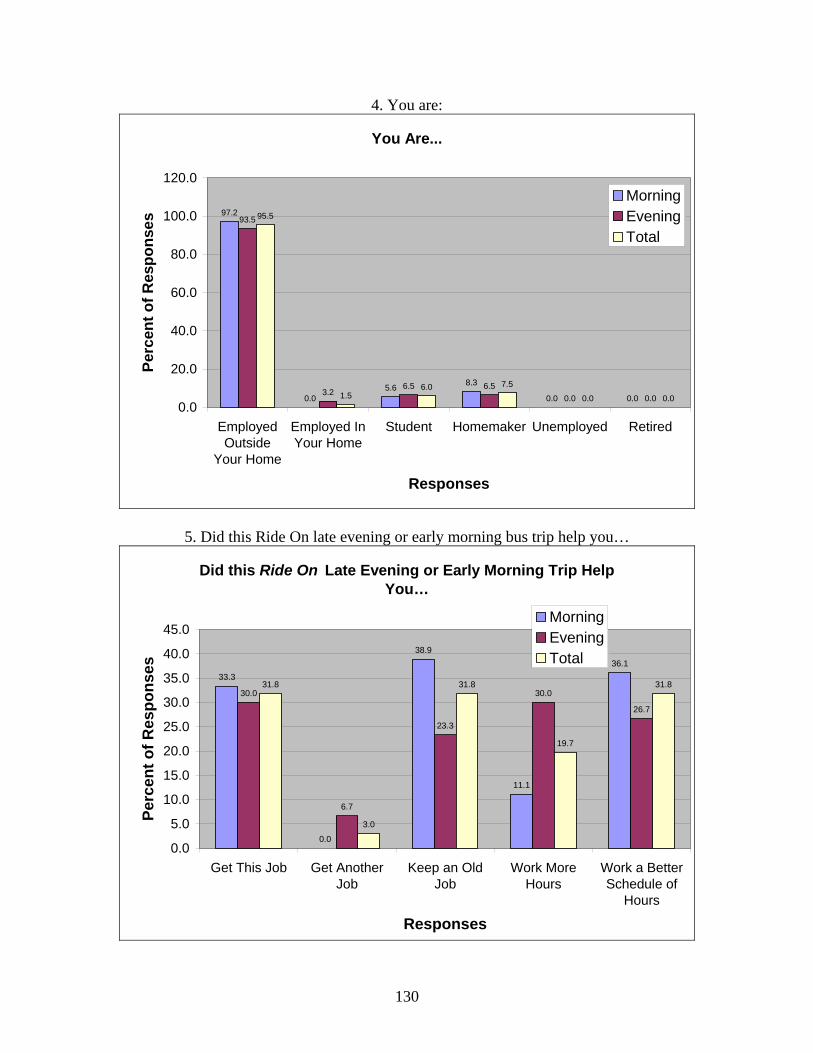
4. You are:
You Are...
97.2
0.05.6 8.3
0.0 0.0
93.5
3.26.5 6.5
0.0 0.0
95.5
1.56.0 7.5
0.0 0.00.0
20.0
40.0
60.0
80.0
100.0
120.0
EmployedOutside
Your Home
Employed InYour Home
Student Homemaker Unemployed Retired
Responses
Perc
ent o
f Res
pons
es
MorningEveningTotal
5. Did this Ride On late evening or early morning bus trip help you…
Did this Ride On Late Evening or Early Morning Trip Help You…
33.3
0.0
38.9
11.1
36.1
30.0
6.7
23.3
30.0
26.7
31.8
3.0
31.8
19.7
31.8
0.0
5.0
10.0
15.0
20.0
25.0
30.0
35.0
40.0
45.0
Get This Job Get AnotherJob
Keep an OldJob
Work MoreHours
Work a BetterSchedule of
Hours
Responses
Perc
ent o
f Res
pons
es
MorningEveningTotal
130
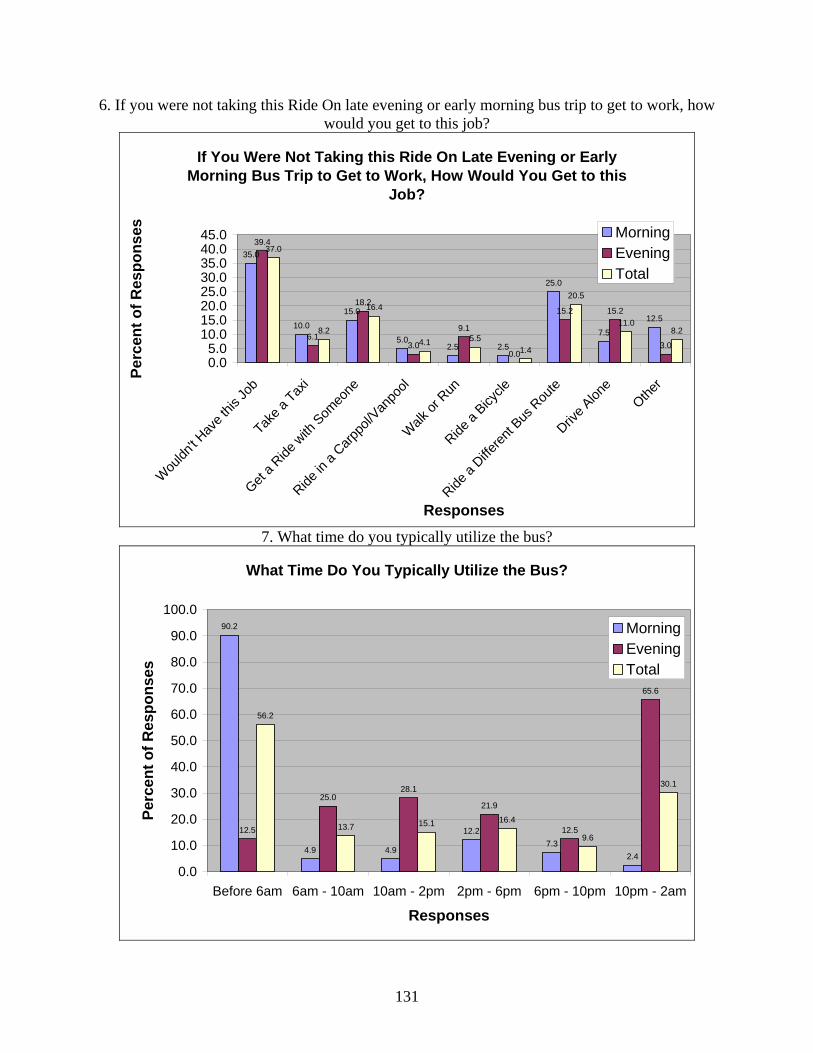
6. If you were not taking this Ride On late evening or early morning bus trip to get to work, how would you get to this job?
If You Were Not Taking this Ride On Late Evening or Early Morning Bus Trip to Get to Work, How Would You Get to this
Job?
35.0
10.0
15.0
5.02.5 2.5
25.0
7.5
12.5
39.4
6.1
18.2
3.0
9.1
0.0
15.2 15.2
3.0
37.0
8.2
16.4
4.1 5.51.4
20.5
11.08.2
0.05.0
10.015.020.025.030.035.040.045.0
Wou
ldn't H
ave t
his Jo
b
Take a
Taxi
Get a R
ide w
ith S
omeo
ne
Ride in
a Carp
pol/V
anpo
ol
Walk
or R
un
Ride a
Bicycle
Ride a
Differen
t Bus
Rou
te
Drive A
lone
Other
Responses
Perc
ent o
f Res
pons
es MorningEveningTotal
7. What time do you typically utilize the bus?
What Time Do You Typically Utilize the Bus?
90.2
4.9 4.9
12.27.3
2.4
12.5
25.028.1
21.9
12.5
65.6
56.2
13.7 15.1 16.4
9.6
30.1
0.0
10.0
20.0
30.0
40.0
50.0
60.0
70.0
80.0
90.0
100.0
Before 6am 6am - 10am 10am - 2pm 2pm - 6pm 6pm - 10pm 10pm - 2am
Responses
Perc
ent o
f Res
pons
es
MorningEveningTotal
131
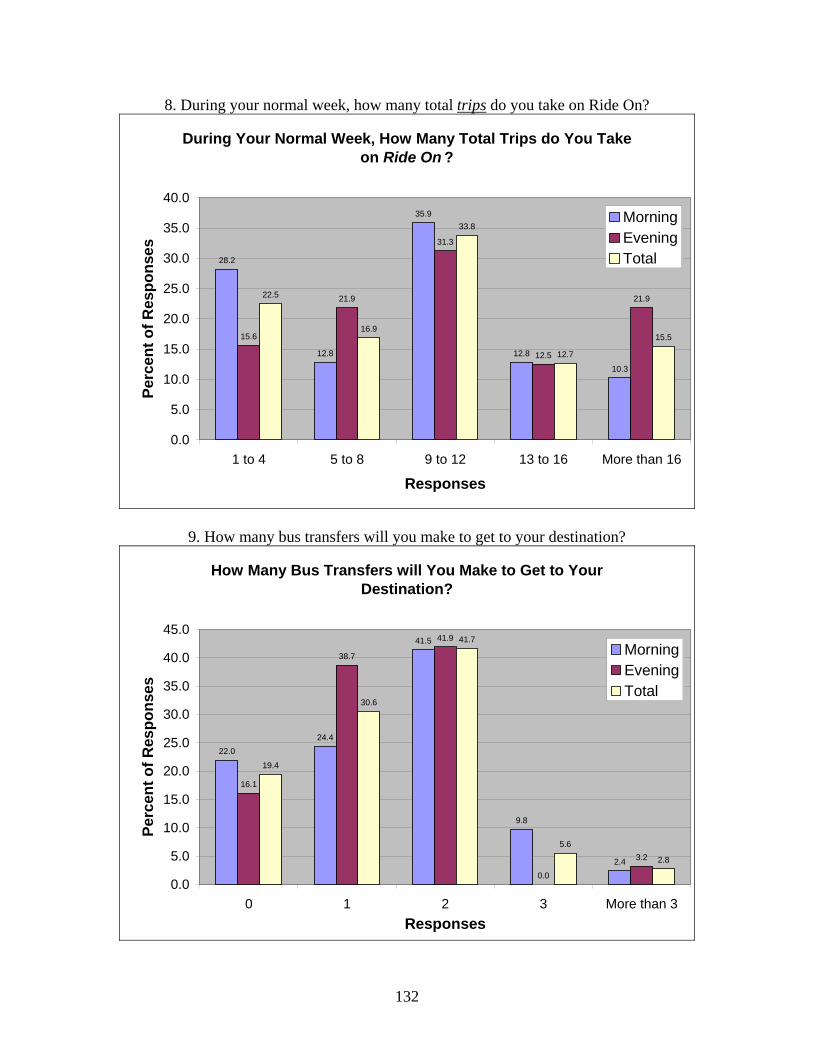
8. During your normal week, how many total trips do you take on Ride On?
During Your Normal Week, How Many Total Trips do You Take on Ride On ?
28.2
12.8
35.9
12.8
10.3
15.6
21.9
31.3
12.5
21.922.5
16.9
33.8
12.7
15.5
0.0
5.0
10.0
15.0
20.0
25.0
30.0
35.0
40.0
1 to 4 5 to 8 9 to 12 13 to 16 More than 16
Responses
Perc
ent o
f Res
pons
es
MorningEveningTotal
9. How many bus transfers will you make to get to your destination?
How Many Bus Transfers will You Make to Get to Your Destination?
22.024.4
41.5
9.8
2.4
16.1
38.7
41.9
0.0
3.2
19.4
30.6
41.7
5.6
2.8
0.0
5.0
10.0
15.0
20.0
25.0
30.0
35.0
40.0
45.0
0 1 2 3 More than 3Responses
Perc
ent o
f Res
pons
es
MorningEveningTotal
132
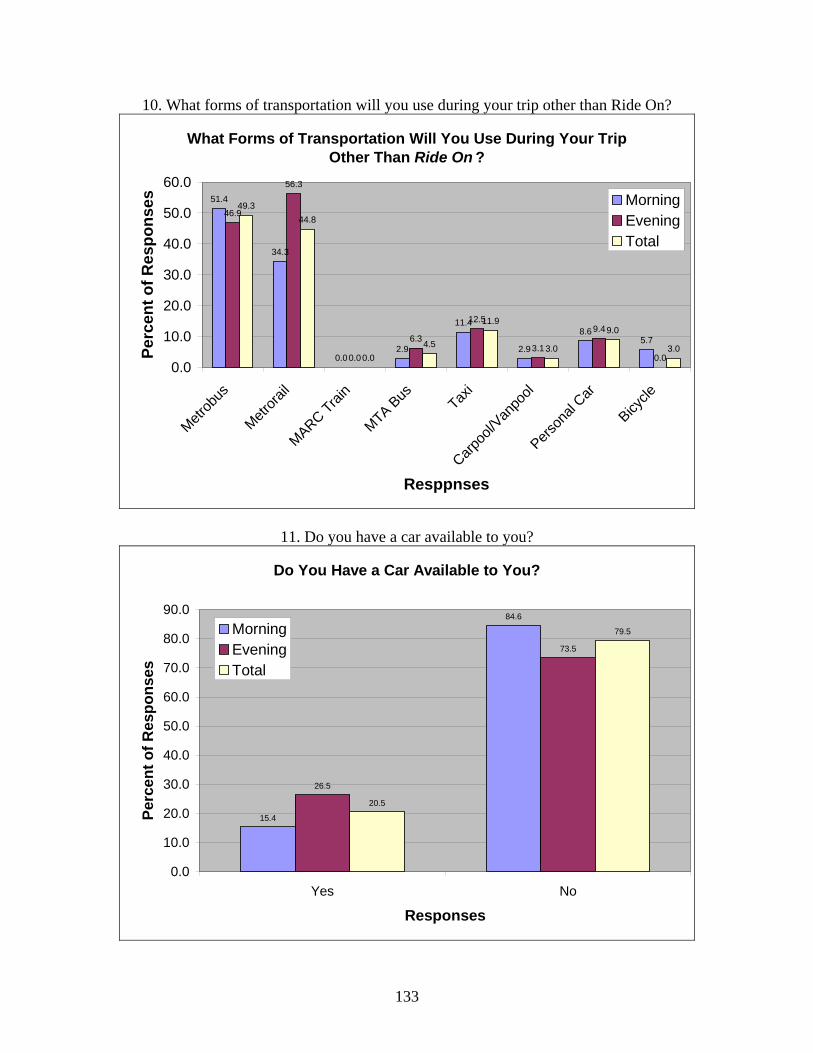
10. What forms of transportation will you use during your trip other than Ride On?
What Forms of Transportation Will You Use During Your Trip Other Than Ride On ?
51.4
34.3
0.02.9
11.4
2.9
8.65.7
46.9
56.3
0.0
6.3
12.5
3.1
9.4
0.0
49.344.8
0.04.5
11.9
3.0
9.0
3.0
0.0
10.0
20.0
30.0
40.0
50.0
60.0
Metrob
us
Metrora
il
MARC Train
MTA Bus Tax
i
Carpoo
l/Van
pool
Person
al Car
Bicycle
Resppnses
Perc
ent o
f Res
pons
es MorningEveningTotal
11. Do you have a car available to you?
Do You Have a Car Available to You?
15.4
84.6
26.5
73.5
20.5
79.5
0.0
10.0
20.0
30.0
40.0
50.0
60.0
70.0
80.0
90.0
Yes No
Responses
Perc
ent o
f Res
pons
es
MorningEveningTotal
133
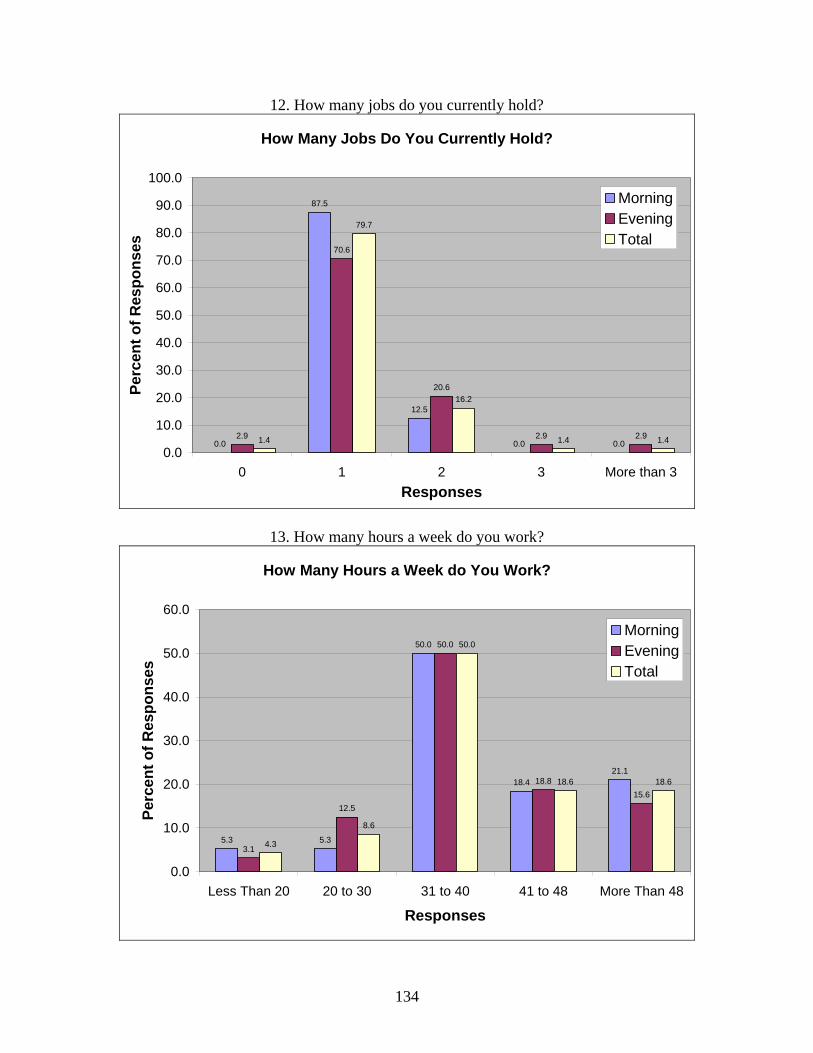
12. How many jobs do you currently hold?
How Many Jobs Do You Currently Hold?
0.0
87.5
12.5
0.0 0.02.9
70.6
20.6
2.9 2.91.4
79.7
16.2
1.4 1.4
0.0
10.0
20.0
30.0
40.0
50.0
60.0
70.0
80.0
90.0
100.0
0 1 2 3 More thResponses
Perc
ent o
f Res
pons
es
an 3
MorningEveningTotal
13. How many hours a week do you work?
How Many Hours a Week do You Work?
5.3 5.3
50.0
18.421.1
3.1
12.5
50.0
18.815.6
4.3
8.6
50.0
18.6 18.6
0.0
10.0
20.0
30.0
40.0
50.0
60.0
Less Than 20 20 to 30 31 to 40 41 to 48 More Than 48
Responses
Perc
ent o
f Res
pons
es
MorningEveningTotal
134

14. How many days per week do you work?
How Many Days per Week Do You Work?
0.0 0.0 0.0
5.12.6
61.5
15.4 15.4
3.00.0 0.0 0.0
12.1
48.5
15.2
21.2
1.4 0.0 0.02.8
6.9
55.6
15.318.1
0.0
10.0
20.0
30.0
40.0
50.0
60.0
70.0
Lessthan One
1 2 3 4 5 6 7
Responses
Perc
ent o
f Res
pons
es
MorningEveningTotal
15. What is your total annual household income?
What is Your Total Annual Household Income?
26.7
40.0
13.3
3.3 3.3 3.3
10.0
0.0
46.4
17.921.4
14.3
0.0 0.0 0.0 0.0
36.2
29.3
17.2
8.6
1.7 1.75.2
0.00.05.0
10.015.020.025.030.035.040.045.050.0
Less
than
$20,0
00
$20,0
00 to
$34,9
99
$35,0
00 to
$44,9
99
$45,0
00 to
$59,9
99
$60,0
00 to
$74,9
99
$75,0
00 to
$99,9
99
$100
,000 t
o $19
9,999
$200
,000 o
r More
Responses
Perc
ent o
f Res
pons
es MorningEveningTotal
135
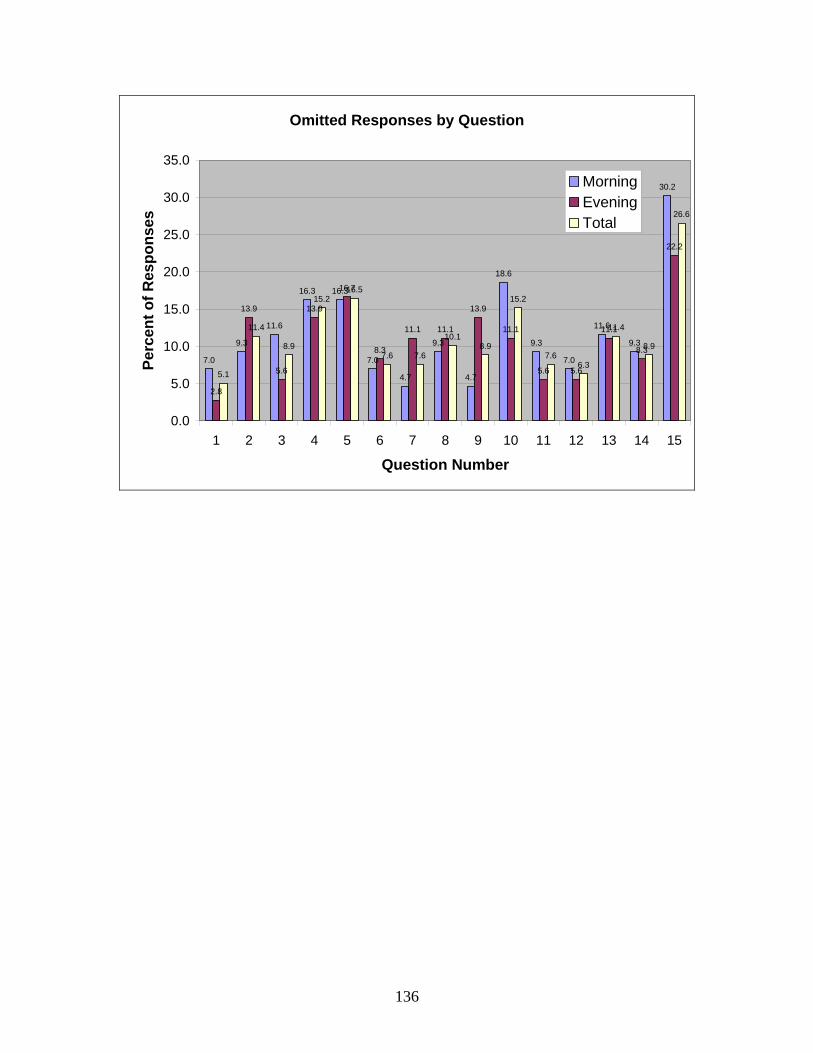
Omitted Responses by Question
7.0
9.3
11.6
16.3 16.3
7.0
4.7
9.3
4.7
18.6
9.3
7.0
11.6
9.3
30.2
2.8
13.9
5.6
13.9
16.7
8.3
11.1 11.1
13.9
11.1
5.6 5.6
11.1
8.3
22.2
5.1
11.4
8.9
15.216.5
7.6 7.6
10.18.9
15.2
7.66.3
11.4
8.9
26.6
0.0
5.0
10.0
15.0
20.0
25.0
30.0
35.0
1 2 3 4 5 6 7 8 9 10 11 12 13 14 15
Question Number
Perc
ent o
f Res
pons
es
MorningEveningTotal
136
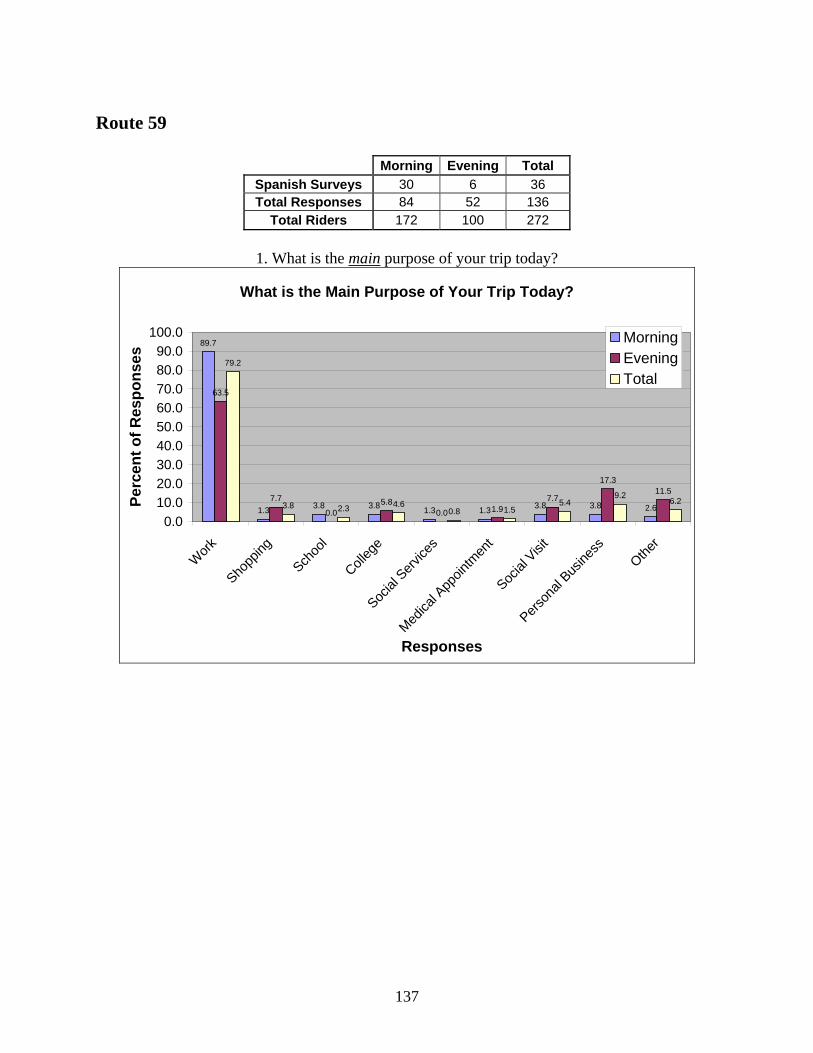
Route 59
Morning Evening Total Spanish Surveys 30 6 36 Total Responses 84 52 136
Total Riders 172 100 272
1. What is the main purpose of your trip today?
What is the Main Purpose of Your Trip Today?
89.7
1.3 3.8 3.8 1.3 1.3 3.8 3.8 2.6
63.5
7.7
0.05.8
0.0 1.97.7
17.311.5
79.2
3.8 2.3 4.60.8 1.5
5.49.2
6.2
0.010.020.030.040.050.060.070.080.090.0
100.0
Work
Shopp
ing
Schoo
l
Colleg
e
Social
Serv
ices
Medica
l App
ointm
ent
Social
Visi
t
Person
al Bus
iness
Other
Responses
Perc
ent o
f Res
pons
es
MorningEveningTotal
137
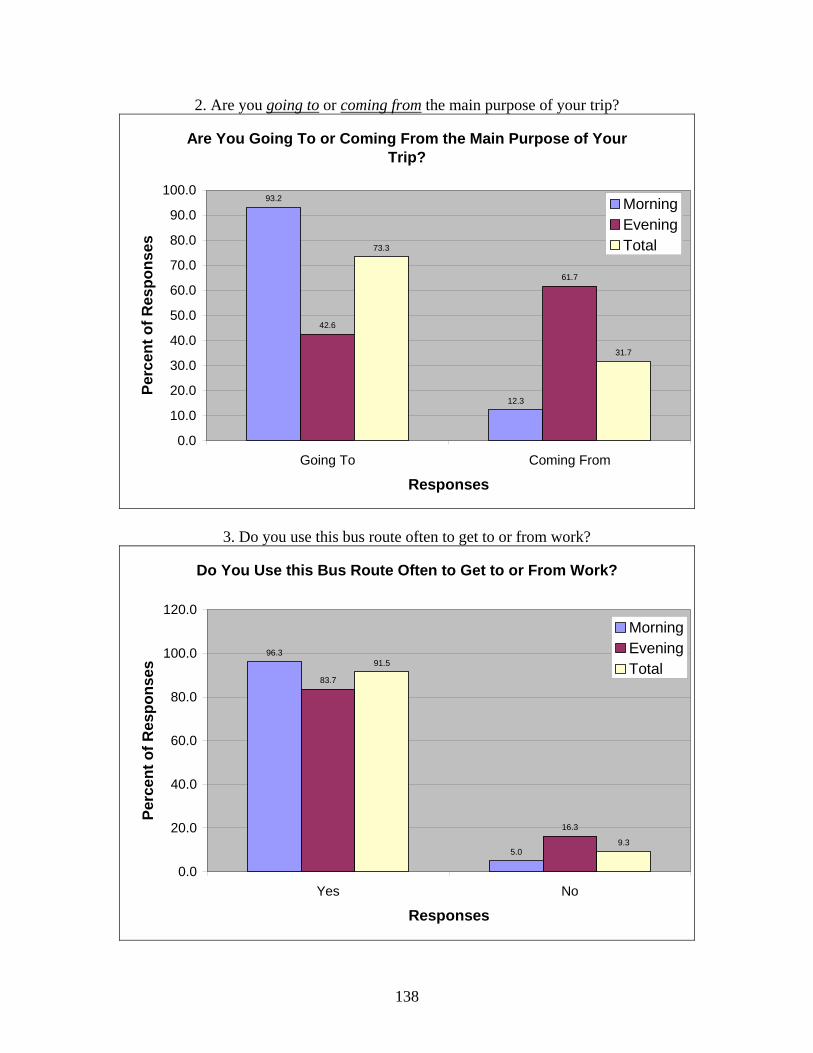
2. Are you going to or coming from the main purpose of your trip?
Are You Going To or Coming From the Main Purpose of Your Trip?
93.2
12.3
42.6
61.7
73.3
31.7
0.0
10.0
20.0
30.0
40.0
50.0
60.0
70.0
80.0
90.0
100.0
Going To Coming From
Responses
Perc
ent o
f Res
pons
es
MorningEveningTotal
3. Do you use this bus route often to get to or from work?
Do You Use this Bus Route Often to Get to or From Work?
96.3
5.0
83.7
16.3
91.5
9.3
0.0
20.0
40.0
60.0
80.0
100.0
120.0
Yes No
Responses
Perc
ent o
f Res
pons
es
MorningEveningTotal
138
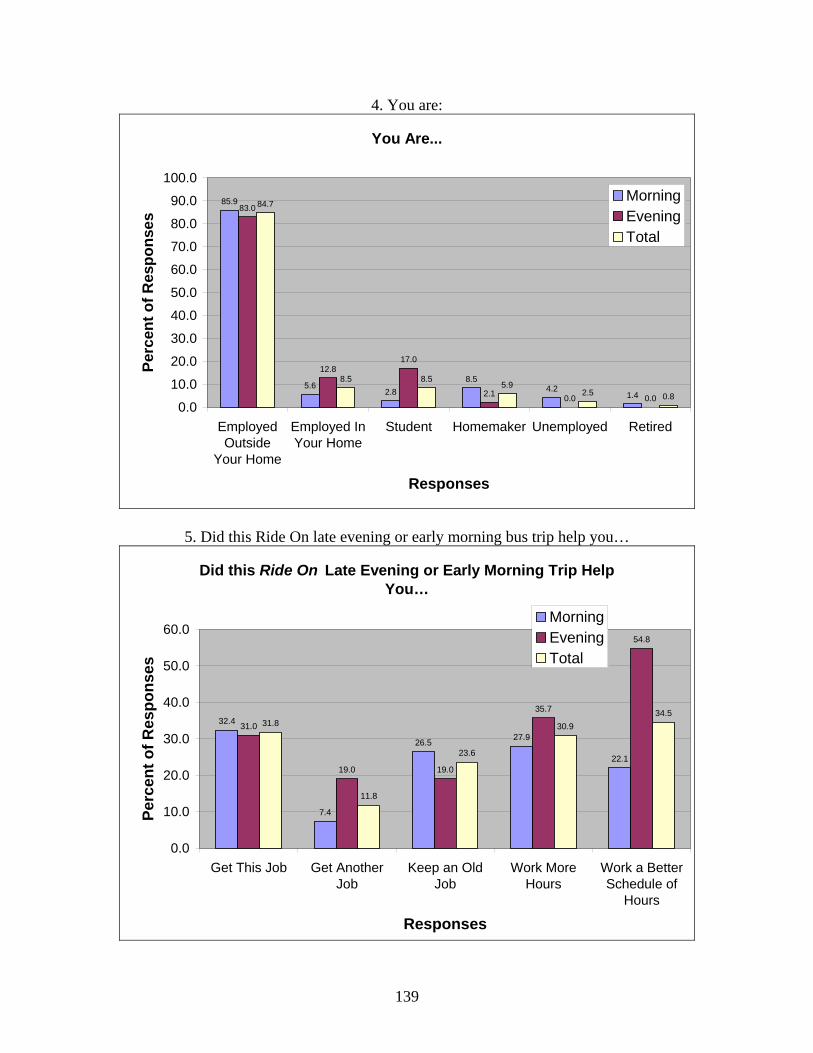
4. You are:
You Are...
85.9
5.62.8
8.54.2
1.4
83.0
12.817.0
2.1 0.0 0.0
84.7
8.5 8.55.9
2.5 0.80.0
10.0
20.0
30.0
40.0
50.0
60.0
70.0
80.0
90.0
100.0
EmployedOutside
Your Home
Employed InYour Home
Student Homemaker Unemployed Retired
Responses
Perc
ent o
f Res
pons
es
MorningEveningTotal
5. Did this Ride On late evening or early morning bus trip help you…
Did this Ride On Late Evening or Early Morning Trip Help You…
32.4
7.4
26.5 27.9
22.1
31.0
19.0 19.0
35.7
54.8
31.8
11.8
23.6
30.934.5
0.0
10.0
20.0
30.0
40.0
50.0
60.0
Get This Job Get AnotherJob
Keep an OldJob
Work MoreHours
Work a BetterSchedule of
Hours
Responses
Perc
ent o
f Res
pons
es
MorningEveningTotal
139
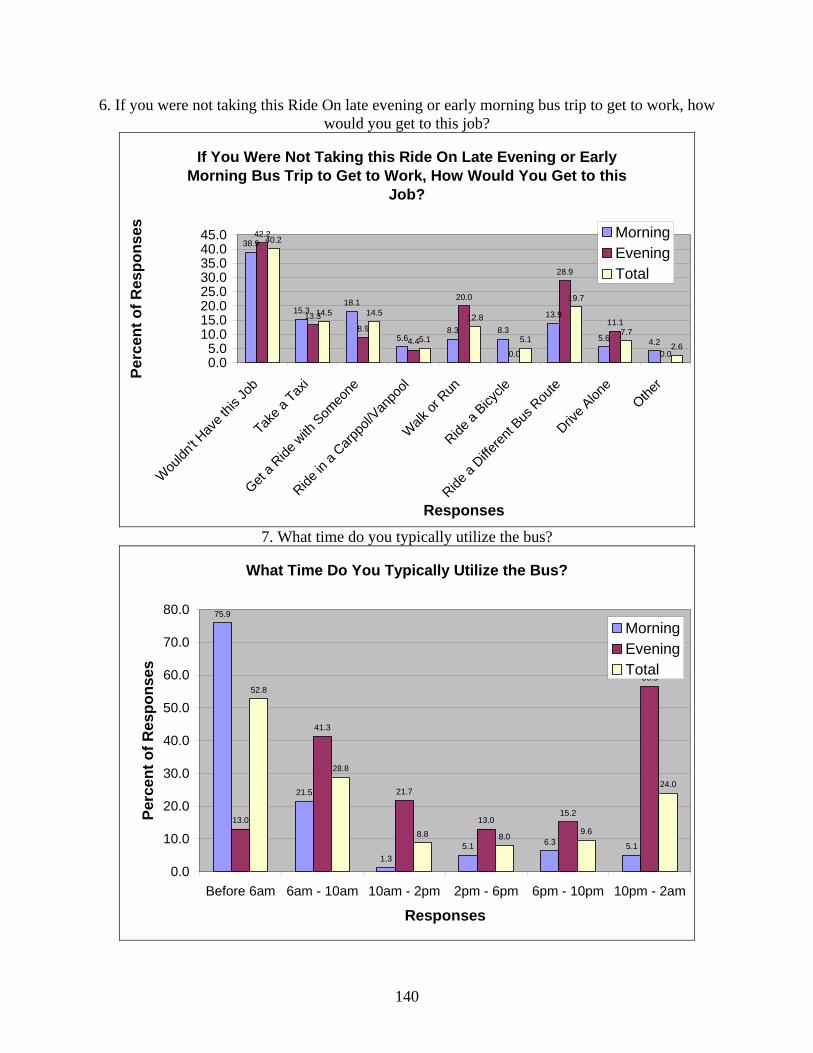
6. If you were not taking this Ride On late evening or early morning bus trip to get to work, how would you get to this job?
If You Were Not Taking this Ride On Late Evening or Early Morning Bus Trip to Get to Work, How Would You Get to this
Job?
38.9
15.318.1
5.68.3 8.3
13.9
5.6 4.2
42.2
13.38.9
4.4
20.0
0.0
28.9
11.1
0.0
40.2
14.5 14.5
5.1
12.8
5.1
19.7
7.7
2.6
0.05.0
10.015.020.025.030.035.040.045.0
Wou
ldn't H
ave t
his Jo
b
Take a
Taxi
Get a R
ide w
ith S
omeo
ne
Ride in
a Carp
pol/V
anpo
ol
Walk
or R
un
Ride a
Bicycle
Ride a
Differen
t Bus
Rou
te
Drive A
lone
Other
Responses
Perc
ent o
f Res
pons
es MorningEveningTotal
7. What time do you typically utilize the bus?
What Time Do You Typically Utilize the Bus?
75.9
21.5
1.35.1 6.3 5.1
13.0
41.3
21.7
13.015.2
56.552.8
28.8
8.8 8.0 9.6
24.0
0.0
10.0
20.0
30.0
40.0
50.0
60.0
70.0
80.0
Before 6am 6am - 10am 10am - 2pm 2pm - 6pm 6pm - 10pm 10pm - 2am
Responses
Perc
ent o
f Res
pons
es
MorningEveningTotal
140
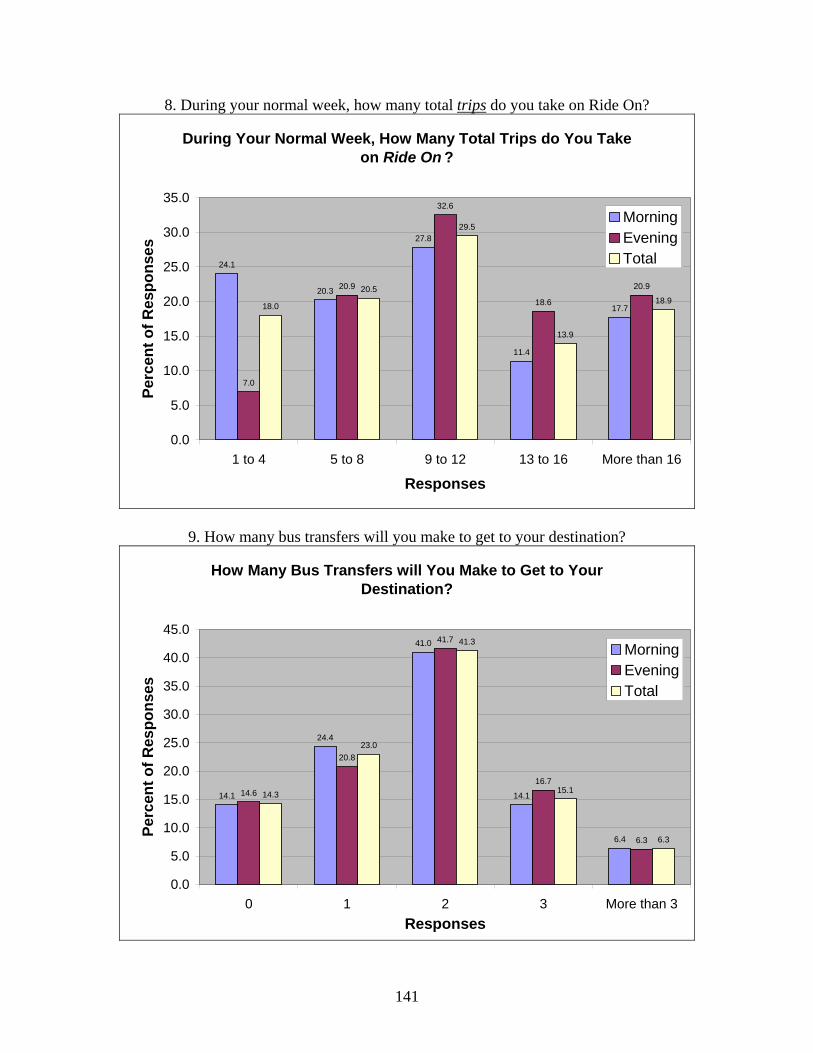
8. During your normal week, how many total trips do you take on Ride On?
During Your Normal Week, How Many Total Trips do You Take on Ride On ?
24.1
20.3
27.8
11.4
17.7
7.0
20.9
32.6
18.6
20.9
18.0
20.5
29.5
13.9
18.9
0.0
5.0
10.0
15.0
20.0
25.0
30.0
35.0
1 to 4 5 to 8 9 to 12 13 to 16 More than 16
Responses
Perc
ent o
f Res
pons
es
MorningEveningTotal
9. How many bus transfers will you make to get to your destination?
How Many Bus Transfers will You Make to Get to Your Destination?
14.1
24.4
41.0
14.1
6.4
14.6
20.8
41.7
16.7
6.3
14.3
23.0
41.3
15.1
6.3
0.0
5.0
10.0
15.0
20.0
25.0
30.0
35.0
40.0
45.0
0 1 2 3 More than 3Responses
Perc
ent o
f Res
pons
es
MorningEveningTotal
141
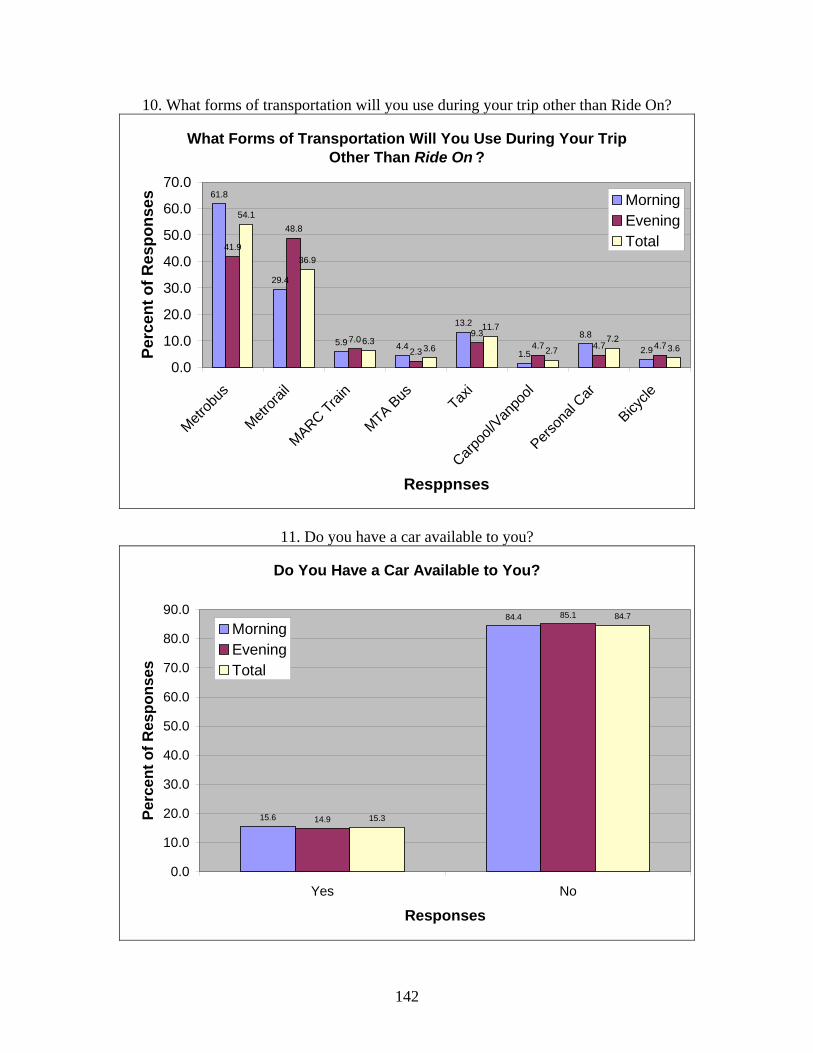
10. What forms of transportation will you use during your trip other than Ride On?
What Forms of Transportation Will You Use During Your Trip Other Than Ride On ?
61.8
29.4
5.9 4.4
13.2
1.5
8.8
2.9
41.9
48.8
7.02.3
9.34.7 4.7 4.7
54.1
36.9
6.33.6
11.7
2.77.2
3.6
0.0
10.0
20.0
30.0
40.0
50.0
60.0
70.0
Metrob
us
Metrora
il
MARC Train
MTA Bus Tax
i
Carpoo
l/Van
pool
Person
al Car
Bicycle
Resppnses
Perc
ent o
f Res
pons
es MorningEveningTotal
11. Do you have a car available to you?
Do You Have a Car Available to You?
15.6
84.4
14.9
85.1
15.3
84.7
0.0
10.0
20.0
30.0
40.0
50.0
60.0
70.0
80.0
90.0
Yes No
Responses
Perc
ent o
f Res
pons
es
MorningEveningTotal
142
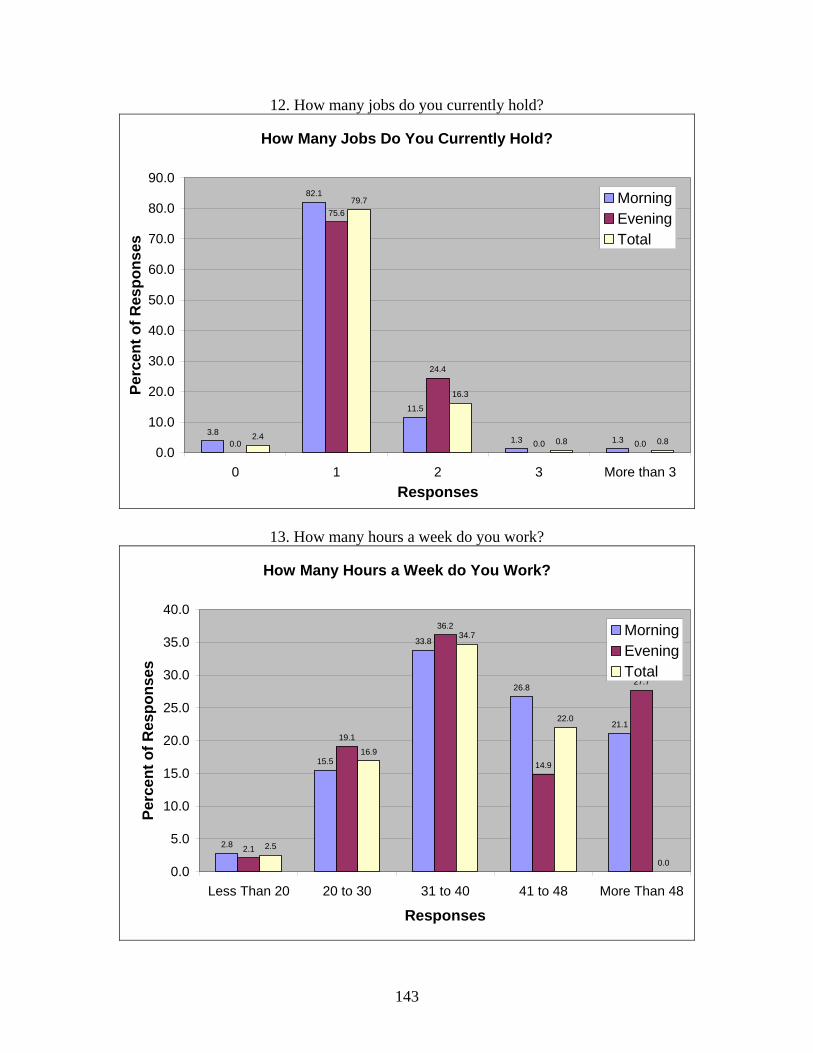
12. How many jobs do you currently hold?
How Many Jobs Do You Currently Hold?
3.8
82.1
11.5
1.3 1.30.0
75.6
24.4
0.0 0.02.4
79.7
16.3
0.8 0.80.0
10.0
20.0
30.0
40.0
50.0
60.0
70.0
80.0
90.0
0 1 2 3 More than 3Responses
Perc
ent o
f Res
pons
es
MorningEveningTotal
13. How many hours a week do you work?
How Many Hours a Week do You Work?
2.8
15.5
33.8
26.8
21.1
2.1
19.1
36.2
14.9
27.7
2.5
16.9
34.7
22.0
0.00.0
5.0
10.0
15.0
20.0
25.0
30.0
35.0
40.0
Less Than 20 20 to 30 31 to 40 41 to 48 More Than 48
Responses
Perc
ent o
f Res
pons
es
MorningEveningTotal
143
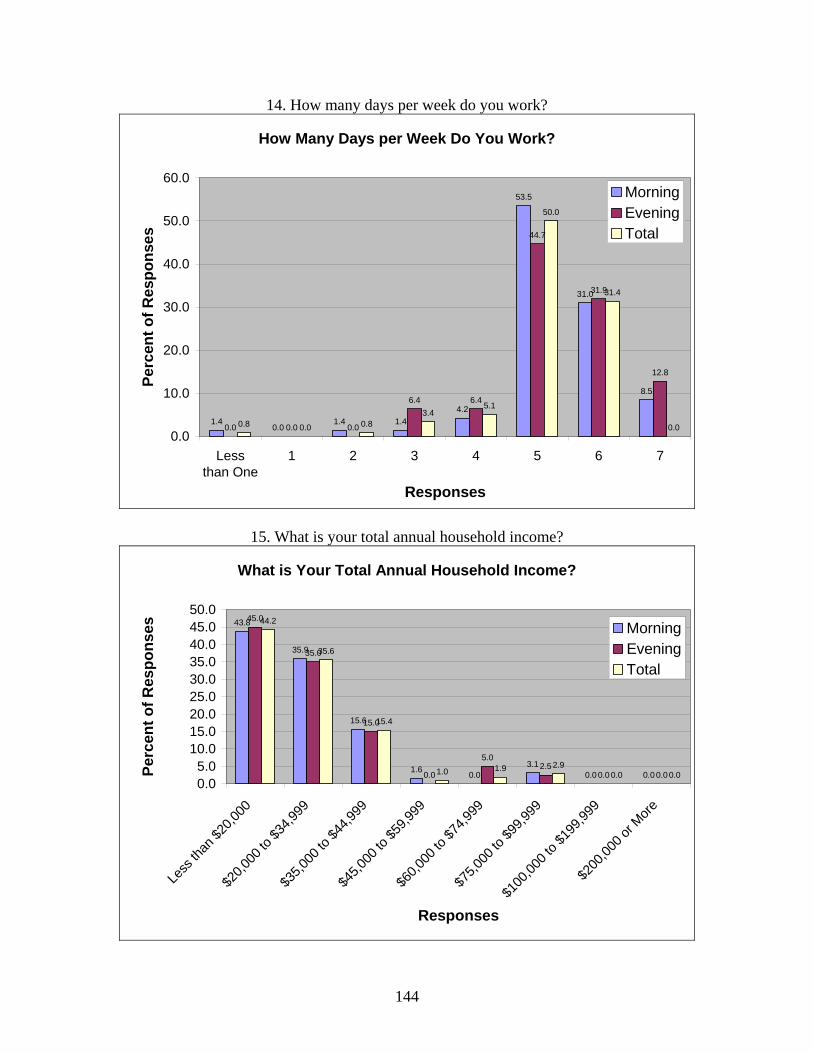
14. How many days per week do you work?
How Many Days per Week Do You Work?
1.40.0
1.4 1.44.2
53.5
31.0
8.5
0.0 0.0 0.0
6.4 6.4
44.7
31.9
12.8
0.8 0.0 0.83.4
5.1
50.0
31.4
0.00.0
10.0
20.0
30.0
40.0
50.0
60.0
Lessthan One
1 2 3 4 5 6 7
Responses
Perc
ent o
f Res
pons
es
MorningEveningTotal
15. What is your total annual household income?
What is Your Total Annual Household Income?
43.8
35.9
15.6
1.6 0.03.1
0.0 0.0
45.0
35.0
15.0
0.0
5.02.5
0.0 0.0
44.2
35.6
15.4
1.0 1.9 2.90.0 0.0
0.05.0
10.015.020.025.030.035.040.045.050.0
Less
than
$20,0
00
$20,0
00 to
$34,9
99
$35,0
00 to
$44,9
99
$45,0
00 to
$59,9
99
$60,0
00 to
$74,9
99
$75,0
00 to
$99,9
99
$100
,000 t
o $19
9,999
$200
,000 o
r More
Responses
Perc
ent o
f Res
pons
es MorningEveningTotal
144

Omitted Responses by Question
7.1
13.1
4.8
15.5
19.0
14.3
6.0 6.07.1
19.0
8.37.1
15.5 15.5
23.8
0.0
9.6
5.8
9.6
19.2
13.5
11.5
17.3
7.7
17.3
9.6
13.5
9.6 9.6
23.1
4.4
11.8
5.1
13.2
19.1
14.0
8.1
10.3
7.4
18.4
8.89.6
13.2 13.2
23.5
0.0
5.0
10.0
15.0
20.0
25.0
1 2 3 4 5 6 7 8 9 10 11 12 13 14 15
Question Number
Perc
ent o
f Res
pons
es
145
MorningEveningTotal
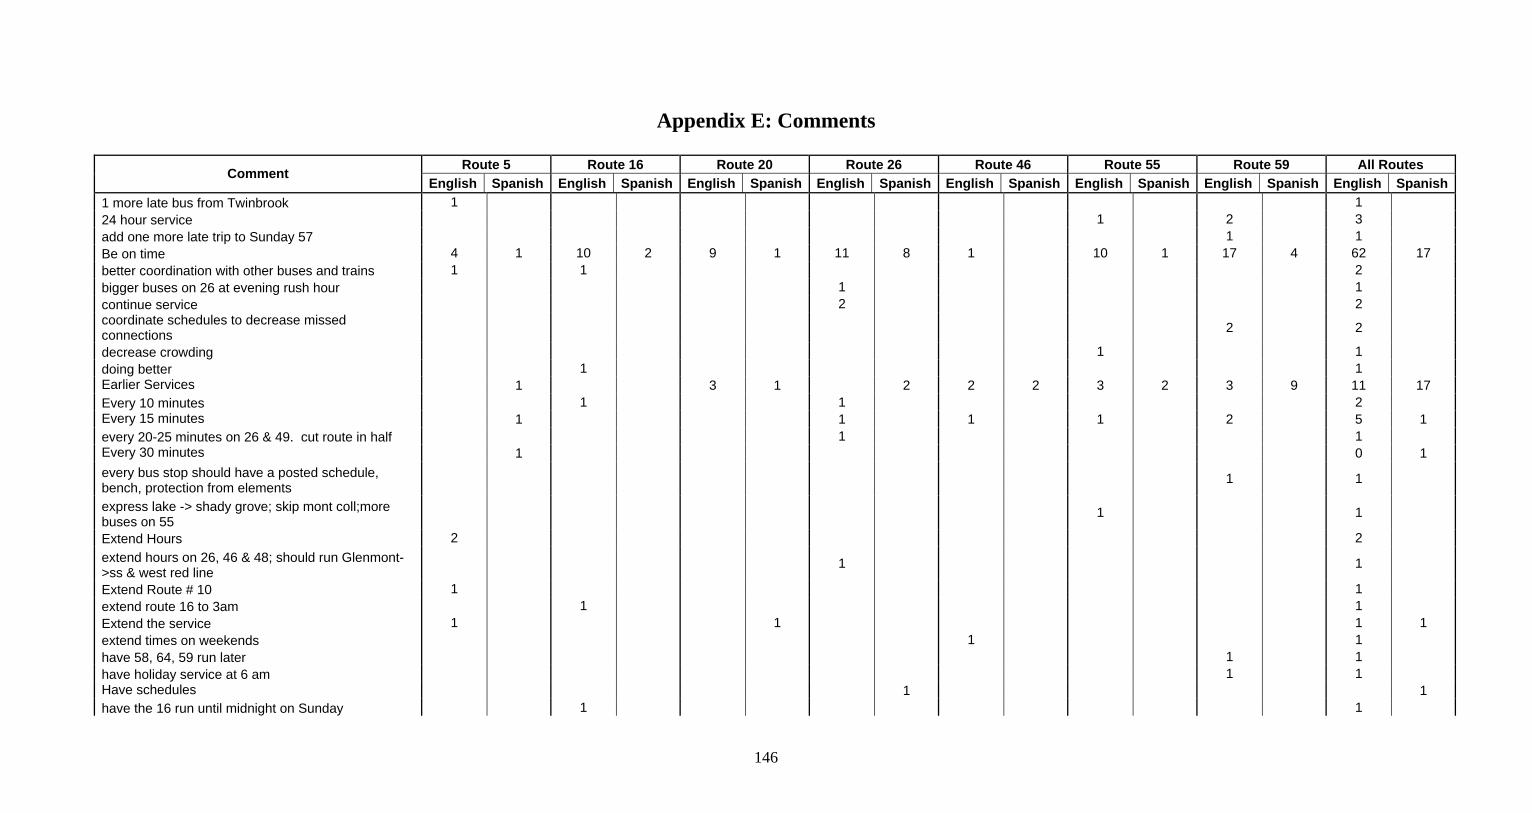
Appendix E: Comments
Route 5 Route 16 Route 20 Route 26 Route 46 Route 55 Route 59 All Routes Comment English Spanish English Spanish English Spanish English Spanish English Spanish English Spanish English Spanish English Spanish
1 more late bus from Twinbrook 1 1 24 hour service 1 2 3 add one more late trip to Sunday 57 1 1 Be on time 4 1 10 2 9 1 11 8 1 10 1 17 4 62 17 better coordination with other buses and trains 1 1 2 bigger buses on 26 at evening rush hour 1 1 continue service 2 2 coordinate schedules to decrease missed connections 2 2
decrease crowding 1 1 doing better 1 1 Earlier Services 1 3 1 2 2 2 3 2 3 9 11 17 Every 10 minutes 1 1 2 Every 15 minutes 1 1 1 1 2 5 1 every 20-25 minutes on 26 & 49. cut route in half 1 1 Every 30 minutes 1 0 1 every bus stop should have a posted schedule, bench, protection from elements
1 1
express lake -> shady grove; skip mont coll;more buses on 55
1 1
Extend Hours 2 2 extend hours on 26, 46 & 48; should run Glenmont->ss & west red line
1 1
Extend Route # 10 1 1 extend route 16 to 3am 1 1 Extend the service 1 1 1 1 extend times on weekends 1 1 have 58, 64, 59 run later 1 1 have holiday service at 6 am 1 1 Have schedules 1 1 have the 16 run until midnight on Sunday 1 1
146
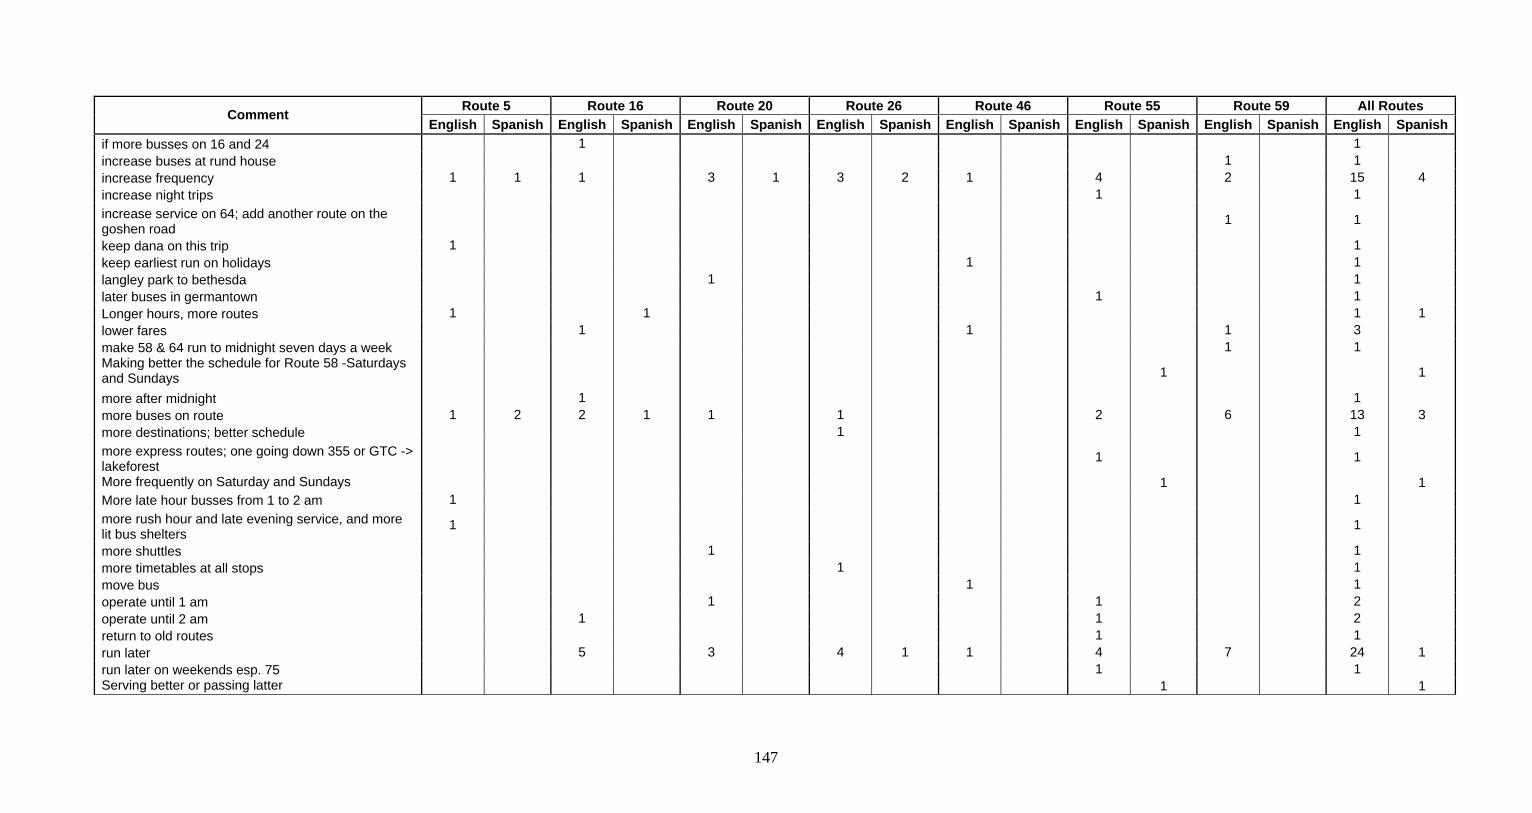
Route 5 Route 16 Route 20 Route 26 Route 46 Route 55 Route 59 All Routes Comment English Spanish English Spanish English Spanish English Spanish English Spanish English Spanish English Spanish English Spanish
if more busses on 16 and 24 1 1 increase buses at rund house 1 1 increase frequency 1 1 1 3 1 3 2 1 4 2 15 4 increase night trips 1 1 increase service on 64; add another route on the goshen road
1 1
keep dana on this trip 1 1 keep earliest run on holidays 1 1 langley park to bethesda 1 1 later buses in germantown 1 1 Longer hours, more routes 1 1 1 1 lower fares 1 1 1 3 make 58 & 64 run to midnight seven days a week 1 1 Making better the schedule for Route 58 -Saturdays and Sundays 1 1
more after midnight 1 1 more buses on route 1 2 2 1 1 1 2 6 13 3 more destinations; better schedule 1 1 more express routes; one going down 355 or GTC -> lakeforest
1 1
More frequently on Saturday and Sundays 1 1 More late hour busses from 1 to 2 am 1 1 more rush hour and late evening service, and more lit bus shelters
1 1
more shuttles 1 1 more timetables at all stops 1 1 move bus 1 1 operate until 1 am 1 1 2 operate until 2 am 1 1 2 return to old routes 1 1 run later 5 3 4 1 1 4 7 24 1 run later on weekends esp. 75 1 1 Serving better or passing latter 1 1
147
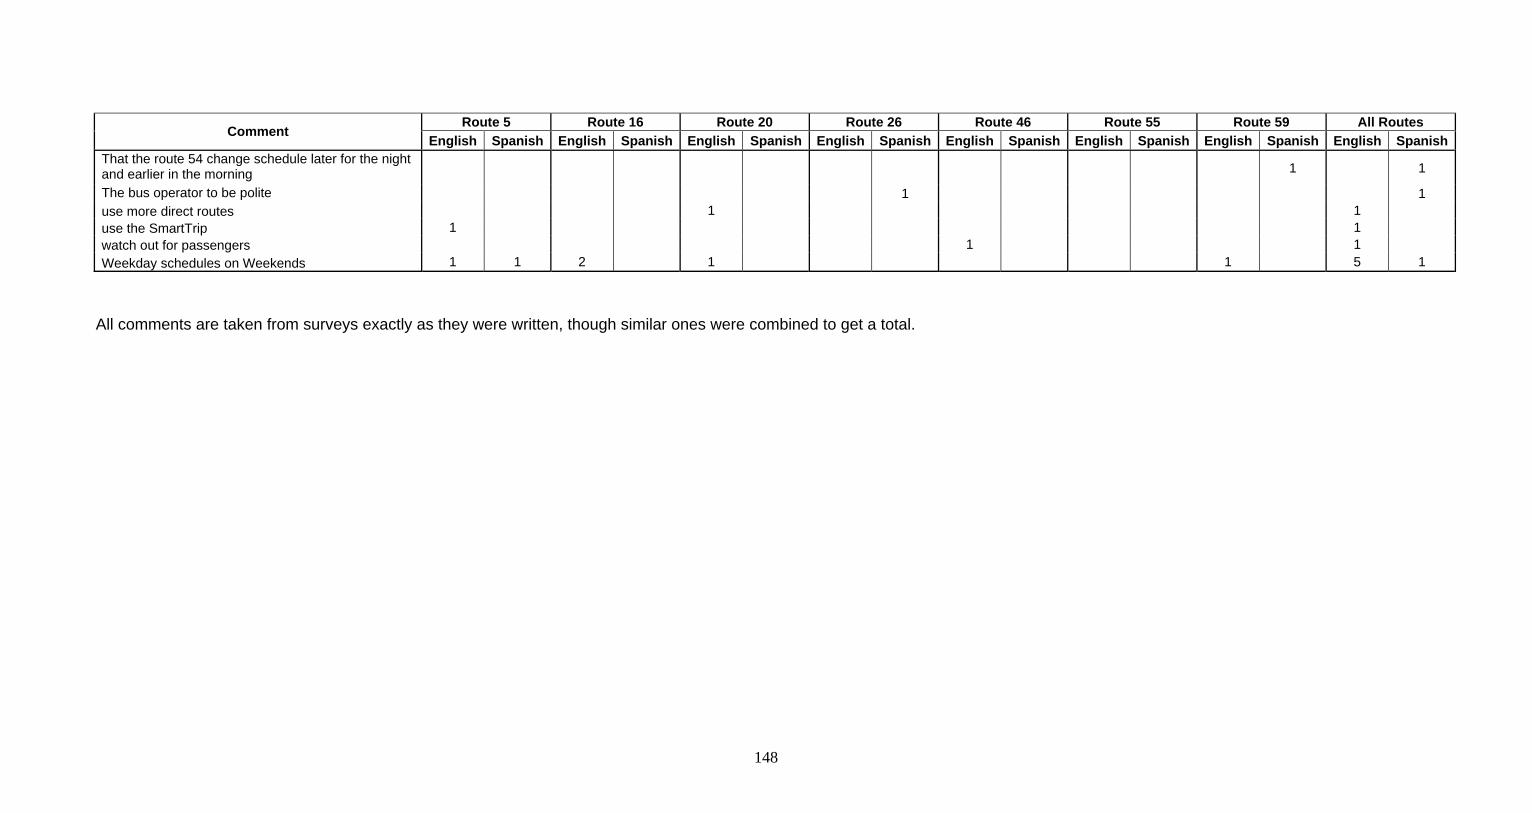
Route 5 Route 16 Route 20 Route 26 Route 46 Route 55 Route 59 All Routes
Comment English Spanish English Spanish English Spanish English Spanish English Spanish English Spanish English Spanish English Spanish
That the route 54 change schedule later for the night and earlier in the morning 1 1
The bus operator to be polite 1 1 use more direct routes 1 1 use the SmartTrip 1 1 watch out for passengers 1 1 Weekday schedules on Weekends 1 1 2 1 1 5 1
148
All comments are taken from surveys exactly as they were written, though similar ones were combined to get a total.
Bibliography
City of Los Angeles. (2005, August). Economic and Demographic Information. Retrieved September 25, 2005 from http://www.lacity.org/cao/econdemo.htm
Coven, Martha. (2003, October). An Introduction To TANF. Retrieved September 20, 2005 from
http://www.cbpp.org/1-22-02tanf2.htm CT NJ NY Regional Plan Association. (n.d.). CT NJ NY Regional Plan Association Homepage.
Retrieved on September 29, 2005 from http://www.rpa.org Department of Health and Human Services. (2005, August). Office of Family Assistance
Homepage. Retrieved September 24, 2005 from http://www.acf.hhs.gov/opa/fact_sheets/tanf_factsheet.html
Department of Health and Human Services, Office of Family Assistance. (1998, May).
Temporary Assistance for Needy Families Program: Policy Announcement. Retrieved September 24, 2005 from http://www.acf.hhs.gov/programs/ofa/testmny.htm
Department of Health and Human Services. (2005, October). Office of Family Assistance: TANF Federal Five-Year Time Limit; Fiscal Year 2003. [Electronic Version] Department of Health and Human Services. (2005). Office of Family Assistance: Temporary
Assistance to Needy Families; Separate State Program- Maintenance of Effort; Aid to Families with Dependant Children. Caseload Data. [Electronic Version]
Department of Public Works, Division of Transit Services (September 4,2005). Ride On System
Headways Dickey, John W. Metropolitan Transportation Planning (2nd ed). New York: Hemisphere, 1983. Federal Transit Administration. (n.d.). Welfare-To-Work/JARC Section. Retrieved October 10,
2005 from http://www.fta.dot.gov/9393_ENG_HTML.htm Grava, Sigurd. Urban Transportation Systems: Choices for Communities. New York: McGraw-Hill, 2003. Health and Human Services. (2005). The 2005 HHS Poverty Guidelines. Retrieved November
29, 2005 from http://aspe.hhs.gov/poverty/05poverty.shtml House Ways and Means. (2000). Green Book: Social Services Block Grant. Retrieved October
10, 2005 from http://www.policyalmanac.org/social_welfare/archive/ssbg.shtml
149

Los Angeles County Metropolitan Transportation Authority. (2005). Transit Services and Information for Los Angeles County. Retrieved September 25, 2005 from http://www.mta.net/default.asp
Maryland Department of Transportation. (2005, October). Maryland Department of
Transportation. Retrieved September 12, 2005 from http://www.mdot.state.md.us The Maryland-National Capital Park & Planning Comission. (n.d.). Means of Transportation to
Work, Montgomery County, 2000. Retrieved September 11, 2005 from http://www.mc-mncppc.org/research/data_library/transportation/t03.shtm
The Maryland-National Capital Park & Planning Comission. (n.d.). Montgomery County Park &
Planning. Retrieved September 11, 2005 from http://www.mc-mncppc.org The Maryland-National Capital Park & Planning Comission. (n.d.). Ranking of Metropolitan
Areas by Congestion. Retrieved September 11, 2005 from http://www.mc-mncppc.org/research/data_library/transportation/t03.shtm
Maryland Transit Administration. (n.d.). Maryland Department of Transportation: Maryland
Transit Administration. Retrieved September 14, 2005 from http://www.mtamaryland.com/index.cfm
Montgomery County Department of Park & Planning Research and Technology Center. (2005,
February). Montgomery County at a Glance: Current Estimates Population Housing Employment. Retrieved September 20, 2005 from http://www.mc-mncppc.org/research/data_library/montgomery_county_glance/ataglance.pdf
Montgomery County Government. (2005, October), Montgomery County, Maryland
Government Homepage. Retrieved September 11, 2005 from http://montgomerycountymd.gov
Montgomery County Government. (2005, August), Ride On Homepage. Retrieved September
11, 2005 from http://www.montgomerycountymd.gov/tsvtmpl.asp?url=/content/dpwt/transit/index.asp
Montgomery County Government. (2005, January), Ride On Services. Retrieved October 10,
2005 from http://www.montgomerycountymd.gov/tsvtmpl.asp?url=/content/dpwt/transit/introduction.asp
National Association of Counties. (2005). Average Number of Households and Household
Incomes. Retrieved September 18, 2005, from http://www.naco.org/Template.cfm?Section=Data_and_Demographics&Template=/cffiles/counties/income_res.cfm
150
Newman, Peter & Jeffrey Kenworthy. Sustainability and Cities: Overcoming Automobile Dependence. Washington D.C.: Island Press, 1999. New Jersey Department of Human Services (n.d.). Work First New Jersey (WFNJ). Retrieved
September 29, 2005, from http://www.state.nj.us/humanservices/dfd/wfnjws.html New Jersey Department of Transportation (2005, March). New Jersey Long Range
Transportation Plan. Retrieved September 29, 2005, from http://www.state.nj.us/transportation/works/njchoices
Pearce, Diana. The Self-Sufficiency Standard for the Washington, D.C. Metropolitan Area.
Center for Women’s Welfare at the University of Washington Surface Transportation Policy Project. (n.d.). Transportation and Jobs. Retrieved September 29,
2005 from http://www.transact.org/library/factsheets/jobs.asp United States Department of Transportation. National Transportation Statistics. 1996. U.S. Census Bureau. (2002). Average Travel Time to Work of Workers 16 Years and Over Who
Did Not Work at Home. [electronic version] U.S. Government. (n.d.). Benefits Report. Retrieved October 6, 2005 from
http://govebenefits.gov/govbenefits/benefits/report.jhtml?dispatch=federal&bid=613&oid=6
Urbitran. (2003). Urbitran Homepage. Retrieved September 13, 2005 from
http://63.240.68.126/~urbitran.com/index.cfm Washington Metropolitan Area Transit Authority. (2004). Washington Metropolitan Area Transit
Authority Homepage. Retrieved September 12, 2005 from http://www.wmata.com/ Weiner, Edward. Urban Transportation: Planning in the United States, An Historical Overview (revised and expanded ed). Westport, CT: Praeger, 1999. Worcester Regional Transit Authority. (2005, March). Worcester Regional Transit Authority. Retrieved September 13, 2005 from http://therta.com
151