assessing pm 2.5 background levels and local add-on prepared by bryan lambeth, pe field operations...
TRANSCRIPT
Assessing PM2.5
Background Levelsand Local Add-On
Prepared by Bryan Lambeth, PEField Operations Support Division
Texas Commission on Environmental Quality
For presentation at the
National Air Quality Conference 2010
Houston Clear Houston Hazy
Causes of High PM2.5
• Regional and long-range transport– Haze, smoke, and/or dust already in the air coming
into an area from distant sources– Cannot be controlled by local mitigation measures
• Local primary and secondary sources– Local add-on of PM2.5 is increased by local air
stagnation, limited vertical mixing of the air, and high relative humidity
– Urban worst case is usually night-time winter stagnation with clear skies
Estimating Transport Contribution
• Upwind monitors and monitors that are not downwind of significant local sources provide the best estimate of incoming background levels from transport
• These monitors will usually have the lowest concentrations in the area
• Thus for areas with adequate peripheral monitoring coverage, the area lowest or second lowest concentration can serve to estimate the contribution from transport on most days
• The variation between the lowest and second lowest measurements may often indicate variability in the incoming background levels across an area with adequate monitoring coverage
Estimating Local Add-On
• Once the incoming background level has been estimated, concentrations higher than this background can indicate either variability in the background levels and/or add-on from local sources
• Subtracting the estimated background from a given measurement provides an estimate of impacts directly from local sources, but this estimate can be biased high when there is large spatial variability in the incoming background level
• Where speciation data are available for both background and add-on locations, the speciated components of local source impacts can also be evaluated by this method
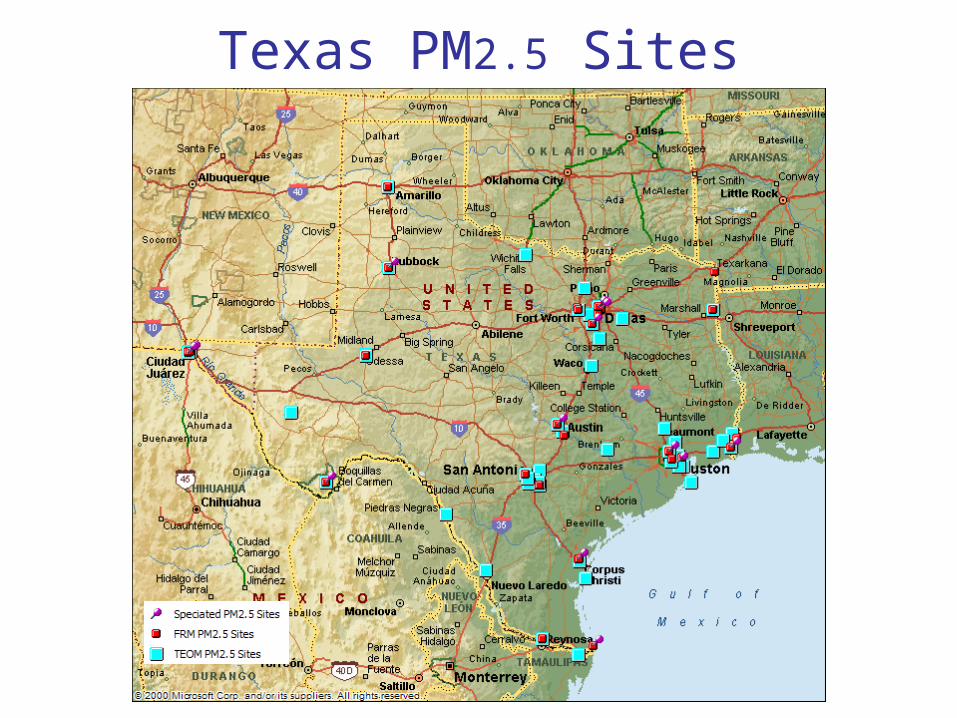
Texas PM2.5 Sites
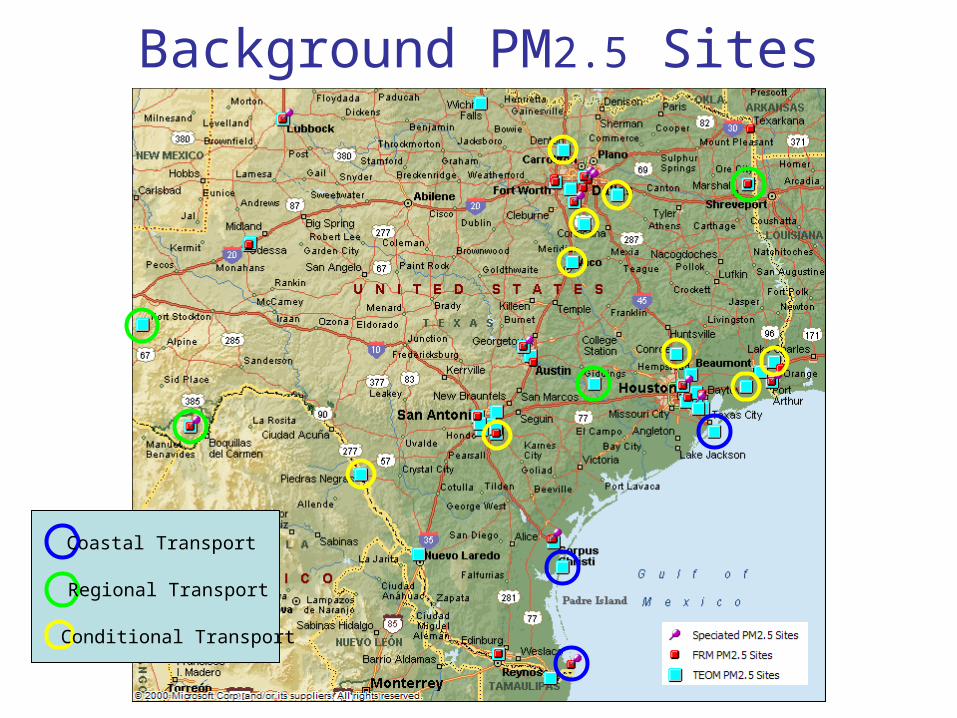
Background PM2.5 Sites
Coastal Transport
Regional Transport
Conditional Transport
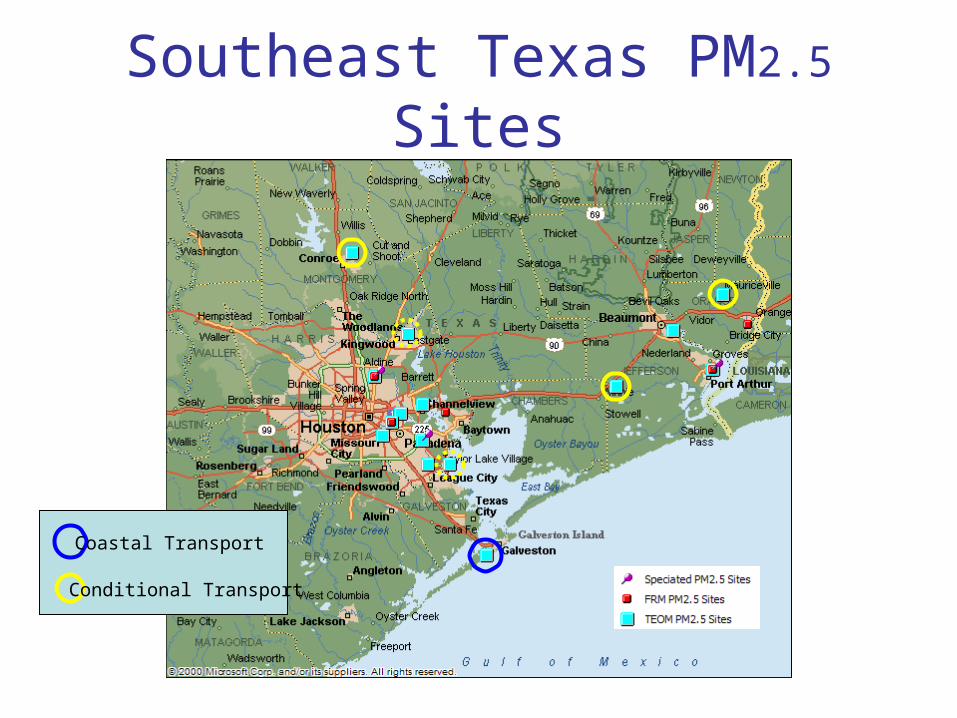
Southeast Texas PM2.5 Sites
Coastal Transport
Conditional Transport
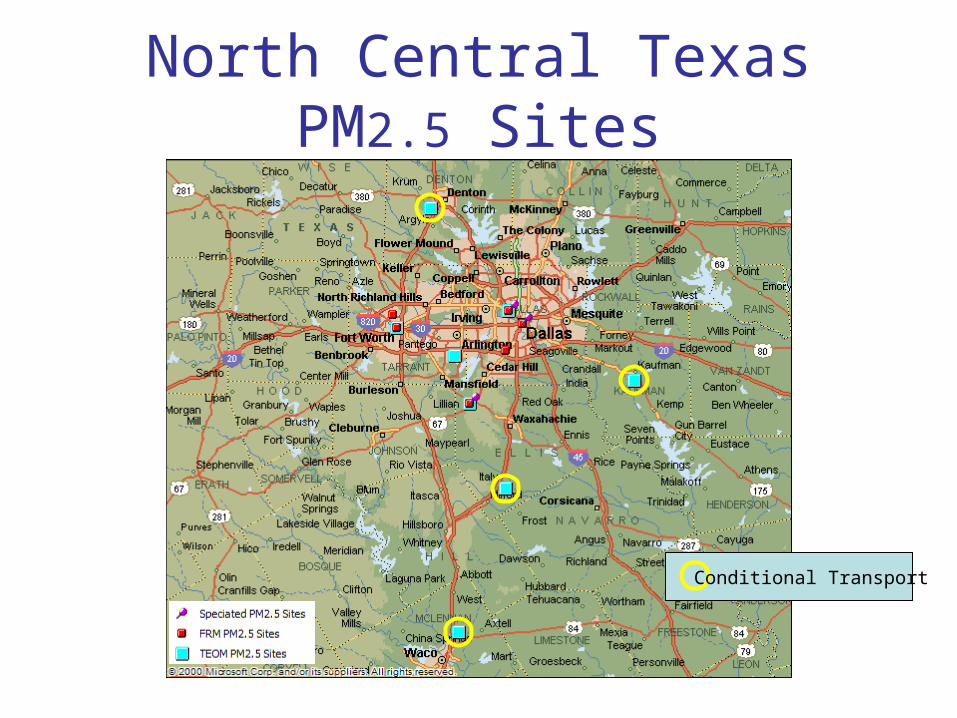
North Central Texas PM2.5 Sites
Conditional Transport

Central Texas PM2.5 Sites
Regional Transport
Conditional Transport
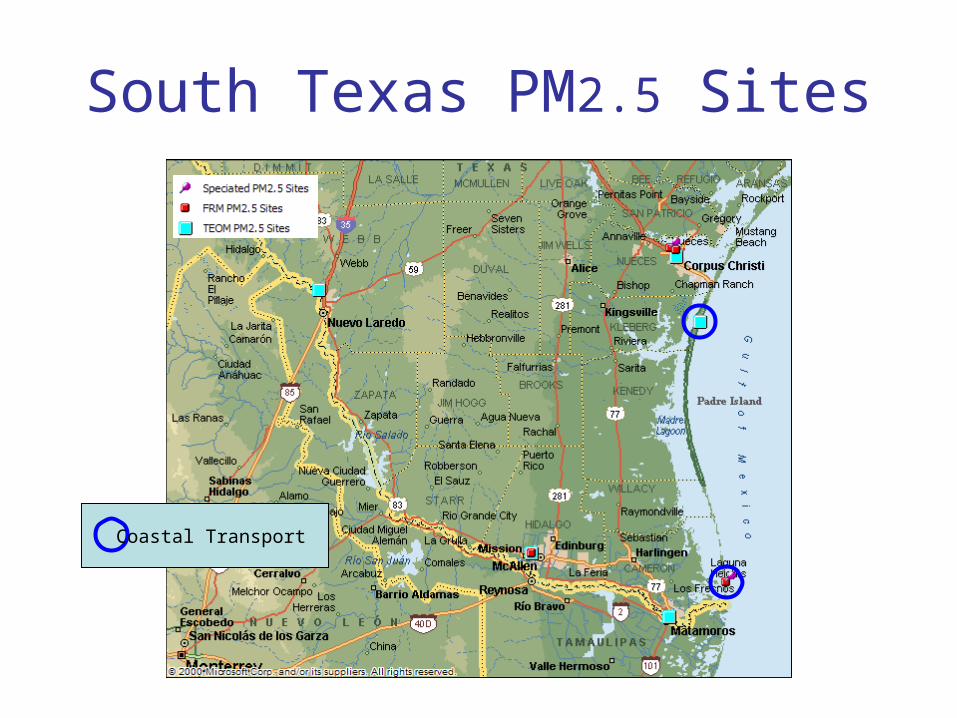
South Texas PM2.5 Sites
Coastal Transport

Figure 1. Texas Coastal PM2.5 April-May 2008
0
5
10
15
20
25
30
35
40
04/0
1/08
04/0
3/08
04/0
5/08
04/0
7/08
04/0
9/08
04/1
1/0
8
04/1
3/08
04/1
5/08
04/1
7/08
04/1
9/08
04/2
1/08
04/2
3/08
04/2
5/08
04/2
7/08
04/2
9/08
05/0
1/08
05/0
3/08
05/0
5/08
05/0
7/08
05/0
9/08
05/1
1/0
8
05/1
3/08
05/1
5/08
05/1
7/08
05/1
9/08
05/2
1/08
05/2
3/08
05/2
5/08
05/2
7/08
05/2
9/08
05/3
1/08
Dai
ly A
vera
ge P
M2.
5 (u
g/m
3 lo
cal)
.
Galveston C34 TEOM National Seashore C314 TEOM Isla Blanca Park C323 FRMS
S
S
S SS
S - SmokeH - Continental haze
S
S
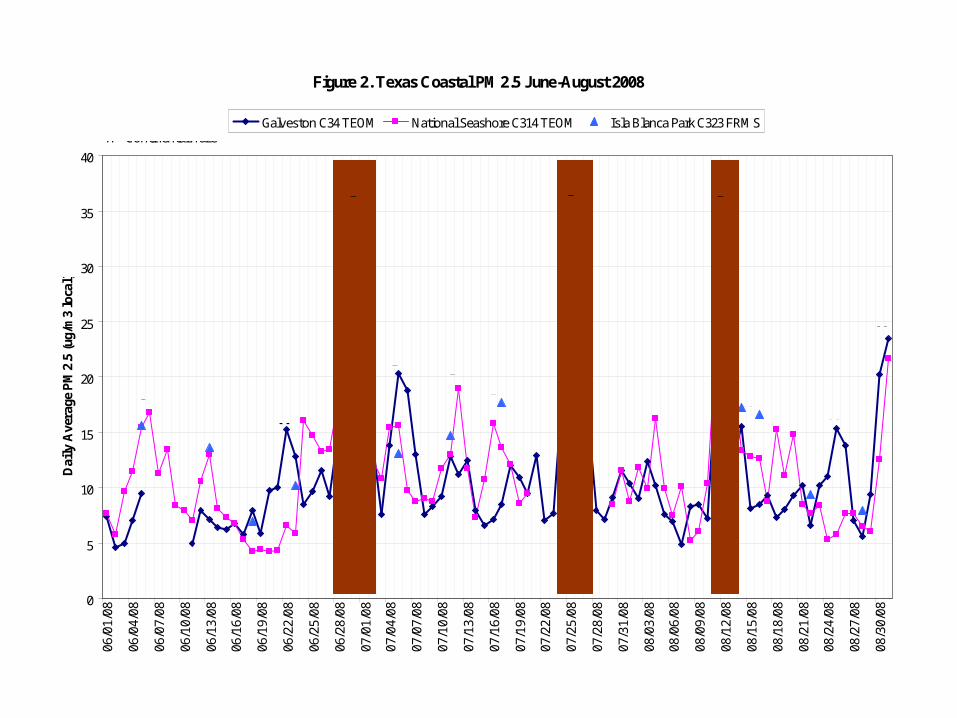
Figure 2. Texas Coastal PM2.5 June-August 2008
0
5
10
15
20
25
30
35
40
06/0
1/08
06/0
4/08
06/0
7/08
06/1
0/08
06/1
3/08
06/1
6/08
06/1
9/08
06/2
2/08
06/2
5/08
06/2
8/08
07/0
1/08
07/0
4/08
07/0
7/08
07/1
0/08
07/1
3/08
07/1
6/08
07/1
9/08
07/2
2/08
07/2
5/08
07/2
8/08
07/3
1/08
08/0
3/08
08/0
6/08
08/0
9/08
08/1
2/08
08/1
5/08
08/1
8/08
08/2
1/08
08/2
4/08
08/2
7/08
08/3
0/08
Dai
ly A
vera
ge P
M2.
5 (u
g/m
3 lo
cal)
.
Galveston C34 TEOM National Seashore C314 TEOM Isla Blanca Park C323 FRMS
D D
S - Mexican SmokeD - African DustH - Continental Haze
D
HS
H
H
DD
H
D
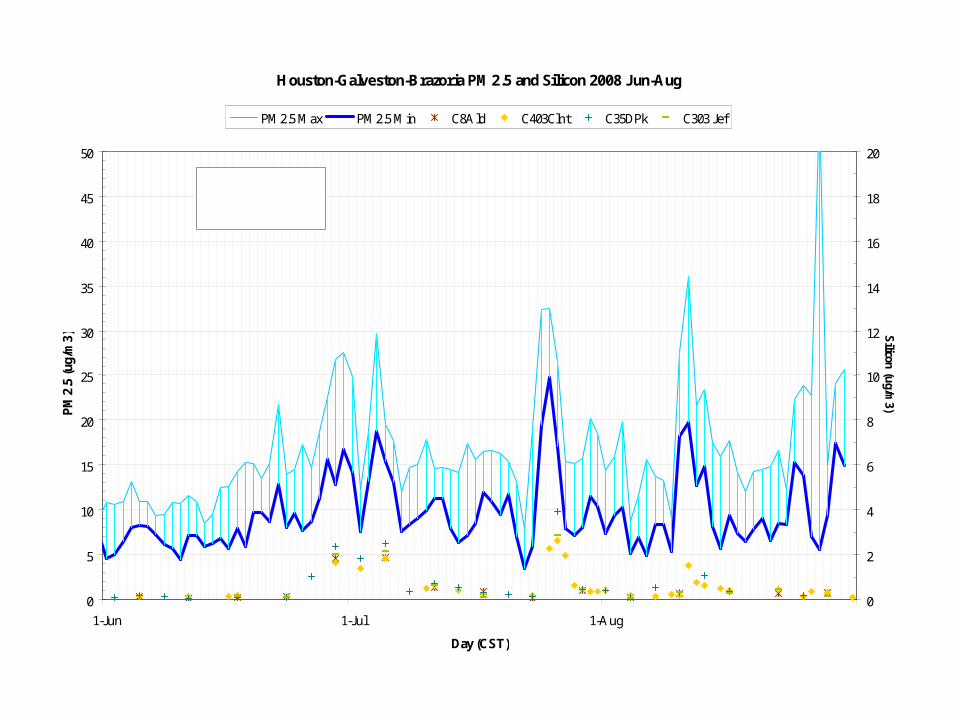
Houston-Galveston-Brazoria PM2.5 and Silicon 2008 Jun-Aug
0
5
10
15
20
25
30
35
40
45
50
1-Jun 1-Jul 1-Aug
Day (CST)
PM
2.5
(ug/
m3)
0
2
4
6
8
10
12
14
16
18
20
Silicon
(ug/m
3)
PM2.5 Max PM2.5 Min C8Ald C403Clnt C35DPk C303 Jef
S - Mexican Smoke D - African Dust H - Continental Haze
D
H
H
D
D
D
H
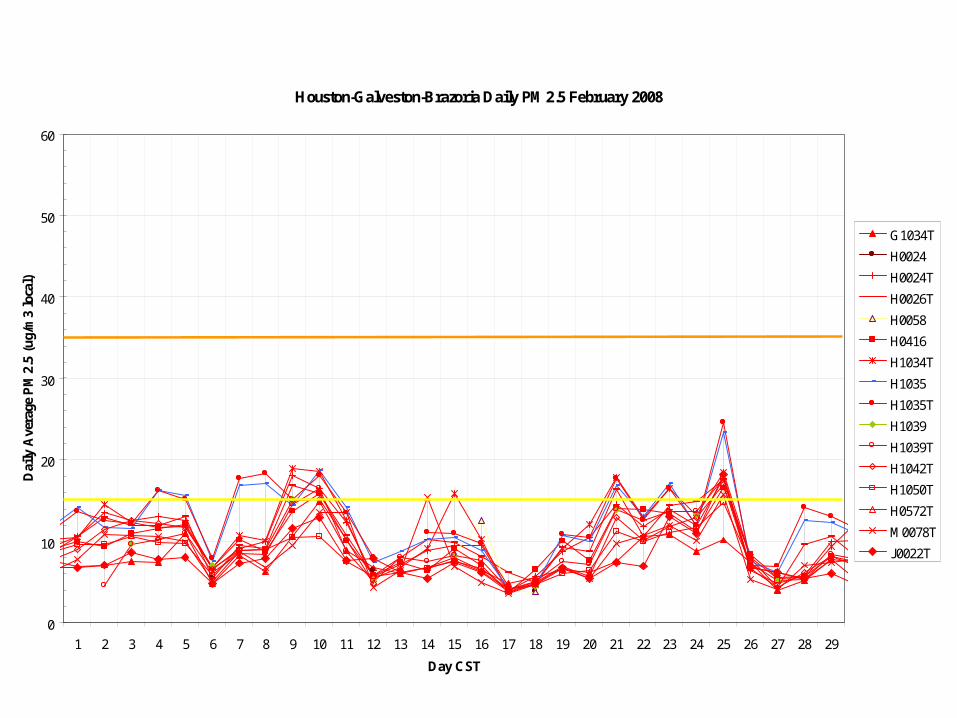
Houston-Galveston-Brazoria Daily PM2.5 February 2008
0
10
20
30
40
50
60
1 2 3 4 5 6 7 8 9 10 11 12 13 14 15 16 17 18 19 20 21 22 23 24 25 26 27 28 29
Day CST
Dai
ly A
vera
ge P
M2.
5 (u
g/m
3 lo
cal)
G1034T
H0024
H0024T
H0026T
H0058
H0416
H1034T
H1035
H1035T
H1039
H1039T
H1042T
H1050T
H0572T
M0078T
J0022T
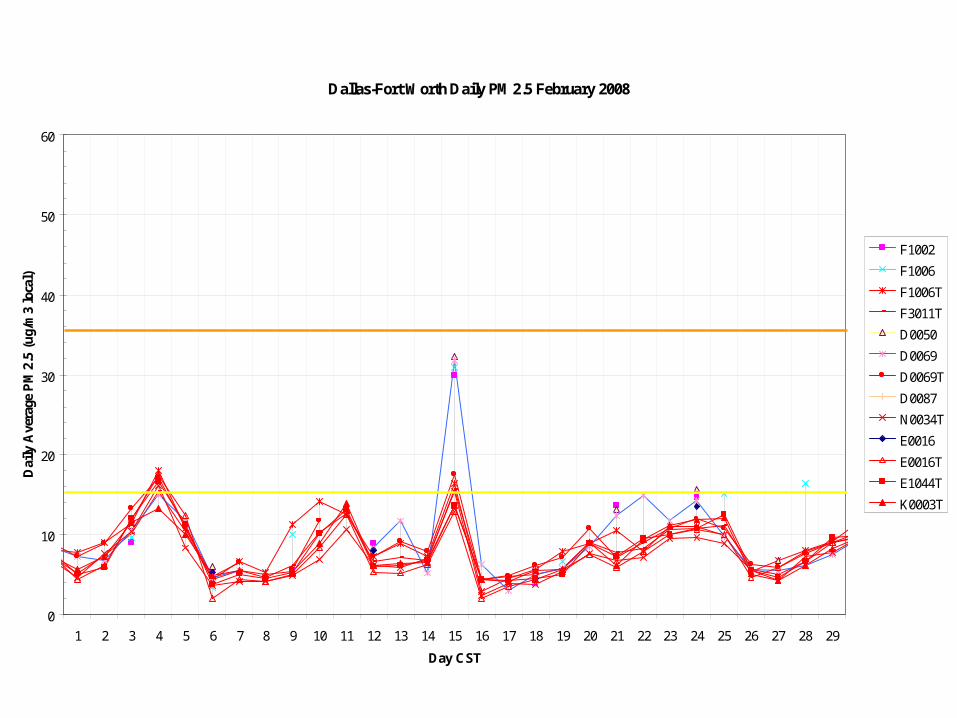
Dallas-Fort Worth Daily PM2.5 February 2008
0
10
20
30
40
50
60
1 2 3 4 5 6 7 8 9 10 11 12 13 14 15 16 17 18 19 20 21 22 23 24 25 26 27 28 29
Day CST
Dai
ly A
vera
ge P
M2.
5 (u
g/m
3 lo
cal)
F1002
F1006
F1006T
F3011T
D0050
D0069
D0069T
D0087
N0034T
E0016
E0016T
E1044T
K0003T
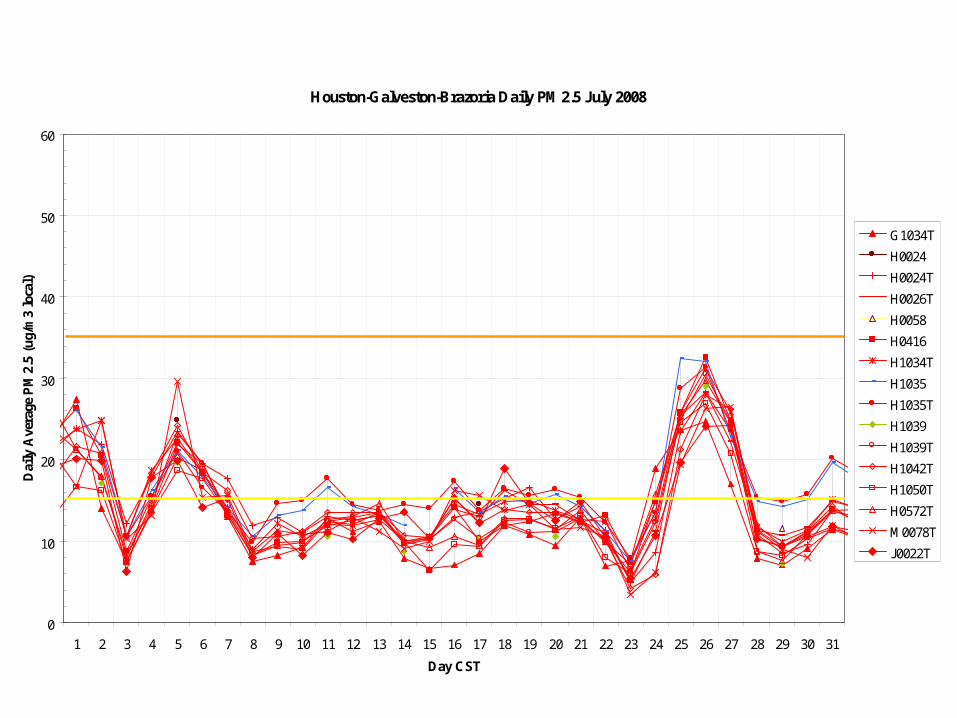
Houston-Galveston-Brazoria Daily PM2.5 July 2008
0
10
20
30
40
50
60
1 2 3 4 5 6 7 8 9 10 11 12 13 14 15 16 17 18 19 20 21 22 23 24 25 26 27 28 29 30 31
Day CST
Dai
ly A
vera
ge P
M2.
5 (u
g/m
3 lo
cal)
G1034T
H0024
H0024T
H0026T
H0058
H0416
H1034T
H1035
H1035T
H1039
H1039T
H1042T
H1050T
H0572T
M0078T
J0022T
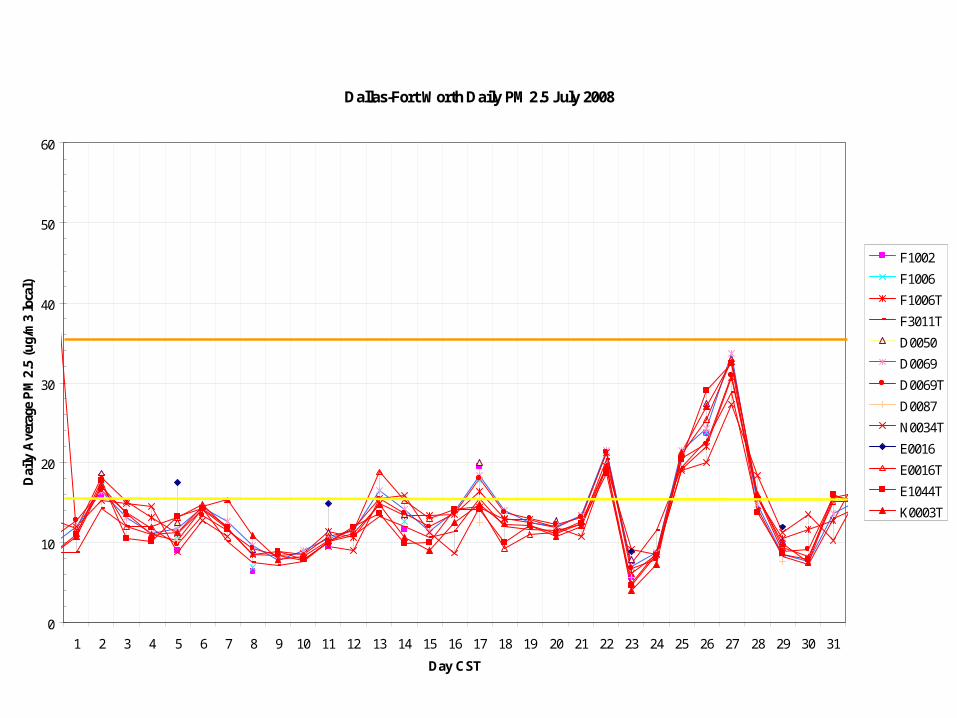
Dallas-Fort Worth Daily PM2.5 July 2008
0
10
20
30
40
50
60
1 2 3 4 5 6 7 8 9 10 11 12 13 14 15 16 17 18 19 20 21 22 23 24 25 26 27 28 29 30 31
Day CST
Dai
ly A
vera
ge P
M2.
5 (u
g/m
3 lo
cal)
F1002
F1006
F1006T
F3011T
D0050
D0069
D0069T
D0087
N0034T
E0016
E0016T
E1044T
K0003T
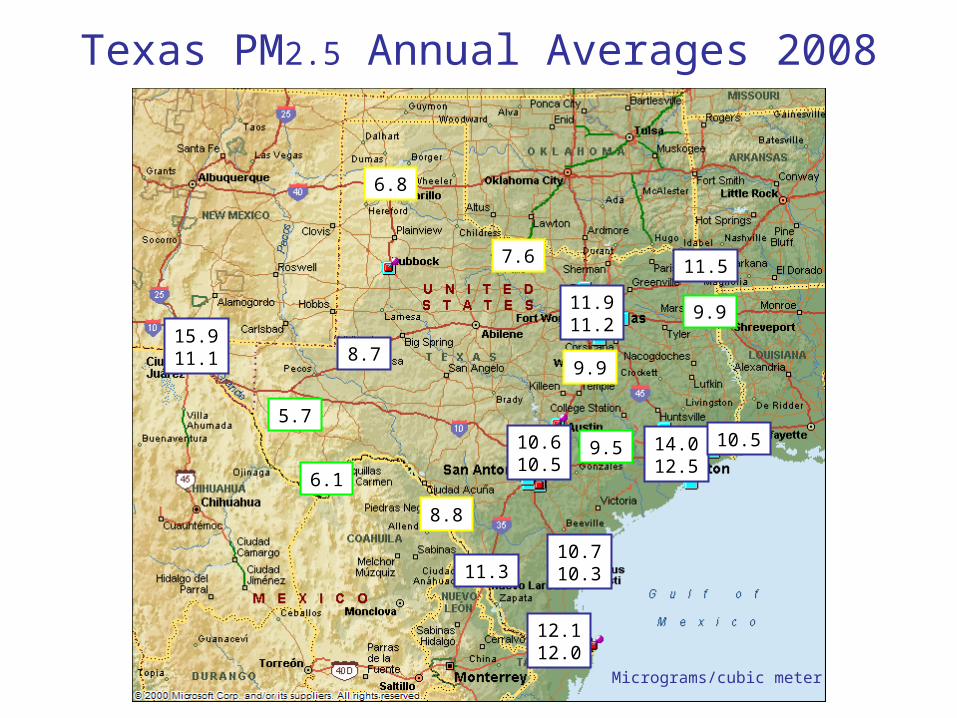
14.012.5
Texas PM2.5 Annual Averages 2008
11.911.2
10.610.5
10.5
9.9
9.5
6.1
5.7
7.6
6.8
10.710.3
Micrograms/cubic meter
11.5
9.98.7
8.8
15.911.1
12.112.0
11.3
9.68.7
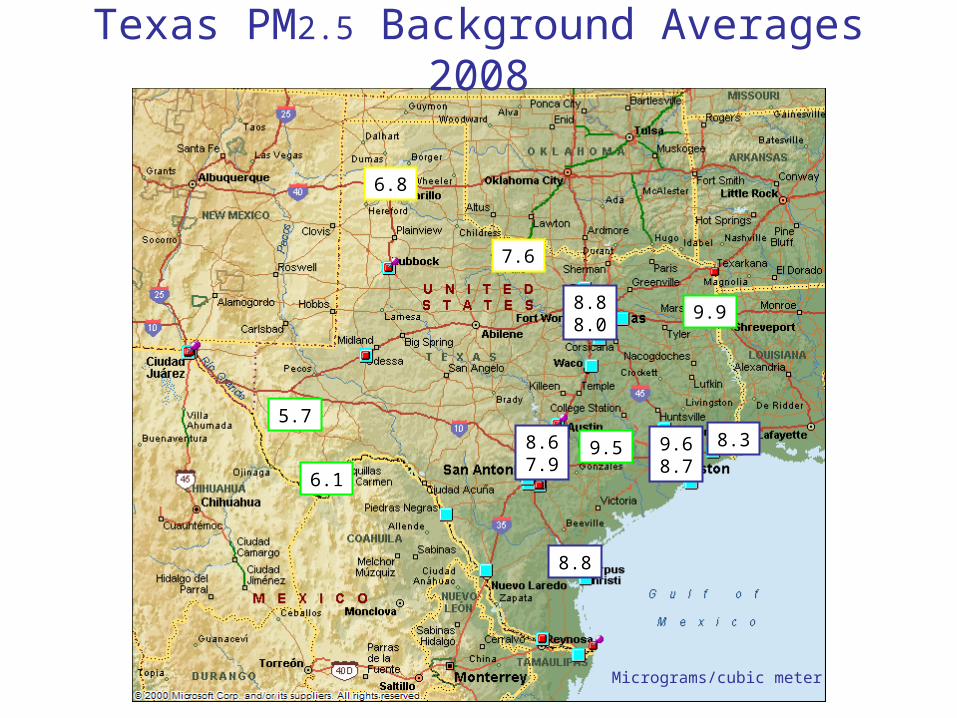
Texas PM2.5 Background Averages 2008
8.88.0
8.67.9
8.3
9.9
9.5
6.1
5.7
7.6
6.8
Micrograms/cubic meter
8.8
6.96.0
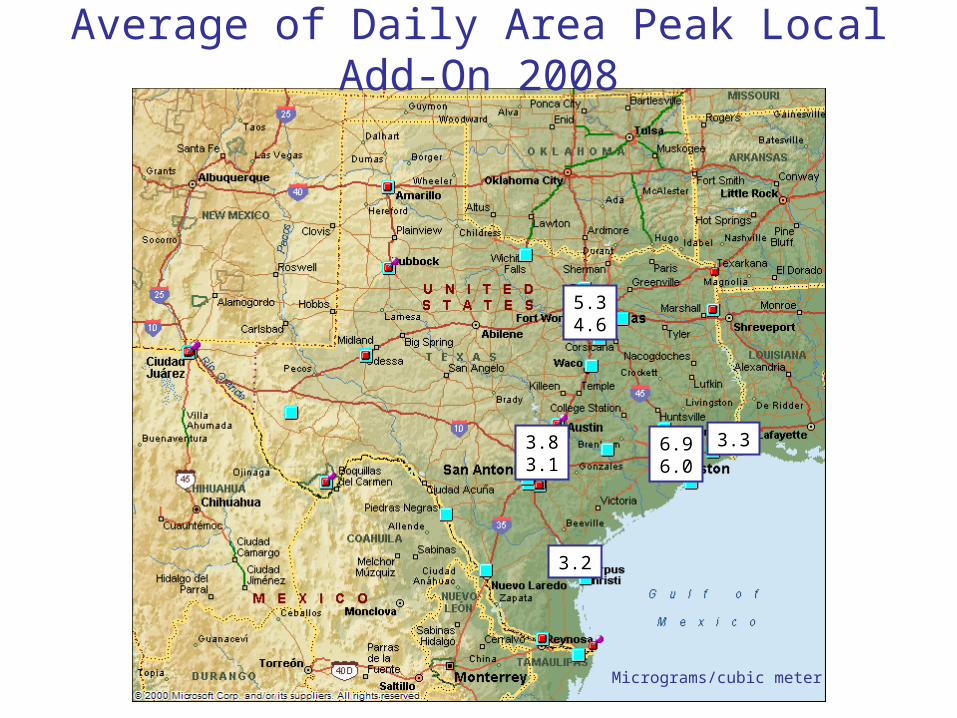
Average of Daily Area Peak Local Add-On 2008
5.34.6
3.83.1
3.3
Micrograms/cubic meter
3.2

5.34.4
Highest Annual Local Add-On 2008
3.93.1
2.72.0
2.2
Micrograms/cubic meter
2.0
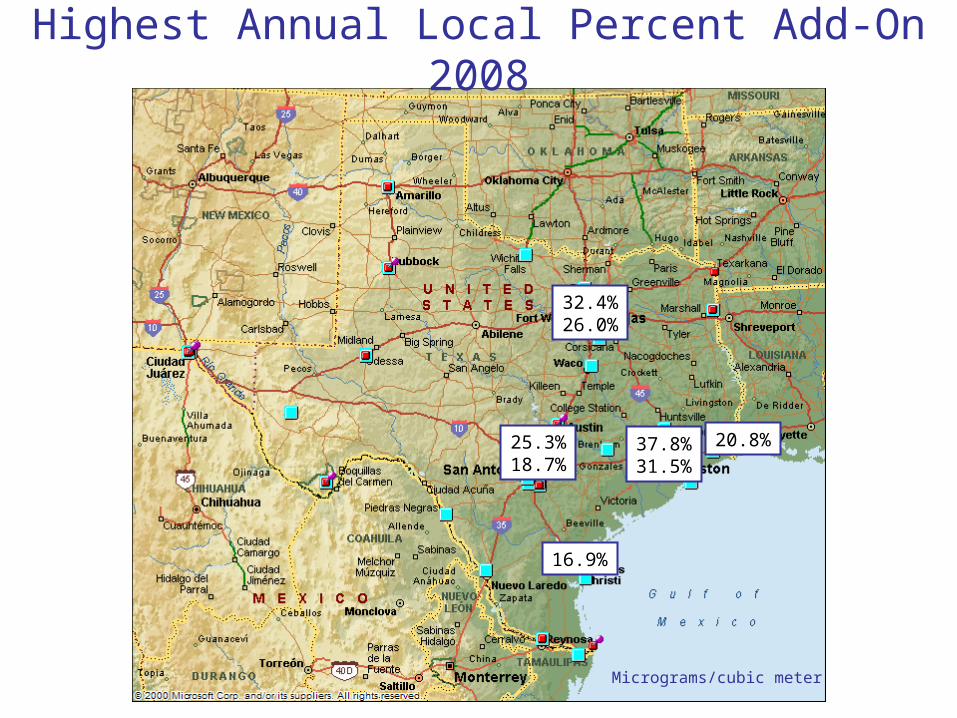
37.8%31.5%
Highest Annual Local Percent Add-On 2008
32.4%26.0%
25.3%18.7%
20.8%
Micrograms/cubic meter
16.9%
Conclusions
• For the areas analyzed, transport appears to account for at least about 70-80% of measured annual averages at sites with the greatest local source impacts
• At most about 20-30% of the annual average at analyzed sites with the worst local source impacts can be addressed by local control measures
Applications
• Analysis of “but for” considerations in determining exceptional event days– This approach could be used to estimate
whether a site would have exceeded the standard with a “normal” background level if the exceptional event had not occurred
• Estimating how much local add-on must be reduced to meet standards
• Model validation