aspects of structural biology studied by liquid … · e-mail: [email protected] ,...
TRANSCRIPT

1
University of Florence International Doctorate in Structural Biology
Cycle XX (01/2005-12/2007)
Magnetic Resonance Center (CERM)
ASPECTS OF STRUCTURAL BIOLOGY
STUDIED BY LIQUID AND SOLID-
STATE NMR
Ph.D. thesis
Submitted by
Anusarka Bhaumik
Tutor Coordinator
Prof. Ivano Bertini Prof. Claudio Luchinat

2
I hereby declare that this thesis is based on the information extracted from the cited
references and from the experimental work, which I have performed at Magnetic Resonance
Center (CERM)
December 31, 2007 ………………………
3
Dedicated to my parents and to my beloved wife…..
4
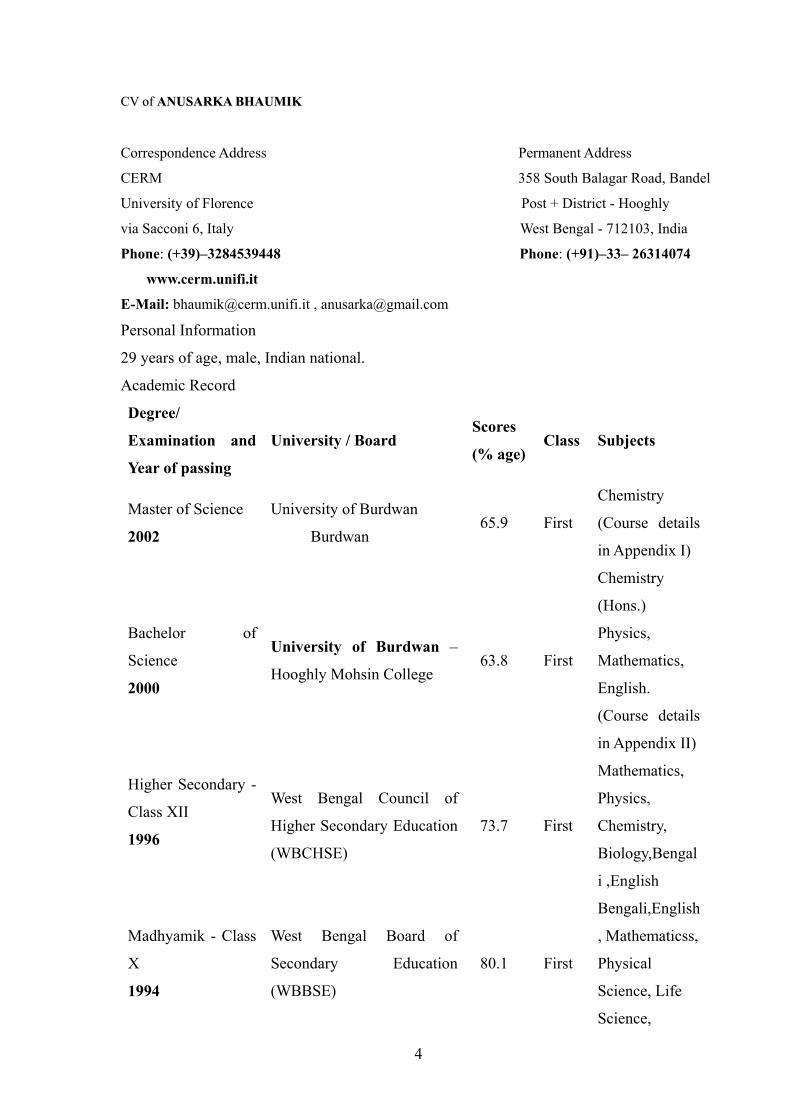
CCVV ooff AANNUUSSAARRKKAA BBHHAAUUMMIIKK
Correspondence Address Permanent Address
CERM 358 South Balagar Road, Bandel
University of Florence Post + District - Hooghly
via Sacconi 6, Italy West Bengal - 712103, India
Phone: (+39)–3284539448 Phone: (+91)–33– 26314074
www.cerm.unifi.it
E-Mail: [email protected] , [email protected]
Personal Information
29 years of age, male, Indian national.
Academic Record
Degree/
Examination and
Year of passing
University / Board Scores
(% age) Class Subjects
Master of Science
2002
University of Burdwan
Burdwan 65.9 First
Chemistry
(Course details
in Appendix I)
Bachelor of
Science
2000
University of Burdwan –
Hooghly Mohsin College 63.8 First
Chemistry
(Hons.)
Physics,
Mathematics,
English.
(Course details
in Appendix II)
Higher Secondary -
Class XII
1996
West Bengal Council of
Higher Secondary Education
(WBCHSE)
73.7 First
Mathematics,
Physics,
Chemistry,
Biology,Bengal
i ,English
Madhyamik - Class
X
1994
West Bengal Board of
Secondary Education
(WBBSE)
80.1 First
Bengali,English
, Mathematicss,
Physical
Science, Life
Science,

5
Geography,
History,
Biology
(additional)
Publications
• Formation of DNA layer on Langmuir-Blodgett films and its enzymatic
digestion. Anusarka Bhaumik, Madhugiri Ramakanth, Loveleen Kaur Brar, Arup
Kumar Raychoudhuri, Francis Rondelez and Dipankar Chatterji. Langmuir,2004,
20(14), 5891 – 5896.
• Transcription of T7 DNA immobilised on Latex beads and Langmuir-Blodgett
film. Debalina Ghosh, Madhugiri Ramakanth, Anusarka Bhaumik, Nicolas Faure,
Francis Rondelez and Dipankar Chatterji Journal of Biochemical and Biophysical
Methods,2005 Jan 31;62(1):51-62.
• Fragment docking to S100 proteins reveals a wide diversity of weak interaction
sites.
Arendt, Y., Bhaumik, A., Del Conte, R., Luchinat, C., Mori, M., and Porcu, M.,
ChemMedChem, 2007. (published online)
• Paramagnetic Shifts in Solid-State NMR of Proteins to Elicit Structural
Information Stéphane Balayssac, Ivano Bertini, Anusarka Bhaumik, Moreno Lelli,
and Claudio Luchinat.(under revision).
Scholarships / Awards / Merits
Recipient of "National Scholarship Scheme Merit Certificate" in recognition of the high
position secured in the list of meritorious candidates qualifying for awards from
WBBSE in 1994 (CLASS X).
Research Experience
October 2004-tiill Present (Doctorate Studies)
Thesis Title: Aspects of Structural Biology studied by Liquid and Solid-State NMR. Under
the guidance of Prof Ivano Bertini and Prof Claudio Luchinat (Center of Magnetic
Resonance, University of Florence, Italy)
January 2003 –August 2004 (Research Assistant)

6
Project Title: “Towards the Construction of DNA Brushes and Their Transcription Activity"
Project Title: “Towards the formation of DNA chip"
Both the abovementioned projects are being carried out under the guidance of Prof.
Dipankar Chatterji, Molecular Biophysics Unit, Indian Institute of Science.
Submitted as a student of Master of Science
Project Title:” Studies on Arsenic Content and Some other Chemical Parameters in
Drinking Water “
This work was done under the guidance of Dr. S. S. Bhattacharya, Department of
Chemistry, The University of Burdwan.
Presentations
Project Presentation entitled “Studies on Arsenic Content and Some other Chemical
Parameters in Drinking Water” as part of M.Sc course
Attended Conferences:
• Advances and Management of NMR in Life Sciences (January 18-20, 2007)Florence,
January 18-20, 2007.
• Perspectives of NMR in Drug Discovery (April 10-12, 2007) Florence, April 10-12,
2007/
• NMR Solid State Users'Meeting (April 19, 2007)Florence
• Poster Presentation at 11th Chianti Workshop on Magnetic Resonance. METHODS
FOR BIOMOLECULAR MAGNETIC RESONANCE Vallombrosa (Florence), Italy
June 3 - 8, 2007
Other Activities
Participated in Workshops on Environment Education, Nature exploration camp and high
altitude trekking expeditions.
Participated in athletics and oratory competitions at the school level.

7
Acknowledgements
First of all, I would like to express my deep and sincere gratitude to my supervisor,
Professor Ivano Bertini, Director, Professor of Chemistry Magnetic Resonance Center and
Department of Chemistry University of Florence, for giving me an opportunity to pursue my
Ph.D in this esteemed Institute. His ample knowledge and rational way of thinking have been
of great value for me. He has been instrumental in ensuring my academic, professional,
financial, and moral well being ever since. In every sense, this work would never have been
possible without him.
I am deeply grateful to my supervisor, Professor Claudio Luchinat, Department of
Agricultural Biotechnology and Agricultural Sciences University of Florence, for his
constructive suggestions, and for his important support and scrutiny throughout this work.
His scientific understanding, encouragement and constant personal guidance have provided
a good basis for the present thesis.
I wish to express my warm and sincere thanks to Dr. Marco Fragai for his constant
encouragement and supportive instructions in all aspects throughout these years. I would
also like to convey my sincere gratitude to Dr. Moreno Lelli and Dr. Luisa Poggi. Their
ideas and concepts have had a remarkable influence on my scientific and professional
perceptions. They will have a great impact on my entire career in the field of joint research.
Hand to hand working experience with them, extensive discussions about my work and
interesting explorations in operations has helped me to grow confidence and skills without
which this study would have been difficult.
I warmly thank Dr. Francesca Cantini, Dr. Rebecca Delconte for their advice and friendly
help
I would like to convey my special thanks to Mr. Enrico Morelli and Mr. Massimo Lucci for
their constant and selfless assistance in tackling several computational, instrumental
problems. Their kind support in the midst of their busy schedules has been of great help in
this study.
My sincere thanks are due to the official referees, Professor Rolf Boelens, Director, Bijvoet
Center for Biomolecular Research Utrecht University and Professor. Dr. Harald Schwalbe,

8
Biozentrum in University of Frankfurt for their detailed review, constructive criticism and
excellent advice during the preparation of this thesis.
I would also wish to thank Dr. Yogesh Kumar Gupta, Mrs. Shailee Arya, Dr. Murugendra
Vanarotti Their wonderful company during my initial days in Florence made my life smooth
and enjoyable. I would also like to convey my special regards to my roomies as well as
colleagues Rahul Jaiswal and Ravikrishnan Elangovan for their fantastic company
throughout these three years and friendship.
I wish to thank all my present and past colleagues in CERM for all kinds of assistance and
friendship.
I would also like to convey my special regards to our football team members with whom I
have shared several memorable moments outside the scientific arena. My special thanks to
Massimilano Maletta, Massimilano Peana, Rahul Jaiswal, Ravikrishanan Elangovan,
Dambarudhar Shiva Shankar Hembram, Emanuele Chirivino, Manuele Martinelli, Manuele
Migliardi, Shenlin Wang and my friends from the Department of Lens for their enthusiastic
participation in soccer and friendship.
I take this opportunity to thank also Administration & Secretariat office persons. In
particular I would like to sincerely thank Ms. Laura Norfini, Ms Francesca Risaliti, Ms
Simona Fedi,Ms Lisa Orlando, Ms Milena Moazzi and Mr Michele Natalini for their
sympathetic help in several complicated legal and secretarial work.
I would also like to express my deep and sincere gratitude to my supervisor Professor
Dipankar Chatterji, Molecular Biophysics Unit, Indian Institute of Science, Bangalore,
India, particularly for giving me an opportunity to gain experience in scientific research
field in his laboratory which has given me confidence and urge to pursue a scientific career.
I would like to thank my family for their love and support.
My special gratitude is due to my Father in law for his constant encouragement and caring
advices.
A penultimate thank-you goes to my wonderful parents for always being there with their
blessings and good wishes. However, they deserve far more credit than I can ever give them.

9
Finally, I owe my most heartfelt, loving thanks to my wife Soumyasri. Her company with
constant support, encouragement, patience and love has made my stay in abroad delightful
and stress less. In addition, she proof-read the final text, and from which she eliminated a
multitude of errors: I claim as my own those that remain.

10
TABLE OF CONTENTS
LIST OF ABBREVIATIONS 12
INTRODUCTION AND OVERVIEW 13
REFERENCE LIST 17
CHAPTER 1
FRAGMENT DOCKING TO S100 PROTEINS REVEALS A WIDE
DIVERSITY OF WEAK INTERACTION SITES
21
1.1 Introduction
22
1.2 S100 proteins
22
1.2.1 General overview 22
1.2.2 Structural overview 23
1.2.3 S100 proteins as drug targets 25
1.2.4 NMR in drug-screening 24
1.3 Materials & methods 29
1.3.1 Protein preparation 29
1.3.2 Backbone assignment of both apo and holo S100B 29
1.3.3 NMR based screening 29
1.3.4 Docking 30
1.4 Results & Discussion 32
1.4.1 NMR based screening and mapping of the binding sites 32
1.4.1.1 WaterLOGSY based screening 32
1.4.1.2 Chemical shift mapping 33
1.4.2 S100A13 36
1.4.2.1 Docking 36
1.4.2.2 Cromolyn binding 36
1.4.3 S100B 37
1.4.3.1 Docking 38
11
1.4.3.2 Competetion with p53 39
1.5 Conclusion 48
Reference list 49
CHAPTER 2
PARAMAGNETIC SHIFTS IN SOLID-STATE NMR OF PROTEINS TO
ELICIT STRUCTURAL INFORMATION
58
2.1 Introduction 59
2.2 Paramagnetic metalloproteins 60
2.3 Materials & Methods 64
2.3.1 Preparation of microcrystalline diluted samples 64
2.3.2 Solid-state NMR spectroscopy 64
2.3.3 Assignment procedure 66
2.3.4 Analysis of the inter-molecular pcs 66
2.3.5 Calculation of MMP12 structure with intra-molecular pcs 67
2.4 Results & Discussion 69
2.4.1 Paramagnetic Dilution Strategy 69
2.4.2 Solid-state NMR spectra 71
2.4.3 Use of the inter-molecular pcs for structural information on the
neighboring molecules.
77
2.4.4 Applicability of the intra-molecular pcs for structural determination.
79
2.4.5 Structure elucidation of ZnMMP12
82
2.5 Conclusion 99
Reference list 100
CHAPTER 3
GENERAL CONCLUSIONS AND PERSPECTIVES
105

12
Abbreviations 1. WaterLOGSY: Water-Ligand Observed via Gradent SpectroscopY
2. HSQC: Heteronuclear single quantum coherence.
3. pcs : pseudocontact shift.
4. PDB: Protein Data Bank.
5. RMSD: root means square deviation.
6. NMR: Nuclear magnetic resonance.
7. SS NMR: Solid-state NMR.
8. MAS: Magic angle spinning.
9. CSI: Chemical shift index.
10. TALOS: Torsion Angle Likelihood Obtained from Shift and sequence similarity.
11. MMP: matrix metalloproteinases.
12. NOE: Nuclear Overhauser effect
13. PDSD: Proton driven spin diffusion.

13
Introduction and Overview

14
Introduction After the publication of the genomes1-5 of many organisms6, including humans3, the next
collective challenge is to assign and understand the functions of the final genome products –
proteins. For example, the Structural Biology Roadmap is an effort to create a "picture"
gallery of the molecular shapes of proteins in the body. These three dimensional insights are
crucial for an understanding of basic life processes, such as the reaction mechanism of a
drug-converting enzyme, signal transduction from one protein to another, activation of a
metabolic pathway by a gene effector, or the consequences of a mutation on the function of
an enzyme. Furthermore, understanding of these cellular pathways may allow recognition of
a disease-linked mechanism of a protein, thereby opening the way to design suitable
inhibitors or drugs to inhibit or tune such fatal mechanisms. This truly offers a fascinating
area for research in “designing and drug discovery”7-9
In my PhD thesis work I have been involved in two projects exploring different fields of
structural biology within the realm of “Metalloproteins” using both liquid and solid state
NMR particularly exploiting NMR in the challenging cases, such as i) identification of hits
to inhibit protein-protein interactions rather than inhibiting enzyme functions (using liquid-
state NMR) and ii) obtaining structural info on solid state proteins.
Primarily my attention was devoted in screening small molecule inhibitors for S100 proteins
(particularly S100B) with the aim of i) developing a rapid method to find effective inhibitors
ii) explore their whole surface for possible docking positions comparable with the
experimentally found binding sites and ii) check how analogous or different are the patterns
of ligand binding sites for the two proteins. For this purpose we have chosen S100B and
S100A131 as our target representatives for S100 protein family. Our work results in an
interesting finding, i.e. the presence of different binding sites in each S100 protein and of
rather different behavior of different S100 proteins in spite of the fact that they are similar in
structure. Besides, we have been able to find a variety of weak binding sites for a wide
variety of ligands with little overlap of ligands for the two proteins. This finding is important
because it shows that targeting protein-protein interactions may be intrinsically more
difficult than targeting the active site of an enzyme but also that, for the same reason, the
problem of finding selective binders for one or another member of a family of structurally
related targets is much reduced or even abolished. It is also found that, given the abundance
of weak binding sites on the surface of each S100 protein, the strategy to tether weak binding 1 The work related to S100A13 (both NMR and Docking) and the Docking work with S100B was done in
collaboration with my colleagues Dr. Yvonne Arendt, Dr. Rebecca Delconte, Mattia Mori & Marco Porcu.

15
fragments to build a stronger inhibitor of a specific protein-protein interaction may be even
more valuable than in the case of enzyme active sites (paper 1).
Though solution-state NMR spectroscopy has been mostly used for studying protein-ligand
complexes in solution, solid-state NMR too is now being used for such applications10-
12particularly for systems which cannot be studied by solution state NMR or even by X-ray
crystallography due to the presence of technical difficulties. For example; large share of
important pharmacological targets are insoluble membrane proteins10-12. Membrane proteins
perform essential processes in the cell, such as controlling the flow of information and
materials between cells and mediating activities like nerve impulses and hormone action.
One-third of the genome of any organism encodes membrane proteins. But these systems
cannot be studied in solution since they are highly insoluble. Moreover, possibility to study
intimate dynamic information and electronic details for the bound ligands makes solid-state
NMR13,14 a versatile tool for drug discovery and design. However, the pre-requisite of drug
discovery is still the target identification/validation and protein structure determination by
both liquid as well as by solid-state NMR. The evolution of several techniques for studying
internuclear distances,15 anisotropy,16 torsion angles,17,18 atomic orientations,19,20 spin
diffusions, molecular dynamics,21,22 exchange processes, Magic angle spinning (MAS),23-26
resonance assignment,27,28 etc. assignment, etc has made Solid-state NMR an indispensable
tool for chemical analysis and biomolecular structure determination. Recent studies
demonstrated systems, particularly like insoluble aggregates such as amyloid fibrils,29-31
membrane proteins32-36 can be purified or reconstituted in liposomes in functionally relevant
states, can be studied by solid-state NMR spectroscopy in order to get structural information
as well as in pharmaceutical aplications37. However, in spite of its various applicability,
structure determination of biomolecules by high resolution solid state NMR is still
problematic due to the difficulties in extracting structural restraints 38,39. Hence, this is an
open field of high importance to develop new methods, strategies and experiments which can
be useful for determining structural constraints.
Therefore in the second part of my work, I was involved in a project in which our target
was to develop additional sources of structural restraints, through the analysis of the
paramagnetic contribution in SSNMR of metalloproteins. In this part of my work we show
how SSNMR paramagnetic restraints such as pseudocontact shifts (pcs) can be used as
additional source of restraints for protein structural determination, even providing
information about the relative arrangement of protein molecules in the solid phase. In a
recent paper from our lab we reported the first observation of pseudocontact shifts (pcs) in

16
the 13C SSNMR of a paramagnetic protein, i.e. cobalt(II)-substituted matrix
metalloproteinase 12 (CoMMP-12), and it was proposed that pcs could constitute additional
structural restraints for SSNMR 40. From the known X-ray structure 41 we were able to show
that the pcs observed for each of 246 different 13C assigned nuclei are very well accounted
for by a sum of contributions arising from the intra-molecular cobalt(II) ion and from
cobalt(II) ions belonging to neighboring molecules. It was concluded that if it were possible
to separate intra- from inter-molecular pcs, even for cases where the structure was not
available, intra-molecular pcs would constitute precious restraints to obtain the protein
structure in the solid state. On the other side, inter-molecular pcs could provide information
on the relative arrangement of different protein molecules in the crystal lattice. Addressing
the latter point on microcrystalline samples of CoMMP-12, an approach which could be
dubbed “NMR crystallography”42,43, could also be relevant for non-crystalline systems
displaying one-dimensional order such as, for instance, protein fibrils.
Here we show that using an approach based on the dilution of the paramagnetic species 44 in
combination with two different labeling strategies it is effectively possible to experimentally
separate intra- and inter-molecular pcs. Furthermore, we show that intra-molecular pcs do
improve the quality of the structure in a computational simulation, and inter-molecular pcs
provide quantitative information on the arrangement of the nearest protein neighbors. The
present approach is general and independent from the information coming i.e. from X-ray
diffraction techniques, so it could be applied also to ordered non-crystalline systems such as
fibrils or amyloid proteins which bind metals (as prions)45. Even if the present method is
demonstrated on a metalloprotein, it can be in principle extended to diamagnetic proteins
once a paramagnetic metal is attached to them by using specifically designed tags 46,47.
Finally we also demonstrate that use of paramagnetic shifts can provide us important
structural restraints essentially reducing the number of distant restraints required for
achieving a low resolution structure (paper III in preparation).
Parts I and II of this thesis are based on the following publications:
Fragment docking to S100 proteins reveals a wide diversity of weak interaction sites.
ChemMedChem. 2007; Yvonne Arendt, Anusarka Bhaumik, Rebecca Del Conte, Claudio
Luchinat,* Mattia Mori,] and Marco Porcu.
Paramagnetic Shifts in Solid-State NMR of Proteins to Elicit Structural Information
Stéphane Balayssac, Ivano Bertini, Anusarka Bhaumik, Moreno Lelli, and Claudio
Luchinat.(Under revision).
Part III will constitute a third paper, presently in preparation.

17
Reference List
1. Downes,A.M. & Richardson,B.J. Relationships between genomic base content and distribution of mass in coded proteins. J. Mol. Evol. 55, 476-490 (2002).
2. Sherstnev,V.V. Neurospecific regulatory genome proteins in brain cells and systemic processes of memory. Vestn. Ross. Akad. Med. Nauk 16-19 (1994).
3. Sorenson,D.K. Human genome protein function database. Proc. Annu. Symp. Comput. Appl. Med. Care 434-438 (1991).
4. Stuart,G.W., Moffett,K. & Baker,S. Integrated gene and species phylogenies from unaligned whole genome protein sequences. Bioinformatics. 18, 100-108 (2002).
5. Yao,T. World trends of systems biology related to the genome network project. Tanpakushitsu Kakusan Koso 49, 2993-3000 (2004).
6. Yazaki,K. Morphology of genome and genome-protein complex of viruses. Tanpakushitsu Kakusan Koso 37, 2484-2492 (1992).
7. Betz,M., Saxena,K. & Schwalbe,H. Biomolecular NMR: a chaperone to drug discovery. Curr. Opin. Chem. Biol. 10, 219-225 (2006).
8. Blundell,T.L. et al. Structural biology and bioinformatics in drug design: opportunities and challenges for target identification and lead discovery. Philosophical Transactions of the Royal Society B-Biological Sciences 361, 413-423 (2006).
9. Scapin,G. Structural biology and drug discovery. Curr. Pharm Des. 12, 2087-2097 (2006).
10. Watts & A. NMR of drugs and ligands bound to membrane receptors. Curr. Opin. Biotechnol. 10, 48-53 (1999).
11. Watts & A. Direct studies of ligand-receptor interactions and ion channel blocking. Mol. Membr. Biol. 19, 267-275 (2002).
12. Watts & A. Solid-state NMR in drug design and discovery for membrane-embedded targets. Nat. Rev. Drug Discov. 4, 555-568 (2005).
13. Toyoshima, C, Nomura & H. Structural changes in the calcium pump accompanying the dissociation of calcium. Nature 418, 605-611 (2002).
14. Creuzet, F; McDermott; A; Gebhard; R; van der Hoef; Spijker-Assink; M.B; Herzfeld; Lugtenburg; J; Levitt; M.H; Griffin; R.G. Determination of membrane protein structure by rotational resonance NMR: bacteriorhodopsin. Science 251, 783-786 (1991).
15. Carravetta,M., M; Edén; M.; Johannessen; Ole G.; Luthman; Verdegem; P.J.E.; Lugtenburg; J.; Sebald; A.; Levitt; M.H.. Estimation of carbon-carbon bond lengths and medium-range internuclear distances by solid-state nuclear magnetic resonance. J. Am. Chem. Soc. 123, 10628-10638 (2001).
16. Ironside,M.S., Stein,R.S. & Duer,M.J. Using chemical shift anisotropy to resolve

18
isotropic signals in solid-state NMR. J. Magn Reson. 188, 49-55 (2007).
17. van Beek,J.D. & Meier,B.H. A DOQSY approach for the elucidation of torsion angle distributions in biopolymers: application to silk. J. Magn Reson. 178, 106-120 (2006).
18. Teng,Q., Nicholson,L.K. & Cross,T.A. Experimental determination of torsion angles in the polypeptide backbone of the gramicidin A channel by solid state nuclear magnetic resonance. J. Mol. Biol. 218, 607-619 (1991).
19. Hong,M. Structure, topology, and dynamics of membrane peptides and proteins from solid-state NMR spectroscopy. J. Phys. Chem. B 111, 10340-10351 (2007).
20. Hong,M. & Doherty,T. Orientation Determination of Membrane-Disruptive Proteins Using Powder Samples and Rotational Diffusion: A Simple Solid-State NMR Approach. Chem. Phys. Lett. 432, 296-300 (2006).
21. Bechinger,B., Aisenbrey,C. & Bertani,P. The alignment, structure and dynamics of membrane-associated polypeptides by solid-state NMR spectroscopy. Biochim. Biophys. Acta 1666, 190-204 (2004).
22. Bechinger,B. The structure, dynamics and orientation of antimicrobial peptides in membranes by multidimensional solid-state NMR spectroscopy. Biochim. Biophys. Acta 1462, 157-183 (1999).
23. Rienstra,C.M., C. M., Tucker-Kellogg, L., Jaroniec, C. P., Hohwy, M., Reif, B., McMahon, M. T., Tidor, B., Lozano-Perez, T. & Griffin, R. G.. De novo determination of peptide structure with solid-state magic-angle spinning NMR spectroscopy. Proc. Natl. Acad. Sci. U. S A 99, 10260-10265 (2002).
24. Griffin,R.G. Dipolar recoupling in MAS spectra of biological solids. Nat. Struct. Biol. 5 Suppl, 508-512 (1998).
25. Herzfeld,J., Roufosse,A., Haberkorn,R.A., Griffin,R.G. & Glimcher,M.J. Magic angle sample spinning in inhomogeneously broadened biological systems. Philos. Trans. R. Soc. Lond B Biol. Sci. 289, 459-469 (1980).
26. Marulanda,D., Tasayco,M.L., Cataldi,M., Arriaran,V. & Polenova,T. Resonance assignments and secondary structure analysis of E. coli thioredoxin by magic angle spinning solid-state NMR spectroscopy. J. Phys. Chem. B 109, 18135-18145 (2005).
27. Chen,L. et al. Backbone assignments in solid-state proteins using J-based 3D heteronuclear correlation spectroscopy. J. Am. Chem. Soc. 129, 10650-10651 (2007).
28. Rienstra,C.M. et al. Determination of multiple torsion-angle constraints in U-(13)C,(15)N-labeled peptides: 3D (1)H-(15)N-(13)C-(1)H dipolar chemical shift NMR spectroscopy in rotating solids. J. Am. Chem. Soc. 124, 11908-11922 (2002).
29. Margittai,M. & Langen,R. Spin labeling analysis of amyloids and other protein aggregates. Methods Enzymol. 413, 122-139 (2006).
30. Tycko,R. Characterization of amyloid structures at the molecular level by solid state nuclear magnetic resonance spectroscopy. Methods Enzymol. 413, 103-122 (2006).

19
31. Tycko,R. Solid-state NMR as a probe of amyloid structure. Protein Pept. Lett. 13, 229-234 (2006).
32. De Angelis,A.A. & Opella,S.J. Bicelle samples for solid-state NMR of membrane proteins. Nat. Protoc. 2, 2332-2338 (2007).
33. Opella,S.J., Nevzorov,A., Mesleb,M.F. & Marassi,F.M. Structure determination of membrane proteins by NMR spectroscopy. Biochem. Cell Biol. 80, 597-604 (2002).
34. Opella,S.J., Ma,C. & Marassi,F.M. Nuclear magnetic resonance of membrane-associated peptides and proteins. Methods Enzymol. 339, 285-313 (2001).
35. Marassi,F.M. A simple approach to membrane protein secondary structure and topology based on NMR spectroscopy. Biophys. J. 80, 994-1003 (2001).
36. Marassi,F.M. & Opella,S.J. NMR structural studies of membrane proteins. Curr. Opin. Struct. Biol. 8, 640-648 (1998).
37. Bugay,D.E. Solid-state nuclear magnetic resonance spectroscopy: theory and pharmaceutical applications. Pharm. Res. 10, 317-327 (1993).
38. Sakellariou,D., Lesage,A. & Emsley,L. Proton-proton constraints in powdered solids from (1)H-(1)H-(1)H and (1)H-(1)H-(13)C three-dimensional NMR chemical shift correlation spectroscopy. J. Am. Chem. Soc. 123, 5604-5605 (2001).
39. Hodgkinson,P. & Emsley,L. The accuracy of distance measurements in solid-state NMR. J. Magn Reson. 139, 46-59 (1999).
40. Balayssac,S., Bertini,I., Lelli,M., Luchinat,C. & Maletta,M. Paramagnetic ions provide structural restraints in solid-state NMR of proteins. J. Am. Chem. Soc. 129, 2218-2219 (2007).
41. Bertini, I., Calderone, V., Cosenza, M., Fragai, M., Lee, Y. M., Luchinat, C., Mangani, S., Terni, B. & Turano, P. Conformational variability of matrix metalloproteinases: Beyond a single 3D structure. Proc. Natl. Acad. Sci. U. S. A 102, 5334-5339 (2005).
42. Pickard,C.J., Salager,E., Pintacuda,G., Elena,B. & Emsley,L. Resolving structures from powders by NMR crystallography using combined proton spin diffusion and plane wave DFT calculations. J. Am. Chem. Soc. 129, 8932-+ (2007).
43. Harris,R.K., Cadars, S., Emsley, L., Yates, J. R., Pickard, C. J., Jetti, R. K. & Griesser, U. J.. NMR crystallography of oxybuprocaine hydrochloride, Modification II degrees. Phys. Chem. Chem. Phys. 9, 360-368 (2007).
44. Brough,A.R., Grey,C.P. & Dobson,C.M. Paramagnetic-Ions As Structural Probes in Solid-State Nmr - Distance Measurements in Crystalline Lanthanide Acetates. J. Am. Chem. Soc. 115, 7318-7327 (1993).
45. Jackson,G.S., Murray, I., Hosszu, L. L., Gibbs, N., Waltho, J. P., Clarke, A. R. & Collinge, J.. Location and properties of metal-binding sites on the human prion protein. Proc. Natl. Acad. Sci. U. S. A 98, 8531-8535 (2001).
46. Wohnert,J., Franz,K.J., Nitz,M., Imperiali,B. & Schwalbe,H. Protein alignment by a

20
coexpressed lanthanide-binding tag for the measurement of residual dipolar couplings. J. Am. Chem. Soc. 125, 13338-13339 (2003).
47. Ikegami,T., Verdier, L., Sakhaii, P., Grimme, S., Pescatore, B., Saxena, K., Fiebig, K. M. & Griesinger, C.. Novel techniques for weak alignment of proteins in solution using chemical tags coordinating lanthanide ions. J. Biomol. NMR. 29, 339-349 (2004).

21
Chapter I Fragment docking to S100 proteins
reveals a wide diversity of weak
interaction sites

22
1.1 Introduction One-third of all proteins are "metalloproteins",1 chemical combinations of protein atoms
(carbon, nitrogen, oxygen, hydrogen, sulfur) with ions of various metals2-9. The metal ions in
metalloproteins are critical to the protein's function, structure, or stability. In fact, numerous
essential biological functions require metal ions, and most of these metal ion functions
involve metalloproteins. Thus, metalloproteins make life on Earth possible. They enable us
to understand and ultimately control the binding and activity of protein metal sites which is
of great biological and medical importance. A relevant family of such metalloproteins is
presented as Calcium binding proteins.10 This particular family of metalloproteins is
comprised of several protein subfamilies depending on their structural and functional
similarity such as: calmodulin-like subfamily, S100 proteins, neuron specific calcium
sensors, calbindin D28k-like subfamily, parvalbumins, myosin light chains, calpain-like
subfamily etc11. Interestingly, the members of calmodulin-like subfamily, S100 proteins,
neuron specific calcium sensors and myosin light chains are usually observed to have high
affinity12,13 calcium binding domains and display large conformational changes14-17 upon
calcium binding and participate in both modulation of Ca+2 signals and thereby playing
regulatory role in cell. On the other hand, the protein members included in Parvalbumin,
calbindin D28k-like subfamilies show high calcium affinity without any conformational
change. They may thus be responsible for structural stability and buffering intracellular Ca+2
levels.
1.2 S100 proteins
1.2.1 General overview:
S100s are a unique group of calcium binding proteins characterized by cell-type and
cell cycle- specific expression, as well as deregulated expression in neurological disorders
(S100B- Alzheimer disease,18 Down syndrome,19 and epilepsy20), inflammatory disorders
(S100A8/A9- cystic fibrosis,21 arthritis22 and chronic bronchitis23), and certain cancers
(S100A2/A4/A6)24,25. They show a different extent of similarities; varying from 25-56%
amino acid sequence identity, share conserved structural motifs and possibly common
mechanisms of action. At the cellular level, S100 proteins have been implicated in the
control of cell growth and proliferation, cell cycle progression, modulation of specific signal
transduction pathways, transcription and differentiation24,26-29. They also have extra-cellular
functions, including neurotrophic30 and antimicrobial activity31. A unique feature of these
proteins is that individual members are localized in specific cellular compartments from
which some are able to relocate upon Ca2+ activation, transducing the Ca2+ signal in a
23
temporal and spacial manner by interacting with different targets specific for each S100
protein. The name is derived from the fact that the protein is 100% Soluble in ammonium
sulfate at neutral pH.32 Twenty members have been identified so far in the human genome,
and altogether, S100 proteins represent the largest subgroup in the calcium-binding EF-hand
protein family. Because of its abundance in the nervous system and owing to the limited
sensitivity of the immunological methods in earlier sixties,32 S100 was regarded as a brain
specific protein restricted to glial cells. However, soon with the developments in different
biochemical method and new discoveries indicated that the several members of this family
were discovered to have various cellular distributions. S100 genes are expressed in many
tissues including those of the nervous system, musculature, skin,33 adipose tissues,
reproductive system, gastrointestinal system, respiratory system, and urinary system.
1.2.2 Structural Overview:
S100 proteins are a type of homodimeric or heterodimeric low molecular weight protein
found in vertebrates characterized by two calcium binding sites of the helix-loop-helix ("EF-
hand type")34 conformation. The term “EF-hand” was introduced by R. H. Kretsinger35 over
30 years ago for the Ca2+-binding variant of a helix-loop-helix motif discovered in the
structure of parvalbumin, a small Ca2+-binding protein isolated from carp muscle. The EF-
hand motifs were then identified in the amino acid sequence of troponin C, the myosin light
chains, the ubiquitous calmodulin, and in many other Ca2+-binding proteins. Today, there
are more than 3000 EF-hand related entries in the NCBI Reference Sequences Data Bank.
The most common (canonical) EF-hand has a 12-residue Ca2+-binding loop that starts with
an aspartate and ends with a glutamate.

24
The Ca2+–ligand geometry in small molecule-Ca2+ complexes is octahedral, which when
applied to the Ca2+–EF-hand complex provides a convenient assignment of the ligands in
the orthogonal coordinate system centered on the Ca2+, and the X,Y,Z axes defined by the
first three Ca2+ ligands of the loop. However, in most EF-hand proteins Ca2+ is linked to
seven oxygen atoms arranged in a pentagonal bipyramid. The Glu residue in the last position
of the loop (−Z ligand) contributes two oxygen atoms of its γ-carboxyl group (a bidentate
ligand). In all known structures of EF-hand proteins the central residue of the Ca2+-binding
loop (the −Y position) binds Ca2+ with the main-chain carbonyl oxygen atom. Next to this
residue, there is a hydrophobic amino acid (most frequently Ile, Val or Leu) that makes two
hydrogen bonds with the equivalent residue of the paired EF-hand, a part of the short β-sheet
connecting the two Ca2+-binding loop. The composition and the length of the Ca2+-binding
loops vary significantly among the EF-hand proteins. The N-terminal EF-hand has a 14-
residue loop and except for the C-terminal glutamate, all protein ligands are the main-chain
carbonyl oxygen atoms. Despite such radical departure from the “normal” mode of binding,
the pentagonal bipyramid Ca2+-ligand geometry and the high affinity for Ca2+ are
preserved. This variant of the EF-hand motif referred to as the pseudo EF-hand is found in
members of the S100 protein family having lower Ca+2 affinity (KD = 200-500µM) than the
other C-terminal EF hand motif (KD = 20-50µM)36. The key attribute of the regulatory EF-

25
hand proteins is the ability to change their conformation upon binding Ca2+, thus acquiring
different interactive properties. The structure of EF-hand I of calcyclin
(S100A6)32,37determined by X-ray crystallography is very similar in the apo and in the
Ca2+-bound states. In contrast, in EF-hand II, Ca2+ induces a large 86° change in the
orientation of helix III with respect to helix IV. A similar Ca2+-dependent change in the
orientation of helix III was also found in S100B. Based on the respective apo structures it
most likely occurs also in S100A1 and S100A3. This reorientation of helix III results in the
formation of a hydrophobic patch surrounded by a number of acidic residues in the S100
dimer, which is proposed to function as the target recognition site. The exceptionally large
change in the position of helix III is related, at least in part, to the “inverted” conformation of
the Ca2+-binding loop II in the apo structure. Interestingly it is observed38 that the
molecular surface of S100B dimer is characterized by many charged residues, especially
negatively charged ones, whereas no obvious hydrophobic surface has been reported in apo-
S100B. On the contrary, in analogy with calmodulin, the Ca+2 dependent conformational
change exposes a buried hydrophobic core on the protein surface in the holo-S100B,
indicating a novel mode of target recognition through hydrophobic interaction.
1.2.3 S100 proteins as drug targets:
S100 proteins have received increasing attention due to their close association with
several human diseases39 including Alzheimer's & down syndrome (S100B),19
cardiomyopathy (S100A1), cancer (S100A2, S100A4, S100A6, S100A7, S100A11,
S100P),39 Amiyotrophic lateral Sclerosis (ALS) (S100A6),40,41 psoriasis (S100A7),42
Inflammation (S100A8/S100A9),43 rheumatoid arthritis (S100A12),44,45 neurodegenerative
disorders and cancer. They have also been proven to be valuable in the diagnostic of these
diseases, as predictive marker46,47 of improving clinical management, outcome and survival
of patients and are considered as potential drug targets to improve therapies. Importantly,
these proteins regulate intracellular processes such as cell growth and mobility, cell cycle
regulation, transcription, and differentiation. This suggests that different S100s have
different functions, and as they do not have any catalytic activity of their own it is likely that
they regulate the activity of other proteins. Many of these regulatory pathways involve a
direct interaction of a specific S100 protein with a particular target protein, so it is
reasonable to expect that different members of the S100 family have quite different
physiological roles. Misregulation of any of these interactions can thus cause pathologies,
which make S100 proteins potential drug targets. For example; the role of S100B in
proliferation has been demonstrated through its binding capability with the C terminus

26
regulatory domain of p53 and inhibiting its tumor suppressor function.48-52The comparison
of three structures, calcium-free S100B (apo-S100B), calcium-bound S100B (holo-S100B),
and holo-S100B bound to a peptide derived from the C-terminal negative regulatory domain
of p53 proved to be very useful in understanding this role in a convincing manner.48,53,54 It
has been reported that upon addition of calcium to apo-S100B, several hydrophobic residues
on helix 3, helix 4, and loop 2 are exposed due to a large conformational change in the
second EF-hand domain of S100B. These newly exposed residues form a small-hydrophobic
patch on the surface of holo-S100B and participate in the S100B-p53 binding interface. In
the absence of calcium, these same hydrophobic residues are buried in the core of an S100B
subunit, and p53 cannot bind S100B, even at mM concentrations, thereby regulating wild
type p53 tumor suppressor activity in cancer cells. Hence designing and search of small
molecule inhibitors of this interaction could be of high importance.
1.2.4 NMR in drug-screening
NMR is one of several techniques to support drug discovery efforts.55-57 NMR screening is
especially appreciated for its robustness of not producing false positive results, and for its
sensitivity to identify weak interactions58-60. The primary, intrinsic advantage, of NMR is its
ability to detect weak intermolecular interactions, e.g. between a ligand and a target. This
ability makes NMR ideal for fragment-based screening61,62. In a fragment-based approach,
comparably small and simple molecules are screened for binding to a target. Frequently,
NMR is used as a primary step to screen large numbers of such small molecules in a rapid
and productive manner,63,64 to detect ligands that bind to a given target. Several NMR-based
approach have been developed for this purpose. For example, Saturation-Transfer-Difference
(STD) NMR spectroscopy,65-67 TINS (Target Immobilized NMR screening),68 Water-LOGSY
experiments,69,70 screening using 2D 1H, 15N-heteronuclear single quantum coherence
(HSQC) spectroscopy (often known as SAR by NMR),71,72 measurement of the translational
diffusion rate73-75 using gradient-assisted NMR spectroscopy,76 and measurement of
transverse relaxation rates (T2)77 of the ligand signals can be used to identify protein-ligand
complex formation. Most of these methods are well established and documented for their
ability to provide exclusive information on ligand binding. Among these experiments, STD
experiments, TINS and water-LOGSY experiments are popular for large scale efficient
screening. Both STD and water-LOGSY take advantage of the fact that the intermolecular
NOE transfer is strongly negative. In STD NMR technique, a difference spectrum is
generated from two spectra that are recorded with and without pre-irradiation of protein

27
resonances, whereby alteration of the population difference of the protein resonances is
achieved by irradiation of regions of the protein 1H-NMR spectrum that do not contain
resonances of the ligand. This technique is very sensitive, and can be used to determine the
dissociation constant of the complex, either directly or in competition experiments.
WaterLOGSY (water ligand observation by gradient spectroscopy) is a related experiment
that is based on the transfer of magnetization from bulk water to the protein binding site and
then onto a bound ligand. The success of both of these methods relies on their being based
on 1D NMR experiments and on the modest requirement of target protein (5-10 µg)78. TINS
(Target Immobilized NMR screening)68 is a comparatively recent method where binding of
fragments to a protein is detected by comparing 1D NMR spectra of compound mixtures in
the presence of a target immobilized on a solid support to a control sample. One of the
advantages of this method is its applicability for soluble as well as membrane bound proteins
which are usually difficult to get in soluble form. Moreover, a reference protein can be used
in order to remove false positive signals due to weak, non-specific interactions between
small molecules and proteins. However, this screening method requires a special hardware
set up for its effective exploitation. All these above mentioned screening methods are well
known for their ability for high-throughput screening and identification of small effective
hits. Once such interacting compounds are identified, detailed structural insights about their
binding properties are gained either from high-resolution NMR or X-ray crystallographic
studies. At this point, computational methodologies79-84 can serve in a significant manner.
One of the most employed computational programs is DOCK85-87. This method is
particularly used in prediction of ligand conformation and orientation within a targeted
binding site. It is helpful in understanding the protein-ligand interactions considering various
factors implicated in this phenomenon, such as electrostatic interactions, van der Waals
interactions, solvation or entropic effects88 along with the flexibility89 of ligand and
protein90-92. Other than identification of potential ligands, this method is also applicable for
further modification of identified weaker “leads” using computer-based modeling. Moreover,
docking methods allow predicting the conformation of the binding site on a protein surface
on the basis of accurate (known structure) or approximate shape and electrostatic
complementarities. Based on this structural information, these compounds are modified to
generate, in a cyclic process, molecules with high efficacy. However, it is widely appreciated
that inhibiting specific protein-protein interaction is a more difficult objective than inhibiting
for example, enzymatic functions, and this is the reason why much has not been achieved in
this area. For example, the well-known families of matrix metalloproteinases (MMPs) are
28
enzymes with a well-defined catalytic role, whereas S100 proteins are in general, modulators
of different protein activities. So the interaction site is very well defined in MMPs but yet
largely undefined in S100 proteins. However, MMPs suffer from the problem that they have
very similar structures and functions, and inhibiting a particular MMP selectively without
affecting the other members of the family is difficult93,94. Conversely, the members of S100
family have a variety of partners and therefore it may be hoped that selectivity is more easily
achieved.
Therefore, in this study we decided to look at two different S100 proteins (S100B and
S100A13) in order to i) explore their whole surface for possible docking positions and ii)
check how analogous or different are the patterns of ligand binding sites for the two proteins.
S100B is reported to interact with the C-terminal peptide of p53,48,49,54,95,96 and to be
involved in cancer through the regulation of p53 protein,97-101 intrinsically known as a
tumour suppressor factor. Moreover, for the S100B–p53 interaction, it was found that
phosphorylation of specific serine and/or threonine residues reduce the affinity of the
S100B–p53 interaction by as much as an order of magnitude, and are important for
protecting p53 from S100B-dependent down-regulation.50 S100A13 has been recently
designated as a new marker of angiogenesis in human astrocytic gliomas,102and as a
regulator of the FGF-1 release103-105.
In the present work both S100 proteins were screened via NMR towards a fragment library
(430 members). We found that a large variety of weak binding sites (low mM-high µm range)
exist in the two proteins, with little overlap between the fragments that bind to one or the
other protein. We have also found that in the case of S100B there are two main sites that are
able to bind fragments of the library and are potentially overlapping with the interaction area
of the p53 C-terminal peptide. Interestingly, S100A13 does not show appreciable affinity for
these ligands, confirming our hypothesis that the variety of functions of S100 proteins may
make it easier to find selective ligands for individual members of this family. This is a
further step to attempt drug design strategies for these proteins.

29
1.3 Materials & methods 1.3.1 Protein preparation: Human S100A13106 and bovine S100B107 were expressed and
purified as previously reported to obtain unlabelled and 15N labelled proteins.
1.3.2 Backbone assignment of both apo and holo S100B: This was done using the
reported solution structure108 and 3D HSQC-NOESY, HNHA experiments and using
previously reported assignments. All the NMR experiments were done with 0.65mM of 15N
lebelled S100B, 30mM Hepes, 50mM KCl, pH-6.5 at 700MHz and 500MHz. 1H-15N HSQC
spectrum was collected using the sensitivity-enhanced method. The number of complex data
points and spectral widths were 512, 8000 Hz (1H) and 64, 1500 Hz (15N), respectively. 15Nedited NOESY-HSQC spectra were recorded with mixing times of 50 and 150 ms. The
number of complex data points collected and spectral widths were 512/7000.4 Hz F3 (1H),
32/1500 Hz F2 (15N), and 128/7000.4 Hz F1 (1H). An HNHA experiment was acquired with
512 F3 (1H), 64 F2 (15N), and 32 F1 (1H) complex data points.
1.3.3 NMR-Based screening: For all the NMR experiments S100A13 samples were
prepared in acetate buffer 20 mM pH 5.6, and S100B samples were prepared in HEPES
30
buffer 30 mM pH 6.5, KCl 50 mM. Samples for Water-LOGSY109 experiments were
prepared at a monomeric concentration of 20 µM of both S100A13 and S100B, with
candidate ligand concentrations of 800 µM .Samples for 15N-HSQC spectra were prepared at
monomeric protein concentration of 100 µM and 400 µM for S100A13 and S100B,
respectively. Concentration of the S100B was checked by UV spectroscopic detection using
reported extinction coefficient €280 =3400M-1 cm-1. All NMR experiments were performed at
298 K on a Bruker Avance 700 spectrometer equipped with a sample changer, and on Avance
800 and 900 spectrometers both equipped with cryo-probes. NMR-based screening was
conducted using WaterLOGSY spectra as the primary method of screening. For each
compound, a reference 1D spectrum of the compound alone and a 1D WaterLOGSY
spectrum in the presence of the protein were recorded. WaterLOGSY NMR experiments
employed a 2msec selective rectangular 180º pulse at the water signal frequency and a NOE
mixing time of 2 s. To map the interacting surface of the proteins, titration of the fragments
were followed through 15N-HSQC spectra. KD values were calculated by plotting the
weighted average 1H and 15N chemical shifts of selected residues as a function of
concentration of fragment added during the titration considering one site binding mode.
Garrett values are given by equation 110
1.3.4 Docking: Docking calculations were performed on a Open Mosics cluster equipped
with nine AMD Athlon 3.0 GHz processors running Gentoo Linux. The molecules were
manipulated using ChemOffice Pro version 8.0. The atomic partial charges of the fragments
were calculated using the semi empirical MNDO/3 and PM3 methods implemented in the
Chem3D 8.0 program, whereas for the proteins S100A13 (PDB code: 1YUU) and S100B
(PDB code: 1DT7) we assigned the atom types and the charges using AMBER force field.
With the program AutoGrid we generated three grids of size 70M70M70 N and with a grid
spacing of 0.375 N (three for S100A13 and one for S100B). The grid boxes was centered
respectively: on the helix- α1, near the calcium (S100A13 GRID 1), on the two tryptophans
77 of the helix-α4, at the interface between the two monomers (S100A13 GRID 2), on the
hinge-loop (S100A13 GRID 3), and in the hydrophobic cluster between helices α3 and α4
and hinge loop, close to the side chain of I47 (S100B GRID). The ligands were docked with
the program AutoDock (version 3.05). For each docking experiment we performed a global
search using the Lamarckian genetic algorithm (LGA) to find the possible areas of minimum
energy of interaction and a local search (LS) to optimize the energy and to search for the best
( )[ ] ( )[ ]2
5)(21521 NHNH δδδ ∆+∆
=∆

31
conformers. During the docking process, a maximum of 100 conformers was considered for
each compound (the default is ten conformers). The initial position of each ligand was on the
center of the box and oriented randomly. The initial population was constituted by 100
random individuals. Step sizes of 0.2 N for translation and 58 for rotation were chosen and a
maximum number of 1500 000 energy evaluations and 28000 generations were considered.
Operator weights for crossover, mutation, and elitism were default parameters (0.80, 0.02,
and 1, respectively). The AutoDock scoring function was used and the first four clusters of
solutions were furthermore analyzed one by one to check the agreement between the docking
position on the surface and the experimental screening results.

32
1.4 Results & Discussion 1.4.1 NMR-based screening and mapping of the binding sites
1.4.1.1 WaterLOGSY-based screening: An NMR-based screening was conducted using the
ligand-based waterLOGSY (water-ligand observed via gradient spectroscopy)109 technique
on calcium-loaded S100A13 and S100B. In WaterLOGSY experiment (Water-Ligand
Observed via Gradent SpectroscopY)109 the large bulk water magnetization is partially
transferred via the protein-ligand complex to the free ligand in a selective manner. In this
experiment, the resonances of non-binding compounds appear with opposite sign with
respect to each other and tend to be weaker than those of the interacting ligands. In order to
perform high throughput screening many of the experiments were done in presence of couple
of ligands. Figure 2A (Results section) represents a 1H spectrum of (5B and 5C) a couple of
inhibitors. In presence of protein molecule in the solution the interacting compound appears
to be negative with respect to the non-interacting components (Figure 2B).
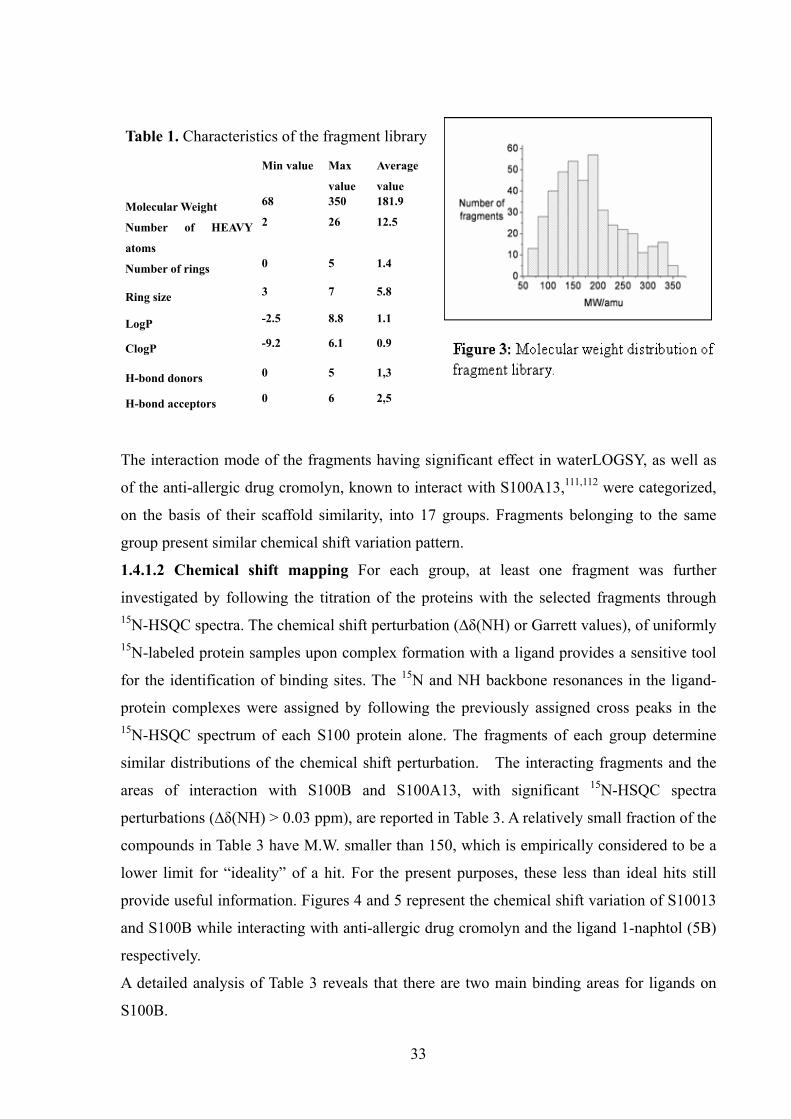
The fragment library of ProtEra S.r.l. was used, containing 430 commercially available
fragments as chemically diverse as possible (see Table 1 and Figure 3).The library is small
and generic, and was purposely built to also contain smaller than usual fragments. Fifty-six
and forty-seven fragments showed an interaction with S100A13 and S100B, respectively.
Only thirteen fragments bind both proteins.
33
Table 1. Characteristics of the fragment library Min value Max
value
Average
value
Molecular Weight 68 350 181.9
Number of HEAVY
atoms
2 26 12.5
Number of rings 0 5 1.4
Ring size 3 7 5.8
LogP -2.5 8.8 1.1
ClogP -9.2 6.1 0.9
H-bond donors 0 5 1,3
H-bond acceptors 0 6 2,5
The interaction mode of the fragments having significant effect in waterLOGSY, as well as
of the anti-allergic drug cromolyn, known to interact with S100A13,111,112 were categorized,
on the basis of their scaffold similarity, into 17 groups. Fragments belonging to the same
group present similar chemical shift variation pattern.
1.4.1.2 Chemical shift mapping For each group, at least one fragment was further
investigated by following the titration of the proteins with the selected fragments through 15N-HSQC spectra. The chemical shift perturbation (∆δ(NH) or Garrett values), of uniformly 15N-labeled protein samples upon complex formation with a ligand provides a sensitive tool
for the identification of binding sites. The 15N and NH backbone resonances in the ligand-
protein complexes were assigned by following the previously assigned cross peaks in the 15N-HSQC spectrum of each S100 protein alone. The fragments of each group determine
similar distributions of the chemical shift perturbation. The interacting fragments and the
areas of interaction with S100B and S100A13, with significant 15N-HSQC spectra
perturbations (∆δ(NH) > 0.03 ppm), are reported in Table 3. A relatively small fraction of the
compounds in Table 3 have M.W. smaller than 150, which is empirically considered to be a
lower limit for “ideality” of a hit. For the present purposes, these less than ideal hits still
provide useful information. Figures 4 and 5 represent the chemical shift variation of S10013
and S100B while interacting with anti-allergic drug cromolyn and the ligand 1-naphtol (5B)
respectively.
A detailed analysis of Table 3 reveals that there are two main binding areas for ligands on
S100B.
34
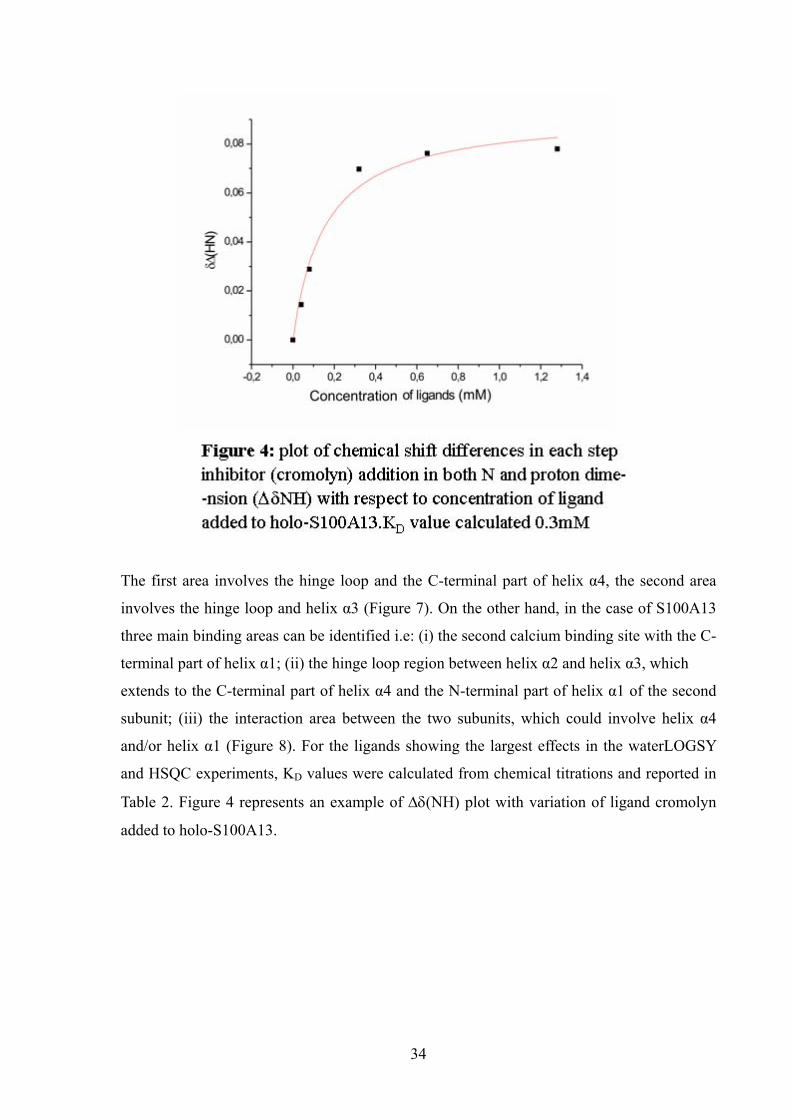
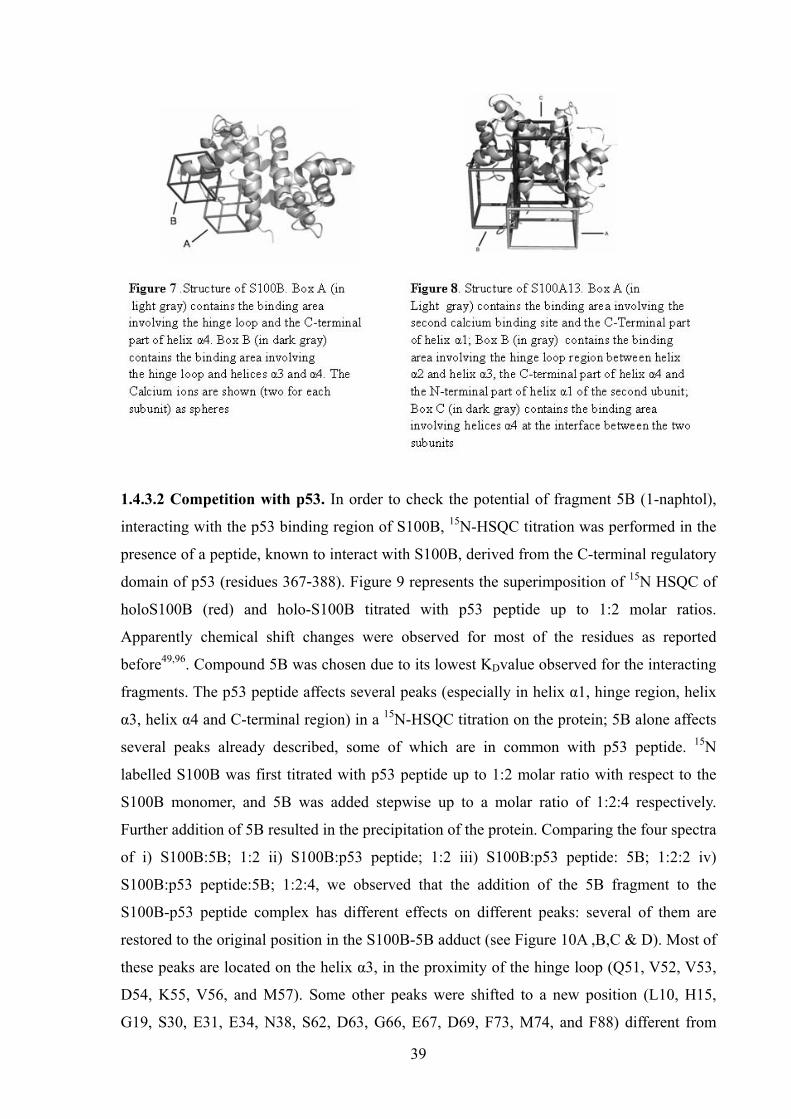
The first area involves the hinge loop and the C-terminal part of helix α4, the second area
involves the hinge loop and helix α3 (Figure 7). On the other hand, in the case of S100A13
three main binding areas can be identified i.e: (i) the second calcium binding site with the C-
terminal part of helix α1; (ii) the hinge loop region between helix α2 and helix α3, which
extends to the C-terminal part of helix α4 and the N-terminal part of helix α1 of the second
subunit; (iii) the interaction area between the two subunits, which could involve helix α4
and/or helix α1 (Figure 8). For the ligands showing the largest effects in the waterLOGSY
and HSQC experiments, KD values were calculated from chemical titrations and reported in
Table 2. Figure 4 represents an example of ∆δ(NH) plot with variation of ligand cromolyn
added to holo-S100A13.

35
Table2. KD and ligand efficiency (LE) values calculated for interesting hits for S100A13
and S100B.
Molecular
formula
Library
code
KD (mM)
on
S100A13
KD (mM)
on S100B Residues with ∆δ(NH)>0.03 ppm
5B - ~0.1
LE=0.50
8,11,16,42,43,45, 47,48,51,53,61,70,79,87
19V - ~1.5
LE=0.38
4,5,9-12,25,43,59, 75,77,79,82,
84-89
2T - ~2.3
LE=0.26
1,4,8,9,11,16,18, 41-43,54,55,58,
61,75,80,82,84, 88-90
AC - ~1.0
LE=0.20
8,-10,19,35,37,42, 43,48,62,71,73,75,76,79-81,83-85,
87-91
HO OH 4E
~0.9
LE=0.24 - 49, 50, 52, 53, 54, 82
9A ~0.9
LE=0.35
- 2, 6-8, 11, 12, 14, 18, 24, 25, 34, 38, 43, 49, 56, 65,
73, 74, 77, 78, 81, 85, 87, 89
12Z ~1.8
LE=0.42
- 7, 8, 11, 12, 14, 18, 24, 25, 30, 34, 40, 64, 65, 78, 80 -
82, 84, 89
HO
O
NH2
OH
O
13Y
~2.3
LE=0.43 -
4, 7, 8, 11, 12, 14, 18, 24-26 , 34, 43, 48, 50 ,83, 86,
87, 89, 92,
21M ~0.7
LE=0.19
- 6, 11 18, 20, 22, 71, 73, 74,77, 78, 81-84, 86, 89, 93
cromolyn ~0.3
LE=0.14
- 16, 18, 21, 50, 64, 65, 71 73, 77, 80, 81, 82, 84, 86,
89, 92
From the knowledge of the KD we calculated the ligand efficiency (LE) of each fragment,
defined as:
LE=-∆G/Nnon-hydrogen atoms≈-RTln(KD)/ Nnon-hydrogen atoms (1)
The concept of ligand efficiency, introduced by the pioneering work of Kuntz, Kollman and
colleagues, can be used to assess the quality of initial screening hits and also the quality of
the leads as they are optimized61,113. LE values higher than 0,3 are considered a good starting
point for the hit-to-lead development process. Our results showed that two ligands for S100B
and three ligands for S100A13, have LE values higher than 0.3. These ligands should be then
a good starting point to develop protein ligands with high druggability potential.
OH
N
H N
N H2
N N
N N H
O
O
O
N
O
OH
O
OH
S
O
OH
O
O
O H O O O O
O O O
O H
O
O H

36
To identify the binding conformation of the hits, we coupled the experimental NMR data
with docking calculations, using AutoDock program, as recently reported by Mercier K.A. et
al
1.4.2 S100A13
1.4.2.1 Docking: Docking calculations were carried out to identify the more probable
binding conformations for each of the twenty four ligands with non-negligible chemical shift
variations (∆δ > 0.03 ppm, Table 3)
The docking calculations were performed on three different potential grid maps, covering
the entire protein volume, centered on the three binding areas identified by the NMR
screening (The docking protocol is described in the experimental section). The analyses were
performed manually, taking into account both the agreement with the NMR data and the free
binding energy of the ligand-protein complex provided by the docking results. The docking
results are consistent with the presence of three main binding areas on the protein S100A13.
In particular compounds warfarin (21M), anthraquinone-sulfonic acid (3S), 2,6-
naphtalenedisulphonic acid (11B), 3,5-pyrazoledicarboxylic acid (11L), benzothiophene
(12Z), and furosemide (17K) preferentially interact in area i), compound 2,3-
dicarboxypyridine (9A) preferentially interact in area ii) and the compounds bisphenol A
(4E), cimetidine (17C), (L)-glutamic acid (13Y) preferentially interact in area iii). For each
of the ligands we found at least one cluster of docking conformations in agreement with the
area identified by the NMR experiments.
1.4.2.2 Cromolyn binding. In 1997 and 1999 Kobayashi et al.111,112 demonstrated that three
different anti-allergic drugs, among which cromolyn, bind to S100A13. To investigate the
molecular basis of this interaction, we performed a 15N-HSQC titration of S100A13 with
cromolyn. Plots of δ∆(HN) vs ligand concentration for the most shifted residues (T18, F21,
V65, A84 and K89) give a good fitting with the one binding site equation (R2≈0.97).
Docking calculations generated two clusters of conformations, in agreement with the
experimental data, binding in the areas A and C of Fig. 5 respectively; however the cluster
interacting near the helices α4 (area C of Fig. 5) is characterized by a final docked energy
thirty percent lower with respect to the others; in this solution cromolyn is close to many of
the residues with high chemical shift variation, in particular V65 of loop III, W77, and E82
of helix α4 (Figure 5C). Our data thus provide a structural basis for this interaction.

37
1.4.3 S100B
1.4.3.1 Docking. All the fragments interacting with S100B by waterLOGSY experiments
were docked on the surface of the S100B protein and, as for S100A13, the docking solutions
were analyzed manually, according to the agreement with the HSQC data and the free
binding energy of the ligand-protein complex. Two possible interaction areas have been
identified, located around the hinge loop. In particular, the first one is characterized by the
pocket involving the hinge loop, helix α1 and mostly the C-terminal portion of helix α4
(F87, C84, F43, L44, and V8) (see Figure 6B & C). Compounds (L)-tryptophan-methylester
(16G), 1,10-phenantroline (2T), (3R,9R)-3-((benzyloxy)methyl)-hexahydro-6H-
pyrido[1,2]pyrazine-1,4-dione (AC) preferentially interact in this surface region, justifying
the chemical shift variations observed especially in the first part of helix α1. Also the second
interacting area involves the hinge loop, but also involves the helix α3 in its N-terminal part.
The compounds showing significant interactions in the second area are 1-naphtol (5B), 2-
aminobenzimidazole (19V), (3R, 9R)-3-((benzyloxy)methyl-hexahydro-6H-

38
pyrido[1,2]pyrazine-1,4-dione (AC). These interactions are responsible for the largest
chemical shift variations observed in helix α2 and helix α3.
By the analysis of the docking results most of the fragments bind exclusively in one of the
two areas identified. In a fragment based approach the identified fragments binding in
different areas should be subsequently linked with the intent to obtain stronger interacting
compounds for S100B.
39
1.4.3.2 Competition with p53. In order to check the potential of fragment 5B (1-naphtol),
interacting with the p53 binding region of S100B, 15N-HSQC titration was performed in the
presence of a peptide, known to interact with S100B, derived from the C-terminal regulatory
domain of p53 (residues 367-388). Figure 9 represents the superimposition of 15N HSQC of
holoS100B (red) and holo-S100B titrated with p53 peptide up to 1:2 molar ratios.
Apparently chemical shift changes were observed for most of the residues as reported
before49,96. Compound 5B was chosen due to its lowest KDvalue observed for the interacting
fragments. The p53 peptide affects several peaks (especially in helix α1, hinge region, helix
α3, helix α4 and C-terminal region) in a 15N-HSQC titration on the protein; 5B alone affects
several peaks already described, some of which are in common with p53 peptide. 15N
labelled S100B was first titrated with p53 peptide up to 1:2 molar ratio with respect to the
S100B monomer, and 5B was added stepwise up to a molar ratio of 1:2:4 respectively.
Further addition of 5B resulted in the precipitation of the protein. Comparing the four spectra
of i) S100B:5B; 1:2 ii) S100B:p53 peptide; 1:2 iii) S100B:p53 peptide: 5B; 1:2:2 iv)
S100B:p53 peptide:5B; 1:2:4, we observed that the addition of the 5B fragment to the
S100B-p53 peptide complex has different effects on different peaks: several of them are
restored to the original position in the S100B-5B adduct (see Figure 10A ,B,C & D). Most of
these peaks are located on the helix α3, in the proximity of the hinge loop (Q51, V52, V53,
D54, K55, V56, and M57). Some other peaks were shifted to a new position (L10, H15,
G19, S30, E31, E34, N38, S62, D63, G66, E67, D69, F73, M74, and F88) different from

40
their original positions in S100B-5B and S100B-p53 peptide adducts. This points to 5B
replacing a portion of the bound peptide molecule, with a mixed competitive/non
competitive behaviour. The other portion of the peptide presumably re-arranges in a new
conformation to avoid conflict with the surface portion occupied by 5B. The peaks that are
restored clearly identify the region of the protein where 5B binds, displacing a portion of the
peptide
Figure 9: Superimposition of 15N HSQC spectra of holo-S100B (red) and holo-
S100B titrated with p53 peptide (blue) up to 1:2 molar ratios

41

42
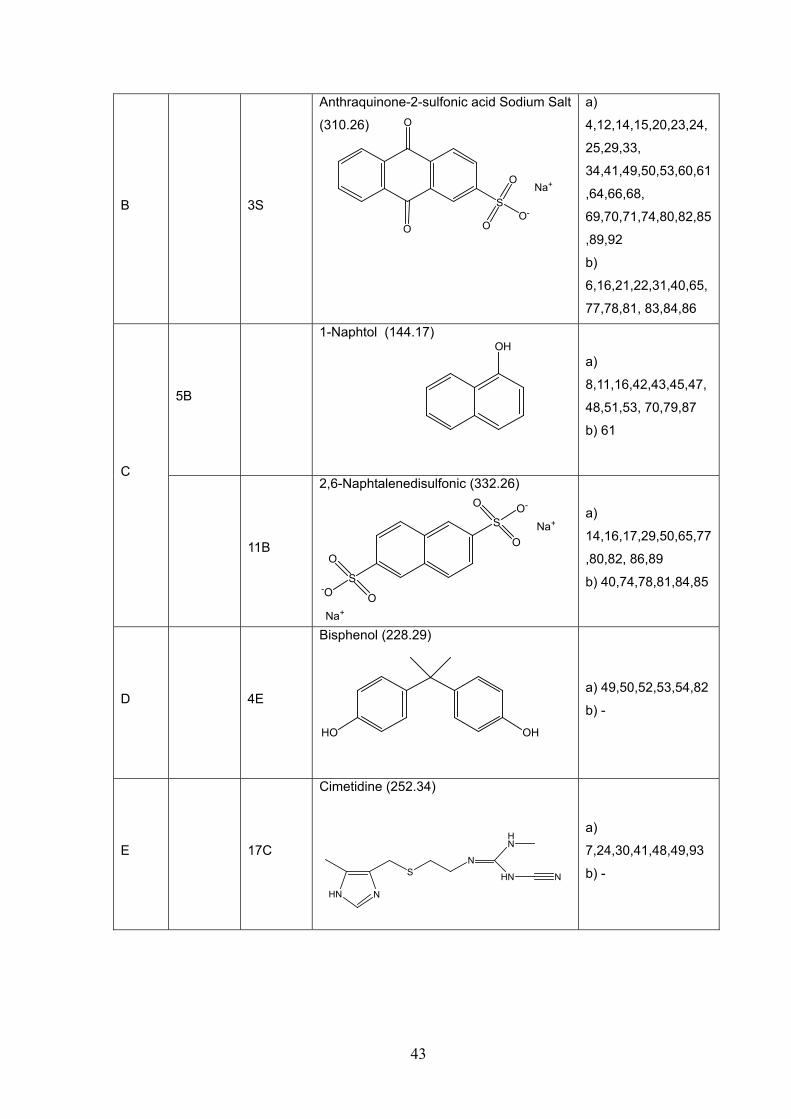
Table 3 – For each group the investigated Interacting fragments, showing non-negligible 15N-HSQC spectra perturbations, are reported. The areas of interaction with S100B and/or
S100A13 are also indicated.
Fragment interacting with protein
Group
S100B S100A13
Fragment formula (MW/Da)
Residues showing non-negligible chemical shift variation:
a) 0.03<∆δ<0.08 ppm
b) ∆δ>0.08 ppm
19L
4-Hydroxycoumarin (162.14)
a)
18,74,77,78,82,84,89
b) -
21B
Dicoumarin (336.29)
a)
18,20,21,22,25,31,72
,82,83
b) -
21M Warfarin
(308.33)
a)
6,11,18,20,22,71,73,
78,81,83,
84,86,89,93
b) 74,77,82
A
Cromolyn
Cromolyn (512.33)
a)
16,21,50,64,71,73,81
,86,92
b)
18,65,77,80,82,84,89
, O
OHOOC
O OOH
O
O COO H
O
OH
O
HO
OO
HO
O
O
O
HO
O
O
43
B 3S
Anthraquinone-2-sulfonic acid Sodium Salt
(310.26)
a)
4,12,14,15,20,23,24,
25,29,33,
34,41,49,50,53,60,61
,64,66,68,
69,70,71,74,80,82,85
,89,92
b)
6,16,21,22,31,40,65,
77,78,81, 83,84,86
5B
1-Naphtol (144.17)
a)
8,11,16,42,43,45,47,
48,51,53, 70,79,87
b) 61
C
11B
2,6-Naphtalenedisulfonic (332.26)
a)
14,16,17,29,50,65,77
,80,82, 86,89
b) 40,74,78,81,84,85
D 4E
Bisphenol (228.29)
a) 49,50,52,53,54,82
b) -
E 17C
Cimetidine (252.34)
a)
7,24,30,41,48,49,93
b) -
OHHO
O
O
SO-
O
O
Na+
S
S
O
O
O-
-O O
O
Na+
Na+
OH
NHN
SN
HN
HN N

44
F 13Y
(L)-Glutamic Acid (147.13) a)
4,7,8,11,12,14,18,25,
26,34,43,
48,50,83,86,87,89,92
b) 24
G 11L
3,5-Pyrazoledicarboxylic acid
monohydrate (174.11)
a)
6,7,9,11,12,14,18,22,
25,26,30,
34,37,39,41,43,49,50
,57,73,77,
81,83,86,87,89
b) 8,24,64,74,85
12Z
Benzotiophene (134.20) a)
7,8,11,12,14,18,24,2
5,30,34,
40,64,65,78,80,81,82
,84,89
b) - H
16G
(L)-Tryptophan-ethylester
(248.32) a)
10,18,42,44,47,74,79
,85
b) -
16V
(1R,2S)-(-)-N-methylephedrine (179.26)
a) 18,24,80,93
b) -
I
9A
2,3-dicarboxypyridine
(167.12) a) 2,6-
8,11,12,14,18,25,34,
43,49,
56,65,73,77,78,81,87
b) 24,38,74,85,89
HO OH
O O
NH2
HN N
OHHO
OO H2O
S
OO
NH
H2N H
N
OH
ON
HO
O
OH

45
J 17K
Furosemide (330.74)
a)
18,19,21,64,74,82,84
,86,89
b) -
K 19V
2-Aminobenzimidazole (133.15)
a) 4,5,10-
12,25,43,59,75,77,79
, 85-89
b) 9,82,84
L 2T
1,10-Phenantroline (180.20) a)
1,4,8,9,11,16,18,41-
43,54,55,
58,61,75,80,82,84,88
-90
b) -
M 20D
Julolidine
(173.25)
a) 42
b) -
N 20Y
Tritylamine (259.34)
a) 42
b) -
O 18Q
1,2-dihydro-4-hydroxy-1-methyl-2-
oxoquinoline-3-carbaldehyde (203.19)
a) 1,18,69,79
b) -
S
O
O
NH2HN
Cl
HO
O
O
N
HN
NH2
NN
N O
OH
O
N
NH2

46
P AC
(3R,9R)-3-((benzyloxy)methyl)-hexahydro-
6H-pyrido[1,2]pyrazine-1,4-dione (288.34) a) 8-
10,19,35,37,42,43,48
,62,71,
73,75,76,79,80,83-
85,87-91
b) 81
Q 20X
(1S)-(+)-Neomenthyl acetate (198.30)
a) 44
b) -
O
O
N
HN
O
O
O

47
Figure 11. A summary of the hits for S100A13 and S100B obtained in the present work as
compound with those obtainined on cytochrome c114 is reported. The relatively small hit
overlap for the various proteins can be appreciated.
48
1.5 Conclusion Two S100 proteins with a potential to become drug targets were screened via NMR with a
library of 430 fragments. The results of this study allowed us to identify three main binding
areas for S100A13 and two main binding areas for S100B. This result is somewhat
surprising, as small proteins usually display only one major binding site for small
molecules.115 Incidentally, none of the binding areas suggest binding of ligands to the
calcium ions. Although the two proteins have quite similar quaternary structure and a
common binding area (around the hinge loop), our results showed that they have only few
ligands in common, suggesting that selective leads could be developed starting from the
different ligands, with high LE values, here identified. These data also indicate that the
present library, although small, is well suited to make initial guesses about selectivity.
Essentially the same library had been used in a screening work on cytochrome c114. In that
case, the hits were fewer, and again the overlap with the present hits was very small. These
statistics are summarized in Figure 11. Coupling of the experimental data with docking
results indicated the most probable docked conformations of the ligands on the proteins
surface. The study on the anti-allergic drug cromolyn provided for the first time structural
information for the interaction, and demonstrated that cromolyn has a unique binding site on
the protein surface. Finally, competition experiments conducted with α-naphtol on the
S100B-p53 peptide complex showed that even if the ligands identified by the NMR
screening bind weakly on the protein surface, they are able to significantly interfere with the
interaction with other proteins or peptides. These results could be a starting point for the
development of new ligands which could have an important role in the protection of p53
from S100B-dependent down-regulation. S100 proteins in general are becoming targets of
pharmaceuticals interest because of their involvement in cellular functions. The present data
suggest that selective and high efficacy modulators of their activity are within reach of
current lead development strategies.

49
Reference List
1. Giedroc,D.P. & Arunkumar,A.I. Metal sensor proteins: nature's metalloregulated allosteric switches. Dalton Trans. 3107-3120 (2007).
2. Bezkorovainy,A. Biochemistry of nonheme iron in man. II. Absorption of iron. Clin. Physiol Biochem. 7, 53-69 (1989).
3. Bezkorovainy,A. Biochemistry of nonheme iron in man. I. Iron proteins and cellular iron metabolism. Clin. Physiol Biochem. 7, 1-17 (1989).
4. Burgoyne,R.D. & Weiss,J.L. The neuronal calcium sensor family of Ca2+-binding proteins. Biochem. J. 353, 1-12 (2001).
5. Hay,J.C. Calcium: a fundamental regulator of intracellular membrane fusion? EMBO Rep. 8, 236-240 (2007).
6. Andreini,C., Banci,L., Bertini,I. & Rosato,A. Zinc through the three domains of life. J. Proteome Res. 5, 3173-3178 (2006).
7. Andreini,C., Banci,L., Bertini,I. & Rosato,A. Occurrence of Copper Proteins through the Three Domains of Life: A Bioinformatic Approach. J. Proteome Res. (2007).
8. Hershfinkel,M., Silverman,W.F. & Sekler,I. The zinc sensing receptor, a link between zinc and cell signaling. Mol. Med. 13, 331-336 (2007).
9. Sekler,I., Sensi,S.L., Hershfinkel,M. & Silverman,W.F. Mechanism and regulation of cellular zinc transport. Mol. Med. 13, 337-343 (2007).
10. Ikura,M., Osawa,M. & Ames,J.B. The role of calcium-binding proteins in the control of transcription: structure to function. Bioessays 24, 625-636 (2002).
11. http://structbio.vanderbilt.edu/cabp_database
12. Shaw,G.S., Hodges,R.S. & Sykes,B.D. Probing the relationship between alpha-helix formation and calcium affinity in troponin C: 1H NMR studies of calcium binding to synthetic and variant site III helix-loop-helix peptides. Biochemistry 30, 8339-8347 (1991).
13. Marsden,B.J., Shaw,G.S. & Sykes,B.D. Calcium binding proteins. Elucidating the contributions to calcium affinity from an analysis of species variants and peptide fragments. Biochem. Cell Biol. 68, 587-601 (1990).
14. Ikura,M. Calcium binding and conformational response in EF-hand proteins. Trends Biochem. Sci. 21, 14-17 (1996).
15. Ikura,M., Hiraoki, T., Hikichi, K., Mikuni, T., Yazawa, M. & Yagi, K.. Nuclear magnetic resonance studies on calmodulin: calcium-induced conformational change. Biochemistry 22, 2573-2579 (1983).
16. Zhang,M., Tanaka,T. & Ikura,M. Calcium-induced conformational transition revealed

50
by the solution structure of apo calmodulin. Nat. Struct. Biol. 2, 758-767 (1995).
17. Ikura,M. & Hikichi,K. [Structure of Ca2(+)-binding proteins--X-ray and NMR]. Tanpakushitsu Kakusan Koso 33, 1994-2002 (1988).
18. Edwards,M.M. & Robinson,S.R. TNF alpha affects the expression of GFAP and S100B: implications for Alzheimer's disease. J. Neural Transm. 113, 1709-1715 (2006).
19. Netto,C.B., Portela, L. V., Ferreira, C. T., Kieling, C., Matte, U., Felix, T., da Silveira, T. R., Souza, D. O., Goncalves, C. A. & Giugliani, R.. Ontogenetic changes in serum S100B in Down syndrome patients. Clin. Biochem. 38, 433-435 (2005).
20. Portela,L.V., Tort, A. B., Walz, R., Bianchin, M., Trevisol-Bittencourt, P. C., Wille, P. R., Cardoso, R. C., Ishida, M. M., vonWangenheim, A., Grisard, E. C.. Interictal serum S100B levels in chronic neurocysticercosis and idiopathic epilepsy. Acta Neurol. Scand. 108, 424-427 (2003).
21. Bullock, S., Hayward, C., Manson, J., Brock, D.J.H., Raeburn, J.A. Quantitative immunoassays for diagnosis and carrier detection in cystic fibrosis (1982) Clin Genet 21, 336-341.
22. Hessian, P.A., Edgeworth, J., Hogg, N. MRP-8 and MRP-14, two abundant Ca2+-binding proteins of neutrophils and monocytes (1993) J Leuk Biol 53, 197-204
23. Kerkhoff,C., Klempt,M. & Sorg,C. Novel insights into structure and function of MRP8 (S100A8) and MRP14 (S100A9). Biochim. Biophys. Acta 1448, 200-211 (1998).
24. Lee,S.W., Tomasetto,C., Swisshelm,K., Keyomarsi,K. & Sager,R. Down-regulation of a member of the S100 gene family in mammary carcinoma cells and reexpression by azadeoxycytidine treatment. Proc. Natl. Acad. Sci. U. S A 89, 2504-2508 (1992).
25. Yang,Y.Q., Zhang, L. J., Dong, H., Jiang, C. L., Zhu, Z. G., Wu, J. X., Wu, Y. L., Han, J. S., Xiao, H. S., Gao, H. J., Zhang,Q.H.. Upregulated expression of S100A6 in human gastric cancer. J. Dig. Dis. 8, 186-193 (2007).
26. Arcuri,C., Bianchi,R., Brozzi,F. & Donato,R. S100B increases proliferation in PC12 neuronal cells and reduces their responsiveness to nerve growth factor via Akt activation. J. Biol. Chem. 280, 4402-4414 (2005).
27. Donato,R. S100: a multigenic family of calcium-modulated proteins of the EF-hand type with intracellular and extracellular functional roles. Int. J. Biochem. Cell Biol. 33, 637-668 (2001).
28. Donato,R. Intracellular and extracellular roles of S100 proteins. Microsc. Res. Tech. 60, 540-551 (2003).
29. Zimmer,D.B., Wright,S.P. & Weber,D.J. Molecular mechanisms of S100-target protein interactions. Microsc. Res. Tech. 60, 552-559 (2003).
30. Marshak,D.R. S100 beta as a neurotrophic factor. Prog. Brain Res. 86, 169-181 (1990).
51
31. Buchau,A.S., Hassan, M., Kukova, G., Lewerenz, V., Kellermann, S., Wurthner, J. U., Wolf, R., Walz, M., Gallo, R. L. & Ruzicka, T.. S100A15, an antimicrobial protein of the skin: regulation by E. coli through Toll-like receptor 4. J. Invest Dermatol. 127, 2596-2604 (2007).
32. Moore,B.W. A soluble protein characteristic of the nervous system. Biochem. Biophys. Res. Commun. 19, 739-744 (1965).
33. Hidaka, H., Endo, T., Kawamoto, S., Yamada, E., Umekawa, H., Tanabe, K., Hara, K. Purification and characterization of adipose tissue S-100b protein J Biol Chem 258, 2705-2709(1983).
34. Kretsinger,R.H. EF-hands reach out. Nat. Struct. Biol. 3, 12-15 (1996).
35. Kretsinger,R.H. & Nockolds,C.E. Carp muscle calcium-binding protein. II. Structure determination and general description. J. Biol. Chem. 248, 3313-3326 (1973).
36. Baudier,J., Glasser,N. & Gerard,D. Ions binding to S100 proteins. I. Calcium- and zinc-binding properties of bovine brain S100 alpha alpha, S100a (alpha beta), and S100b (beta beta) protein: Zn2+ regulates Ca2+ binding on S100b protein. J. Biol. Chem. 261, 8192-8203 (1986).
37. Otterbein,L.R., Kordowska,J., Witte-Hoffmann,C., Wang,C.L. & Dominguez,R. Crystal structures of S100A6 in the Ca(2+)-free and Ca(2+)-bound states: the calcium sensor mechanism of S100 proteins revealed at atomic resolution. Structure 10, 557-567 (2002).
38. Matsumura,H., Shiba,T., Inoue,T., Harada,S. & Kai,Y. A novel mode of target recognition suggested by the 2.0 A structure of holo S100B from bovine brain. Structure 6, 233-241 (1998).
39. Salama,I., Malone,P.S., Mihaimeed,F. & Jones,J.L. A review of the S100 proteins in cancer. Eur. J. Surg. Oncol. (2007).
40. Hoyaux,D., Boom, A., Van den, B. L., Belot, N., Martin, J. J., Heizmann, C. W., Kiss, R. & Pochet, R.. S100A6 overexpression within astrocytes associated with impaired axons from both ALS mouse model and human patients. J. Neuropathol. Exp. Neurol. 61, 736-744 (2002).
41. Hoyaux,D., Boom, A., Van den, B. L., Belot, N., Martin, J. J., Heizmann, C. W., Kiss, R. & Pochet, R.. S100A6, a calcium- and zinc-binding protein, is overexpressed in SOD1 mutant mice, a model for amyotrophic lateral sclerosis. Biochim. Biophys. Acta 1498, 264-272 (2000).
42. Broome,A.M., Ryan,D. & Eckert,R.L. S100 protein subcellular localization during epidermal differentiation and psoriasis. J. Histochem. Cytochem. 51, 675-685 (2003).
43. Gebhardt,C., Nemeth,J., Angel,P. & Hess,J. S100A8 and S100A9 in inflammation and cancer. Biochem. Pharmacol. 72, 1622-1631 (2006).
44. Foell,D., Wittkowski, H., Hammerschmidt, I., Wulffraat, N., Schmeling, H., Frosch, M., Horneff, G., Kuis, W., Sorg, C. & Roth, J.. Monitoring neutrophil activation in juvenile rheumatoid arthritis by S100A12 serum concentrations. Arthritis Rheum. 50,
52
1286-1295 (2004).
45. Wittkowski,H., Foell, D., af, K. E., De Rycke, L., De Keyser, F., Frosch, M., Ulfgren, A. K. & Roth, J.. Effects of intra-articular corticosteroids and anti-TNF therapy on neutrophil activation in rheumatoid arthritis. Ann. Rheum. Dis. 66, 1020-1025 (2007).
46. Leach,S.T., Yang, Z., Messina, I., Song, C., Geczy, C. L., Cunningham, A. M. & Day, A. S.. Serum and mucosal S100 proteins, calprotectin (S100A8/S100A9) and S100A12, are elevated at diagnosis in children with inflammatory bowel disease. Scand. J. Gastroenterol. 1-11 (2007).
47. de Jong,N.S., Leach,S.T. & Day,A.S. Fecal S100A12: a novel noninvasive marker in children with Crohn's disease. Inflamm. Bowel. Dis. 12, 566-572 (2006).
48. Baudier,J., Delphin,C., Grunwald,D., Khochbin,S. & Lawrence,J.J. Characterization of the tumor suppressor protein p53 as a protein kinase C substrate and a S100b-binding protein. Proc. Natl. Acad. Sci. U. S. A 89, 11627-11631 (1992).
49. Rustandi,R.R., Drohat,A.C., Baldisseri,D.M., Wilder,P.T. & Weber,D.J. The Ca(2+)-dependent interaction of S100B(beta beta) with a peptide derived from p53. Biochemistry 37, 1951-1960 (1998).
50. Wilder,P.T., Rustandi,R.R., Drohat,A.C. & Weber,D.J. S100B(betabeta) inhibits the protein kinase C-dependent phosphorylation of a peptide derived from p53 in a Ca2+-dependent manner. Protein Sci. 7, 794-798 (1998).
51. Wilder,P.T., Lin, J., Bair, C. L., Charpentier, T. H., Yang, D., Liriano, M., Varney, K. M., Lee, A., Oppenheim, A. B., Adhya, S., Carrier,F.; Weber,D.J.. Recognition of the tumor suppressor protein p53 and other protein targets by the calcium-binding protein S100B. Biochim. Biophys. Acta 1763, 1284-1297 (2006).
52. Yang,J.F., Zhang,X.Y. & Qi,F. [Expression of S100 protein in renal cell carcinoma and its relation with P53]. Zhong. Nan. Da. Xue. Xue. Bao. Yi. Xue. Ban. 29, 301-304 (2004).
53. Rustandi,R.R., Baldisseri,D.M., Drohat,A.C. & Weber,D.J. Structural changes in the C-terminus of Ca2+-bound rat S100B (beta beta) upon binding to a peptide derived from the C-terminal regulatory domain of p53. Protein Sci. 8, 1743-1751 (1999).
54. Rustandi,R.R., Baldisseri,D.M. & Weber,D.J. Structure of the negative regulatory domain of p53 bound to S100B(betabeta). Nat. Struct. Biol. 7, 570-574 (2000).
55. Marquardsen,T., Hofmann, M., Hollander, J. G., Loch, C. M., Kiihne, S. R., Engelke, F. & Siegal, G.. Development of a dual cell, flow-injection sample holder, and NMR probe for comparative ligand-binding studies. J. Magn Reson. 182, 55-65 (2006).
56. Vanwetswinkel,S., Heetebrij, R. J., van Duynhoven, J., Hollander, J. G., Filippov, D. V., Hajduk, P. J. & Siegal, G. TINS, target immobilized NMR screening: an efficient and sensitive method for ligand discovery. Chem. Biol. 12, 207-216 (2005).
57. Vazquez,J., Tautz, L., Ryan, J. J., Vuori, K., Mustelin, T. & Pellecchia, M.. Development of molecular probes for second-site screening and design of protein
53
tyrosine phosphatase inhibitors. J. Med. Chem. 50, 2137-2143 (2007).
58. Jahnke,W., Florsheimer, A., Blommers, M. J., Paris, C. G., Heim, J., Nalin, C. M. & Perez, L. B.. Second-site NMR screening and linker design. Curr. Top. Med. Chem. 3, 69-80 (2003).
59. Salvatella,X. & Giralt,E. NMR-based methods and strategies for drug discovery. Chem. Soc. Rev. 32, 365-372 (2003).
60. Widmer,H. & Jahnke,W. Protein NMR in biomedical research. Cell Mol. Life Sci. 61, 580-599 (2004).
61. Carr,R.A., Congreve,M., Murray,C.W. & Rees,D.C. Fragment-based lead discovery: leads by design. Drug Discov. Today 10, 987-992 (2005).
62. Schade & M. NMR fragment screening: Advantages and applications. IDrugs 9, 110-113 (2006).
63. Dalvit,C., Fagerness,P.E., Hadden,D.T., Sarver,R.W. & Stockman,B.J. Fluorine-NMR experiments for high-throughput screening: theoretical aspects, practical considerations, and range of applicability. J. Am. Chem. Soc. 125, 7696-7703 (2003).
64. Dalvit,C., Caronni,D., Mongelli,N., Veronesi,M. & Vulpetti,A. NMR-based quality control approach for the identification of false positives and false negatives in high throughput screening. Curr. Drug Discov. Technol. 3, 115-124 (2006).
65. McCoy,M.A., Senior,M.M. & Wyss,D.F. Screening of protein kinases by ATP-STD NMR spectroscopy. J. Am. Chem. Soc. 127, 7978-7979 (2005).
66. Streiff,J.H., Juranic, N. O., Macura, S. I., Warner, D. O., Jones, K. A. & Perkins, W. J.. Saturation transfer difference nuclear magnetic resonance spectroscopy as a method for screening proteins for anesthetic binding. Mol. Pharmacol. 66, 929-935 (2004).
67. Wang,Y.S., Liu,D. & Wyss,D.F. Competition STD NMR for the detection of high-affinity ligands and NMR-based screening. Magn Reson. Chem. 42, 485-489 (2004).
68. Vanwetswinkel,S., Heetebrij, R. J., van Duynhoven, J., Hollander, J. G., Filippov, D. V., Hajduk, P. J. & Siegal, G.. TINS, target immobilized NMR screening: an efficient and sensitive method for ligand discovery. Chem. Biol. 12, 207-216 (2005).
69. Dalvit,C., Fasolini, M., Flocco, M., Knapp, S., Pevarello, P. & Veronesi, M.. NMR-Based screening with competition water-ligand observed via gradient spectroscopy experiments: detection of high-affinity ligands. J. Med. Chem. 45, 2610-2614 (2002).
70. Dalvit,C., Fogliatto,G., Stewart,A., Veronesi,M. & Stockman,B. WaterLOGSY as a method for primary NMR screening: practical aspects and range of applicability. J. Biomol. NMR 21, 349-359 (2001).
71. Hajduk,P.J. SAR by NMR: putting the pieces together. Mol. Interv. 6, 266-272 (2006).
72. Shuker,S.B., Hajduk,P.J., Meadows,R.P. & Fesik,S.W. Discovering high-affinity

54
ligands for proteins: SAR by NMR. Science 274, 1531-1534 (1996).
73. Lin,M. & Shapiro,M.J. Mixture Analysis in Combinatorial Chemistry. Application of Diffusion-Resolved NMR Spectroscopy. J. Org. Chem. 61, 7617-7619 (1996).
74. Lucas,L.H., Yan,J., Larive,C.K., Zartler,E.R. & Shapiro,M.J. Transferred nuclear overhauser effect in nuclear magnetic resonance diffusion measurements of ligand-protein binding. Anal. Chem. 75, 627-634 (2003).
75. Yan,J., Kline,A.D., Mo,H., Zartler,E.R. & Shapiro,M.J. Epitope mapping of ligand-receptor interactions by diffusion NMR. J. Am. Chem. Soc. 124, 9984-9985 (2002).
76. Altieri,A.S., Hinton,D.P. & Byrd,R.A. Association of Biomolecular Systems Via Pulsed-Field Gradient Nmr Self-Diffusion Measurements. J. Am. Chem. Soc. 117, 7566-7567 (1995).
77. Hajduk,P.J., Olejniczak,E.T. & Fesik,S.W. One-dimensional relaxation- and diffusion-edited NMR methods for screening compounds that bind to macromolecules. Journal of the American Chemical Society 119, 12257-12261 (1997).
78. Pellecchia,M., Sem,D.S. & Wuthrich,K. NMR in drug discovery. Nat. Rev. Drug Discov. 1, 211-219 (2002).
79. Bohm,H.J. Ludi - Rule-Based Automatic Design of New Substituents for Enzyme-Inhibitor Leads. Journal of Computer-Aided Molecular Design 6, 593-606 (1992).
80. Bohm,H.J. The Computer-Program Ludi - A New Method for the Denovo Design of Enzyme-Inhibitors. Journal of Computer-Aided Molecular Design 6, 61-78 (1992).
81. Bohm,H.J. On the Use of Ludi to Search the Fine Chemicals Directory for Ligands of Proteins of Known 3-Dimensional Structure. Journal of Computer-Aided Molecular Design 8, 623-632 (1994).
82. Ewing,T.J.A. & Kuntz,I.D. Critical evaluation of search algorithms for automated molecular docking and database screening. Journal of Computational Chemistry 18, 1175-1189 (1997).
83. Ewing,T.J.A., Makino,S., Skillman,A.G. & Kuntz,I.D. DOCK 4.0: Search strategies for automated molecular docking of flexible molecule databases. Journal of Computer-Aided Molecular Design 15, 411-428 (2001).
84. Miranker,A. & Karplus,M. An automated method for dynamic ligand design. Proteins-Structure Function and Genetics 23, 472-490 (1995).
85. Glen,R.C. & Allen,S.C. Ligand-protein docking: Cancer research at the interface between biology and chemistry. Current Medicinal Chemistry 10, 763-777 (2003).
86. Osterberg,F., Morris,G.M., Sanner,M.F., Olson,A.J. & Goodsell,D.S. Automated docking to multiple target structures: incorporation of protein mobility and structural water heterogeneity in AutoDock. Proteins 46, 34-40 (2002).
87. Goodsell,D.S., Morris,G.M. & Olson,A.J. Automated docking of flexible ligands:

55
applications of AutoDock. J. Mol. Recognit. 9, 1-5 (1996).
88. Gohlke,H. & Klebe,G. Approaches to the description and prediction of the binding affinity of small-molecule ligands to macromolecular receptors. Angewandte Chemie-International Edition 41, 2645-2676 (2002).
89. Erickson,J.A., Jalaie,M., Robertson,D.H., Lewis,R.A. & Vieth,M. Lessons in molecular recognition: The effects of ligand and protein flexibility on molecular docking accuracy. Journal of Medicinal Chemistry 47, 45-55 (2004).
90. Carlson,H.A. Protein flexibility is an important component of structure-based drug discovery. Current Pharmaceutical Design 8, 1571-1578 (2002).
91. Carlson,H.A. Protein flexibility is an important component of structure-based drug discovery. Current Pharmaceutical Design 8, 1571-1578 (2002).
92. Carlson,H.A. & Meagher,K.L. Protein flexibility and drug design: How to hit a moving target. Abstracts of Papers of the American Chemical Society 225, U752 (2003).
93. Cuniasse,P., Devel, L., Makaritis, A., Beau, F., Georgiadis, D., Matziari, M., Yiotakis, A. & Dive, V.. Future challenges facing the development of specific active-site-directed synthetic inhibitors of MMPs. Biochimie 87, 393-402 (2005).
94. Johnson,S.L. & Pellecchia,M. Structure- and fragment-based approaches to protease inhibition. Curr. Top. Med. Chem. 6, 317-329 (2006).
95. Delphin,C., Ronjat, M., Deloulme, J. C., Garin, G., Debussche, L., Higashimoto, Y., Sakaguchi, K. & Baudier, J.. Calcium-dependent interaction of S100B with the C-terminal domain of the tumor suppressor p53. J. Biol. Chem. 274, 10539-10544 (1999).
96. Rustandi,R.R., Baldisseri,D.M., Drohat,A.C. & Weber,D.J. Structural changes in the C-terminus of Ca2+-bound rat S100B (beta beta) upon binding to a peptide derived from the C-terminal regulatory domain of p53. Protein Sci. 8, 1743-1751 (1999).
97. Fernandez-Fernandez,M.R., Veprintsev,D.B. & Fersht,A.R. Proteins of the S100 family regulate the oligomerization of p53 tumor suppressor. Proc. Natl. Acad. Sci. U. S. A 102, 4735-4740 (2005).
98. Lin,J., Blake, M., Tang, C., Zimmer, D., Rustandi, R. R., Weber, D. J. & Carrier, F., Inhibition of p53 transcriptional activity by the S100B calcium-binding protein. J. Biol. Chem. 276, 35037-35041 (2001).
99. Lin,J., Yang, Q., Yan, Z., Markowitz, J., Wilder, P. T., Carrier, F. & Weber, D. J.. Inhibiting S100B restores p53 levels in primary malignant melanoma cancer cells. J. Biol. Chem. 279, 34071-34077 (2004).
100. Scotto,C., Deloulme,J.C., Rousseau,D., Chambaz,E. & Baudier,J. Calcium and S100B regulation of p53-dependent cell growth arrest and apoptosis. Mol. Cell Biol. 18, 4272-4281 (1998).
101. Scotto,C., Delphin,C., Deloulme,J.C. & Baudier,J. Concerted regulation of wild-type

56
p53 nuclear accumulation and activation by S100B and calcium-dependent protein kinase C. Mol. Cell Biol. 19, 7168-7180 (1999).
102. Landriscina,M., Schinzari, G., Di Leonardo, G., Quirino, M., Cassano, A., D'Argento, E., Lauriola, L., Scerrati, M., Prudovsky, I. & Barone, C.. S100A13, a new marker of angiogenesis in human astrocytic gliomas. J. Neurooncol. 80, 251-259 (2006).
103. Rajalingam,D., Kumar, T. K., Soldi, R., Graziani, I., Prudovsky, I. & Yu, C.. Molecular mechanism of inhibition of nonclassical FGF-1 export. Biochemistry 44, 15472-15479 (2005).
104. Rajalingam,D., Graziani,I., Prudovsky,I., Yu,C. & Kumar,T.K. Relevance of partially structured states in the non-classical secretion of acidic fibroblast growth factor. Biochemistry 46, 9225-9238 (2007).
105. Prudovsky,I., Bagala, C., Tarantini, F., Mandinova, A., Soldi, R., Bellum, S. & Maciag, T.. The intracellular translocation of the components of the fibroblast growth factor 1 release complex precedes their assembly prior to export. J. Cell Biol. 158, 201-208 (2002).
106. Arnesano,F., Banci, L., Bertini, I., Fantoni, A., Tenori, L. & Viezzoli, M. S.. Structural interplay between calcium(II) and copper(II) binding to S100A13 protein. Angew. Chem. Int. Ed Engl. 44, 6341-6344 (2005).
107. Kilby,P.M., Van Eldik,L.J. & Roberts,G.C. Nuclear magnetic resonance assignments and secondary structure of bovine S100 beta protein. FEBS Lett. 363, 90-96 (1995).
108. Bhattacharya,S., Large,E., Heizmann,C.W., Hemmings,B. & Chazin,W.J. Structure of the Ca2+/S100B/NDR kinase peptide complex: insights into S100 target specificity and activation of the kinase. Biochemistry 42, 14416-14426 (2003).
109. Dalvit,C., Fogliatto,G., Stewart,A., Veronesi,M. & Stockman,B. WaterLOGSY as a method for primary NMR screening: practical aspects and range of applicability. J. Biomol. NMR 21, 349-359 (2001).
110. Grzesiek,S., Bax, A., Clore, G. M., Gronenborn, A. M., Hu, J. S., Kaufman, J., Palmer, I., Stahl, S. J. & Wingfield, P. T.. The solution structure of HIV-1 Nef reveals an unexpected fold and permits delineation of the binding surface for the SH3 domain of Hck tyrosine protein kinase. Nat. Struct. Biol. 3, 340-345 (1996).
111. Shishibori,T., Oyama, Y., Matsushita, O., Yamashita, K., Furuichi, H., Okabe, A., Maeta, H., Hata, Y. & Kobayashi, R.. Three distinct anti-allergic drugs, amlexanox, cromolyn and tranilast, bind to S100A12 and S100A13 of the S100 protein family. Biochem. J. 338 ( Pt 3), 583-589 (1999).
112. Oyama,Y., Shishibori, T., Yamashita, K., Naya, T., Nakagiri, S., Maeta, H. & Kobayashi, R.. Two distinct anti-allergic drugs, amlexanox and cromolyn, bind to the same kinds of calcium binding proteins, except calmodulin, in bovine lung extract. Biochem. Biophys. Res. Commun. 240, 341-347 (1997).
113. Hopkins,A.L., Groom,C.R. & Alex,A. Ligand efficiency: a useful metric for lead selection. Drug Discov. Today 9, 430-431 (2004).

57
114. Assfalg,M., Bertini,I., Del Conte,R., Giachetti,A. & Turano,P. Cytochrome c and organic molecules: solution structure of the p-aminophenol adduct. Biochemistry 46, 6232-6238 (2007).
115. Hajduk,P.J., Huth,J.R. & Tse,C. Predicting protein druggability. Drug Discov. Today 10, 1675-1682 (2005).

58
Chapter 2
Paramagnetic Shifts in Solid-State
NMR of Proteins to Elicit Structural
Information

59
2.1 Introduction Structural biology over the past decades has taken different directions and has
become one discipline available to biomedical research. It allows crucial insights in
understanding basic life processes such as protein-protein interactions1-4 signal
transduction5,6 function of enzymes7 and action modes of drugs8 The indispensable
prerequisite for understanding all this mechanisms is the structure of a protein involved.
Both X-ray and liquid-state NMR have made it possible to obtain three-dimensional
structural information at high resolution. Despite of their successful exploitation in
determining protein structures, both of these techniques have their limitations in structural
exploration of certain biomolecular systems which cannot be crystallised properly or be
obtained in soluble form, such as membrane proteins and amyloid fibrils. Solid-state NMR
(SSNMR) has emerged as a vital tool in Structural Biology. Recent studies have increased
interest in this technique based on its ability to determine protein structures in the solid-
phase9 and to permit the study of macroscopically disordered biomolecular systems such as
membrane proteins10,11 fibrils12-17 and macromolecular assemblies5-7. Despite of its several
advantages, the major limitations in the structural determination through SSNMR are due to
the difficulties in obtaining a large number of restraints to be used for structural
purposes18,19. As a consequence several strategies18,20,21 and experimental techniques18,22,23
have been developed. However, implementation of a systematic and strategically established
protocol for solid-state structure determination is still the largest challenge in this field. The
key difference of solid-state NMR with solution state is the presence of static or slow
tumbling of component molecules in the sample. Solution NMR methods rely on rapid
tumbling to average orientation-dependent dipolar and chemical shift interactions resulting
in narrow resonances. On the contrary, such interactions are not averaged in solid-state NMR
and thereby broad NMR resonances with low resolution and sensitivity are obtained. This in
turn hinders the feasibility of solid-state NMR studies of uniformly (13C, 15N) labeled protein
samples. This isotope labeling is a critical requirement for the applicability of NMR
techniques in order to allow sequence specific resonance assignment24,25 and to extract
structural restraints26-28. Hence, suitable methods for obtaining well-resolved solid-state
NMR spectra are of high importance. Magic angle spinning (MAS) at this point has been
successfully exploited both in terms of resolution and sensitivity of the spectra. Specific
labeling pattern9 could also be highly effective for gaining well resolved solid-state spectra.
These special labeling schemes offers several advantages: i) reducing the overlap in the
PDSD spectra at higher mixing time deleting the cross peaks of adjacent carbon atoms

60
(which does not provide any structural information), ii) reducing the “dipolar truncation”
effect making it possible to observe direct PDSD transfer up to 7Å, iii) improving the signal
resolution by suppression of the C-C scalar J-coupling. On these samples, the cross-peaks
observed in PDSD spectra at variable mixing time (up to 500 ms) allows one to establish
nuclear distance correspondence from 2 to 7 Å, which are precious for the structural
determination. These methods have been successfully applied for structure determination of
proteins in the size range of 5-10kDa25,29,30. Expanding these applications to larger or mass-
limited systems needs further improvements in spectral sensitivity and new strategies to
extract useful structural restraints. For this purpose, we have designed a simple and fast
strategy to extract useful paramagnetic based structural restraints in terms of pseudo contact
shifts (pcs) of 13C using a uniformly labeled sample. In this work we demonstrate a novel
strategy by using paramagnetic probe in solid-state sample for extracting useful structural
restraints for a larger system (17.5kDa protein).
2.2 Paramagnetic metalloproteins Paramagnetic metalloproteins are characterized by the
presence of unpaired electrons in the metal centre. An unpaired electron has a magnetic
moment 658 times larger than that of the proton and has a relaxation time varying from 10-
13-10-8 s mainly depending on the electronic configuration. Electron relaxation generates
stochastic magnetic fields. The electron magnetic moment can interact with the NMR
sensitive nucleus giving rise to the so called hyperfine shift, composed by a scalar term
called Fermi contact shift (δcon)31 and a dipolar term called pseudocontact shift (δpcs). The
paramagnetism caused by the unpaired electron has a strong effect on the nuclei close to the
metal centre, thereby resulting in extreme line broadening and very large hyperfine shifts.
The contact contribution arises from electron delocalisation through chemical bonds. As an
additional aspect, since the electron magnetic moment is endowed with sizeable anisotropy,
the dipolar coupling with the nuclear spin magnetic moment does not average to zero upon
rotation. This nonzero average of the dipolar coupling energy produces the pseudocontact
shift (δpcs). This dipolar interaction by the long-range electron-nuclear dipolar interaction is
directly related to the position of the observed nuclei with respect to the metal centre and the
orientation of the principal axes of the anisotropy of the magnetic susceptibility. The δpcs
values are given by Equation (1), where r is the distance between the observed nuclei and the
metal ion, and ∆χax and ∆χrh are the axial and rhombic anisotropy parameters of the
magnetic susceptibility tensor of the metal, as defined by

61
( )
−3
2
3
2 cos2sin2313cos
121
rθ∆χ+
rθ∆χ=δ rhax
pc ϕπ
equation 1
and θ and φ identify the polar coordinates of the nucleus in the frame of the electronic
magnetic susceptibility tensor. These pcs values can be of high importance. Several reports
have demonstrated a successful use of these pcs as structural constraints32-34. This led to
designing an optimised protocol41 for solution structure and to include these restraints in the
most popular software packages for solution structure determination such as
DYANA/CYANA35 and Xplore NIH36. However, by using only pcs from one metal, one
cannot get enough structural restraints to fold a protein35 structure otherwise, this becomes
possible when several sets of pcs coming from different metals on the same protein are
combined together,37 and using pcs together with other structural restraints as dihedral angles
(determined in solution NMR from chemical shift indices or J-coupling constants) or
distance restraints (for example from NOE measurements or H-bonds) In this case, pcs act as
additional structural restraints allowing to obtain a significant refinement of the NMR
protein structure especially as far as concern the determination of the metal position and the
region around metal are concerned.38
In addition to the contributions to the NMR shift the paramagnetic interaction also
affects the relaxation property of the observed nuclei, increasing both longitudinal and
transverse relaxation rates (paramagnetic relaxation enhancement, PRE). For metalloproteins
in solution, PRE originates from two mechanisms, the dipolar (equation 2) and Curie
relaxation (equation 3).
++
+++
++
−++
+
= 222222226
22220
2 16
)(16
13
)(14
)1(415
1
CS
C
CSI
C
CI
C
CSI
CC
BeIdip
rSSg
Rτω
ττωω
ττω
ττωω
ττ
µγπ
µ
Equation 2
In large metalloproteins and in sufficiently high magnetic field the Curie term becomes the
dominant one as it is proportional to molecular tumbling and molecular weight of the species
and also directly proportional to the square of B0 (magnetic field). The effect of R2curie causes
dramatic line broadening beyond detection. The Curie broadening equation can written as
equation 3

62
[ ]( )
++
+
== 2262
220
44220
22 1
34
3)1(
4511
RI
RR
BeICurie
Curie
rkTSSBg
TR
τωτ
τµγ
πµ
equation 3
where, µ0 is the permeability of a vacuum, ge is the electron Landè factor, µB is the Bohr magneton, is the
Boltzmann constant, kT is the absolute temperature, is the external magnetic field, Iγ is the nuclear
magnetogyric ratio, is the electron-spin angular momentum, τc is the rotational correlation time (in absence of
exchange), ωI is the nuclear Larmor frequency and r is the metal-nucleus distance
However this problem can be overcome and significant improvement can be achieved by
using sequences based on 13C detection instead of 1H detection experiments. As the γI of 13C
is 4 times smaller than 1H, hence the relaxation terms can be expected to be 16 times weaker.
Moreover, Curie relaxation mechanism is related to the rotational correlation time (τc) so this
contribution to line broadening is completely absent in the SS NMR as in solid phase
molecular tumbling is prevented. Thus observation of solid-state NMR signal strongly
benefit from the absence of Curie relaxation mechanism as well as any diamagnetic
relaxation mechanism related to τc...Furthermore it takes advantages from 13C detection
which in SS NMR offer a stronger resolution than 1H spectra.
These aforesaid perspectives particularly stimulated us to investigate paramagnetic
metalloproteins using solid-state NMR which has not been explored in biomolecules to date.
The aim was to develop a simple strategy to extract paramagnetic restraints and to
investigate the feasibility of those constraints in structural determination. In a recent paper
from our group the first observation of pseudocontact shifts (pcs) in the 13C solid state NMR
of a paramagnetic protein, i.e. cobalt(II)-substituted matrix metalloproteinase 12 (CoMMP-
12), was reported. The authors proposed pcs as additional structural restraints for SSNMR39
From the known X-ray structure 40 it was shown that the pcs observed for each of 246
different 13C nuclei are very well accounted for by a sum of contributions arising from the
intra-molecular cobalt(II) ion and from cobalt(II) ions belonging to neighboring molecules.
It was concluded that if it were possible to separate intra- from inter-molecular pcs, even for
cases where the structure was not available, intra-molecular pcs would constitute precious
restraints to obtain the protein structure in the solid state. On the other hand, inter-molecular
pcs could provide information on the relative arrangement of different protein molecules in
the crystal lattice. Addressing the latter point on microcrystalline samples of CoMMP-12, an
approach which could be dubbed “NMR crystallography”41,42 could also be relevant for non-
crystalline systems displaying one-dimensional order such as, for instance, protein fibrils.

63
In my work, I show a combined strategy of protein labelling and dilution of the paramagnetic
species43 which allows one to easily separate the pcs contribution originated by the protein
internal metal (intra-molecular pcs) from those due to the neighbouring proteins in the
crystal lattice (inter-molecular pcs). The inter-molecular pcs provide unique information on
the protein arrangement in the solid phase, fixing position and orientation of the
neighbouring proteins. The results are in good agreement with X-ray data. This sort of
“NMR crystallography” is uniquely based on the paramagnetic solid-state NMR data and can
be applied also to ordered non-crystalline systems such as fibrils, providing useful
information on their aggregation state. As a continuation, we have tried to extend this work
with the aim of determining the solid-state structure of ZnMMP12 protein using pcs as
structural restraints along with a limited number of experimentally achieved distance
restraints and torsion angle restraints. PCS can be obtained simply by comparing the
paramagnetic and diamagnetic assignment. Torsion angle restraints were calculated on the
basis of the diamagnetic chemical shifts of the heteronuclei N, Cα, C’, and Cβ by using the –
chemical Shift Index analysis (CSI44or TALOS45) program In particular pcs’s provides
hundreds of restraints, as potentially we have one restraints for every assigned nuclei. Their
impact in the structural calculation allowed us to strongly reduce the number of distance
restraints that must be used. We demonstrated in a simulated calculation, that only 21
distance restraints can be used to obtain a low resolution protein structure. In our strategy,
this limited number of distance restraints can be obtained experimentally as well. To obtain
these restraints a series of PDSD46 and CHHC47 spectra with varying mixing time acquired
and analysed. As only few distance restraints are required, we propose to determine them
from the spectra obtained on the uniformly labelled ZnMMP-12 sample referring to the more
resolved region of the spectra. These distance restraints were then used along with intra
molecular pcs and CSI calculated torsion angle constraints to get a fairly resolved low
resolution structure of the ZnMMP12 (RMSD 2.33Å w.r.t the X-ray secondary structure ).

64
2.3 Materials and Methods 2.3.1 Preparation of the microcrystalline diluted samples. The ZnMMP-12 protein was
expressed following the already published procedure40. The CoMMP-12 sample with the
strong NNGH inhibitor (NNGH = N-isobutyl-N-[4-methoxyphenylsulphonyl]glycyl
hydroxamic acid) was obtained by replacing the Zn2+ ion with Co2+ in the ZnMMP-12
protein following the procedure published elsewhere48 and using 1 mM Co2+ solution instead
of 0.3 mM.
The diluted CoMMP-12 sample was obtained by mixing a solution containing 15 mg of 13C-15N labeled CoMMP-12 with a solution containing 30 mg of unlabeled ZnMMP-12 protein
(45 mg overall). The amount of protein was chosen in order to obtain around 35-40 mg of
microcrystalline material. The diluted ZnMMP-12 sample was obtained by mixing a solution
containing 15 mg of 13C-15N labeled ZnMMP-12 with a solution containing 30 mg of
unlabeled CoMMP-12 (45 mg overall), in order to obtain around 35-40 mg of
microcrystalline material.
The two sample mixtures were crystallized with the sitting drop vapor diffusion method at
16 °C, using a micro-seeding tool, in a handmade crystallizer. Aliquots of 50 µl of 1.5 mM
protein solution (10 mM Tris/5 mM CaCl2/1 mM CoCl2/300 mM NaCl/3 mM NNGH,
pH=7.0) were mixed with 50 µl of reservoir buffer (0.1 M Tris·HCl/25% PEG 8000, pH=8.3)
and all equilibrated against 250 ml of reservoir buffer. The final protein concentration was 30
mg/ml. The first crystals appeared within 2 days, and continued to grow regularly up to 2.5-3
weeks. The microcrystals thus obtained were washed using 50 µl of a low-salt buffer (10
mM Tris·HCl/25% PEG 8000 pH=8) for 1 hour. Approximately 35-40 mg of these crystals
were transferred in a 50 µl ZrO2 HR MAS rotor, and sealed with the upper spacer in order to
maintain the amount of water constant.
2.3.2 Solid-State NMR spectroscopy. All the NMR spectra were recorded on a Bruker
Avance 700 wide bore instrument operating at 16.4 T (700 MHz 1H Larmor frequency, 176.0
MHz 13C Larmor frequency). A double/triple-channel 4mm CP-MAS probehead was used.
The spinning frequency of the ZrO2 HR MAS rotor was stabilized to ±2 Hz. Solid-state
chemical shifts are referred to DSS following the procedure reported in literature49. The
probe temperature was kept at a nominal temperature of 270 K, which ensures a sample
temperature around 280 K.
In double resonance CP experiments the 1H 90° pulse was set to 3.2 µs, and during cross-
polarization the 1H B1 was 64 kHz with a mixing time of 0.75 ms. A 100%/50% ramp was
applied on the carbon channel with a 100% power level of 74 kHz. Similar parameters were

65
also used for a standard proton-driven spin diffusion sequence (2D PDSD); the 13C 90° pulse
was 4.2 µs, and the mixing times were set to 60 ms for the fully labeled CoMMP-12, the
diluted CoMMP-12, and the diluted ZnMMP-12. The MAS frequency was varied from 8.5 to
11.5 kHz. The SPINAL-6450 decoupling at 72 kHz of power was used on proton for all the
samples, switching off the decoupling during the mixing time. The conditions used to
acquire the PDSD of the fully labeled ZnMMP-12 sample were reported before
The triple resonance 3D NCACX PDSD and 3D NCOCX PDSD experiments were acquired
on the full-labeled CoMMP-12 sample using the standard sequences. The 13C 90° pulse was
5.2 µs. The HN Hartmann-Hahn matching was optimized with a 1H 90° pulse of 3.1 µs, 35
kHz for the 15N B1 and a 100%/50% ramp on the 1H channel applied for 1.7 ms at 68 kHz.
The NC matching was optimized using the 15N B1 of 35 kHz and a Tangent Amplitude
Modulated ramp at 23.5 kHz on 13C. The NC matching was 6.25 ms long using a
simultaneous 1H CW decoupling of 108 kHz. SPINAL64 1H decoupling at 81 kHz was used
during the direct and indirect acquisition times. A weak 1H CW radio frequency optimized at
11 kHz (DARR) was used during the PDSD mixing time (45ms for NCACX and 60ms for
NCOCX). Both NCACX and NCOCX experiments were recorded at 11 kHz MAS
frequency, with 64 scans per experiment, 1228 direct points, 64 increments in the indirect 13C dimension and 20 increments in the indirect 15N dimension using the TPPI scheme for
both indirect dimensions.
Similar parameters were also used for a standard proton-driven spin diffusion sequence (2D
PDSD); the 13C 90° pulse was 3.5 µs, and the mixing times were varied from 5 to 120 ms.
The MAS frequency was varied from 8.5 to 11.5 kHz. The SPINAL-6450 decoupling at 83
kHz of power was used on proton, switching off the decoupling during the mixing time. All
the experiments were acquired with 32 scans per experiment, with 1024 direct points, and
704 experiments in the State-TPPI scheme.
The CHHC experiments were acquired using the sequence reported in literature,47 1H 90°
pulse was set to 2.4 µs, and 13C 90° pulse was set to 3.9 µs. During HC and CH CP 88 kHz
on 1H and 70 kHz spin-lock power 13C were used using 50-100 ramp on 1H. In the first (non-
selective) CP was 550 µs long were the single CH and CH selective CP transfer were 70 µs
long each. 4ms were used during the z-filter block and the mixing time was varied from 60
to 300 µs. The SPINAL-6450 decoupling at 93 kHz of power was used on proton during both
direct and indirect evolution periods. The 2D experiment was acquired using the States-TPPI
scheme, using 192 scans for experiment, 12 ms of direct acquisition time and 6 ms of
indirect acquisition time.

66
2D PDSD spectra were processed using zero-filling up to 4096 points in the direct
dimension and 2048 points in the indirect dimensions, and using Gaussian and square cosine
filters for the direct and indirect dimensions, respectively.
2.3.3 Assignment Procedure. Up to 401 13C shifts of microcrystalline fully labeled
CoMMP-12 could be directly assigned from the 2D PDSD by comparing with the available
assignment of the diamagnetic ZnMMP-12, by checking the correspondence of the residue
spin-patterns and using a sequential procedure based on the 3D NCACX and NCOCX
experiments [as reported in ref 39]
Up to 318 13C shifts of microcrystalline diluted CoMMP-12 PDSD spectrum were assigned
for comparison with the fully labeled CoMMP-12 assignment. Differences between the
diluted and fully labeled CoMMP-12 were assigned following the correspondences in the
PDSD spin-pattern of each residue, and further confirmed by comparison with the 13C
solution assignment of CoMMP-12. The weaker peaks due to the protein molecules still
affected by inter-molecular pcs were recognized and distinguished from the intra-molecular
pcs peaks by comparison with the fully labeled CoMMP-12 assignment.
Up to 231 13C shifts of microcrystalline diluted ZnMMP-12 PDSD spectrum were assigned
for comparison with the fully labeled ZnMMP-12 and following the correspondences in the
PDSD spin-pattern of each residue; finally the assignment was checked by comparison with
the inter-molecular pcs obtained as differences between the assignments of the fully labeled
CoMMP-12 and the diluted CoMMP-12 samples. The weaker peaks due to protein
molecules not affected by inter-molecular pcs were recognized and distinguished by
comparison with the diamagnetic assignment in the fully labeled ZnMMP-12.
Up to 91 cross peak assignment was done using CHHC spectra and 107 cross peak
assignment was done using different PDSD spectra recorded with different mixing time.
Both CHHC and PDSD spectra becomes more crowded with increasing mixing time which
in turn increases the probability of ambiguous assignment. In order to avoid this spectra
acquired at lower mixing time was used.
2.3.4 Analysis of the inter-molecular pcs. The pseudocontact shifts ( pcδ ) can be calculated
in solution from equation 1 (see main text). We assumed equation 1 can be applied to predict
the solid-state isotropic resonance in rotating paramagnetic solids. The magnetic
susceptibility tensor was fit through the program PARASOL developed within this work in
Mathematica language51 on the basis of the available 13C pseudocontact shifts in the diluted
CoMMP-12 sample (∆χax = (10.3 ± 0.7) 10−32 m3; ∆χrh = (−2.1 ± 0.3) 10−32 m3). These

67
tensor parameters are in perfect agreement with those measured on the solution pcs and
previously published39
The calculations to address the position and the tensor orientations of the neighboring metals
were performed using the PARASOL program, in this case, eq. 2 was used to calculate pcs
originated by more than one metal. PARASOL is able to use several minimization routines
(Levenberg-Marquardt algorithm, Gauss-Newton algorithm, conjugate gradients algorithm),
the best results were obtained with the Levenberg-Marquardt algorithm and using a
repetitive procedure that starts from different initial guesses. In particular the initial positions
of the external metals are crucial for the quality of the final minimum. For such reason
several initial guesses were automatically generated setting up the x, y, and z coordinates of
the external metals in turn to the values 20, 0 and –20 Å. When the fit was used to fix two
neighbor proteins, up to 36 (729) different starting conditions were generated, sampling a
volume of about 216,000 Å3 within a radius of 40-35 Å from the central protein. The final
minima were chosen among those having the smaller RMSD values
(( )∑
=
−m
i
calcpci
exppci
mδδ
=RMSD1
2)()(
, where the sum run over the m experimental values).
Running the calculation on the total pcs, around 30% of the initial guesses generated good
minima.
The calculations performed on the inter-molecular pcs were conduced in an analogous way,
but excluding the intra-molecular term from equation 2.
The arrangement of the external proteins, as shown in Figure 6, was done on the basis of the
calculated metal position and tensor orientation of the two neighboring proteins. This was
done aligning the principal axes of the internal tensor of each protein to those one calculated
for the external metal. An ambiguity results as two tensor orientations with opposite
orientation of the z axis responds equally well to the experimental pcs. This was solved
excluding the orientations where the external proteins have a large overlap with the internal
one.
2.3.5 Calculation of MMP-12 structure with intra-molecular pcs. The MMP-12 structure
reported in Figure 7 & 10, were calculated using PARAMAGNETICCYANA 52 a derived version

68
of CYANA53 powered to handle paramagnetic restraints. As structural restraints were used:
318 experimental intra-molecular SS NM pcs (tolerance 0.4 ppm), 155 angle restraints
obtained from CSI calculation and 152 angle restraints using TALOS on the SSNMR shifts
of Cα, C’, Cβ nuclei of the fully labeled ZnMMP-12, 21 simulated distance restraints. The
angle constraints were imposed only on the backbone angle ϕ and ψ, with –150 < ϕ <–90
and 100 < ψ <180 for β-sheet, and –80 < ϕ <30 and –70 < ψ <–20 for α-helix. Paramagnetic
tensor parameters ∆χax and ∆χrh were imposed to their typical values (∆χax = 7 10−32 m3;
∆χrh = –2.4 10−32 m3). Simulated distance restraints were determined from the ZnMMP-12
X-ray structure40 randomly choosing distances around 6 Å and adding 1.5 Å of tolerance. Up
to 2000 simulated annealing minimizations were started, collecting a family with the 20
structures with smaller target function. The reported Figures 7, figure 10 and the structural
analysis were done using the MOLMOL program.54

69
2.4 Results and Discussion 2.4.1 Paramagnetic Dilution Strategy. To separate the intra- and inter-molecular pcs
contributions without previous knowledge of the protein structure, we propose the
preparation of two samples with two different combinations of protein labeling and dilution
of the paramagnetic species. In the first scheme (diluted CoMMP-12), 13C,15N-enriched2-
enriched CoMMP-12 (paramagnetic species) is diluted with unlabeled ZnMMP-12 (native
diamagnetic protein). By crystallizing this mixture in the same conditions previously used
for the uniformly labeled samples (ZnMMP-12 or CoMMP-12)52,55 we obtained a sample
where each 13C-labeled paramagnetic protein molecule is – on average –surrounded by
unlabeled diamagnetic protein molecules. As the 13C-labeled molecules are the sole species
observable in 13C-13C correlation NMR experiments, we can selectively observe the
paramagnetic species, which is affected only by the intra-molecular pcs. The cleanest effects
are of course expected for very high dilutions of the labeled species, which would however
produce too small signal-to-noise ratios. In practice, a reasonable compromise should be
found between sensitivity and the increased probability that two paramagnetic protein
molecules crystallize adjacent to one another, giving rise to peaks further shifted by inter-
molecular effects. Although the best dilution ratio should be determined for each sample on
the basis of the nature of the sample and of the actual sensitivity (which depends on several
parameters like amount of sample, probe sensitivity, magnetic field used, etc.) we
demonstrate in our case that the separation among intra- and inter-molecular pcs is
affordable using only a factor three dilution, i.e. crystallizing a mixture of 30% 13C, 15N-
enriched CoMMP-12 with 70% unlabeled ZnMMP-12. In such a condition, the intensity of
the peaks experiencing only intra-molecular pcs, and of those peaks that are still affected by
both intra- and inter-molecular pcs, can be easily predicted as a function of the dilution ratio.
Figure 1A shows that using a 30% dilution ratio, the intensity of the peaks affected only by
intra-molecular pcs (green curve) is sizably higher than those of the peaks affected by both
contributions (red curve). By using in total 40-45 mg of diluted sample, which is about three
times more sample than that used in the fully labeled CoMMP-12 sample,3 we can normalize
the plot in Figure 1 in order to have intensity 3.0 for a dilution ratio of 100% (non-diluted
sample) and an intensity around 0.7 for a 30% dilution ratio.4 This means that, with this
2 A standard doubly labeled sample was used throughout this work, although 15N pcs were not used. 3 We used 13-15 mg of fully labeled CoMMP-12 in a 4 mm probe, acquiring spectra at 16.4 T (700 MHz of
proton Larmor frequency). 4 The curves reported in Figure 1A-B were calculated considering that 13C nuclei are affected by only one

70
dilution ratio, the intensity of the peaks experiencing purely intra-molecular pcs is around
70% of that observed in the fully labeled CoMMP-12 sample, allowing us to record spectra
of similar quality within 2-4 days of acquisition time. Some weak peaks, corresponding to
the fraction of molecules still experiencing inter-molecular pcs, are observed, but in fact they
can be easily distinguished and discarded in view of the weak intensity and because they
have the same shift observed in the fully labeled CoMMP-12 sample.
The second scheme (figure 1B) here proposed is based on the “inverse dilution”: we
crystallized a mixture in which 13C,15N-enriched ZnMMP-12 (diamagnetic) is diluted with
unlabeled CoMMP-12 (paramagnetic). As we can observe only the labeled species, in this
sample intra-molecular pcs are
absent and only inter-molecular pcs are observed. Appling here the same calculation
described above (Figure 1B), we prepared a diluted sample by using 30% 13C,15N-enriched
ZnMMP-12 with 70% unlabeled CoMMP-12, and we were able to distinguish the peaks
affected by inter-molecular pcs from those corresponding to the pure diamagnetic species.
Even in this sample the limited dilution allows one to observe some residual peaks
corresponding to molecules that are not surrounded by CoMMP-12. These peaks can be
easily recognized and discarded as they have the same shift of the diamagnetic fully labeled
neighboring protein at time. Under such a condition, the green curves can be calculated by the equation 3x(1-x)
(where x is the dilution ratio), and the red and blue curves are calculated by the equation 3x2.
Fig 1A: The relative intensities expected for the signalsof nuclei experiencing both intra- and inter-molecularpcs (red line) and only intra-molecular pcs (green line)in diluted CoMMP-12 sample
Fig 1B: The relative intensities expected for the signalsof nuclei experiencing no pcs (blue line) and only inter-molecular pcs (green line) in diluted ZnMMP-12 sample.

71
ZnMMP-12.5
2.4.2 Solid-state NMR spectra. The 13C-13C PDSD spectra obtained with the two dilution
schemes (diluted CoMMP-12 and diluted ZnMMP-12 samples)52,55 were recorded, assigned
and compared with those of fully-enriched CoMMP-12 and ZnMMP-12 respectively (see
details in Materials and Methods). Representative portions of these spectra are shown in
Figure 2, to illustrate the clear separation of the observed pcs into their intra- and inter-
molecular components. It can be appreciated that for some residues, such as Val217, the
observed pcs are essentially due to the intra-molecular term, so we observed the same shift
in the fully labeled CoMMP-12 and diluted CoMMP-12 samples (Figure 2A). Likewise, we
also observe that the shifts of Val217 in the diluted ZnMMP-12 sample, where no intra-
molecular pcs are present, are identical to those of the pure diamagnetic protein (Figure 2C).
Conversely, for the residues experiencing inter-molecular pcs, such as Thr154, this
additional interaction is responsible for the differences between the fully labeled CoMMP-12
and the diluted CoMMP-12 sample (Figure 2B), or between the fully labeled ZnMMP-12
and the diluted ZnMMP-12 sample (Figure 2D).
5 Paramagnetic spectra are generally less intense than analogous diamagnetic ones. This can be noted for
example in the diluted ZnMMP-12 sample, where some peaks experiencing sizable inter-molecular pcs are
even weaker than the residual diamagnetic peaks, even if the latter are much less abundant.
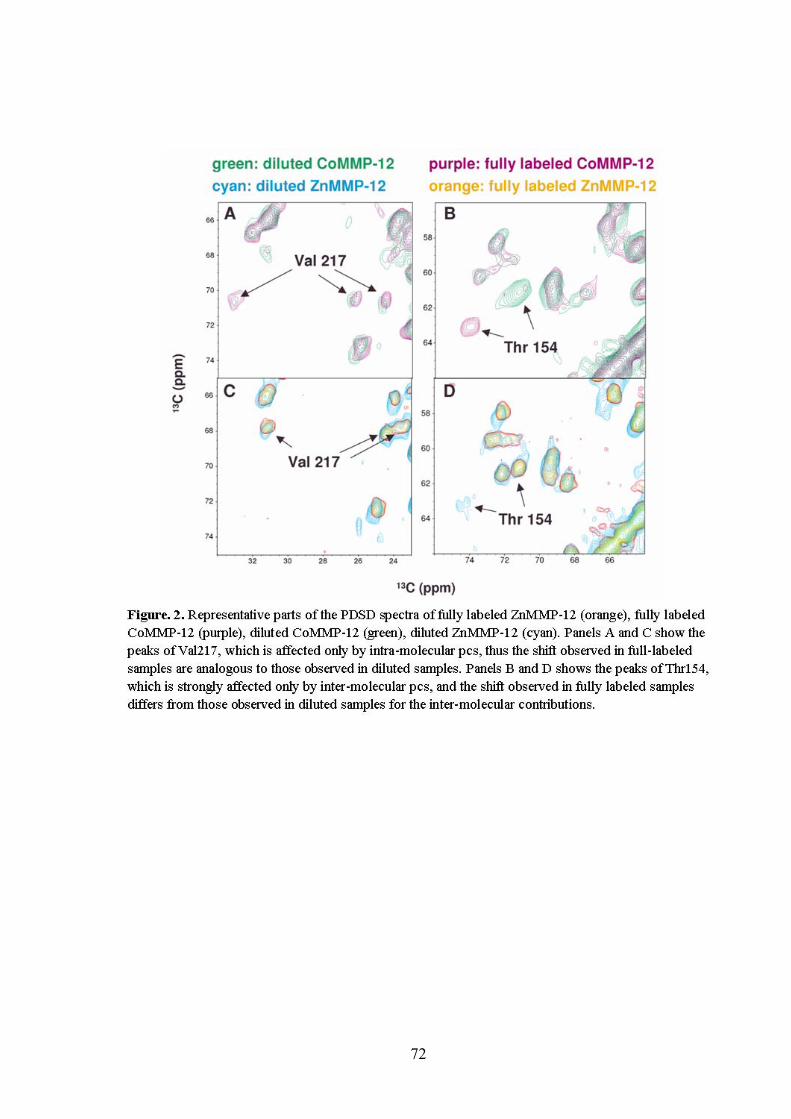
72

73
Table 1 summarizes the number of meaningful pcs that could be collected from each
spectrum.
Table 1. Number of assigned pcs for each sample studied.
Sample Number of pcs
CoMMP-12 401
Labeled CoMMP-12 diluted
with unlabeled ZnMMP-12 318
Labeled ZnMMP-12 diluted
with unlabeled CoMMP-12 231
The complete sets of pcs values are reported as Table 4 Compared to the previous report52,
the number of assigned pcs in the present fully-enriched CoMMP-12 sample could be nearly
doubled (401 vs 246) by a careful analysis of the 3D NCOCX and NCACX spectra (see
details in Materials and Methods). Even the two diluted samples (labeled CoMMP-12 and
labeled ZnMMP-12) provided a relatively large number of pcs (318 and 231, respectively),
the smaller number for the inter-molecular pcs arising from the fact that relatively fewer
protein nuclei are exposed to non-negligible paramagnetic effects from the neighboring
molecules.
The intra-molecular pcs measured in the diluted CoMMP-12 sample are in excellent
agreement with the pcs measured in solution (see Figure 4), as in both cases they depend
only on the internal metal, and can be calculated from eq. 1 where axχ∆ and rhχ∆ are the
axial and rhombic components of the magnetic susceptibility tensor anisotropy ( χ ), r is the
metal-nucleus distance, and θ and ϕ are, respectively, the polar and azimuthal angles
describing the orientation of the metal-nucleus vector with respect to the principal axes of
the χ tensor. ( )
−3
2
3
2 cos2sin2313cos
121
rθ∆χ+
rθ∆χ=δ rhax
pc ϕπ
eq. 1
Thus they can be used to determine the five parameters characterizing the magnetic
susceptibility tensor of the cobalt(II) ion in MMP-12 (two anisotropy parameters ∆χax and

74
∆χrh and the three Euler angles for the orientation of the principal axes of the tensor in the
molecular frame, see eq. 1) on the basis of the known crystal structure40 PDB code 1RMZ).
PCS all
-6.00
-4.00
-2.00
0.00
2.00
4.00
6.00
0 50 100 150 200
13 C nuclei
Pcs (ppm)
observed all
calculated all
PCS intra
-6.00
-4.00
-2.00
0.00
2.00
4.00
6.00
0 50 100 150 200
13 C nuclei
Pcs (ppm)
observed intracalculated intra
PCS inter
-6.00
-4.00
-2.00
0.00
2.00
4.00
6.00
0 50 100 150 200
13 C nuclei
Pcs (ppm)
observed inter
calculated inter
A
C
B
Fig. 3. 13C pcs observed (blue lines) for (A) a microcrystalline fully labeled CoMMP-12, (B)
a microcrystalline diluted CoMMP-12, and (C) a microcrystalline diluted ZnMMP-12. The
green lines are calculated (A) as the sum of contributions from the internal and two nearest
neighbor cobalt(II) ions, (B) from the internal cobalt(II) ion only, and (C) as the
contributions from the two nearest neighbor cobalt(II) ions only.

75
-4
-2
0
2
4
6
-4 -2 0 2 4 6
Solution pcs vs SSNMR pcs
Solu
tion
pcs
(ppm
)
SSNMR pcs (ppm)
RMSD = 0.13 ppm
Figure 4. Comparison among the experimental liquid-state pcs and intra-molecular SSNMR
pcs for CoMMP-12. The comparison have been extended over the 246 available solution
pcs39
The total pcs (sum of the intra- and the inter-molecular pcs), the intra- and the inter-
molecular pcs values, plotted in sequential order, are shown in Figure 3A-C (blue lines),
together with the calculated values (green lines).6 The latter were obtained using the tensor
parameters determined above and fixing the position of the metals in the crystal lattice and
the orientation of the tensors in the neighboring proteins on the basis of the crystallographic
symmetry group of the X-ray structure. For the total pcs (Figure 3A) the contributions from
the internal metal and from all the external metals within a radius of 80 Å were summed up,
while for the intra-molecular pcs (Figure 3B), and the inter-molecular pcs (Figure 3C) only
the contributions of the internal metal and of the external metals, respectively, were
considered. The agreement between calculated and experimental values (see also Figure 5) is
good in all three cases. For the total pcs the RMSD between calculated and experimental
values is 0.19 ppm, which represents a reasonable limit, as it is of the order of the
experimental error in the measured pcs (ca. 0.2 ppm). This indicates that the calculated
values agree with the experimental ones within the error limits, and any further refinement is
meaningless.
6 For the sake of clarity only the 231 values which are common in the spectra of the three samples (full-labeled
CoMMP-12, diluted CoMMP-12 and diluted ZnMMP-12) are reported in the plot.

76
Figure 5. Comparison among the calculated and experimental total pcs (A), intra-molecular
pcs (B) inter-molecular pcs (C). The RMSDs were calculated over 401 pcs for total pcs, 318
values for intra-molecular pcs , and 231 values for inter-molecular pcs,
In conclusion, using diluted samples two high quality sets of intra- and inter-molecular pcs
values can be made experimentally available, thus allowing the potential use of the former
for structural determination (as routinely done in solution), and of the latter for “NMR
crystallography” purposes.
Pcs are long-distance restraints: in the present case pseudocontact shifts up to 20-22 Å from
the metal could be measured. On the other side, the limits posed by shift anisotropy43 or by
insufficient decoupling56,57 makes the nuclei closer than 9-10 Å from the metal
unobservable; the perspective of investigating samples at higher MAS frequency suggests
that this lower limit could be reduced58, but this aspect deserve further investigations.
-6
-4
-2
0
2
4
6
-6 -4 -2 0 2 4 6
Calculated vs Observed total pcs
calc
ulat
ed p
cs (p
pm)
observed pcs (ppm)
RMSD = 0.19 ppm
A-6
-4
-2
0
2
4
6
-6 -4 -2 0 2 4 6
Calculated vs observed intra-molecular pcs
calc
ulat
ed in
tra p
cs (p
pm)
observed intra pcs (ppm)
RMSD = 0.19 ppm
B
-6
-4
-2
0
2
4
6
-6 -4 -2 0 2 4 6
Calculated vs observed inter-molecular pcs
calc
ulat
ed in
ter p
cs (p
pm)
observed inter pcs (ppm)
RMSD = 0.12 ppm
C

77
2.4.3 Use of the inter-molecular pcs for structural information on the neighboring
molecules. In this section we address the question of whether the inter-molecular pcs are of
good enough quality to actually allow us to obtain meaningful and quantitative information
on the location and orientation of the neighboring protein molecules, given that the single
protein structure is known. Since the pcs contributions of each metal are additive, the total
pcs, observed in the fully labeled CoMMP12-sample can be described by eq. 3
( )
( )∑
−
+
−=+
nn
nnrh
n
nax
rhaxpc
interpc
intrapc
total
rθ∆χ+
rθ∆χ
rθ∆χ+
rθ∆χδδ=δ
3
2
3
2
31
112
31
12
cos2sin2313cos
121
cos2sin2313cos
121
ϕπ
ϕπ
eq.3
where the sum runs over all the n neighboring metal which give a non-negligible
contribution to pcs, r1 and rn are the distance of the observed nucleus from the internal and
the nth metal, respectively, θ1, ϕ1, and θn, ϕn are the polar and azimuthally angles describing
the position of the observed nucleus with respect to the principal axes of the χ tensor
relative to the internal and the nth metal, respectively. The paramagnetic tensor parameters
∆χax and ∆χrh and the orientation of the principal axes of the χ tensor within the protein
frame are the same for any metal. On these bases, starting from the structure of a single
protein, one can optimize the position of the internal and external metals and the orientation
of the principal axes of their χ tensors in order to minimize the RMSD among the
experimental total pcs and the values calculated through eq. 3. By doing so, the position and
orientation of the neighboring molecules is also determined.
While locating a single metal ion in a given structure and determining the parameters of its
magnetic susceptibility anisotropy tensor requires an eight-parameter fit (i.e. (∆χax, ∆χrh, the
coordinates x, y and z of the metal and the three Euler’s angles defining the orientation of the
principal axes of the χ tensor), increasing the number of metals beyond one requires six
additional parameters each time (∆χax and ∆χrh being the same for all metals), i.e. 8
parameters for one metal, 14 for two, 20 for three metals, etc. In addition, while one can
exploit hundreds of intra-molecular pcs, with both positive and negative signs, to locate the
internal metal ion, only a few tens of meaningful inter-molecular pcs are available, most of
which of the same sign, to locate one of the neighboring metals. In fact, only one edge of a
protein molecule is exposed to the magnetic susceptibility of a neighboring protein.
In order to fit the position and the magnetic parameters of each metal from the experimental

78
pcs, we developed a computer program, called PARASOL (PARamagnetic Analysis in
SOLids)7 able to perform a least-square non-linear fit, and to repeat the minimization for
many automatically generated initial guesses (see Materials and methods). As final
optimized parameters we chose those giving the minimal RMSD.
In the best fitting of the intra-molecular pcs (8 parameter fit) the internal metal could be
placed in a position that is only 0.30 Å away from the crystallographic position, with an
RMSD of 0.19 ppm. This is a remarkable result, as an indetermination of less than 0.5 Å is
of the order of the average backbone RMSD for the best NMR structures in solution.
Once the position and the magnetic parameters of the internal metal are determined from the
intra-molecular pcs, we fitted the total pcs in order to establish the maximum number of
external metals that can be safely determined. Thus the total pcs were fitted with eq. 2 using
first only the internal metal and no external metals, and then adding one, two and three
external metals. The RMSD thus obtained were 0.87, 0.51, 0.19, and 0.17 ppm, respectively.
By passing from none to one and from one to two external metals the RMSD decreases
significantly, while when a third external metal is used the effect is much less important.
Furthermore, as already pointed out, RMSD below 0.2 ppm are of the order of the
experimental error in the pcs. Finally, the RMSD obtained in the fit with two or more
external metals is comparable with the RMSD when the total pcs are calculated from the
crystallographic positions: therefore, both values reach the limit posed by the pcs
experimental error, and any further improvement is meaningless; it results that in this case
only two neighboring protein molecules can be safely placed.
The best-fit with two neighboring metals yielded the metal position of the neighboring
proteins at 2.1 and 3.0 Å from the X-ray crystallographic positions for the molecule 1 and 2
in Figure 6, respectively.
On the bases of the fitted orientation of the principal axes of χ also the orientation of the
two neighboring protein molecules were determined (see details in Material and Methods).
In Figure 6 we compare the orientation of the neighbors determined by the SS NMR pcs
(red) with the X-ray crystallographic positions (blue). It can be seen, even the protein
arrangements are in reasonably good agreement with the crystallographic positions.
7 Parasol is written by Dr. Moreno Lelli and will be available soon at http://www.postgenomicnmr.net

79
It should be stressed that only the SSNMR paramagnetic restraints have been used in this
calculation, ignoring any symmetry elements present in the crystalline state. We may
anticipate that this method applies as such for one-dimensional ordered non-crystalline
materials such as fibrils.
2.4.4 Applicability of the intra-molecular pcs for structural determination. To
demonstrate the affordability of the structural determination supported by pcs, we performed
structural calculations in which a variable number of simulated distance restraints are used
together with experimental intra-molecular pcs and experimental angle restraints derived
from Chemical Shift Index (CSI)44. With these calculations we aimed at showing how using
a large number of easily determinable structural restraints (such as 318 experimental intra-
molecular pcs and 155 angle restraints obtained from CSI analysis) can be used to strongly
reduce the number of distance restraints needed to achieve a structure. In Figure 7 we show
that a very small number of randomly chosen simulated distance restraints (21 distance
restraints, less than 1 distance restraint over 7 AA!) reported in table 2, together with the
above indicated experimental restrains and using standard values for the paramagnetic tensor
parameters ∆χax and ∆χrh 59(eq. 1) are enough to define the overall protein fold and to define
some secondary structural elements with a total RMSD of 4.45 Å (3.12 Å on the secondary
structure elements) (Figure 7C ). The impact of the pcs restraints is apparent when the same

80
calculation is performed without pcs, and only a fairly unclear structure with RMSD of 9.64
Å, with 7.30 Å on the secondary structure elements is obtained (Figure 7B). Such
calculations show that some distance restraints are always needed, otherwise pcs alone
hardly converge to a correct folding.35,60
As pcs and CSI restraints are easily obtained from the NMR assignment, it appears that pcs
may be really precious for structural determination in SSNMR.

81
Table 2. Table of distance restraints between the nuclei 1 and 2. The reported distances have
been already added with 1.5 Å of tolerance.
NUCLEUS 1 NUCLEUS 2
Residue N° Residue type Atom type Residue N° Residue type Atom type
Distance (1.5
Å added)
141 TRP Hα 250 LEU Hδ12 6.28
213 PHE Hβ2 245 ILE Hγ21 6.84
114 ILE Hβ 224 LEU Hδ21 6.64
118 ILE Hβ 151 LYS HE2 6.59
125 MET Hβ2 212 LEU Hδ22 6.59
129 ASP- Hβ2 205 THR Hγ21 6.33
130 VAL Hγ12 161 VAL Hγ11 6.9
134 ILE Hα 216 ALA Hβ2 6.18
136 LYS Hζ1 246 ASN Hα 6.38
137 ALA Hα 220 ILE Hδ12 6.33
140 VAL Hγ13 249 ARG+ Hα 6.57
144 VAL Hβ 255 ILE Hα 6.03
147 LEU Hδ11 258 ILE Hδ12 6.98
159 ILE Hα 223 SER Hβ3 6.7
161 VAL Hγ21 220 ILE Hδ11 6.55
164 ALA Hα 199 GLU- Hβ3 6.1
170 ASP- Hα 191 ILE Hδ11 6.33
181 LEU Hβ2 215 THR Hγ1 6.69
182 ALA Hα 219 GLU- Hγ3 6.65
194 ASP- Hα 223 SER Hγ 6.35
214 LEU Hβ3 243 VAL Hγ22 6.61

82
Fig. 7. Families of 10 simulated structures (B) without paramagnetic restraints, (C) with
paramagnetic restraints
2.4.5 Structure elucidation of ZnMMP12 In the strategy proposed in this work, we introduce the use of pcs as structural restraints for
the structural determination of protein in the solid phase. With respect to the NMR protein
structural determination in solution, the use of pcs in the SSNMR structural determination
may be even more important: as the number of distance restraints usually collected for the
protein structure determination is much smaller than those routinely collected in solution, the
structural refinement expected by the use of pcs may be even more significant.
The recent development of the SSNMR MAS technique provides nowadays several
recoupling sequences61,62 able to determine, even with comparably high precision,
internuclear distances. Unfortunately, the most of these sequences require selective pulses or
specific labeling schemes,9 while broadband recoupling sequences are more profitable to
collect the large number of distance restraints needed to determine the protein structure.
One of the most successful strategies is using Proton Driven Spin Diffusion (PDSD)
sequence on selectively labeled protein samples to collect large numbers of distance
restraints9 However, using the same sequence for uniformly labeled samples would result in
too overcrowded spectra leading to intricacy of resonance assignments. Alike PDSD, the

83
CHHC sequence provides distance restraints even using uniformly labeled proteins63. In this
sequence, a cross-polarization (CP) transfer block is used to force the magnetization transfer
from 13C to covalently bound 1H nuclei letting the 1H-1H spin diffusion during the mixing
time; finally the magnetization is transferred back on 13C for detection, which provides a
much higher resolution than direct 1H detection. The CHHC spectrum appears as a 2D 13C-13C map, the aliphatic region of which is more or less analogous to the one observed in 13C-13C PDSD, but with respect to this it encodes 1H-1H contacts. The forced transfer on 1H
nuclei before the spin-diffusion step reduces the effects of the dipolar truncation which
should be expected in the PDSD spectrum in view of the uniform labeling. The CHHC47,63
sequence was used to determine the structure of a small protein (38 residues)19 providing
distance restraints in the range of 5-6 Å.
In this work we want to demonstrate how the use of PCS as complementary distance
restraints allows one to determine at least a low-resolution structure but on a relatively large
protein (159 AA) and using only uniformly labeled samples. The strategy we adopted is to
collect together pcs and backbone dihedral angle restraints, which can be easily determined
directly from the assignment of the paramagnetic and the diamagnetic protein and by using
the CSI or TALOS programs, with distance restraints determined through CHHC and PDSD
experiments on the uniformly labeled sample.
As pcs and TALOS dihedral angles are easily determined, they can be collected in large
amount (318 and 152, respectively) allowing us to reduce to minimum the distance restraints
needed. These were obtained primarily by using the CHHC spectrum (91 distance restraints)
acquired at 150 µs of mixing time (Figure 8A & 8B). These inter-residual distance
correlation was found to be all within 6 Å, checking on the known X-Ray structure. On this
basis we intend to use any correlation assigned in the CHHC spectrum as a distance restraint
upper limited to 6 Å. We believe this limit is large enough to be generally considered
independent on the nature of the protein. This allowed us to avoid the consideration of all X-
ray information and to collect distance restraints only on the basis of the experimental
spectra.

84
In addition to CHHC we also acquired PDSD spectra at different mixing times (from 15ms,
60ms, 100ms and 200 ms) in order to provide additional distance restraints. Comparing the
CHHC spectra at 150 µs with the PDSD spectra at 60-200ms, it is apparent how the PDSD
spectrum is more intense but even more crowded than the CHHC spectra. The assignment of
PDSD spectra was difficult owing to overlap and ambiguity. However, 107 cross peak were

85
assigned primarily following the most resolved peaks primarily. Most of these assignments
were found to be sequential assignments. They included 19 sequentially long-range and 9
sequentially medium range correlations. In uniformly labeled sample, the PDSD mechanism
rapidly transfers magnetization intra-residue along the C-C bonds: this allowed us to observe
all the intra-residue correlations already at 15 ms. On the other hand, the effect of the dipolar
truncation and the relayed magnetization transfer strongly reduces the intensity of the direct
long-range correlation in the PDSD. In such a condition the PDSD cross-peak cannot be
used for direct measurement of the inter-nuclear distance but they must be categorized with a
generic upper limit that takes into account the relayed spin diffusion mechanisms. Thus, we
observed that by using a general upper limit of 9 Å for any assigned cross-peaks in the 60-
200 ms PDSD spectra we collect a series of “loose” distance restraints but that are still useful
for the structural determination. These primarily achieved distance restraints along with
torsion angle restraints and intra-molecular pcs restraints were used to calculate structure
using CYANA. A low resolution structure with a RMSD of 3.2Å (2.33Å with respect to X-
ray secondary structure (Figure 10B) was determined from this calculation. We demonstrate
that the use of pcs at this point has intense effect since the same calculation without the
presence of the pcs constraints results in fairly unresolved structure with a RMSD (figure
10A). We believe that this low resolution structure can be refined by further addition of more
restraints). However, overcrowded PDSD spectra (Figure 9) acquired with increasing mixing
time restricted the further assignment of more sequentially long-range correlation. In order to
avoid ambiguity we can take this low resolution structure as a primary model structure while
adding new restraints through unambiguous resonance assignments. (This further
improvement of the structure is presently in progress)

86

87
Table 3 summarizes the total no of constraints derived experimentally including distance
restraints, torsion angle restraints and intra-molecular pcs. Number Distance
Total number of distance restraints 271 -
Total number of distance restraints from CHHC spectra
analysis
91 6Å
Number of sequential distance restraints from CHHC
spectra analysis (|i-j|) = 1
29 6Å
Number of Medium range distance restraints from CHHC
spectra analysis [1 < (|i-j|) ≤ 4
26 6Å
Number of long range distance restraints from CHHC
spectra analysis (|i-j|) > 4
36 6Å
Total number of distance restraints from PDSD spectra
analysis
107 9Å
Number of sequential distance restraints from PDSD
spectra analysis (|i-j|) = 1
70 9Å
Number of Medium range distance restraints from PDSD
spectra analysis [1 < (|i-j|) ≤ 4
18 9Å
Number of long range distance restraints from PDSD
spectra analysis (|i-j|) > 4
19 9Å
Total number of TALOS calculated torsion angles 152
Total number of intra-molecular pcs used 318
RMSD with respect to X-ray (PDB 1RMZ) secondary
structural element, using 198 distance restraints + 152
TALOS calculated torsion angles + 318 intra-molecular
pcs restraints.
2.33 Å

88
Figure 10: Families of 10 simulated structures (A) without paramagnetic restraints, (B)
with paramagnetic restraints
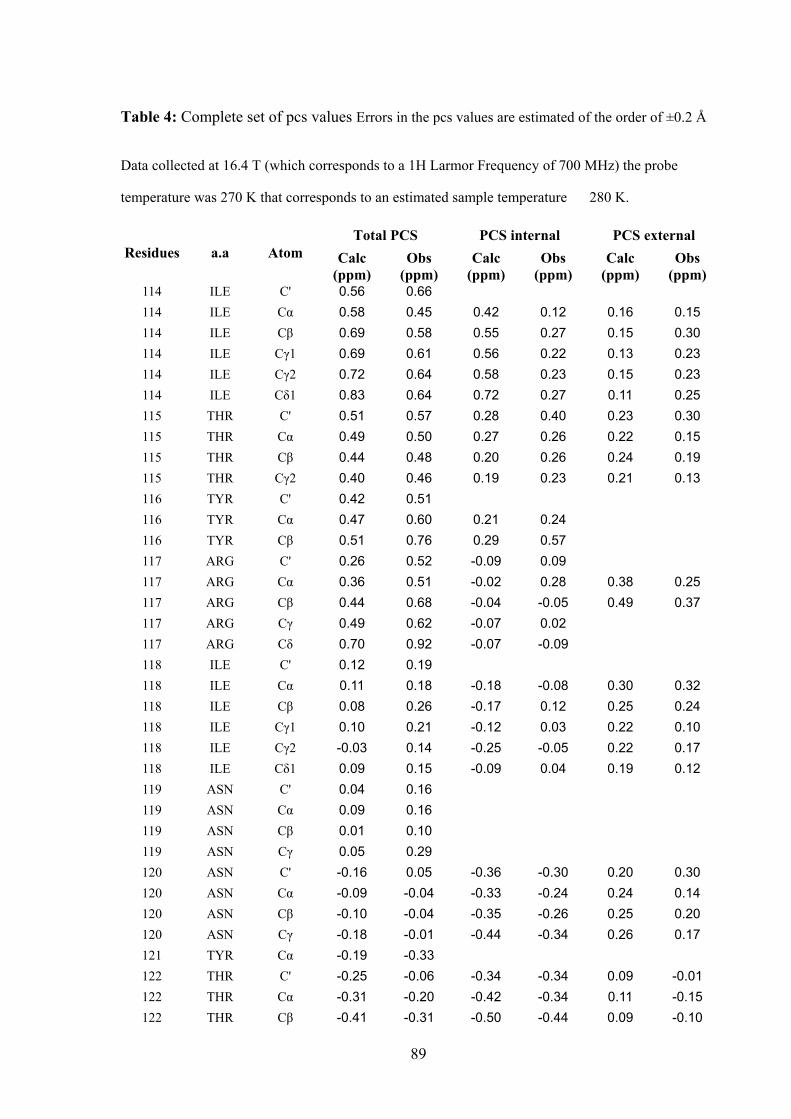
89
Table 4: Complete set of pcs values Errors in the pcs values are estimated of the order of ±0.2 Å
Data collected at 16.4 T (which corresponds to a 1H Larmor Frequency of 700 MHz) the probe
temperature was 270 K that corresponds to an estimated sample temperature � 280 K.
Total PCS PCS internal PCS external Residues a.a Atom Calc
(ppm) Obs
(ppm) Calc
(ppm) Obs
(ppm) Calc
(ppm) Obs
(ppm) 114 ILE C' 0.56 0.66 114 ILE Cα 0.58 0.45 0.42 0.12 0.16 0.15 114 ILE Cβ 0.69 0.58 0.55 0.27 0.15 0.30 114 ILE Cγ1 0.69 0.61 0.56 0.22 0.13 0.23 114 ILE Cγ2 0.72 0.64 0.58 0.23 0.15 0.23 114 ILE Cδ1 0.83 0.64 0.72 0.27 0.11 0.25 115 THR C' 0.51 0.57 0.28 0.40 0.23 0.30 115 THR Cα 0.49 0.50 0.27 0.26 0.22 0.15 115 THR Cβ 0.44 0.48 0.20 0.26 0.24 0.19 115 THR Cγ2 0.40 0.46 0.19 0.23 0.21 0.13 116 TYR C' 0.42 0.51 116 TYR Cα 0.47 0.60 0.21 0.24 116 TYR Cβ 0.51 0.76 0.29 0.57 117 ARG C' 0.26 0.52 -0.09 0.09 117 ARG Cα 0.36 0.51 -0.02 0.28 0.38 0.25 117 ARG Cβ 0.44 0.68 -0.04 -0.05 0.49 0.37 117 ARG Cγ 0.49 0.62 -0.07 0.02 117 ARG Cδ 0.70 0.92 -0.07 -0.09 118 ILE C' 0.12 0.19 118 ILE Cα 0.11 0.18 -0.18 -0.08 0.30 0.32 118 ILE Cβ 0.08 0.26 -0.17 0.12 0.25 0.24 118 ILE Cγ1 0.10 0.21 -0.12 0.03 0.22 0.10 118 ILE Cγ2 -0.03 0.14 -0.25 -0.05 0.22 0.17 118 ILE Cδ1 0.09 0.15 -0.09 0.04 0.19 0.12 119 ASN C' 0.04 0.16 119 ASN Cα 0.09 0.16 119 ASN Cβ 0.01 0.10 119 ASN Cγ 0.05 0.29 120 ASN C' -0.16 0.05 -0.36 -0.30 0.20 0.30 120 ASN Cα -0.09 -0.04 -0.33 -0.24 0.24 0.14 120 ASN Cβ -0.10 -0.04 -0.35 -0.26 0.25 0.20 120 ASN Cγ -0.18 -0.01 -0.44 -0.34 0.26 0.17 121 TYR Cα -0.19 -0.33 122 THR C' -0.25 -0.06 -0.34 -0.34 0.09 -0.01 122 THR Cα -0.31 -0.20 -0.42 -0.34 0.11 -0.15 122 THR Cβ -0.41 -0.31 -0.50 -0.44 0.09 -0.10

90
122 THR Cγ2 -0.40 -0.31 -0.48 -0.44 0.08 -0.13 123 PRO Cα -0.19 -0.18 -0.26 -0.20 0.07 0.00 123 PRO Cβ -0.16 -0.08 -0.24 -0.14 0.08 0.05 123 PRO Cγ -0.18 -0.09 -0.28 -0.06 0.10 0.08 123 PRO Cδ -0.22 -0.17 -0.32 -0.29 0.11 -0.02 124 ASP Cα -0.27 -0.11 -0.29 -0.22 0.02 0.08 124 ASP Cβ -0.34 -0.23 -0.35 -0.13 0.01 -0.02 124 ASP Cγ -0.36 -0.27 -0.38 -0.40 0.01 -0.10 125 MET C' -0.14 -0.22 125 MET Cα -0.19 -0.16 -0.24 -0.06 0.06 0.02 125 MET Cβ -0.21 -0.17 -0.28 -0.15 0.06 -0.09 125 MET Cγ -0.27 -0.22 -0.32 -0.18 0.04 0.02 126 ASN Cα -0.06 -0.05 -0.15 -0.14 0.09 -0.06 126 ASN Cβ -0.01 0.18 -0.12 0.13 0.11 0.12 127 ARG C' -0.02 0.11 127 ARG Cα -0.06 0.01 127 ARG Cβ -0.06 -0.05 -0.13 -0.20 0.07 -0.04 127 ARG Cγ -0.05 -0.02 -0.12 -0.05 0.08 -0.03 128 GLU Cα 0.04 0.27 -0.07 0.19 0.11 0.13 128 GLU Cβ 0.06 0.18 -0.06 -0.02 0.11 -0.01 128 GLU Cγ 0.07 0.29 -0.04 0.03 0.10 -0.03 129 ASP C' -0.02 0.14 -0.13 0.03 0.11 0.05 129 ASP Cα 0.01 0.17 -0.11 -0.08 0.12 0.02 129 ASP Cβ -0.01 0.11 -0.13 -0.16 0.12 -0.01 130 VAL C' 0.00 0.02 -0.12 -0.14 0.12 -0.14 130 VAL Cα -0.08 -0.07 -0.19 -0.10 0.11 -0.03 130 VAL Cβ -0.12 -0.09 -0.23 -0.16 0.11 -0.04 130 VAL Cγ1 -0.15 -0.10 -0.28 -0.16 0.12 -0.03 130 VAL Cγ2 -0.18 -0.10 -0.28 -0.16 0.10 -0.03 132 TYR C' 0.20 0.29 0.08 0.20 0.12 0.03 132 TYR Cα 0.18 0.20 0.05 0.07 0.13 0.00 132 TYR Cβ 0.16 0.18 0.02 -0.03 0.13 0.00 133 ALA C' 0.24 0.19 0.13 0.07 0.11 -0.05 133 ALA Cα 0.14 0.27 0.03 0.12 0.10 0.05 133 ALA Cβ 0.01 0.16 -0.09 0.05 0.09 0.16 134 ILE C' 0.45 0.34 0.33 0.08 0.13 0.03 134 ILE Cα 0.32 0.30 0.20 0.11 0.12 0.05 134 ILE Cβ 0.23 0.24 0.09 0.14 0.14 0.10 134 ILE Cγ1 0.04 0.06 -0.09 -0.08 0.13 0.00 134 ILE Cγ2 0.33 0.33 0.18 0.22 0.15 0.13 134 ILE Cδ1 -0.03 -0.04 -0.14 -0.20 0.12 -0.04 135 ARG C' 0.53 0.46 0.40 0.23 0.13 0.09 135 ARG Cα 0.45 0.35 0.31 0.22 0.14 0.19 135 ARG Cβ 0.38 0.33 0.23 0.15 0.14 0.03 135 ARG Cγ 0.41 0.30 0.25 0.13 0.15 -0.01
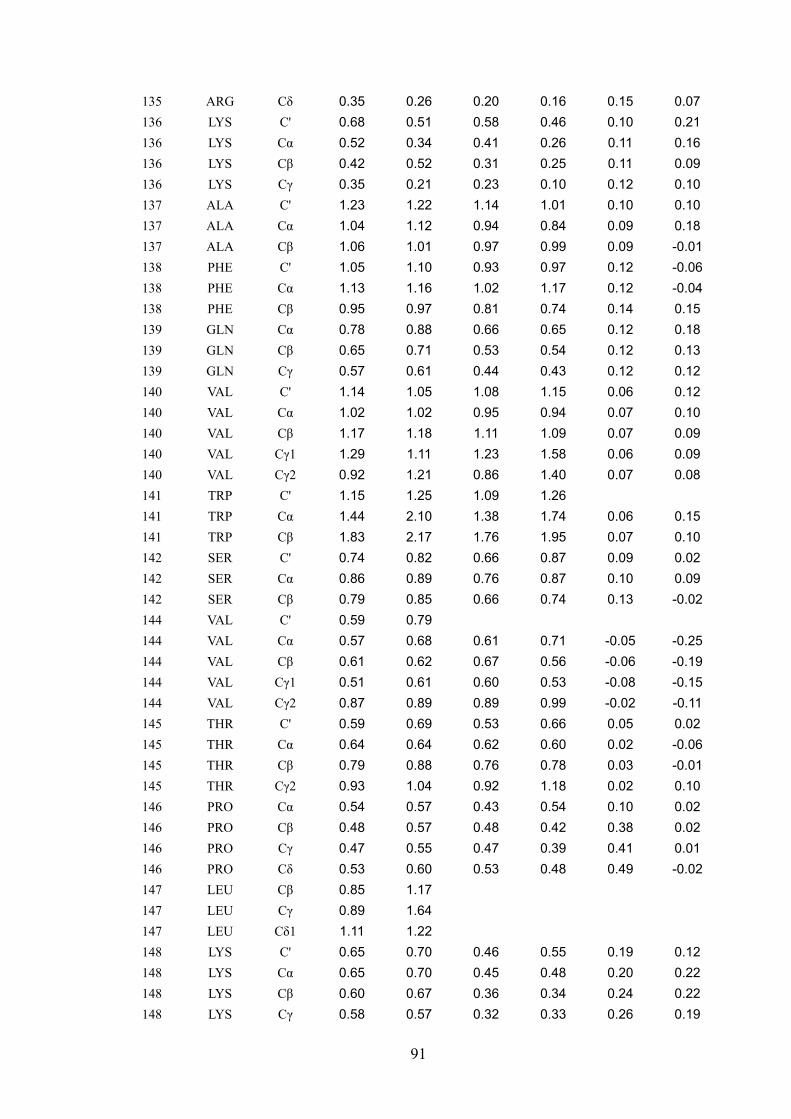
91
135 ARG Cδ 0.35 0.26 0.20 0.16 0.15 0.07 136 LYS C' 0.68 0.51 0.58 0.46 0.10 0.21 136 LYS Cα 0.52 0.34 0.41 0.26 0.11 0.16 136 LYS Cβ 0.42 0.52 0.31 0.25 0.11 0.09 136 LYS Cγ 0.35 0.21 0.23 0.10 0.12 0.10 137 ALA C' 1.23 1.22 1.14 1.01 0.10 0.10 137 ALA Cα 1.04 1.12 0.94 0.84 0.09 0.18 137 ALA Cβ 1.06 1.01 0.97 0.99 0.09 -0.01 138 PHE C' 1.05 1.10 0.93 0.97 0.12 -0.06 138 PHE Cα 1.13 1.16 1.02 1.17 0.12 -0.04 138 PHE Cβ 0.95 0.97 0.81 0.74 0.14 0.15 139 GLN Cα 0.78 0.88 0.66 0.65 0.12 0.18 139 GLN Cβ 0.65 0.71 0.53 0.54 0.12 0.13 139 GLN Cγ 0.57 0.61 0.44 0.43 0.12 0.12 140 VAL C' 1.14 1.05 1.08 1.15 0.06 0.12 140 VAL Cα 1.02 1.02 0.95 0.94 0.07 0.10 140 VAL Cβ 1.17 1.18 1.11 1.09 0.07 0.09 140 VAL Cγ1 1.29 1.11 1.23 1.58 0.06 0.09 140 VAL Cγ2 0.92 1.21 0.86 1.40 0.07 0.08 141 TRP C' 1.15 1.25 1.09 1.26 141 TRP Cα 1.44 2.10 1.38 1.74 0.06 0.15 141 TRP Cβ 1.83 2.17 1.76 1.95 0.07 0.10 142 SER C' 0.74 0.82 0.66 0.87 0.09 0.02 142 SER Cα 0.86 0.89 0.76 0.87 0.10 0.09 142 SER Cβ 0.79 0.85 0.66 0.74 0.13 -0.02 144 VAL C' 0.59 0.79 144 VAL Cα 0.57 0.68 0.61 0.71 -0.05 -0.25 144 VAL Cβ 0.61 0.62 0.67 0.56 -0.06 -0.19 144 VAL Cγ1 0.51 0.61 0.60 0.53 -0.08 -0.15 144 VAL Cγ2 0.87 0.89 0.89 0.99 -0.02 -0.11 145 THR C' 0.59 0.69 0.53 0.66 0.05 0.02 145 THR Cα 0.64 0.64 0.62 0.60 0.02 -0.06 145 THR Cβ 0.79 0.88 0.76 0.78 0.03 -0.01 145 THR Cγ2 0.93 1.04 0.92 1.18 0.02 0.10 146 PRO Cα 0.54 0.57 0.43 0.54 0.10 0.02 146 PRO Cβ 0.48 0.57 0.48 0.42 0.38 0.02 146 PRO Cγ 0.47 0.55 0.47 0.39 0.41 0.01 146 PRO Cδ 0.53 0.60 0.53 0.48 0.49 -0.02 147 LEU Cβ 0.85 1.17 147 LEU Cγ 0.89 1.64 147 LEU Cδ1 1.11 1.22 148 LYS C' 0.65 0.70 0.46 0.55 0.19 0.12 148 LYS Cα 0.65 0.70 0.45 0.48 0.20 0.22 148 LYS Cβ 0.60 0.67 0.36 0.34 0.24 0.22 148 LYS Cγ 0.58 0.57 0.32 0.33 0.26 0.19

92
148 LYS Cδ 0.60 0.54 0.30 0.27 0.30 0.16 149 PHE C' 0.57 0.57 149 PHE Cα 0.65 0.61 149 PHE Cβ 0.73 0.64 150 SER C' 0.44 0.48 0.23 0.20 0.21 0.13 150 SER Cα 0.46 0.37 0.26 0.21 0.20 0.13 150 SER Cβ 0.42 0.38 0.22 0.15 0.19 0.10 151 LYS Cα 0.38 0.40 0.16 0.11 0.22 0.21 151 LYS Cβ 0.35 0.40 0.15 0.49 0.20 0.28 151 LYS Cγ 0.32 0.41 0.10 0.33 0.22 0.38 151 LYS Cδ 0.28 0.37 0.09 0.21 0.19 0.25 151 LYS Cε 0.24 0.48 0.04 0.18 0.20 0.13 152 ILE C' 0.47 0.43 0.03 0.03 0.44 0.33 152 ILE Cα 0.42 0.66 0.06 0.04 0.36 0.27 152 ILE Cβ 0.48 0.79 0.06 -0.15 0.42 0.45 152 ILE Cγ1 0.54 0.91 0.05 -0.08 152 ILE Cγ2 0.40 0.80 0.09 -0.03 152 ILE Cδ1 0.66 0.82 0.03 -0.15 154 THR C’ 1.60 1.79 -0.02 0.08 1.62 1.80 154 THR Cα 1.61 1.96 -0.03 0.01 1.64 1.90 154 THR Cβ 2.31 2.76 -0.03 -0.06 2.34 2.72 155 GLY C' 1.12 1.05 155 GLY Cα 1.61 1.64 156 MET Cα 0.69 0.87 -0.01 0.12 0.70 0.91 156 MET Cβ 0.60 0.86 0.00 -0.14 156 MET Cγ 0.66 0.78 -0.02 -0.03 0.68 0.60 157 ALA C' 0.39 0.60 0.06 0.14 0.33 0.36 157 ALA Cα 0.45 0.58 0.05 0.15 0.40 0.46 157 ALA Cβ 0.45 0.60 0.05 0.06 0.41 0.38 158 ASP Cα 0.38 0.59 0.16 0.29 0.22 0.33 158 ASP Cβ 0.45 0.34 0.26 -0.06 0.19 0.10 158 ASP Cγ 0.41 0.24 0.24 -0.13 159 ILE C' 0.28 0.42 0.03 0.10 0.25 0.20 159 ILE Cα 0.39 0.49 0.18 0.11 0.21 0.17 159 ILE Cβ 0.58 0.72 0.40 0.50 0.18 0.20 159 ILE Cγ1 0.76 0.76 0.61 0.48 0.15 0.13 159 ILE Cγ2 0.56 0.54 0.40 0.34 0.17 0.20 159 ILE Cδ1 1.05 1.21 0.92 0.38 160 LEU Cα 0.06 0.17 -0.23 -0.05 0.29 0.22 160 LEU Cβ 0.03 0.15 -0.30 -0.11 0.33 0.25 160 LEU Cγ1 0.06 0.31 -0.32 -0.06 160 LEU Cδ1 0.22 0.22 -0.22 -0.26 0.44 0.29 160 LEU Cδ2 0.05 0.34 -0.35 -0.15 161 VAL C' -0.38 -0.30 161 VAL Cα -0.29 -0.21 -0.52 -0.48
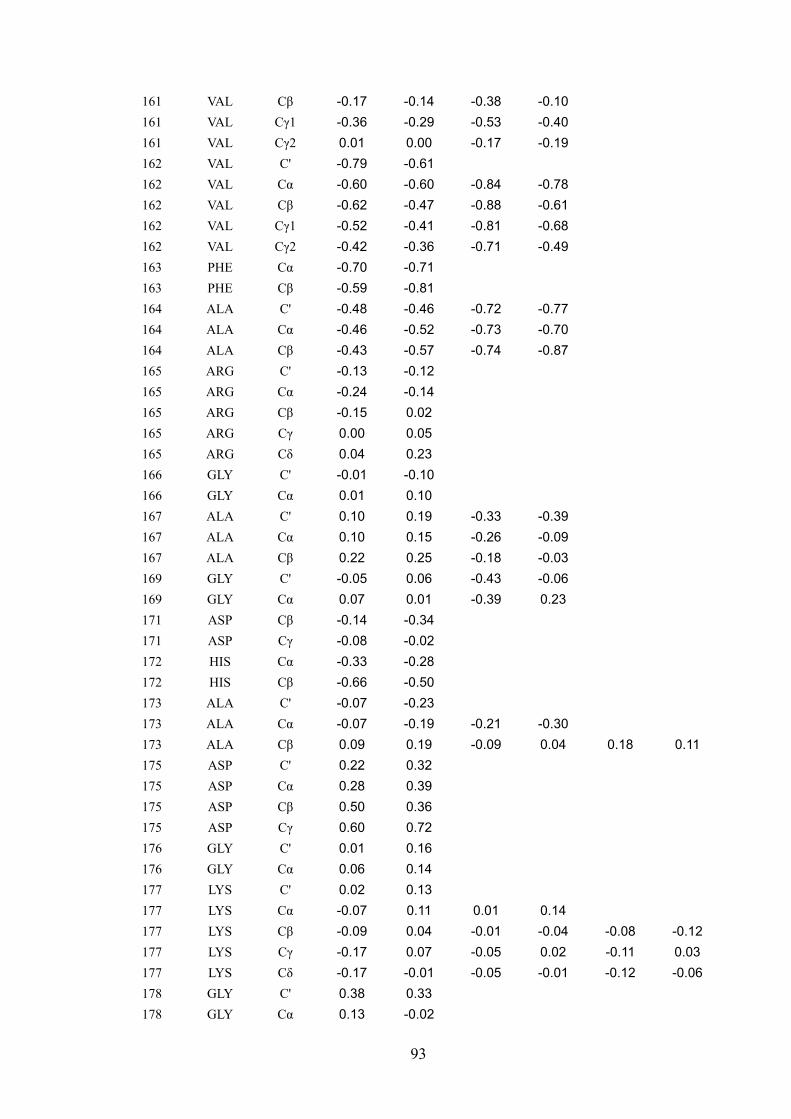
93
161 VAL Cβ -0.17 -0.14 -0.38 -0.10 161 VAL Cγ1 -0.36 -0.29 -0.53 -0.40 161 VAL Cγ2 0.01 0.00 -0.17 -0.19 162 VAL C' -0.79 -0.61 162 VAL Cα -0.60 -0.60 -0.84 -0.78 162 VAL Cβ -0.62 -0.47 -0.88 -0.61 162 VAL Cγ1 -0.52 -0.41 -0.81 -0.68 162 VAL Cγ2 -0.42 -0.36 -0.71 -0.49 163 PHE Cα -0.70 -0.71 163 PHE Cβ -0.59 -0.81 164 ALA C' -0.48 -0.46 -0.72 -0.77 164 ALA Cα -0.46 -0.52 -0.73 -0.70 164 ALA Cβ -0.43 -0.57 -0.74 -0.87 165 ARG C' -0.13 -0.12 165 ARG Cα -0.24 -0.14 165 ARG Cβ -0.15 0.02 165 ARG Cγ 0.00 0.05 165 ARG Cδ 0.04 0.23 166 GLY C' -0.01 -0.10 166 GLY Cα 0.01 0.10 167 ALA C' 0.10 0.19 -0.33 -0.39 167 ALA Cα 0.10 0.15 -0.26 -0.09 167 ALA Cβ 0.22 0.25 -0.18 -0.03 169 GLY C' -0.05 0.06 -0.43 -0.06 169 GLY Cα 0.07 0.01 -0.39 0.23 171 ASP Cβ -0.14 -0.34 171 ASP Cγ -0.08 -0.02 172 HIS Cα -0.33 -0.28 172 HIS Cβ -0.66 -0.50 173 ALA C' -0.07 -0.23 173 ALA Cα -0.07 -0.19 -0.21 -0.30 173 ALA Cβ 0.09 0.19 -0.09 0.04 0.18 0.11 175 ASP C' 0.22 0.32 175 ASP Cα 0.28 0.39 175 ASP Cβ 0.50 0.36 175 ASP Cγ 0.60 0.72 176 GLY C' 0.01 0.16 176 GLY Cα 0.06 0.14 177 LYS C' 0.02 0.13 177 LYS Cα -0.07 0.11 0.01 0.14 177 LYS Cβ -0.09 0.04 -0.01 -0.04 -0.08 -0.12 177 LYS Cγ -0.17 0.07 -0.05 0.02 -0.11 0.03 177 LYS Cδ -0.17 -0.01 -0.05 -0.01 -0.12 -0.06 178 GLY C' 0.38 0.33 178 GLY Cα 0.13 -0.02

94
179 GLY C' 1.53 0.56 179 GLY Cα 1.15 0.66 186 GLY C' 0.25 0.25 186 GLY Cα 0.24 0.21 187 PRO C' 0.18 0.38 187 PRO Cα 0.40 0.73 0.39 0.66 187 PRO Cβ 0.52 0.56 0.50 0.50 0.01 0.05 187 PRO Cγ 0.79 1.11 0.78 0.38 187 PRO Cδ 0.75 1.07 0.76 1.02 -0.01 0.08 188 GLY C' 0.06 0.37 0.00 0.19 188 GLY Cα 0.06 0.26 0.03 0.22 189 SER C' 0.00 0.13 189 SER Cα 0.04 0.14 -0.05 -0.11 0.09 -0.05 189 SER Cβ 0.02 0.19 -0.05 -0.05 0.07 0.01 190 GLY C' -0.04 -0.10 -0.23 -0.66 0.19 0.23 190 GLY Cα 0.01 0.14 -0.17 -0.23 0.18 0.19 191 ILE Cα -0.25 -0.35 -0.42 -0.56 191 ILE Cβ -0.35 -0.32 -0.52 -0.40 191 ILE Cγ1 -0.52 -0.36 -0.70 -0.47 191 ILE Cγ2 -0.40 -0.28 -0.52 -0.38 191 ILE Cδ1 -0.54 -0.53 -0.73 -0.58 192 GLY C' -0.01 -0.19 192 GLY Cα -0.14 -0.21 193 GLY C' 0.13 0.33 0.02 0.42 0.11 0.04 193 GLY Cα 0.30 0.45 0.21 0.18 0.10 0.13 194 ASP C' -0.85 -0.66 -0.98 -1.13 194 ASP Cα -0.42 -0.70 -0.57 -1.05 194 ASP Cβ -0.49 -0.42 -0.68 -0.46 194 ASP Cγ -0.22 -0.03 -0.44 -0.31 195 ALA C' -1.86 -1.65 -1.99 -2.03 195 ALA Cα -1.54 -1.25 -1.65 -1.72 0.11 0.15 195 ALA Cβ -0.89 -0.84 -1.00 -0.94 0.10 0.11 196 HIS C' -3.03 -2.93 -3.12 -3.17 196 HIS Cα -2.43 -2.58 -2.55 -2.62 196 HIS Cβ -2.28 -2.43 -2.40 -2.48 197 PHE C' -1.80 -1.81 -1.88 -1.98 0.08 0.11 197 PHE Cα -2.39 -2.18 -2.46 -2.42 0.07 0.02 197 PHE Cβ -1.96 -1.84 -2.04 -2.22 201 GLU Cα -0.58 -0.53 -0.52 -0.26 201 GLU Cβ -0.80 -0.37 -0.73 -0.32 201 GLU Cγ -0.90 -0.25 -0.83 -0.45 201 GLU Cδ -0.57 -0.35 -0.47 -0.63 202 PHE C' -0.56 -0.38 202 PHE Cα -0.49 -0.52 -0.41 -0.92 202 PHE Cβ -0.43 -0.39 -0.32 -0.56

95
203 TRP C' -0.50 -0.32 203 TRP Cα -0.61 -0.58 -0.58 -0.59 -0.03 0.13 203 TRP Cβ -0.65 -0.79 -0.66 -0.95 0.01 0.06 204 THR C' -0.33 -0.23 204 THR Cα -0.39 -0.24 -0.36 -0.28 -0.03 -0.11 204 THR Cβ -0.41 -0.39 -0.33 -0.59 -0.08 -0.02 204 THR Cγ2 -0.43 -0.26 -0.31 0.03 205 THR Cα -0.16 0.18 -0.21 0.13 205 THR Cβ -0.07 0.15 -0.16 0.07 205 THR Cγ2 -0.05 0.16 -0.16 0.11 206 HIS Cα -0.23 -1.06 207 SER Cα -0.45 -0.32 -0.23 -0.23 -0.21 -0.26 207 SER Cβ -0.45 -0.28 -0.20 -0.03 -0.25 -0.22 209 GLY C' -0.61 -0.55 209 GLY Cα -0.55 -0.46 210 THR C' -0.83 -0.93 -0.73 -0.94 -0.09 -0.25 210 THR Cα -0.83 -0.74 -0.70 -0.67 -0.13 -0.18 210 THR Cβ -1.00 -0.96 -0.88 -0.89 -0.12 -0.10 210 THR Cγ2 -1.35 -1.27 -1.24 -1.40 -0.12 -0.17 211 ASN Cβ -0.55 -0.34 211 ASN Cγ -0.38 -0.23 212 LEU C' -0.52 -0.40 212 LEU Cα -0.71 -0.68 -0.73 -0.74 0.02 0.07 212 LEU Cβ -0.56 -0.39 -0.60 -0.58 0.04 0.08 212 LEU Cγ -0.54 -0.35 -0.60 -0.35 214 LEU Cα -0.10 -0.20 -0.13 -0.23 0.03 0.10 214 LEU Cβ -0.40 -0.42 -0.42 -0.40 0.02 0.00 214 LEU Cδ1 -0.40 -0.11 -0.40 -0.10 215 THR Cα -1.96 -1.22 -1.95 -1.42 0.00 -0.05 215 THR Cβ -2.69 -2.53 -2.66 -2.67 -0.02 -0.04 215 THR Cγ2 -4.67 -4.44 -4.63 -4.86 -0.04 -0.07 216 ALA C' 1.94 1.76 1.88 1.80 0.06 0.12 216 ALA Cα 0.44 0.24 0.38 -0.05 0.05 0.05 216 ALA Cβ 0.27 0.21 0.20 0.00 0.07 0.11 217 VAL C' 5.61 5.47 5.55 5.59 0.06 -0.11 217 VAL Cα 3.07 2.80 3.00 3.00 0.07 0.09 217 VAL Cβ 2.29 1.96 2.22 1.98 0.07 0.04 217 VAL Cγ1 2.71 2.43 2.63 2.63 0.08 -0.04 217 VAL Cγ2 1.45 1.39 1.38 1.45 0.07 0.05 220 ILE Cα 4.86 4.90 4.79 4.96 0.06 0.08 220 ILE Cβ 3.31 3.20 3.23 3.19 0.08 0.06 220 ILE Cγ1 2.15 2.15 2.05 2.13 0.09 -0.10 220 ILE Cγ2 2.72 2.79 220 ILE Cδ1 1.58 1.66 1.47 1.66 0.10 0.13 224 LEU Cα 2.36 2.63

96
224 LEU Cβ 2.56 2.72 2.52 2.80 224 LEU Cγ 2.40 2.48 224 LEU Cδ1 2.39 1.97 2.32 1.80 225 GLY C' 1.88 2.22 1.92 2.17 225 GLY Cα 1.73 1.93 1.76 1.76 230 SER C' 1.05 1.39 -1.74 -1.83 230 SER Cα 0.00 0.28 -2.14 -2.43 2.13 2.35 230 SER Cβ 0.75 0.96 -1.63 -1.76 2.38 2.53 231 ASP C' 0.47 0.81 231 ASP Cα 0.76 1.22 -1.35 -1.22 2.10 2.45 231 ASP Cβ 0.37 0.70 -1.12 -1.13 1.49 1.78 231 ASP Cγ 0.44 0.86 -0.85 -0.56 1.29 1.65 232 PRO C' 0.19 0.46 232 PRO Cα 0.68 1.00 -1.29 -1.24 1.97 2.07 232 PRO Cβ 1.47 1.83 -0.97 -1.09 2.44 2.70 232 PRO Cγ 2.27 2.97 232 PRO Cδ 2.27 2.68 -0.97 -0.95 233 LYS C' -0.06 0.26 233 LYS Cα 0.14 0.38 -0.74 -0.75 233 LYS Cβ 0.31 0.51 -0.54 -0.90 233 LYS Cγ 0.46 0.58 -0.49 -0.86 233 LYS Cδ 0.33 0.56 -0.39 -0.51 234 ALA C' -0.64 -0.59 -1.10 -1.15 0.46 0.33 234 ALA Cα -0.36 -0.10 -0.94 -0.52 0.59 0.72 234 ALA Cβ -0.62 -0.27 -1.26 -1.22 0.64 0.82 242 TYR Cα -0.53 -0.99 -0.43 -1.08 -0.10 -0.02 242 TYR Cβ -0.51 -0.56 -0.35 -0.86 -0.16 -0.25 243 VAL C' -0.20 -0.14 -0.19 -0.32 -0.01 -0.07 243 VAL Cα -0.26 -0.08 -0.25 -0.19 -0.01 -0.05 243 VAL Cγ1 -0.27 -0.12 -0.35 -0.23 0.09 -0.01 243 VAL Cγ2 -0.16 -0.06 -0.22 -0.18 0.07 -0.04 244 ASP C' -0.05 -0.10 244 ASP Cβ -0.09 0.15 245 ILE C' 0.09 -0.08 0.04 -0.23 0.05 0.08 245 ILE Cα 0.03 0.05 -0.01 0.04 0.04 0.06 245 ILE Cβ 0.03 -0.23 -0.03 -0.10 0.05 -0.01 245 ILE Cγ1 0.03 -0.09 -0.04 0.24 245 ILE Cγ2 -0.06 -0.38 -0.09 -0.45 246 ASN Cα 0.10 0.27 246 ASN Cβ 0.09 0.32 247 THR Cα 0.05 -0.13 0.04 -0.24 0.01 -0.05 247 THR Cβ 0.00 -0.05 0.00 -0.03 -0.01 -0.04 247 THR Cγ2 -0.02 0.03 -0.03 0.09 0.01 -0.06 248 PHE Cα 0.16 0.27 0.11 0.03 0.05 0.04 248 PHE Cβ 0.21 0.24 0.15 0.23 0.06 -0.04

97
249 ARG C' 0.40 0.62 249 ARG Cα 0.32 0.28 0.28 0.42 0.04 0.09 249 ARG Cβ 0.22 0.19 0.22 0.27 0.00 0.01 249 ARG Cγ 0.14 0.19 0.13 0.13 0.01 0.00 250 LEU Cα 0.65 0.73 250 LEU Cβ 0.82 0.84 251 SER C' 0.28 0.49 0.10 0.07 0.18 0.27 251 SER Cα 0.29 0.46 0.04 0.07 0.25 0.36 251 SER Cβ 0.23 0.48 -0.18 -0.03 0.41 0.39 252 ALA C' 0.17 0.34 0.00 0.14 0.17 0.11 252 ALA Cα 0.12 0.30 0.02 0.13 0.10 0.22 252 ALA Cβ 0.04 0.14 -0.05 0.03 0.09 0.09 253 ASP C' 0.27 0.22 253 ASP Cα 0.16 0.50 253 ASP Cβ 0.07 0.33 253 ASP Cγ -0.12 0.36 254 ASP C' 0.86 0.85 0.76 0.50 0.10 0.22 254 ASP Cα 0.83 0.54 0.64 0.04 0.19 0.31 254 ASP Cβ 1.08 0.91 0.90 0.38 0.18 0.27 254 ASP Cγ 1.00 0.89 255 ILE C' 0.43 0.51 0.47 0.30 -0.03 -0.03 255 ILE Cα 0.56 0.64 0.57 0.53 -0.02 0.11 255 ILE Cβ 0.37 0.39 0.45 0.42 -0.08 0.05 255 ILE Cγ1 0.46 0.50 0.53 0.58 -0.06 0.12 255 ILE Cγ2 0.25 0.33 0.42 0.38 -0.16 0.02 255 ILE Cδ1 0.29 0.38 0.40 0.43 -0.11 0.02 256 ARG C' 0.30 0.19 0.29 0.17 0.01 0.04 256 ARG Cα 0.19 0.07 0.21 0.06 -0.02 0.03 256 ARG Cβ 0.08 0.41 0.05 0.42 0.03 0.00 257 GLY C' 0.75 0.82 0.72 0.89 257 GLY Cα 0.51 0.57 0.45 0.68 258 ILE C' 0.82 1.14 0.84 0.69 258 ILE Cα 1.14 1.18 1.13 1.01 258 ILE Cβ 1.44 1.55 1.43 1.53 258 ILE Cγ1 1.60 1.63 1.58 1.68 258 ILE Cγ2 1.14 1.27 1.14 1.33 258 ILE Cδ1 2.01 2.09 1.98 2.06 259 GLN Cα 0.44 0.56 0.52 0.79 -0.07 0.04 259 GLN Cβ 0.30 0.45 0.42 0.54 -0.12 -0.15 259 GLN Cγ 0.35 0.42 0.47 0.52 -0.13 -0.16 259 GLN Cδ 0.18 0.19 0.38 0.39 -0.20 -0.27 260 SER C' 0.30 0.53 0.34 0.44 260 SER Cα 0.24 0.37 0.30 0.31 -0.06 0.05 260 SER Cβ 0.16 0.22 0.21 0.15 -0.04 0.04 261 LEU C' 0.51 0.53 0.52 0.45

98
261 LEU Cα 0.50 0.61 0.53 0.64 261 LEU Cβ 0.72 0.75 0.73 0.78 261 LEU Cγ 0.71 1.01 261 LEU Cδ1 1.08 0.83 1.09 0.63 261 LEU Cδ2 0.44 0.69

99
2.5 Conclusions In conclusion, we demonstrated that, in the investigation of paramagnetic proteins in the
solid-state, it is possible to experimentally separate the intra-molecular pcs from the inter-
molecular contributions by using paramagnetic diluted samples. These pcs are effective
structural restraints: intra-molecular pcs can be used as restraints for protein structure
determinations in the solid state, while inter-molecular pcs can be used to obtain spatial
arrangements among different protein molecules, not necessarily in a crystalline state. The
calculation performed, directly or indirectly on the inter-molecular contributions
demonstrates that pcs alone are accurate enough to allow one to determine the position and
the orientation of two neighboring protein molecules with a distance of very few Å from the
values determined from X-ray crystallography. We stress the fact that only NMR pcs
restraints are used, with no other information coming from crystallography apart from the
single protein structure. This can be in principle determined from solid-state NMR
measurements (e.g. by using intra-molecular pcs) or, when possible by using solution NMR
structures.
We believe to be able to demonstrate in this work a simple strategy to extract valuable pcs
restraints and their applicability as structural constraints. Most importantly we were able to
use these restraints in order to get a rapid image structure of a moderately large protein.
Minimal effort was given in extracting a large number distance inter-nuclear distance
restraints, usually required to obtain a suitable fold of a protein. These results indicate that
structure determination based on dipolar paramagnetic (pseudocontact) shifts is applicable to
molecules containing anisotropic paramagnetic centers with short electronic relaxation times,
including numerous naturally occurring metalloproteins, as well as proteins or nucleic acids
to which a paramagnetic metal ion or ligand may be attached in Solid-state NMR as well.
Moreover, since this method has been demonstrated to work with uniformly labeled sample
this could be extremely useful to study systems in general and where specific labeling would
not be feasible as well.
These results allow this method to be applied to biomolecules in solid-phase that are not
necessarily crystalline, but endowed with a one-dimensional order such as fibrils, which
cannot be structurally investigated by X-ray crystallography. It is worth recalling that
paramagnetic metals, besides being incorporated in metalloproteins in the place of
diamagnetic ones, can be also attached as tags to any protein, and this renders the approach
quite general.

100
Reference List
1. Bertini, I. Felli, I. C., Gonnelli, L., Pierattelli, R., Spyranti, Z. & Spyroulias, G. A.. Mapping protein-protein interaction by C-13 '-detected heteronuclear NMR spectroscopy. J. Biomol. NMR. 36, 111-122 (2006).
2. Schumann,F.H. Riepl, H., Maurer, T., Gronwald, W., Neidig, K. P. & Kalbitzer, H. R.. Combined chemical shift changes and amino acid specific chemical shift mapping of protein-protein interactions. J. Biomol. NMR 39, 275-289 (2007).
3. Shi, Y, Wu & J. Structural basis of protein-protein interaction studied by NMR. J. Struct. Funct. Genomics. 8(2-3), 67-72 (2007).
4. Zuiderweg,E.R.P. Mapping protein-protein interactions in solution by NMR Spectroscopy. Biochemistry 41, 1-7 (2002).
5. Slepkov,E.R., Rainey,J.K., Sykes,B.D. & Fliegel,L. Structural and functional analysis of the Na+/H+ exchanger. Biochemical Journal 401, 623-633 (2007).
6. Sykes,B.D. Shooting blanks: Ca2+-free signaling. Structure 15, 753-754 (2007).
7. McDermott,A. & Polenova,T. Solid state NMR: new tools for insight into enzyme function. Curr. Opin. Struct. Biol. 17, 617-622 (2007).
8. Hojer-Pedersen,J., Smedsgaard,J. & Nielsen,J. Elucidating the mode-of-action of compounds from metabolite profiling studies. Prog. Drug Res. 64, 103, 105-103, 129 (2007).
9. Castellani,F. van Rossum, B., Diehl, A., Schubert, M., Rehbein, K. & Oschkinat, H.. Structure of a protein determined by solid-state magic-angle-spinning NMR spectroscopy. Nature 420, 98-102 (2002).
10. Andronesi,O.C. Becker, S., Seidel, K., Heise, H., Young, H. S. & Baldus, M.. Determination of membrane protein structure and dynamics by magic-angle-spinning solid-state NMR spectroscopy. J. Am. Chem. Soc. 127, 12965-12974 (2005).
11. Lange,A. Giller, K., Hornig, S., Martin-Eauclaire, M. F., Pongs, O., Becker, S. & Baldus, M.. Toxin-induced conformational changes in a potassium channel revealed by solid-state NMR. Nature 440, 959-962 (2006).
12. Heise,H., Hoyer, W., Becker, S., Andronesi, O. C., Riedel, D. & Baldus, M.. Molecular-level secondary structure, polymorphism, and dynamics of full-length alpha-synuclein fibrils studied by solid-state NMR. Proc. Natl. Acad. Sci. USA 102, 15871-15876 (2005).
13. Jaroniec,C.P., MacPhee, C. E., Bajaj, V. S., McMahon, M. T., Dobson, C. M. & Griffin, R. G.. High-resolution molecular structure of a peptide in an amyloid fibril determined by magic angle spinning NMR spectroscopy. Proc. Natl. Acad. Sci. USA 101, 711-716 (2004).
14. Siemer,A.B., Ritter,C., Ernst,M., Riek,R. & Meier,B.H. High-resolution solid-state NMR spectroscopy of the prion protein HET-s in its amyloid conformation. Angew.

101
Chem. Int. Ed Engl. 44, 2441-2444 (2005).
15. Siemer,A.B., Arnold, A. A., Ritter, C., Westfeld, T., Ernst, M., Riek, R. & Meier, B. H.. Observation of highly flexible residues in amyloid fibrils of the HET-s prion. J. Am. Chem. Soc. 128, 13224-13228 (2006).
16. Siemer,A.B., Ritter, C., Steinmetz, M. O., Ernst, M., Riek, R. & Meier, B. H.. C-13, N-15 resonance assignment of parts of the HET-s prion protein in its amyloid form. J. Biomol. NMR. 34, 75-87 (2006).
17. Meier,B.H., Verel, R., Steinmetz, M., Siemer, A. B., Koneke, S., Lange, A., van Melckebeke, H., Wasmer, C. & Ernst, M.. Amyloids and Prions: structure, conformations and conformational transitions as seen by NMR. Faseb Journal 21, A96 (2007).
18. Castellani,F., van Rossum,B.J., Diehl,A., Rehbein,K. & Oschkinat,H. Determination of solid-state NMR structures of proteins by means of three-dimensional N-15-C-13-C-13 dipolar correlation spectroscopy and chemical shift analysis. Biochemistry 42, 11476-11483 (2003).
19. Lange,A., Becker, S., Seidel, K., Giller, K., Pongs, O. & Baldus, M.. A concept for rapid protein-structure determination by solid-state NMR spectroscopy. Angew. Chem. Int. Ed Engl. 44, 2089-2092 (2005).
20. Nadaud,P.S., Helmus,J.J., Hofer,N. & Jaroniec,C.P. Long-range structural restraints in spin-labeled proteins probed by solid-state nuclear magnetic resonance spectroscopy. J. Am. Chem. Soc. 129, 7502-7503 (2007).
21. Schubert,M., Manolikas,T., Rogowski,M. & Meier,B.H. Solid-state NMR spectroscopy of 10% C-13 labeled ubiquitin: spectral simplification and stereospecific assignment of isopropyl groups. J. Biomol. NMR. 35, 167-173 (2006).
22. Bockmann,A., Lange, A., Galinier, A., Luca, S., Giraud, N., Juy, M., Heise, H., Montserret, R., Penin, F. & Baldus, M.. Solid state NMR sequential resonance assignments and conformational analysis of the 2 x 10.4 kDa dimeric form of the Bacillus subtilis protein Crh. J. Biomol. NMR. 27, 323-339 (2003).
23. Ernst, M., Detken, A, Bockmann, A, Meier & B.H.. NMR specta of a micrcrystalline protein at 30kHz MAS. J. Am. Chem. Soc. 125, 15807-15810 (2003).
24. Astrof,N.S. & Griffin,R.G. Soft-triple resonance solid-state NMR experiments for assignments of U-C-13, N-15 labeled peptides and proteins. J. Magn. Reson. 158, 157-163 (2002).
25. Pauli,J., Baldus,M., van Rossum,B., de Groot,H. & Oschkinat,H. Backbone and side-chain C-13 and N-15 signal assignments of the alpha-spectrin SH3 domain by magic angle spinning solid-state NMR at 17.6 tesla. Chembiochem 2, 272-281 (2001).
26. Hong,M., Gross,J.D., Hu,W. & Griffin,R.G. Determination of the peptide torsion angle phi by N-15 chemical shift and C-13(alpha)-H-1(alpha) dipolar tensor correlation in solid-state MAS NMR. J. Magn. Reson. 135, 169-177 (1998).
27. Kobayashi, M., Matsuki, Y, Yumen, I, Fujiwara, T. & Akutsu, H.. Signal assignment

102
and secondary structure analysis of a uniformly [13C, 15N]-labeled membrane protein, H +-ATP synthase subunit c, by magic-angle spinning solid-state NMR. J. Biomol. NMR. 279-293 (2006).
28. Matsuki,Y., Akutsu,H. & Fujiwara,T. Spectral fitting for signal assignment and structural analysis of uniformly C-13-labeled solid proteins by simulated annealing based on chemical shifts and spin dynamics. J. Biomol. NMR. 38, 325-339 (2007).
29. Igumenova,T.I., McDermott, A. E., Zilm, K. W., Martin, R. W., Paulson, E. K. & Wand, A. J.. Assignments of carbon NMR resonances for microcrystalline ubiquitin. J. Am. Chem. Soc. 126, 6720-6727 (2004).
30. McDermott,A., Polenova, T., Bockmann, A., Zilm, K. W., Paulsen, E. K., Martin, R. W. & Montelione, G. T.. Partial NMR assignments for uniformly (C-13, N-15)-enriched BPTI in the solid state. J. Biomol. NMR. 16, 209-219 (2000).
31. Fermi & E. Uber die magnetischen Momente der AtomKerne. Zeitchrift fur Physik 60, 320 (1930).
32. Banci,L., Bertini, I., Eltis, L. D., Felli, I. C., Kastrau, D. H. W., Luchinat, C., Piccioli, M., Pierattelli, R. & Smith, M.. The 3-Dimensional Structure in Solution of the Paramagnetic High-Potential Iron-Sulfur Protein-I from Ectothiorhodospira-Halophila Through Nuclear-Magnetic-Resonance. Eur. J. Biochem. 225, 715-725 (1994).
33. Gochin,M. & Roder,H. Protein-Structure Refinement Based on Paramagnetic Nmr Shifts - Applications to Wild-Type and Mutant Forms of Cytochrome-C. Protein. Sci. 4, 296-305 (1995).
34. Wang, X., Srisailam, S, Yee, A. A., Lemak, A., Arrowsmith, C., Prestegard, J. H., Tian & F. Domain-domain motions in proteins from time-modulated pseudocontact shifts. J. Biomol. NMR. 39(1), 53-61 (2007).
35. Barbieri,R., Luchinat,C. & Parigi,G. Backbone-only protein solution structures with a combination of classical and paramagnetism-based constraints: A method that can be scaled to large molecules. Chemphyschem 5, 797-806 (2004).
36. Banci, L., Bertini, I., Cavallaro, G., Giachetti, A., Luchinat, C. & Parigi, G.. Paramagnetism-based restraints for Xplor-NIH. J. Biomol. NMR. 28, 249-261 (2004).
37. Allegrozzi,M., Bertini, I., Janik, M. B. L., Lee, Y. M., Lin, G. H. & Luchinat, C.. Lanthanide-induced pseudocontact shifts for solution structure refinements of macromolecules in shells up to 40 angstrom from the metal ion. J. Am. Chem. Soc. 122, 4154-4161 (2000).
38. Allegrozzi,M., Bertini,I., Choi,S.N., Lee,Y.M. & Luchinat,C. Detecting small structural changes in metalloproteins by the use of NMR pseudocontact shifts. European Journal of Inorganic Chemistry 2121-2127 (2002).
39. Balayssac,S., Bertini,I., Lelli,M., Luchinat,C. & Maletta,M. Paramagnetic ions provide structural restraints in solid-state NMR of proteins. J. Am. Chem. Soc. 129, 2218-2219 (2007).
40. Bertini,I., Calderone, V., Cosenza, M., Fragai, M., Lee, Y. M., Luchinat, C., Mangani,

103
S., Terni, B. & Turano, P.. Conformational variability of matrix metalloproteinases: Beyond a single 3D structure. Proc. Natl. Acad. Sci. U. S. A 102, 5334-5339 (2005).
41. Pickard,C.J., Salager,E., Pintacuda,G., Elena,B. & Emsley,L. Resolving structures from powders by NMR crystallography using combined proton spin diffusion and plane wave DFT calculations. J. Am. Chem. Soc. 129, 8932-8933 (2007).
42. Harris,R.K., Cadars, S., Emsley, L., Yates, J. R., Pickard, C. J., Jetti, R. K. & Griesser, U. J.. NMR crystallography of oxybuprocaine hydrochloride, Modification II degrees. Phys. Chem. Chem. Phys. 9, 360-368 (2007).
43. Brough,A.R., Grey,C.P. & Dobson,C.M. Paramagnetic-Ions As Structural Probes in Solid-State Nmr - Distance Measurements in Crystalline Lanthanide Acetates. J. Am. Chem. Soc. 115, 7318-7327 (1993).
44. Wishart,D.S. & Sykes,B.D. The 13C chemical-shift index: a simple method for the identification of protein secondary structure using 13C chemical-shift data. J. Biomol. NMR 4, 171-180 (1994).
45. Cornilescu,G., Delaglio,F. & Bax,A. Protein backbone angle restraints from searching a database for chemical shift and sequence homology. J. Biomol. NMR. 13, 289-302 (1999).
46. Hiller, M., Krabben, L., Vinothkumar, K. R., Castellani, F., van Rossum, B. J., Kuhlbrandt, W. & Oschkinat, H.. Solid-state magic-angle spinning NMR of outer-membrane protein G from Escherichia coli. Chembiochem 6, 1679-1684 (2005).
47. Lange,A., Seidel,K., Verdier,L., Luca,S. & Baldus,M. Analysis of proton-proton transfer dynamics in rotating solids and their use for 3D structure determination. J. Am. Chem. Soc. 125, 12640-12648 (2003).
48. Bertini,I., Fragai,M., Lee,Y.M., Luchinat,C. & Terni,B. Paramagnetic metal ions in ligand screening: the Co(II) matrix metalloproteinase 12. Angew. Chem. Int. Ed Engl. 43, 2254-2256 (2004).
49. Morcombe,C.R. & Zilm,K.W. Chemical shift referencing in MAS solid state NMR. J. Magn. Reson. 162, 479-486 (2003).
50. Fung,B.M., Khitrin,A.K. & Ermolaev,K. An improved broadband decoupling sequence for liquid crystals and solids. J. Magn Reson. 142, 97-101 (2000).
51. Mathematica 5.0, Wolfram Research, Inc . 2004. Computer Program 52. Balayssac,S., Bertini,I., Luchinat,C., Parigi,G. & Piccioli,M. 13C direct detected NMR
increases the detectability of residual dipolar couplings. J. Am. Chem. Soc. 128, 15042-15043 (2006).
53. Guntert,P., Mumenthaler,C. & Wuthrich,K. Torsion angle dynamics for NMR structure calculation with the new program DYANA. J. Mol. Biol. 273, 283-298 (1997).
54. Koradi,R., Billeter,M. & Wüthrich,K. MOLMOL: a program for display and analysis of macromolecular structure. J. Mol. Graphics 14, 51-55 (1996).

104
55. Balayssac,S., Bertini, I., Falber, K., Fragai, M., Jehle, S., Lelli, M., Luchinat, C., Oschkinat, H. & Yeo, K. J.. Solid-state NMR of matrix metalloproteinase 12: an approach complementary to solution NMR. Chembiochem 8, 486-489 (2007).
56. Crozet,M., Chaussade, M., Bardet, M., Emsley, L., Lamotte, B. & Mouesca, J.M.. Carbon 13 solid state NMR studies on sunthetic model compounds of [4Fe-4S] clusters in the 2+ state. J. Phys. Chem. 104, 9990-10000 (2000).
57. Liu,K., Ryan,D., Nakanishi,K. & McDermott,A. Solid State NMR Studies of Paramagnetic Coordination Complexes: A Comparison of Protons and Deuterons in Detection and Decoupling. J. Am. Chem. Soc. 117, 6897-6906 (1995).
58. Wickramasinghe,N.P., Shaibat,M. & Ishii,Y. Enhanced sensitivity and resolution in
(1)H solid-state NMR spectroscopy of paramagnetic complexes under very fast magic angle spinning. J. Am. Chem. Soc. 127, 5796-5797 (2005).
59. Bertini,I., Luchinat,C., Parigi,G. & Pierattelli,R. NMR spectroscopy of paramagnetic metalloproteins. Chembiochem 6, 1536-1549 (2005).
60. Bertini, I., Donaire, A., Jimenez, B., Luchinat, C., Parigi, G., Piccioli, M. & Poggi, L.. Paramagnetism-based Versus Classical Constraints: An Analysis of the Solution Structure of Ca Ln Calbindin D9k. J. Biomol. NMR 21, 85-98 (2001).
61. Bennett,A.E., Rienstra, C. M., Griffiths, J. M., Zhen, W. G., Lansbury, P. T. & Griffin, R. G.. Homonuclear radio frequency-driven recoupling in rotating solids. J. Chem. Phys. 108, 9463-9479 (1998).
62. Dusold, S, Sebald & A. Dipolar recoupling under magic-angle spinning conditions. Annual Reports on NMR Spectroscopy 41, 185-264 (2000).
63. Lange,A., Luca,S. & Baldus,M. Structural constraints from proton-mediated rare-spin correlation spectroscopy in rotating solids. J. Am. Chem. Soc. 124, 9704-9705 (2002).

105
Chapter 3
General Conclusions and Perspectives

106
Recent advances in genomic sequencing, molecular, cellular biology and bioinformatic
methods for gene annotation presage significant improvements in human health, if the
increased knowledge can be translated into effective therapeutics. Structural biology is one
of the most informative disciplines providing knowledge of the potential targets for small
molecule interactions of possible use as pharmaceutical leads or for further development of
therapeutics. NMR spectroscopy (both liquid-state and solid-state NMR) is a unique tool due
to its versatility and high-throughput capabilities, together with the ability of the technology
for target identification, atomic level information of their structure and thus their surface and
pocket characteristics for interactions. Furthermore, it is uniquely powerful in the early
phases of drug discovery, because it allows screening over a wide range of affinities (mM-
nM). It is important to note that molecules that bind with even weak binding constants are
very valuable because they provide indication of the type of compounds and functionalities
suitable for targeting the receptors’ binding pocket.
In these three years I have been involved with two different methodological NMR projects
aimed at i) testing the possibility of identifying small molecules to inhibit protein-protein
interactions and ii) developing methods for obtaining structural information on proteins
containing paramagnetic probes in the solid state.
In the first project we focused our attention on two members of the S100 family: S100A13
and S100B. The first one is involved in the non-classical protein release of two pro-
angiogenic polypeptides FGF-1 and IL-1α that are involved in inflammatory processes,
while S100B is known to interact with the C-terminal domain of the intracellular tumour
suppressor p53 and promote cancer development. We screened, using waterLOGSY NMR
experiments, 430 molecules of a generic fragment library and we identified different hits for
each protein. The subset of fragments interacting with S100B has very few members in
common with the subset interacting with S100A13. From the 15N-HSQC NMR spectra of the
proteins in the presence of those hits the chemical shift differences ∆δ(HN) were calculated.
Coupling of the experimental data with docking results indicated the most probable docked
conformations of the ligands on the proteins surface. For example: the anti-allergic drug
cromolyn provided for the first time structural information for the interaction, and
demonstrated that cromolyn has a unique binding site on the protein surface.. A relatively
large variety of interaction regions for various ligands were identified for the two proteins,
including known or suggested protein-protein interaction sites. Although, the two proteins
have quite similar quaternary structure and a common binding area (around the hinge loop),

107
our results showed that they have in common only few ligands. This indicates that selective
leads could be developed starting from the different ligands, with high LE values, here
identified. Moreover, this study indicates that screening a family of protein is more
informative than screening one member of the family. Hence, one of the future perspectives
would be to extend this screening study with other members of this S100 family. The library
used for this work is an implementation of a slightly smaller library used for a screening
conducted on the protein cytochrome c (Assfalg et al. Biochemistry 2007, 46, 6232-6238).
The waterLOGSY experiments under the same experimental conditions indicate a hit rate of
about 5%. The experiments conducted reveals 56 hits for S100A13 (51 with moderate and 5
with strong binding), 48 hits for S100B (28 with moderate and 20 with strong shift) and 25
hits for cytochrome c (see Figure 11 in the main text of part 1). Only few of the selected hits
bind on more than one target. This data also indicate that the present library, although small
(partly because it is made by smaller than usual fragments), is well suited to make initial
guesses about selectivity. This was planned to obtain initial hints on the druggability of the
target and to decide how to orient further screening efforts. The next effort will be to build
larger libraries around those fragments which are more promising. Finally, the data reported
in the paper show that α−napthol is able to displace only partially the p53-peptide from
S100B. This shows that it is worth trying to design a α-napthol derivative that could be able
to displace completely the p53-peptide. In the second part of our research our target is to develop additional sources of structural
restraints in SSNMR of metalloproteins, through the analysis of the paramagnetic
contribution. In solution NMR the most used distance restraints are obtained from inter-
residual 1H-1H NOEs. In SSNMR structural information is obtained through 13C-13C dipolar
recoupling techniques, such as Proton Driven Spin Diffusion (PDSD) or CHHC experiments.
Even using additional dihedral angle restraints obtained from backbone chemical shifts
(through Chemical Shift Index (CSI) or TALOS program), the paucity of restraints limits the
size of the affordable proteins, and often require selective labeling techniques. We have
shown how a combined strategy of protein labeling and dilution of the paramagnetic species
allows one to easily separate the pcs contributions originated by the protein internal metal
(intra-molecular pcs) from those due to the metals in neighboring proteins in the crystal
lattice (inter-molecular pcs). We have demonstrated that the intra-molecular pcs allow one
to strongly reduce the number of distance restraints needed to obtain a low-resolution protein
structure. These intra-molecular pcs along with additional restraints, the backbone dihedral
angles determined through programs such as TALOS or Chemical Shift Index (CSI) improve
108
the RMSD of the calculated family of structures. Furthermore, the inter-molecular pcs
provide unique information on the protein arrangement in the solid phase, determining
positions and orientations of neighbouring protein molecules. The results are in good
agreement with X-ray data. This approach is distinctively based on the paramagnetic solid-
state NMR data and can be applied also to ordered non-crystalline systems such as fibrils,
providing useful information on their aggregation state.
Thus a reliable perspective in this sense is the use of paramagnetic based structural restraints,
such as pseudocontact shifts (pcs), to support the diamagnetic based restraints. Since pcs can
be easily determined, and in large amount from the SSNMR protein assignment, they have a
potential great impact in the structural determination allowing, in perspective, a possible
increase in the size of the biomolecules affordable through SSNMR. Besides, pseudocontact
shifts are long distance restraints. Using metals with a sizable anisotropy of the magnetic
susceptibility (Co(II), Ln,…) they can be detected up to 30-35 Å from the paramagnetic
center. For such a reason, it should not be unusual to observe in SSNMR of metalloproteins
inter-molecular pcs, where the metal bound to a protein molecule influences the shifts of
neighboring molecules. Once these contributions are isolated, for example by using
paramagnetically diluted samples, they are useful structural restraints to determine the
protein arrangement in the solid phase. This perspective is especially important as it can be
applied to one-dimensional ordered systems such as amyloids, for which information about
their structure or the protein aggregation are hardly obtained through other techniques as X-
ray diffraction. Moreover, this strategy can be extended to biomolecules that do not bind
metal by using paramagnetic tags. In this case, paramagnetic and diamagnetic analogous
proteins are easily obtained by changing the metal bound in the protein tag. Paramagnetic
restraints should be detected even more easily than in solution NMR, as problems connected
with the mobility of the tag should be absent in the solid phase.
Another interesting future perspective would be the exploitation of paramagnetic NMR in
the solid-state, taking advantage of the technological improvement concerning the
development of fast and very-fast MAS probes, and the accessibility of high-field magnets.
The former would allow a stronger suppression of the paramagnetic shift anisotropy effects
which might make the investigation of metals with strong magnetic susceptibility (such as
lanthanides) possible. The latter is expected to produce an appreciable increase in sensibility
and resolution of paramagnetic SSNMR spectra. Indeed, as in the NMR of paramagnetic
solids the line broadening due to Curie relaxation, which depends on molecular tumbling and
increases with the square of the field, is absent, the sensitivity can sizably increase operating

109
at high magnetic fields. 1H detection in SSNMR is another important perspectives of this
technique. The advantages in the proton detection are connected to its higher sensitivity and
to the possibility to extend the sources of structural restraints. The investigation of
perdeuterated sample, the use of very-fast MAS techniques, as well as the development of 1H homo-decoupling sequences are some possible perspectives of expansion of this field. As
far the study of paramagnetic samples is concerned, the absence of Curie relaxation makes it
possible, in principle, to observe signal much more closer to the metal compared to what can
be done in solution. The proton pcs could thus provide another important source of structural
restraints.
.