from correlation to causation: analysis of metabolomics data … · [email protected] * edoardo...
TRANSCRIPT
Vol.:(0123456789)1 3
Metabolomics (2018) 14:37 https://doi.org/10.1007/s11306-018-1335-y
REVIEW ARTICLE
From correlation to causation: analysis of metabolomics data using systems biology approaches
Antonio Rosato1 · Leonardo Tenori2 · Marta Cascante3 · Pedro Ramon De Atauri Carulla3 · Vitor A. P. Martins dos Santos4,5 · Edoardo Saccenti4
Received: 23 August 2017 / Accepted: 31 January 2018 / Published online: 27 February 2018 © The Author(s) 2018. This article is an open access publication
AbstractIntroduction Metabolomics is a well-established tool in systems biology, especially in the top–down approach. Metabolomics experiments often results in discovery studies that provide intriguing biological hypotheses but rarely offer mechanistic explanation of such findings. In this light, the interpretation of metabolomics data can be boosted by deploying systems biology approaches.Objectives This review aims to provide an overview of systems biology approaches that are relevant to metabolomics and to discuss some successful applications of these methods.Methods We review the most recent applications of systems biology tools in the field of metabolomics, such as network inference and analysis, metabolic modelling and pathways analysis.Results We offer an ample overview of systems biology tools that can be applied to address metabolomics problems. The characteristics and application results of these tools are discussed also in a comparative manner.Conclusions Systems biology-enhanced analysis of metabolomics data can provide insights into the molecular mechanisms originating the observed metabolic profiles and enhance the scientific impact of metabolomics studies.
Keywords Pathway · Network analysis · Correlation network · Association network · Enrichment analysis
1 Introduction
The pioneering experimental work of Mamer and Horning (Horning and Horning 1971; Mamer and Crawhall 1971) and the first application by Pauling (1971) laid the bases for metabolomic profiling of samples. These approaches
constituted the precursors of today’s metabolomics tech-niques. It was with the work of Oliver (1998) and Trethewey (1999) that metabolomics established itself as a standalone discipline and then became a core component of systems biology (SB), providing an integrated view of biochemistry in complex organisms (Nicholson and Lindon 2008). The rapid evolution and spreading of metabolomics leveraged the technical developments of Nuclear Magnetic Resonance (NMR) and Mass Spectroscopy (MS), which made metabo-lomics experiments widely accessible.
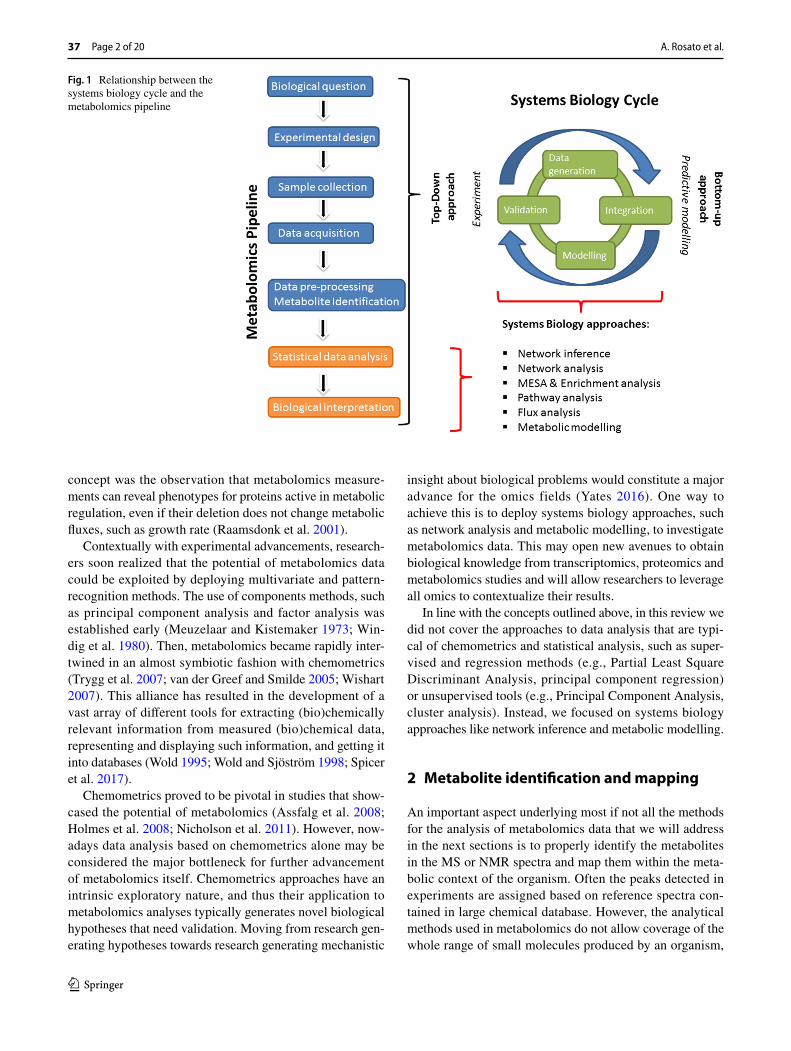
In the top-down approach of SB (see Fig. 1), hypotheses about the regulatory mechanisms are drawn upon the analy-sis of patterns observed in metabolite profiles. Such hypoth-eses can be tested in new experiments in an iterative cycle (Bruggeman and Westerhoff 2007). In fact, metabolomics takes a special position among the omics disciplines in the SB top–down approach: the metabolome is the endpoint of biological processes, carrying imprints of genetic, epige-netic and environmental factors, and thus it can provide the link between genotype and phenotype (Fiehn 2002; Griffin 2006; Krumsiek et al. 2016). A crucial demonstration of this
* Antonio Rosato [email protected]
* Edoardo Saccenti [email protected]
1 Magnetic Resonance Center and Department of Chemistry “Ugo Schiff”, University of Florence, Florence, Italy
2 Department of Experimental and Clinical Medicine, University of Florence, Florence, Italy
3 CIBER de Enfermedades hepáticas y digestivas (CIBERHD, Madrid) and Department of Biochemistry and Molecular Biomedicine, Universitat de Barcelona, Barcelona, Spain
4 Laboratory of Systems and Synthetic Biology, Wageningen University & Research, Wageningen, The Netherlands
5 LifeGlimmer GmbH, Berlin, Germany
A. Rosato et al.
1 3
37 Page 2 of 20
concept was the observation that metabolomics measure-ments can reveal phenotypes for proteins active in metabolic regulation, even if their deletion does not change metabolic fluxes, such as growth rate (Raamsdonk et al. 2001).
Contextually with experimental advancements, research-ers soon realized that the potential of metabolomics data could be exploited by deploying multivariate and pattern-recognition methods. The use of components methods, such as principal component analysis and factor analysis was established early (Meuzelaar and Kistemaker 1973; Win-dig et al. 1980). Then, metabolomics became rapidly inter-twined in an almost symbiotic fashion with chemometrics (Trygg et al. 2007; van der Greef and Smilde 2005; Wishart 2007). This alliance has resulted in the development of a vast array of different tools for extracting (bio)chemically relevant information from measured (bio)chemical data, representing and displaying such information, and getting it into databases (Wold 1995; Wold and Sjöström 1998; Spicer et al. 2017).
Chemometrics proved to be pivotal in studies that show-cased the potential of metabolomics (Assfalg et al. 2008; Holmes et al. 2008; Nicholson et al. 2011). However, now-adays data analysis based on chemometrics alone may be considered the major bottleneck for further advancement of metabolomics itself. Chemometrics approaches have an intrinsic exploratory nature, and thus their application to metabolomics analyses typically generates novel biological hypotheses that need validation. Moving from research gen-erating hypotheses towards research generating mechanistic
insight about biological problems would constitute a major advance for the omics fields (Yates 2016). One way to achieve this is to deploy systems biology approaches, such as network analysis and metabolic modelling, to investigate metabolomics data. This may open new avenues to obtain biological knowledge from transcriptomics, proteomics and metabolomics studies and will allow researchers to leverage all omics to contextualize their results.
In line with the concepts outlined above, in this review we did not cover the approaches to data analysis that are typi-cal of chemometrics and statistical analysis, such as super-vised and regression methods (e.g., Partial Least Square Discriminant Analysis, principal component regression) or unsupervised tools (e.g., Principal Component Analysis, cluster analysis). Instead, we focused on systems biology approaches like network inference and metabolic modelling.
2 Metabolite identification and mapping
An important aspect underlying most if not all the methods for the analysis of metabolomics data that we will address in the next sections is to properly identify the metabolites in the MS or NMR spectra and map them within the meta-bolic context of the organism. Often the peaks detected in experiments are assigned based on reference spectra con-tained in large chemical database. However, the analytical methods used in metabolomics do not allow coverage of the whole range of small molecules produced by an organism,
Fig. 1 Relationship between the systems biology cycle and the metabolomics pipeline
From correlation to causation: analysis of metabolomics data using systems biology approaches
1 3
Page 3 of 20 37
introducing possible biases in the interpretation of whole-organism metabolism. Although this is a very broad theme, in this section we will try to summarize the features of some tools for metabolite mapping that can be exploited in the context of systems biology approaches.
Metabolome Searcher (Dhanasekaran et al. 2015) is a web-based application (http://procy c.westc ent.usu.edu/cgi-bin/Metab oSear cher.cgi) to directly search genome-con-structed metabolic databases. Its aim is to enhance the iden-tification of MS data by using compound databases derived empirically. Incorporating information on genome-encoded metabolism facilitates the identification of MS peaks that may not be present in standard chemical databases. Only the compounds that the organism of interest is able to produce, based on its genome, are investigated for potential matches. The output metabolites are mapped also to known metabolic pathways.
The MassTRIX web server (Suhre and Schmitt-Kopp-lin 2008) (http://masst rix3.helmh oltz-muenc hen.de/masst rix3/) addresses the annotation of putative metabolites by providing a hypothesis-driven approach to interpret MS data. MassTRIX processes the submitted list of raw mass peaks by comparing the input experimental masses against all chemical compounds of the Kyoto Encyclopedia of Genes and Genomes (KEGG) database (Kanehisa et al. 2015, 2017), additionally including 13C, 15N and other isotopes and optionally adding selected lipids. Then it presents the identified chemical compounds in their genomic context as differentially coloured objects on KEGG pathway maps. By adding transcriptomics data or information on differences in the gene complement (e.g. samples from different bacte-rial strains), the user can interpret the metabolic state of the organism in the context of its actual or potential enzymatic capacities.
A similar approach was also employed in MetaMapp (Barupal et al. 2012). MetaMapp is a tool to integrate bio-chemical pathways (using the KEGG reactant pair database) and chemical relationships (using the Tanimoto chemical similarity score and the mass spectral similarity score of the National Institute of Standards and Technology, NIST) to map the metabolites detected in MS and/or NMR experi-ments in a network graph. Such graphs can be displayed in Cytoscape (Shannon et al. 2003). MetaMapp is independent of the experimental technology utilized to identify metabo-lomics profiles, thus providing a way to integrate and visual-ize data from different metabolomics platforms.
MetExplore (Cottret et al. 2010) is a computational pipe-line designed to map chemical libraries on genome-scale metabolic networks. This tool can be used to obtain statistics on the experimental coverage of organism-specific metabolic networks. The main purpose of MetExplore is to provide an interactive visualization of metabolic networks (or sub-networks) to mine metabolomics (and other “omics”) data.
After the mapping is performed, MetExplore permits to visualize metabolites in the context of the whole network, a specific pathway, a selection of pathways or a selection of reactions.
Another recent tool integrating automated analysis of mass spectrometry data and visualization of biological con-text by linking each metabolite to one or more biological pathways (see also next section) is the Polyomics integrated Metabolomics Pipeline (PiMP) (Gloaguen et al. 2017). This tool annotates metabolites identified in mass spectrometry experiments, providing direct access to the experimental fea-tures supporting each annotation, and then allows users to jump directly to the pathway(s) relevant for each metabolite. However, this is a visualization tool and does not perform pathway analysis as described in Sect. 6.
Pre-existing biochemical knowledge about metabolic pathways may provide useful information for the assign-ment of unknown compounds in large metabolomics data-sets. Gipson et al. (2008) exploited this idea by developing a computational protocol to improve UPLS-MS metabolite assignment through the matching of peak correlation pairs (from acquired MS data) with a database of biochemically relevant interaction pairs (pathway data from the KEEG database). A stochastic local search optimization algorithm was implemented to select the putative peak assignment that maximizes both the correlations and the strength of corre-lations in each cluster of MS peaks, in agreement with the most likely metabolic pathway from the database.
Integrated approaches that combine transcriptome, pro-teome and metabolome profiling have gained popularity and have proven to provide novel insights in the understanding of the biological systems (Cho et al. 2008; Jiang et al. 2015; Kolbe et al. 2006). A first approach to the interpretation of complex omics experiments is the joined visualization of the data on templates that collect previous knowledge. In this frame, the Paintomics web server (http://www.paint omics .org) (García-Alcalde et al. 2011) provides a simple but effective resource for integrated visualization in studies where transcriptomics and metabolomics data are generated on the same set of samples. The inputs to the server are gene expression and metabolite quantifications, which are then displayed on KEGG maps.
The web-based ProMeTra system (Neuweger et al. 2009) (https ://omict ools.com/prome tra-tool) allows users to com-bine datasets from heterogeneous multiple-omics sources. This tool visualizes and combines datasets from transcrip-tomics, proteomics, and metabolomics on user defined met-abolic pathway maps. ProMeTra supports pathway maps designed and annotated by the users.
There are only a few tools explicitly devoted to the analysis of metabolomics data. Metscape (Gao et al. 2010) (metscape.ncibi.org) is a plug-in for Cytoscape (Shan-non et al. 2003), developed to visualize and interpret
A. Rosato et al.
1 3
37 Page 4 of 20
metabolomics data in the context of human metabolic networks. Metscape allows users to trace the connections between metabolites and genes, visualize compound net-works and display compound structures as well as informa-tion for reactions, enzymes, genes, and pathways. Experi-mental data can be visualized and explored as networks and as a function of time or experimental conditions. A subse-quent redesign of Metscape (Metscape 2) (Karnovsky et al. 2012) allows users to enter experimental data and display them in the context of relevant metabolic networks to iden-tify enriched pathways from expression profiling data.
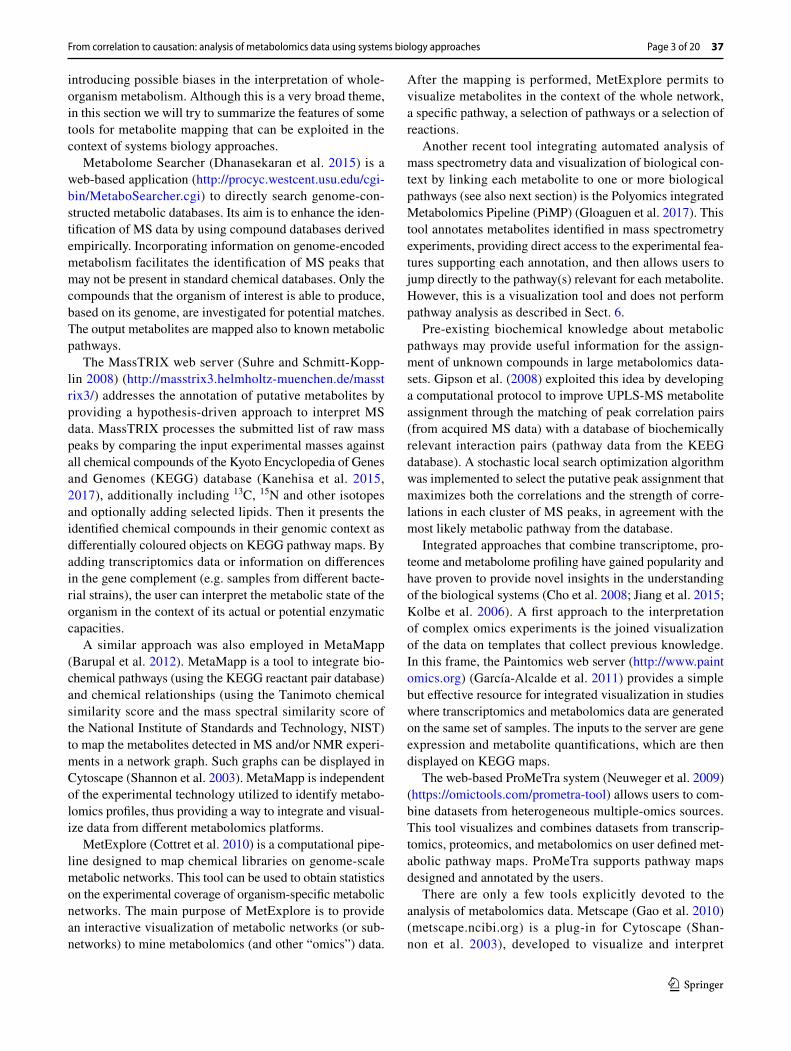
Table 1 presents a list of the tools for mapping metabo-lites into biochemical pathways mentioned in this section.
3 Analysis of metabolomics data using network approaches
The most natural extension and complementation of methods based on covariance/correlation for the analysis of multivari-ate metabolomics data [such as principal component analy-sis or covariance simultaneous component analysis (Smilde et al. 2015)] is their representation and analysis as networks. Networks constitute a powerful view to understand biologi-cal systems where not only the individual components are considered, but also their interconnections and their function as a whole (Ma’ayan 2011; Weckwerth and Fiehn 2002).
Table 1 Tools for mapping metabolites into biochemical pathways
Name Description Reference URL
NA Refine mass assignments through the intersection of peak correlation pairs with a database of biochemically relevant interaction pairs
Gipson et al. (2008) NA
Metabolome Searcher Simplify database search in MS data-bases by limiting the query to genome plausible metabolites
Dhanasekaran et al. (2015) http://procy c.westc ent.usu.edu/cgi-bin/Metab oSear cher.cgi
MassTRIX Presents the MS identified chemical compounds in their genomic context as differentially coloured objects on KEGG pathway maps
Suhre and Schmitt-Kopplin (2008) http://masst rix3.helmh oltz-muenc hen.de/masst rix3/
MetaMapp Map the detected metabolites in a MS experiment in a network graph
Barupal et al. (2012) NA
MetExplore To provide an interactive visualization of metabolic networks (or sub-net-works) to mine metabolomics data
Cottret et al. (2010) http://metex plore .toulo use.inra.fr/jooml a3/index .php
Paintomics Provide a simple but effective resource for integrated visualization in studies where transcriptomics and metabo-lomics data are generated on the same set of samples
García-Alcalde et al. (2011) http://www.paint omics .org
KaPPa-View A web-based tool for representing quan-titative data for individual transcripts and/or metabolites on plant metabolic pathway maps
Tokimatsu et al. (2005) http://kpv.kazus a.or.jp/
MapMan A user-driven tool that displays large data sets onto diagrams of metabolic pathways or other processes
Thimm et al. (2004) http://mapma n.gabip d.org/web/guest
ProMeTra Visualizes and combines datasets from transcriptomics, proteomics, and metabolomics on user defined meta-bolic pathway maps, with the ability to generate enriched SVG images or animations via a user-friendly web interface
Neuweger et al. (2009) https ://omict ools.com/prome tra-tool
Metscape Allows users to trace the connections between metabolites and genes, visual-ize compound networks and display compound structures as well as infor-mation for reactions, enzymes, genes, and pathways
Gao et al. (2010) http://metsc ape.ncibi .org/
From correlation to causation: analysis of metabolomics data using systems biology approaches
1 3
Page 5 of 20 37
A biological network is a graphic representation of objects (called nodes) and their relationships (described by links or edges). It can be conveniently described using a matrix, termed adjacency or connectivity matrix A. The rows and columns of A represent the nodes, i.e. metabolite concentrations or abundances. Here, we refer generically to metabolite concentration. Strictly speaking, this is correct only for targeted metabolomics experiments where the con-centrations of metabolites are determined using appropriate standards. In general, MS experiments provide metabolite abundances, which can be considered a proxy for concentra-tions, whereas NMR provides quantities in arbitrary units that are proportional to concentrations. However, from a numerical point of view this is not relevant for the compu-tational methods presented here, but it might be relevant for the biological interpretation of the data. The non-zero elements of A are real numbers that describe the strength of the relationship between any two nodes. The relationship between two metabolites can be very diverse in nature: for instance, one can postulate the existence of such relation-ship if their concentration levels are highly correlated, if they participate in the same metabolic pathway, or if they are directly connected through some biochemical reaction. Within this context, it should be noted that metabolomics data can be used to reconstruct metabolic networks at dif-ferent levels (topology, stoichiometry, directionality and kinetics) using dedicated experiments. In this review, we focus on the application of network approaches to analyze metabolomics data that usually have not been gathered with the aim of reconstructing entire metabolic networks. For the latter purpose, the typical starting point is genome data (see also some of the tools mentioned in the previous section and in Table 1). Nevertheless, some approaches are available to build genome-scale metabolic networks from raw high reso-lution mass spectroscopy data (Jourdan et al. 2007; Moritz et al. 2017). Methods to reconstruct metabolic networks have been reviewed elsewhere (Frainay and Jourdan 2017; Hen-drickx 2013; Hendrickx et al. 2011).
Table 2 presents a list of network-based methods applica-ble to metabolomics studies. These methods are discussed in the following sections.
3.1 Association networks
The nodes in a network are associated (connected) based on some similarity measure: in metabolomics the similarity between metabolites, and thus their association, is usually expressed using Pearson or Spearman’s correlation indexes. Consequently, the elements of the corresponding adjacency matrix are in the interval [−1, 1] (Cakır et al. 2009). This kind of networks is sometimes called correlation or rele-vance networks. Biological information can be derived con-sidering both the magnitude and the sign of correlations: for instance, strong positive correlation ( |𝜌| > 0.9 ) between two metabolites can indicate a condition of rapid equilibrium or enzyme dominance, while strong negative correlation can indicate the presence of a conserved moiety (Camacho et al. 2005). In general, the correlations observed in metabo-lomics data are the result of the combination of all reactions and regulatory processes in the network (Hendrickx 2013; Stelling et al. 2004; Steuer et al. 2003). Surprisingly, there may be no correlation between metabolites that are close in a metabolic pathway. For instance, in wild type potato tubers, glutamate and glutamine are metabolic neighbors in the glutamine synthase pathway, but appear to be uncor-related (ρ = 0.0243, Spearman). Instead, valine and methio-nine are strongly correlated (ρ = 0.951) even if they are not metabolic neighbors (Camacho et al. 2005; Weckwerth et al. 2004). The information encoded in the correlation matrix may be not fully sufficient to reverse engineer the underly-ing enzymatic system (Steuer et al. 2003). Still, it can be used as a proxy to describe a given physiological state of the system of interest, as the correlation matrix can change with the steady-state concentrations of metabolites (Fukushima et al. 2011). It is then reasonable to assume that differences or communalities in the biological processes are reflected in the characteristics of the inferred correlation networks (Szymanski et al. 2009). This is the rationale for the use of association networks to analyse metabolomics data.
The zero elements of the adjacency matrix can be selected based on the statistical significance of the pairwise metabo-lite correlations. This was the approach used in (Ursem et al. 2008), one of the first papers to deploy a network approach
Table 2 List of network inference methods used in metabolomics studies
Acronym Name Reference
ARACNE Algorithm for the reconstruction of accurate cellular networks Margolin et al. (2006)CLR Context likelihood of relatedness algorithm Faith et al. (2007)CORR CorrelationPCLRC Probabilistic context likelihood of relatedness of correlation algorithm Saccenti et al. (2014)PIUmet Prize-collecting Steiner forest algorithm for integrative analysis of untargeted metabo-
lomicsPirhaji et al. (2016b)
WCGNA Weighted correlation gene network analysis Zhang and Horvath (2005)
A. Rosato et al.
1 3
37 Page 6 of 20
to the analysis of metabolomics data, where Pearson correla-tions were calculated among pairs of metabolites measured using gas chromatography–mass spectrometry (GC–MS) in tomato samples. The advantage over principal compo-nent analysis (PCA) is that network plots do not focus on the representation of maximum variation in data matrices, which may negatively affects data interpretation. Indeed, the relationships between metabolites whose variation is spread out over several principal axes can be easily overlooked in PCA biplots (Ursem et al. 2008). The work of Ursem et al. (2008) built on previous works, where correlation analy-sis was used to unravel molecular mechanisms (Kose et al. 2001; Roessner et al. 2001; Steuer et al. 2003; Urbanczyk-Wochniak et al. 2003).
Yang et al. (2012) performed a correlation network analysis on urine metabolomics data from patients suf-fering of central precocious puberty taking a hybrid approach. First, they identified metabolites discriminating between cases and controls using a Partial Least Squares (PLS) approach and then mapped them on a reconstruction of a global human metabolic network using the KEGG database (Kanehisa et al. 2015, 2017). The discriminating metabolites had significantly higher degree, betweeness and closeness than the global network.
Another commonly used approach is to binarize the adjacency matrix by imposing a threshold τ for the correla-tion | ρ| between any pair of metabolites and/or a threshold α on the associated P-value. This is usually called hard thresholding, as exemplified below:
The choice of the threshold τ is fundamental since it ulti-mately drives the topology of the resulting networks. In an analysis of tissue- and/or genotype-dependent metabolomics correlations in Arabidopsis, Fukushima et al. investigated the effect of varying the correlation threshold and found that the number of groups of connected metabolites showed a transition from small to large at τ = 0.5, which they sub-sequently used (Fukushima et al. 2011). They commented that such a threshold does not guarantee explicit biological significance. However, this value is not far from 0.6, which was indicated as a lower bound for low/weak correlations in metabolomics data (Camacho et al. 2005) and used by other authors (Ghini et al. 2015; Saccenti et al. 2016; Suarez-Diez and Saccenti 2015). Szymanski et al. (2009) applied a threshold α = 0.01 on the P-value of the correlation after Bonferroni correction for multiple testing and used boot-strapping to obtain robust correlation estimation.
The patterns of correlations between metabolites can be compared across different conditions to identify
(1)Aij→
{1 if
|||𝜌ij||| > 𝜏 (and P < 𝛼)
0 otherwise
associations that are disrupted or altered by pathophysi-ological conditions with respect to a healthy or control status, an approach referred to as differential network analysis. Hu et al. (2015) addressed the problem of finding disrupted connections in osteoarthritis by taking a statisti-cal approach that exploited a permutation test to assess the significance of changes in the correlations of two metabo-lites across different conditions. Similarly, Szymanski et al. (2009) considered metabolite correlation networks from Escherichia coli exposed to different environmental stress conditions and compared network characteristics to pinpoint possible mechanisms underlying stress response.
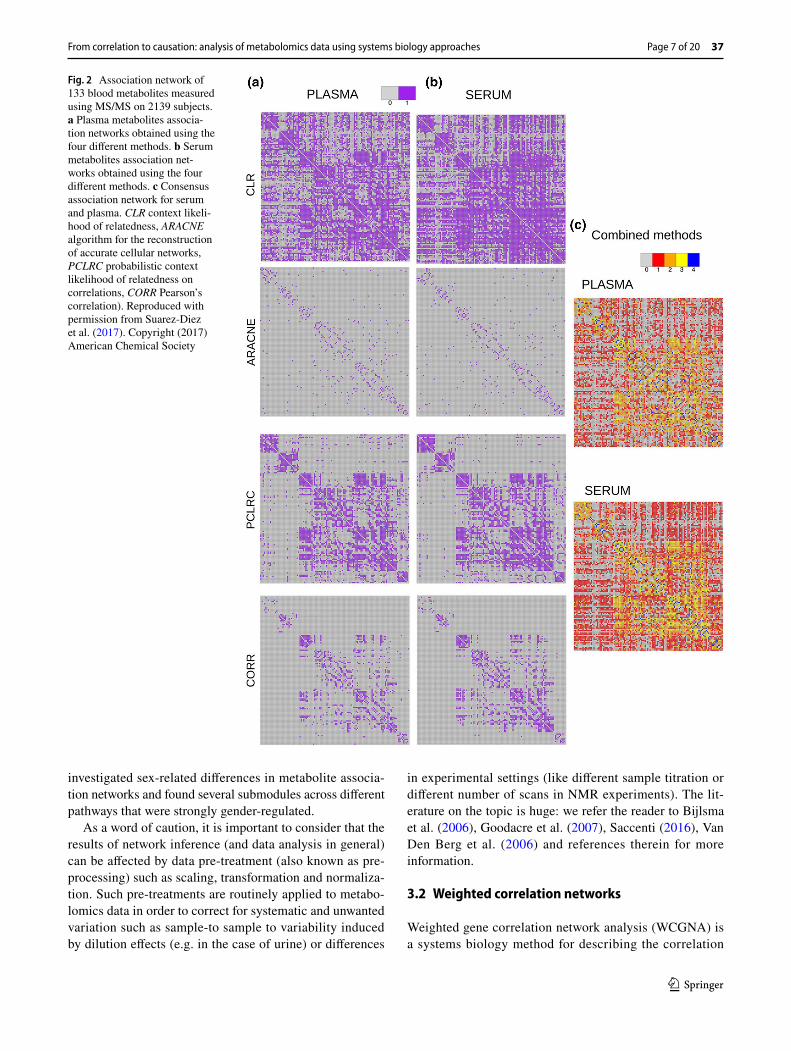
Saccenti et al. (2014) investigated the latent cardiovascu-lar risk of healthy subjects by considering highly connected metabolites, the so called hubs, and reported differential behaviour of Very Low Density Lipoprotein (VLDL) and glucose in high and low risk cardiovascular risk networks. They applied a combined method, by analysing association networks with a multivariate approach to highlight differ-ences among networks pertaining to different risk pheno-types (see Fig. 2). Hubs are nodes that are much more con-nected than average or typical nodes, and consequently are very likely to play crucial biological roles. The concept of hubs was first introduced within the analysis of yeast pro-tein–protein interaction networks (Jeong et al. 2001).
The correlations observed for metabolomics data are usually small ( |𝜌| < 0.6 ) because of the systemic nature of metabolic control. As previously mentioned, two metabolites can be poorly correlated even if they are neighbours in a metabolic pathway because the variance in the enzymes that control them can affect their levels to the same extent and in different directions (Camacho et al. 2005). Metabolites are generated through fast biochemical reactions in an open mass-flow system. Consequently, they can be considered to be in a quasi-steady state when compared to the time scales of the upstream regulatory processes. This results also in indirect, system-wide correlations between distantly con-nected metabolites (Lee et al. 2008). The latter phenom-enon can be taken into account using partial correlations, i.e. considering pairwise correlation between two variables with the effect of a set of controlling random variables removed. Krumsiek et al. (2011) used Gaussian graphical models, a type of undirected network representation where the relationships among metabolites are expressed as partial correlations, to analyse a large human population cohort. They found this approach to generate more sparse and robust networks with modular structure than those based on Pear-son’s correlations, and observed that high partial correla-tion coefficients generally correspond to known metabolic reactions. This is a striking result since associations in a correlation networks do not necessarily correspond to and/or represent metabolic reactions (Marcotte 2001; Steuer et al. 2003). Using the same approach, Krumsiek et al. (2015)
From correlation to causation: analysis of metabolomics data using systems biology approaches
1 3
Page 7 of 20 37
investigated sex-related differences in metabolite associa-tion networks and found several submodules across different pathways that were strongly gender-regulated.
As a word of caution, it is important to consider that the results of network inference (and data analysis in general) can be affected by data pre-treatment (also known as pre-processing) such as scaling, transformation and normaliza-tion. Such pre-treatments are routinely applied to metabo-lomics data in order to correct for systematic and unwanted variation such as sample-to sample to variability induced by dilution effects (e.g. in the case of urine) or differences
in experimental settings (like different sample titration or different number of scans in NMR experiments). The lit-erature on the topic is huge: we refer the reader to Bijlsma et al. (2006), Goodacre et al. (2007), Saccenti (2016), Van Den Berg et al. (2006) and references therein for more information.
3.2 Weighted correlation networks
Weighted gene correlation network analysis (WCGNA) is a systems biology method for describing the correlation
Fig. 2 Association network of 133 blood metabolites measured using MS/MS on 2139 subjects. a Plasma metabolites associa-tion networks obtained using the four different methods. b Serum metabolites association net-works obtained using the four different methods. c Consensus association network for serum and plasma. CLR context likeli-hood of relatedness, ARACNE algorithm for the reconstruction of accurate cellular networks, PCLRC probabilistic context likelihood of relatedness on correlations, CORR Pearson’s correlation). Reproduced with permission from Suarez-Diez et al. (2017). Copyright (2017) American Chemical Society
A. Rosato et al.
1 3
37 Page 8 of 20
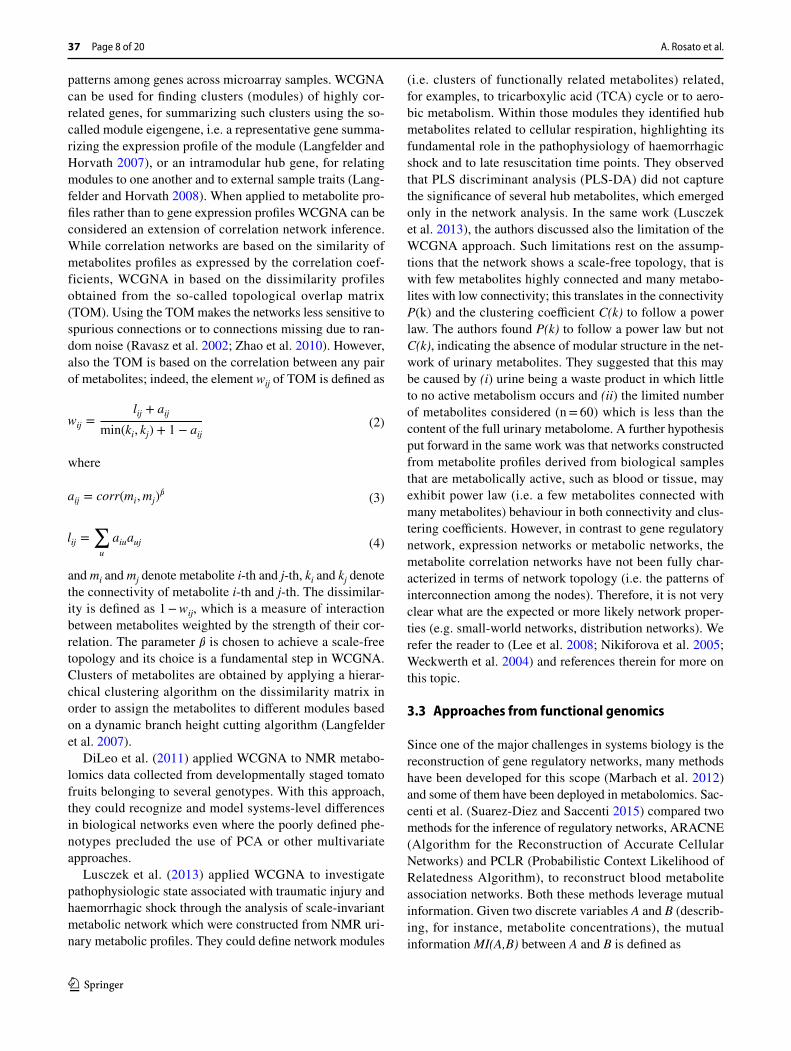
patterns among genes across microarray samples. WCGNA can be used for finding clusters (modules) of highly cor-related genes, for summarizing such clusters using the so-called module eigengene, i.e. a representative gene summa-rizing the expression profile of the module (Langfelder and Horvath 2007), or an intramodular hub gene, for relating modules to one another and to external sample traits (Lang-felder and Horvath 2008). When applied to metabolite pro-files rather than to gene expression profiles WCGNA can be considered an extension of correlation network inference. While correlation networks are based on the similarity of metabolites profiles as expressed by the correlation coef-ficients, WCGNA in based on the dissimilarity profiles obtained from the so-called topological overlap matrix (TOM). Using the TOM makes the networks less sensitive to spurious connections or to connections missing due to ran-dom noise (Ravasz et al. 2002; Zhao et al. 2010). However, also the TOM is based on the correlation between any pair of metabolites; indeed, the element wij of TOM is defined as
where
and mi and mj denote metabolite i-th and j-th, ki and kj denote the connectivity of metabolite i-th and j-th. The dissimilar-ity is defined as 1 − wij, which is a measure of interaction between metabolites weighted by the strength of their cor-relation. The parameter � is chosen to achieve a scale-free topology and its choice is a fundamental step in WCGNA. Clusters of metabolites are obtained by applying a hierar-chical clustering algorithm on the dissimilarity matrix in order to assign the metabolites to different modules based on a dynamic branch height cutting algorithm (Langfelder et al. 2007).
DiLeo et al. (2011) applied WCGNA to NMR metabo-lomics data collected from developmentally staged tomato fruits belonging to several genotypes. With this approach, they could recognize and model systems-level differences in biological networks even where the poorly defined phe-notypes precluded the use of PCA or other multivariate approaches.
Lusczek et al. (2013) applied WCGNA to investigate pathophysiologic state associated with traumatic injury and haemorrhagic shock through the analysis of scale-invariant metabolic network which were constructed from NMR uri-nary metabolic profiles. They could define network modules
(2)wij =lij + aij
min(ki, kj) + 1 − aij
(3)aij = corr(mi,mj)�
(4)lij =∑
u
aiuauj
(i.e. clusters of functionally related metabolites) related, for examples, to tricarboxylic acid (TCA) cycle or to aero-bic metabolism. Within those modules they identified hub metabolites related to cellular respiration, highlighting its fundamental role in the pathophysiology of haemorrhagic shock and to late resuscitation time points. They observed that PLS discriminant analysis (PLS-DA) did not capture the significance of several hub metabolites, which emerged only in the network analysis. In the same work (Lusczek et al. 2013), the authors discussed also the limitation of the WCGNA approach. Such limitations rest on the assump-tions that the network shows a scale-free topology, that is with few metabolites highly connected and many metabo-lites with low connectivity; this translates in the connectivity P(k) and the clustering coefficient C(k) to follow a power law. The authors found P(k) to follow a power law but not C(k), indicating the absence of modular structure in the net-work of urinary metabolites. They suggested that this may be caused by (i) urine being a waste product in which little to no active metabolism occurs and (ii) the limited number of metabolites considered (n = 60) which is less than the content of the full urinary metabolome. A further hypothesis put forward in the same work was that networks constructed from metabolite profiles derived from biological samples that are metabolically active, such as blood or tissue, may exhibit power law (i.e. a few metabolites connected with many metabolites) behaviour in both connectivity and clus-tering coefficients. However, in contrast to gene regulatory network, expression networks or metabolic networks, the metabolite correlation networks have not been fully char-acterized in terms of network topology (i.e. the patterns of interconnection among the nodes). Therefore, it is not very clear what are the expected or more likely network proper-ties (e.g. small-world networks, distribution networks). We refer the reader to (Lee et al. 2008; Nikiforova et al. 2005; Weckwerth et al. 2004) and references therein for more on this topic.
3.3 Approaches from functional genomics
Since one of the major challenges in systems biology is the reconstruction of gene regulatory networks, many methods have been developed for this scope (Marbach et al. 2012) and some of them have been deployed in metabolomics. Sac-centi et al. (Suarez-Diez and Saccenti 2015) compared two methods for the inference of regulatory networks, ARACNE (Algorithm for the Reconstruction of Accurate Cellular Networks) and PCLR (Probabilistic Context Likelihood of Relatedness Algorithm), to reconstruct blood metabolite association networks. Both these methods leverage mutual information. Given two discrete variables A and B (describ-ing, for instance, metabolite concentrations), the mutual information MI(A,B) between A and B is defined as
From correlation to causation: analysis of metabolomics data using systems biology approaches
1 3
Page 9 of 20 37
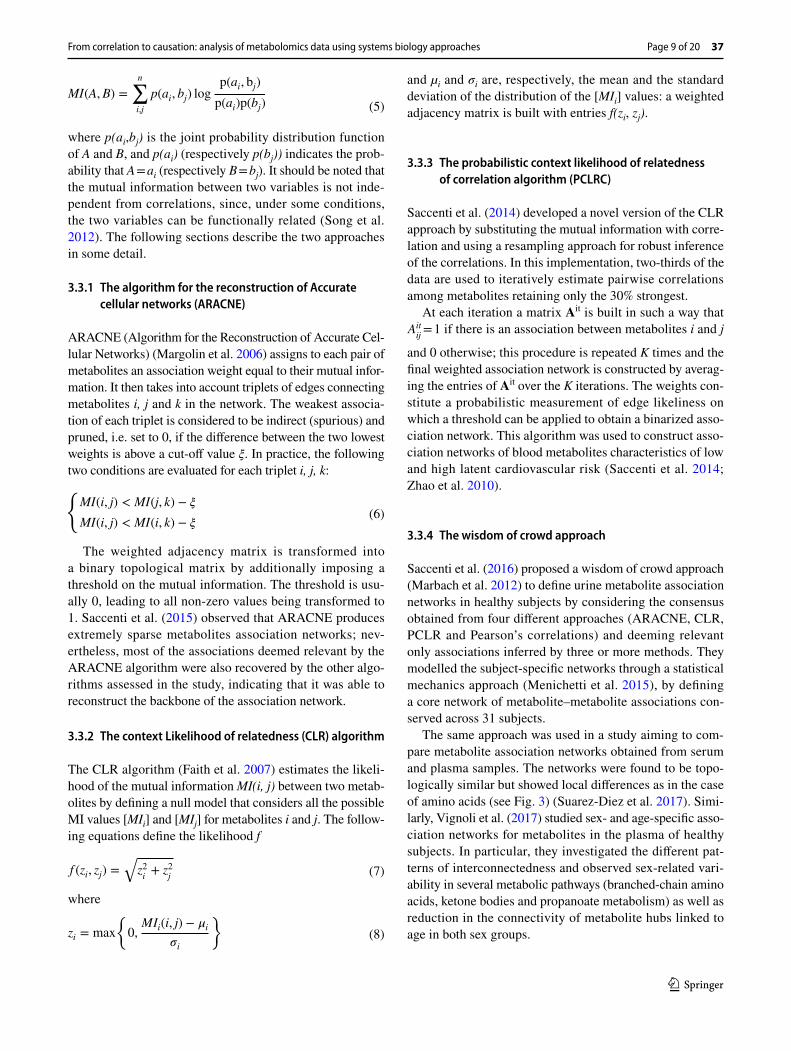
where p(ai,bj) is the joint probability distribution function of A and B, and p(ai) (respectively p(bj)) indicates the prob-ability that A = ai (respectively B = bj). It should be noted that the mutual information between two variables is not inde-pendent from correlations, since, under some conditions, the two variables can be functionally related (Song et al. 2012). The following sections describe the two approaches in some detail.
3.3.1 The algorithm for the reconstruction of Accurate cellular networks (ARACNE)
ARACNE (Algorithm for the Reconstruction of Accurate Cel-lular Networks) (Margolin et al. 2006) assigns to each pair of metabolites an association weight equal to their mutual infor-mation. It then takes into account triplets of edges connecting metabolites i, j and k in the network. The weakest associa-tion of each triplet is considered to be indirect (spurious) and pruned, i.e. set to 0, if the difference between the two lowest weights is above a cut-off value ξ. In practice, the following two conditions are evaluated for each triplet i, j, k:
The weighted adjacency matrix is transformed into a binary topological matrix by additionally imposing a threshold on the mutual information. The threshold is usu-ally 0, leading to all non-zero values being transformed to 1. Saccenti et al. (2015) observed that ARACNE produces extremely sparse metabolites association networks; nev-ertheless, most of the associations deemed relevant by the ARACNE algorithm were also recovered by the other algo-rithms assessed in the study, indicating that it was able to reconstruct the backbone of the association network.
3.3.2 The context Likelihood of relatedness (CLR) algorithm
The CLR algorithm (Faith et al. 2007) estimates the likeli-hood of the mutual information MI(i, j) between two metab-olites by defining a null model that considers all the possible MI values [MIi] and [MIj] for metabolites i and j. The follow-ing equations define the likelihood f
where
(5)MI(A,B) =
n∑
i,j
p(ai, bj) logp(ai, bj)
p(ai)p(bj)
(6)
{MI(i, j) < MI(j, k) − 𝜉
MI(i, j) < MI(i, k) − 𝜉
(7)f (zi, zj) =
√z2i+ z2
j
(8)zi = max
{0,
MIi(i, j) − �i
�i
}
and µi and σi are, respectively, the mean and the standard deviation of the distribution of the [MIi] values: a weighted adjacency matrix is built with entries f(zi, zj).
3.3.3 The probabilistic context likelihood of relatedness of correlation algorithm (PCLRC)
Saccenti et al. (2014) developed a novel version of the CLR approach by substituting the mutual information with corre-lation and using a resampling approach for robust inference of the correlations. In this implementation, two-thirds of the data are used to iteratively estimate pairwise correlations among metabolites retaining only the 30% strongest.
At each iteration a matrix Ait is built in such a way that Aitij = 1 if there is an association between metabolites i and j
and 0 otherwise; this procedure is repeated K times and the final weighted association network is constructed by averag-ing the entries of Ait over the K iterations. The weights con-stitute a probabilistic measurement of edge likeliness on which a threshold can be applied to obtain a binarized asso-ciation network. This algorithm was used to construct asso-ciation networks of blood metabolites characteristics of low and high latent cardiovascular risk (Saccenti et al. 2014; Zhao et al. 2010).
3.3.4 The wisdom of crowd approach
Saccenti et al. (2016) proposed a wisdom of crowd approach (Marbach et al. 2012) to define urine metabolite association networks in healthy subjects by considering the consensus obtained from four different approaches (ARACNE, CLR, PCLR and Pearson’s correlations) and deeming relevant only associations inferred by three or more methods. They modelled the subject-specific networks through a statistical mechanics approach (Menichetti et al. 2015), by defining a core network of metabolite–metabolite associations con-served across 31 subjects.
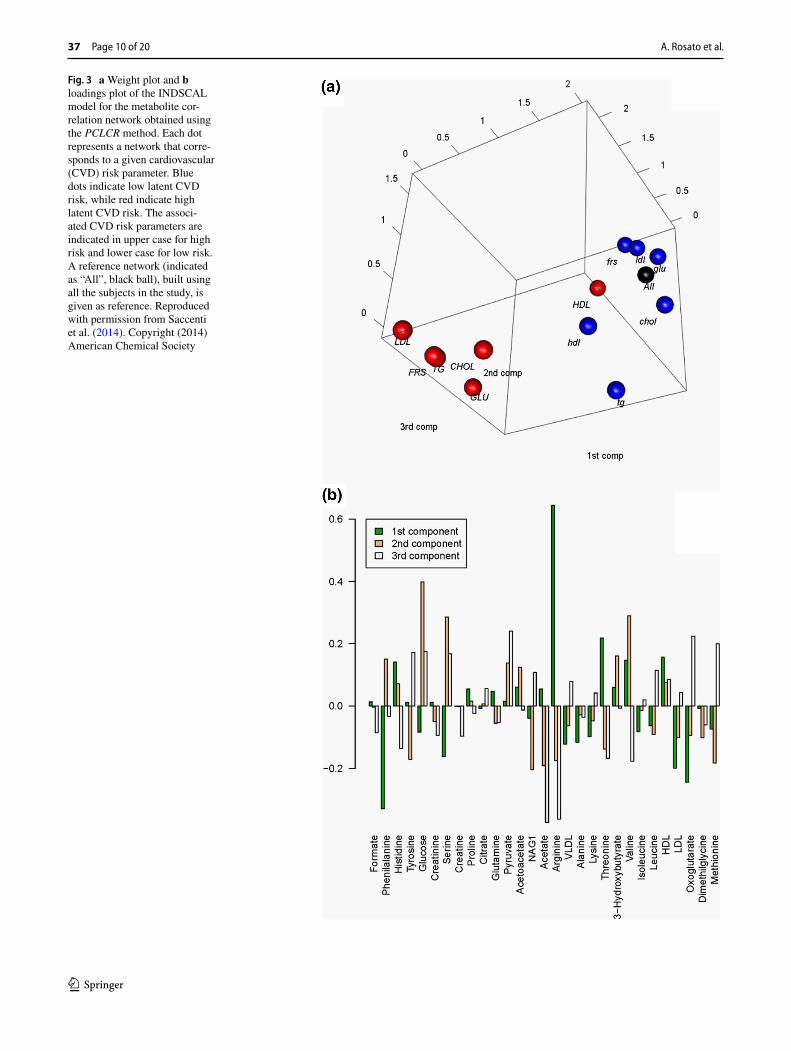
The same approach was used in a study aiming to com-pare metabolite association networks obtained from serum and plasma samples. The networks were found to be topo-logically similar but showed local differences as in the case of amino acids (see Fig. 3) (Suarez-Diez et al. 2017). Simi-larly, Vignoli et al. (2017) studied sex- and age-specific asso-ciation networks for metabolites in the plasma of healthy subjects. In particular, they investigated the different pat-terns of interconnectedness and observed sex-related vari-ability in several metabolic pathways (branched-chain amino acids, ketone bodies and propanoate metabolism) as well as reduction in the connectivity of metabolite hubs linked to age in both sex groups.
A. Rosato et al.
1 3
37 Page 10 of 20
Fig. 3 a Weight plot and b loadings plot of the INDSCAL model for the metabolite cor-relation network obtained using the PCLCR method. Each dot represents a network that corre-sponds to a given cardiovascular (CVD) risk parameter. Blue dots indicate low latent CVD risk, while red indicate high latent CVD risk. The associ-ated CVD risk parameters are indicated in upper case for high risk and lower case for low risk. A reference network (indicated as “All”, black ball), built using all the subjects in the study, is given as reference. Reproduced with permission from Saccenti et al. (2014). Copyright (2014) American Chemical Society
From correlation to causation: analysis of metabolomics data using systems biology approaches
1 3
Page 11 of 20 37
3.3.5 Other methods
Pirhaij et al. (2016a) used their algorithm PIUmet (http://fraen kel-nsf.csbi.mit.edu/PIUMe t/) to analyse and inter-pret untargeted liquid chromatography–mass spectrometry (LC–MS) data from lipidomics and phosphoproteomics experiments in a cell-line model of Huntington’s disease. Grounding on database information, the algorithm infers the identity of unassigned metabolites corresponding to features and the molecular mechanisms underlying their dysregu-lation. This innovative approach helps to reduce the bias towards well-studied metabolites typical of targeted metabo-lomics. The algorithm takes as input a list of LC–MS peaks that differ between two different conditions and searches for them in a databases containing over 42,000 nodes (either proteins or metabolites) connected by over one million weighted edges representing interactions between proteins as well as enzymatic and transporter reactions. The output is a subnetwork of the database representing metabolic path-ways that are dysregulated under the conditions considered.
4 Kinetic models
The metabolism is a network structure that can be approached as a system of interdependent variables that ena-ble mathematical modelling through kinetic models. These models are defined as systems of ordinary differential equa-tions describing the time course of metabolite concentrations as a function of rate laws that account for enzyme catalysis. The development of these models requires to know both the network structure and the reaction kinetics and parameters (Klipp et al. 2004). On the one hand, there is a large accu-mulated knowledge regarding the network structure, which is stored in databases like KEGG (Kanehisa et al. 2012), MetaCyc (Caspi et al. 2016) or Biomodels (Chelliah et al. 2015). Although this is a well-studied cellular level, the true structures can be importantly affected by factors like com-partmentalization (de Mas et al. 2011; Nicolae et al. 2014) enzyme complexes and metabolic channelling (Castellana et al. 2014; Ovadi 1991). On the other hand, regarding reac-tion kinetics, there is also an accumulated knowledge, which can be explored in databases such as BRENDA (Scheer et al. 2011; Schomburg et al. 2013) or SABIO-RK (Wittig et al. 2012).
However, the details on enzyme kinetic parameters are available only for a minor part of the latter reactions (Büchel et al. 2013). In addition, the available measurements of the kinetic properties of enzymes historically come from sys-tems reconstituted in vitro using purified enzymes (Savageau 1992). In this setting, the ideal conditions of homogeneity and free diffusion are fulfilled, and consequently the result-ing models may neglect some factors affecting the kinetic
properties, such as molecular crowding (Schnell and Turner 2004) and limited diffusion (Alekseev et al. 2016). To over-come these limitations, alternative approaches combine sampling methods with the integration of systemic avail-able data and in vivo observations (fluxes, concentrations, perturbation experiments, …) (Andreozzi et al. 2016; Saa and Nielsen 2016; Stanford et al. 2013).
Alternative approaches take advantage of the current availability of data regarding the network structure and of the lineal nature of the system used to describe it, to apply optimization techniques to infer flux distributions (Fouladiha and Marashi 2017). Genome—scale models accounting for thousands of reactions are currently available (Chelliah et al. 2015; King et al. 2016; Swainston et al. 2016).
For those models including only the network structure as well as for complete kinetic models, it is useful to adopt techniques based on stable isotopes to know about the inter-nal distribution of the metabolism. These are addressed in the next section.
5 Metabolic flux modelling using stable isotope resolved metabolomics data
Although the analysis of metabolite correlative networks may not grasp the complete underlying metabolic mecha-nisms, it is certainly a valuable tool for the exploration of metabolomics data, as shown by the budding literature on the topic. The use of stable isotopes can provide a greater insight on the mechanisms that underlie the observed metab-olomics profiles, permitting a direct analysis of mechanistic changes in metabolism. Each chemical reaction or transport process involved in a metabolic pathway is associated with a rate (flux) of transformation or transport. Mechanistic changes at the level of the metabolism are likely to produce changes in the distribution of fluxes. Intracellular fluxes are not directly measurable, but the use of stable isotope-enriched nutrients, such as 1,2-13C2-glucose or 13C5,15N2-glutamine, in in cell culture media and the application of Stable Isotope Resolved Metabolomics (SIRM) (Fan et al. 2012; Higashi et al. 2014) provides clues about the redistri-bution of carbon atoms along metabolic pathways. This can be used to estimate information about fluxes, such as their relative or absolute magnitudes (Lee 2006; Zamboni et al. 2005).
The estimation of fluxes based on the measured patterns of stable isotope labeling (especially using 13C) relies upon a combination of different methods, going from the direct interpretation of the labeling patterns to computational model-based approaches (Buescher et al. 2015; Niedenführ et al. 2015). Frequently, direct interpretation of labeling patterns is sufficient to provide information on the relative activities of pathways, on qualitative changes in pathway
A. Rosato et al.
1 3
37 Page 12 of 20
contributions via alternative metabolic routes, and on nutri-ent contribution to the production of different metabolites (Buescher et al. 2015). A recent example is the direct inter-pretation of the contributions of isotopic labeling tracers like 1,2-13C2-glucose to the synthesys of pentoses phosphate (Dong et al. 2017). The entry of this tracer into the oxida-tive pentose phosphate pathway results in the loss of the 13C tracer in position 1 in 1,2-13C2-glucose, contributing to the synthesis of ribose phosphate molecules that contain only one 13C atom (usually named M+1 pool of ribose-5-phos-phate). Instead, the entry into the non-oxidative pentose phosphate pathway results in the synthesis of ribose phos-phate molecules that contain two 13C atoms (usually named M+2 pool of ribose-5-phosphate). The subsequent entry of M+1 pentose-phosphate into glycolysis contributes to the synthesis of triose phosphate and lactate molecules with one 13C atom (M+1). An approximate estimation of the rela-tive importance of oxidative versus non-oxidative pentose phosphate pathway fluxes can be inferred from the M+1/M+2 ratio of the RNA-derived ribose. During the last years, the use of this and other isotopic labelling tracers have been applied to unveil the different metabolic pathways activated in cancer cells (see for a review Dong et al. 2017).
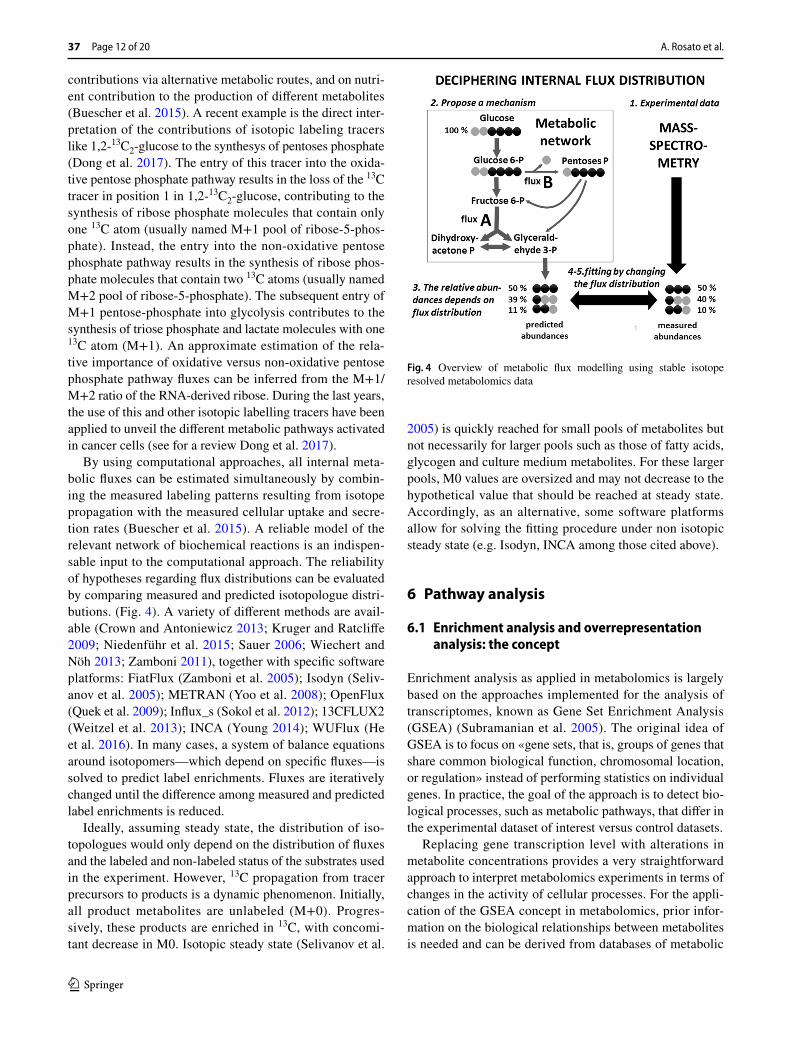
By using computational approaches, all internal meta-bolic fluxes can be estimated simultaneously by combin-ing the measured labeling patterns resulting from isotope propagation with the measured cellular uptake and secre-tion rates (Buescher et al. 2015). A reliable model of the relevant network of biochemical reactions is an indispen-sable input to the computational approach. The reliability of hypotheses regarding flux distributions can be evaluated by comparing measured and predicted isotopologue distri-butions. (Fig. 4). A variety of different methods are avail-able (Crown and Antoniewicz 2013; Kruger and Ratcliffe 2009; Niedenführ et al. 2015; Sauer 2006; Wiechert and Nöh 2013; Zamboni 2011), together with specific software platforms: FiatFlux (Zamboni et al. 2005); Isodyn (Seliv-anov et al. 2005); METRAN (Yoo et al. 2008); OpenFlux (Quek et al. 2009); Influx_s (Sokol et al. 2012); 13CFLUX2 (Weitzel et al. 2013); INCA (Young 2014); WUFlux (He et al. 2016). In many cases, a system of balance equations around isotopomers—which depend on specific fluxes—is solved to predict label enrichments. Fluxes are iteratively changed until the difference among measured and predicted label enrichments is reduced.
Ideally, assuming steady state, the distribution of iso-topologues would only depend on the distribution of fluxes and the labeled and non-labeled status of the substrates used in the experiment. However, 13C propagation from tracer precursors to products is a dynamic phenomenon. Initially, all product metabolites are unlabeled (M+0). Progres-sively, these products are enriched in 13C, with concomi-tant decrease in M0. Isotopic steady state (Selivanov et al.
2005) is quickly reached for small pools of metabolites but not necessarily for larger pools such as those of fatty acids, glycogen and culture medium metabolites. For these larger pools, M0 values are oversized and may not decrease to the hypothetical value that should be reached at steady state. Accordingly, as an alternative, some software platforms allow for solving the fitting procedure under non isotopic steady state (e.g. Isodyn, INCA among those cited above).
6 Pathway analysis
6.1 Enrichment analysis and overrepresentation analysis: the concept
Enrichment analysis as applied in metabolomics is largely based on the approaches implemented for the analysis of transcriptomes, known as Gene Set Enrichment Analysis (GSEA) (Subramanian et al. 2005). The original idea of GSEA is to focus on «gene sets, that is, groups of genes that share common biological function, chromosomal location, or regulation» instead of performing statistics on individual genes. In practice, the goal of the approach is to detect bio-logical processes, such as metabolic pathways, that differ in the experimental dataset of interest versus control datasets.
Replacing gene transcription level with alterations in metabolite concentrations provides a very straightforward approach to interpret metabolomics experiments in terms of changes in the activity of cellular processes. For the appli-cation of the GSEA concept in metabolomics, prior infor-mation on the biological relationships between metabolites is needed and can be derived from databases of metabolic
Fig. 4 Overview of metabolic flux modelling using stable isotope resolved metabolomics data
From correlation to causation: analysis of metabolomics data using systems biology approaches
1 3
Page 13 of 20 37
pathways and reactions (see Table 3 for a list of databases), such as KEGG (Kanehisa et al. 2015, 2017) or MetaCyc (Caspi et al. 2008), or computed based on the similarity of chemical structures (Moreno et al. 2015).
A related approach is the so called over-representation analysis (ORA, sometimes called annotation enrichment analysis) where one checks whether a group of differentially expressed genes is enriched for a pathway or ontology term by using overlap statistics such as the cumulative hypergeo-metric distribution (Doniger et al. 2003; Zhong et al. 2004). In contrast with GSEA, ORA does not involve a quantitative assessment of the change in metabolite concentrations. In practice, the application of a hypergeometric test or Fisher’s exact test, with appropriate corrections for multiple testing (e.g. Bonferroni), allows researchers to evaluate whether specific pathways containing metabolites in an experiment-derived list are overrepresented. If the input list contains metabolites featuring different concentrations in different phenotypes (e.g. healthy versus diseased) then the analy-sis will identify pathways associated with the phenotype changes.
6.2 Metabolite set enrichment analysis (MSEA)
In the application of the GSEA concept to metabolomics, MSEA takes into consideration a quantitative measure asso-ciated to each metabolite (e.g. concentration). As the first step of the analysis, metabolites are assigned to specific sets based on one or more reference databases. A group of metabolites are assigned to the same set if they are known to be: (i) involved in the same biological processes (i.e., metabolic pathways, signaling pathways, taken from KEGG) (Kanehisa et al. 2015, 2017); (ii) changed significantly under
the same pathological conditions (i.e., various metabolic diseases, taken from the Human Metabolome Database, HMDB) (Wishart et al. 2013) and (iii) present in the same locations such as organs, tissues, or cellular organelles (e.g., also from HMDB).
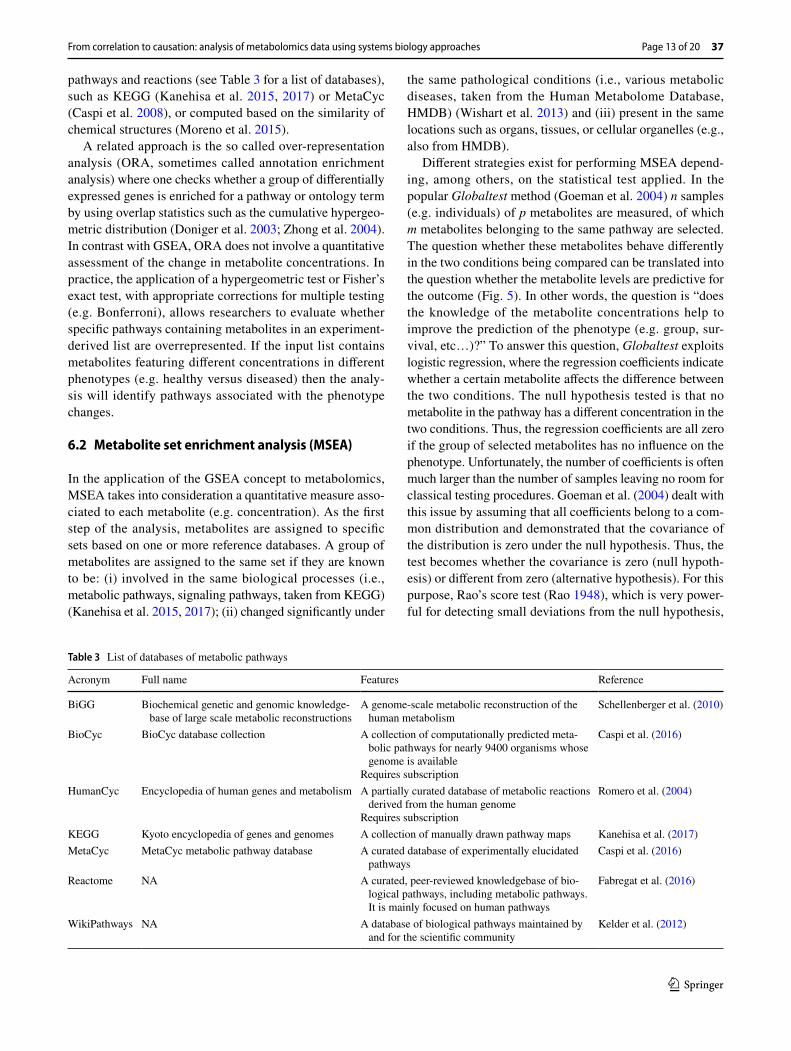
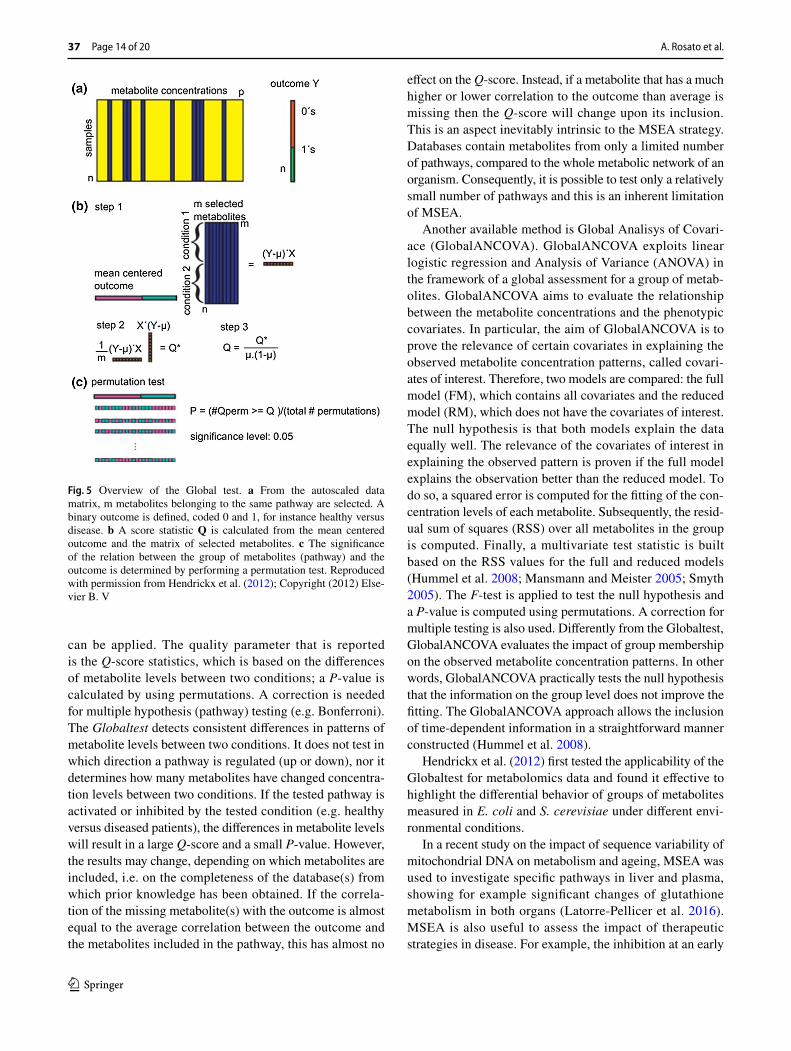
Different strategies exist for performing MSEA depend-ing, among others, on the statistical test applied. In the popular Globaltest method (Goeman et al. 2004) n samples (e.g. individuals) of p metabolites are measured, of which m metabolites belonging to the same pathway are selected. The question whether these metabolites behave differently in the two conditions being compared can be translated into the question whether the metabolite levels are predictive for the outcome (Fig. 5). In other words, the question is “does the knowledge of the metabolite concentrations help to improve the prediction of the phenotype (e.g. group, sur-vival, etc…)?” To answer this question, Globaltest exploits logistic regression, where the regression coefficients indicate whether a certain metabolite affects the difference between the two conditions. The null hypothesis tested is that no metabolite in the pathway has a different concentration in the two conditions. Thus, the regression coefficients are all zero if the group of selected metabolites has no influence on the phenotype. Unfortunately, the number of coefficients is often much larger than the number of samples leaving no room for classical testing procedures. Goeman et al. (2004) dealt with this issue by assuming that all coefficients belong to a com-mon distribution and demonstrated that the covariance of the distribution is zero under the null hypothesis. Thus, the test becomes whether the covariance is zero (null hypoth-esis) or different from zero (alternative hypothesis). For this purpose, Rao’s score test (Rao 1948), which is very power-ful for detecting small deviations from the null hypothesis,
Table 3 List of databases of metabolic pathways
Acronym Full name Features Reference
BiGG Biochemical genetic and genomic knowledge-base of large scale metabolic reconstructions
A genome-scale metabolic reconstruction of the human metabolism
Schellenberger et al. (2010)
BioCyc BioCyc database collection A collection of computationally predicted meta-bolic pathways for nearly 9400 organisms whose genome is available
Requires subscription
Caspi et al. (2016)
HumanCyc Encyclopedia of human genes and metabolism A partially curated database of metabolic reactions derived from the human genome
Requires subscription
Romero et al. (2004)
KEGG Kyoto encyclopedia of genes and genomes A collection of manually drawn pathway maps Kanehisa et al. (2017)MetaCyc MetaCyc metabolic pathway database A curated database of experimentally elucidated
pathwaysCaspi et al. (2016)
Reactome NA A curated, peer-reviewed knowledgebase of bio-logical pathways, including metabolic pathways. It is mainly focused on human pathways
Fabregat et al. (2016)
WikiPathways NA A database of biological pathways maintained by and for the scientific community
Kelder et al. (2012)
A. Rosato et al.
1 3
37 Page 14 of 20
can be applied. The quality parameter that is reported is the Q-score statistics, which is based on the differences of metabolite levels between two conditions; a P-value is calculated by using permutations. A correction is needed for multiple hypothesis (pathway) testing (e.g. Bonferroni). The Globaltest detects consistent differences in patterns of metabolite levels between two conditions. It does not test in which direction a pathway is regulated (up or down), nor it determines how many metabolites have changed concentra-tion levels between two conditions. If the tested pathway is activated or inhibited by the tested condition (e.g. healthy versus diseased patients), the differences in metabolite levels will result in a large Q-score and a small P-value. However, the results may change, depending on which metabolites are included, i.e. on the completeness of the database(s) from which prior knowledge has been obtained. If the correla-tion of the missing metabolite(s) with the outcome is almost equal to the average correlation between the outcome and the metabolites included in the pathway, this has almost no
effect on the Q-score. Instead, if a metabolite that has a much higher or lower correlation to the outcome than average is missing then the Q-score will change upon its inclusion. This is an aspect inevitably intrinsic to the MSEA strategy. Databases contain metabolites from only a limited number of pathways, compared to the whole metabolic network of an organism. Consequently, it is possible to test only a relatively small number of pathways and this is an inherent limitation of MSEA.
Another available method is Global Analisys of Covari-ace (GlobalANCOVA). GlobalANCOVA exploits linear logistic regression and Analysis of Variance (ANOVA) in the framework of a global assessment for a group of metab-olites. GlobalANCOVA aims to evaluate the relationship between the metabolite concentrations and the phenotypic covariates. In particular, the aim of GlobalANCOVA is to prove the relevance of certain covariates in explaining the observed metabolite concentration patterns, called covari-ates of interest. Therefore, two models are compared: the full model (FM), which contains all covariates and the reduced model (RM), which does not have the covariates of interest. The null hypothesis is that both models explain the data equally well. The relevance of the covariates of interest in explaining the observed pattern is proven if the full model explains the observation better than the reduced model. To do so, a squared error is computed for the fitting of the con-centration levels of each metabolite. Subsequently, the resid-ual sum of squares (RSS) over all metabolites in the group is computed. Finally, a multivariate test statistic is built based on the RSS values for the full and reduced models (Hummel et al. 2008; Mansmann and Meister 2005; Smyth 2005). The F-test is applied to test the null hypothesis and a P-value is computed using permutations. A correction for multiple testing is also used. Differently from the Globaltest, GlobalANCOVA evaluates the impact of group membership on the observed metabolite concentration patterns. In other words, GlobalANCOVA practically tests the null hypothesis that the information on the group level does not improve the fitting. The GlobalANCOVA approach allows the inclusion of time-dependent information in a straightforward manner constructed (Hummel et al. 2008).
Hendrickx et al. (2012) first tested the applicability of the Globaltest for metabolomics data and found it effective to highlight the differential behavior of groups of metabolites measured in E. coli and S. cerevisiae under different envi-ronmental conditions.
In a recent study on the impact of sequence variability of mitochondrial DNA on metabolism and ageing, MSEA was used to investigate specific pathways in liver and plasma, showing for example significant changes of glutathione metabolism in both organs (Latorre-Pellicer et al. 2016). MSEA is also useful to assess the impact of therapeutic strategies in disease. For example, the inhibition at an early
Fig. 5 Overview of the Global test. a From the autoscaled data matrix, m metabolites belonging to the same pathway are selected. A binary outcome is defined, coded 0 and 1, for instance healthy versus disease. b A score statistic Q is calculated from the mean centered outcome and the matrix of selected metabolites. c The significance of the relation between the group of metabolites (pathway) and the outcome is determined by performing a permutation test. Reproduced with permission from Hendrickx et al. (2012); Copyright (2012) Else-vier B. V
From correlation to causation: analysis of metabolomics data using systems biology approaches
1 3
Page 15 of 20 37
of glutamine metabolism induces extensive changes in the metabolism of other amino acids but also of the oxidation of branched-chain fatty acids in pancreatic ductal adenocar-cinoma cells (Biancur et al. 2017).
6.3 Over representation analysis (ORA)
The most traditional strategy for enrichment analysis in tran-scriptomics is to take the user’s preselected list of ‘inter-esting’ genes e.g. genes showing differential expression between two conditions and then iteratively test the enrich-ment of their annotation terms; Gene Ontology (GO) terms are often used for this purpose. The annotation terms passing the enrichment P-value threshold are then reported in a tabu-lar format, usually ordered by the enrichment probability or P-value. The calculation of the enrichment P-value is related to the number of genes in the list that share the same annota-tion terms. For example, Gorilla (Eden et al. 2009) enables GO enrichment analysis in ranked lists of genes. Ranking is usually done as a function of expression level or of fold-change in expression. The method identifies, independently for each GO term, the threshold at which the most significant enrichment is obtained. The significance score is corrected for threshold multiple testing. The null assumption is that all configurations of GO term occurrence in the ranked list are equiprobable.
To apply ORA to pathway analysis, the user provides one or more lists of identifiers representing genes/proteins/metabolites significantly associated with the effect of inter-est. In order to reduce the potential bias when the number of such measured entities is small it is advisable to provide also background lists of all measured genes/proteins/metabolites. Otherwise, all the entities in the predefined pathway data-base, or in a user-selected sub-ensemble of pathways, are taken into account and used as the background list. Based on the occurrence of its entities within the input lists, the signif-icance of each pathway is assessed by means of a statistical test. ORA analyzes whether, for a given list of metabolites with significantly different concentrations, one particular pathway is overrepresented, i.e. there are more metabolites in the list from that pathway than would be expected by chance. A major difference of ORA with respect to MSEA is that it does not take into account the extent of the fold change of the abundance of metabolites in the list of signifi-cant entities: the inclusion of any metabolite in the list typi-cally depends on a fixed arbitrary threshold. In some tools for ORA, however ranked lists are provided, i.e. metabolites are sorted based on the fold-change of their concentration (or their P-values). The analysis focuses on whether com-mon terms tend to occur towards the top or the bottom of the list (Kankainen et al. 2011). An application of ORA to patients with mild cognitive impairment (MCI), a transition phase between normal aging and Alzheimer’s disease (AD),
showed that the pentose phosphate pathway was differently regulated in MCI patients who later progressed to AD with respect to patients who remained stable (Oresic et al. 2011).
The common weakness of tools performing ORA is that the linear output of terms can be very large and over-whelming (from hundreds to thousands), and this can make difficult to grasp potential interrelationships of relevant terms. In addition, the quality of the pre-selected metabo-lite lists has a deep influence on the enrichment analysis, making the output unpredictably sensitive to changing statistical methods or cutoff thresholds. In particular, it is inappropriate to use all the metabolites of the metabolite set library as the reference metabolome, because there is no analytical platform that can measure all these metabo-lites with the same probability. Thus, the choice of the platform rather than the experimental conditions may cause the observed metabolite enrichment. To tackle this problem, the user may upload a platform-specific reference metabolome. This is an option provided, for example, in the implementation available in MetaboAnalyst (Xia et al. 2015). Finally, since multiple hits on a given pathway are required to achieve statistical significance, ORA is of lim-ited usefulness for small-sized pathways like glutathione biosynthesis pathway, which contains only ten compounds.
Due to their intrinsic differences, MSEA and ORA may not give the same results and potentially lead to unlike biological interpretation of the same experimental data. This has been demonstrated for a small set of microar-ray data, where different GO terms and therefore differ-ent biological processes were identified by Globaltest and GOEAST (a web-tool for the analysis of GO term enrich-ment) (Hulsegge et al. 2009).
6.4 Pathway activity profiling (PAPi)
PAPi allows users to compare the activity of metabolic pathways under different experimental conditions (Aggio et al. 2010). The underlying concept is to associate Activ-ity Scores to each pathway in a set obtained from the KEGG database by averaging the relative abundance of all detected metabolites assigned to that pathway, normal-ized by a scaling factor that takes into account that not all metabolites are detected. The comparison of Activity Scores under two or more different experimental condi-tions for the same pathway can pinpoint changes in activ-ity that are statistically significant, as assessed by a two-sample t-test or by ANOVA. PAPi can provide information regarding the impact of environmental conditions and stimuli on metabolite uptake and intracellular metabolic overflow. Metabolic pathway activity is directly related to metabolic flux distribution and thus this kind of analysis can tie directly to fluxomics.
A. Rosato et al.
1 3
37 Page 16 of 20
7 Concluding remarks
The systems biology approach to the interpretation of metabolomics has the potential to unravel the causative mechanisms leading to the observed metabolomics profile. In this way, there is a paradigm shift from the chemometrics framework that makes metabolomics a hypothesis-generat-ing research field to a framework where metabolomics can provide insights into the biological properties of cell and organism functioning. This shift will unlock the potential of metabolomics and related omics disciplines, such as fluxom-ics and lipidomics, to fully contribute to the advancement of our understanding of health and disease. In this review, we addressed approaches based on association networks and on pathway analysis. These are useful tools to grasp the com-plexity of metabolomic profiles; however, they are not suf-ficient to understand fully the intricacies of the metabolism without dedicated experiments.
Many of the methods described here exploit the lessons learned in other, more mature omics, mainly genomics and transcriptomics, e.g. regarding the validation of their theo-retical frameworks. As mentioned several times, a major caveat in untargeted metabolomics is the impossibility of measuring all metabolites in the sample, whose conse-quences are very difficult to predict.
Acknowledgements We thank José Camacho and Fabien Jourdan for the fruitful comments on the manuscript. MC acknowledges support of CIBERHD (CIBER de enfermedades hepáticas y respiratorias, Madrid) and of the Icrea Academia and 2017-SGR-1033 (AGAUR, Generalitat de Catalunya). This work was supported by the European Commission funded FP7 project INFECT (Contract No. 305280) and by H2020 project PhenoMeNal (Contract No. 654241).
Compliance with ethical standards
Conflict of interest All authors declare that they have no conflict of interest.
Ethical approval This article does not contain any studies with human participants or animals performed by any of the authors.
Open Access This article is distributed under the terms of the Crea-tive Commons Attribution 4.0 International License (http://creat iveco mmons .org/licen ses/by/4.0/), which permits unrestricted use, distribu-tion, and reproduction in any medium, provided you give appropriate credit to the original author(s) and the source, provide a link to the Creative Commons license, and indicate if changes were made.
References
Aggio, R. B., Ruggiero, K., & Villas-Bôas, S. G. (2010). Pathway Activity Profiling (PAPi): From the metabolite profile to the metabolic pathway activity. Bioinformatics, 26, 2969–2976.
Alekseev, A. E., et al. (2016). Restrictions in ATP diffusion within sarcomeres can provoke ATP-depleted zones impairing exer-cise capacity in chronic obstructive pulmonary disease. Bio-chimica et Biophysica Acta (BBA)-General Subjects, 1860, 2269–2278.
Andreozzi, S., Miskovic, L., & Hatzimanikatis, V. (2016). iSCHRUNK–in silico approach to characterization and reduction of uncertainty in the kinetic models of genome-scale metabolic networks. Metabolic Engineering, 33, 158–168.
Assfalg, M., et al. (2008). Evidence of different metabolic phenotypes in humans. Proceedings of the National Academy of Sciences of the United States of America, 105, 1420–1424.
Barupal, D. K., et al. (2012). MetaMapp: Mapping and visualizing metabolomic data by integrating information from biochemical pathways and chemical and mass spectral similarity. BMC Bio-informatics, 13, 99.
Biancur, D. E., et al. (2017). Compensatory metabolic networks in pancreatic cancers upon perturbation of glutamine metabolism. Nature Communication, 8, 15965.
Bijlsma, S., et al. (2006). Large-scale human metabolomics studies: A strategy for data (pre-) processing and validation. Analytical Chemistry, 78, 567–574.
Bruggeman, F. J., & Westerhoff, H. V. (2007). The nature of systems biology. Trends in Microbiology, 15, 45–50.
Büchel, F., …Le, N., & Novère (2013). Path2Models: Large-scale generation of computational models from biochemical pathway maps. BMC Systems Biology, 7, 116.
Buescher, J. M., et al. (2015). A roadmap for interpreting 13 C metabo-lite labeling patterns from cells. Current Opinion in Biotechnol-ogy, 34, 189–201.
Cakır, T., Hendriks, M. M., Westerhuis, J. A., & Smilde, A. K. (2009). Metabolic network discovery through reverse engineering of metabolome data. Metabolomics, 5, 318–329.
Camacho, D., de la Fuente, A., & Mendes, P. (2005). The origin of cor-relations in metabolomics data. Metabolomics, 1, 53–63.
Caspi, R., et al. (2008). The metaCyc database of metabolic pathways and enzymes and the BioCyc collection of pathway/genome data-bases. Nucleic Acids Research, 36, D623–D631.
Caspi, R., et al. (2016). The MetaCyc database of metabolic pathways and enzymes and the BioCyc collection of pathway/genome data-bases. Nucleic Acids Research, 44, D471–D480.
Castellana, M., et al. (2014). Enzyme clustering accelerates processing of intermediates through metabolic channeling. Nature Biotech-nology, 32, 1011–1018. https ://doi.org/10.1038/nbt.3018.
Chelliah, V., et al. (2015). BioModels: Ten-year anniversary. Nucleic Acids Research, 43, D542-8. https ://doi.org/10.1093/nar/gku11 81.
Cho, K., et al. (2008). Integrated transcriptomics, proteomics, and metabolomics analyses to survey ozone responses in the leaves of rice seedling. Journal of Proteome Research, 7, 2980–2998. https ://doi.org/10.1021/pr800 128q.
Cottret, L., et al. (2010). MetExplore: A web server to link metabo-lomic experiments and genome-scale metabolic networks. Nucleic Acids Research, 38, W132–W137.
Crown, S. B., & Antoniewicz, M. R. (2013). Parallel labeling experi-ments and metabolic flux analysis: Past, present and future meth-odologies. Metabolic Engineering, 16, 21–32.
de Mas, I. M., et al. (2011). Compartmentation of glycogen metabo-lism revealed from 13C isotopologue distributions. BMC Systems Biology, 5, 175.
Dhanasekaran, A. R., Pearson, J. L., Ganesan, B., & Weimer, B. C. (2015). Metabolome searcher: A high throughput tool for metab-olite identification and metabolic pathway mapping directly from mass spectrometry and using genome restriction. BMC Bioinfor-matics, 16, 62.
From correlation to causation: analysis of metabolomics data using systems biology approaches
1 3
Page 17 of 20 37
DiLeo, M. V., Strahan, G. D., den Bakker, M., & Hoekenga, O. A. (2011). Weighted correlation network analysis (WGCNA) applied to the tomato fruit metabolome. PLoS ONE, 6, e26683.
Dong, W., Keibler, M. A., & Stephanopoulos, G. (2017). Review of metabolic pathways activated in cancer cells as determined through isotopic labeling and network analysis. Metabolic Engi-neering, 43, 113–124.
Doniger, S. W., Salomonis, N., Dahlquist, K. D., Vranizan, K., Lawlor, S. C., & Conklin, B. R. (2003). MAPPFinder: Using gene ontol-ogy and GenMAPP to create a global gene-expression profile from microarray data. Genome Biology, 4, R7–R7.
Eden, E., Navon, R., Steinfeld, I., Lipson, D., & Yakhini, Z. (2009). GOrilla: A tool for discovery and visualization of enriched GO terms in ranked gene lists. BMC Bioinformatics, 10, 48. https ://doi.org/10.1186/1471-2105-10-48.
Fabregat, A., et al. (2016). The reactome pathway knowledgebase. Nucleic Acids Research, 44, D481–D487.
Faith, J. J., et al. (2007). Large-scale mapping and validation of escherichia coli transcriptional regulation from a compendium of expression profiles. PLoS Biology, 5, e8.
Fan, T. W.-M., Lorkiewicz, P. K., Sellers, K., Moseley, H. N., Higashi, R. M., & Lane, A. N. (2012). Stable isotope-resolved metabo-lomics and applications for drug development. Pharmacology & Therapeutics, 133, 366–391.
Fiehn, O. (2002). Metabolomics–the link between genotypes and phe-notypes. Plant molecular biology, 48, 155–171.
Fouladiha, H., & Marashi, S. A. (2017). Biomedical applications of cell- and tissue-specific metabolic network models. Journal of Biomedical Informatics, 68, 35–49. https ://doi.org/10.1016/j.jbi.2017.02.014.
Frainay, C., & Jourdan, F. (2017). Computational methods to identify metabolic sub-networks based on metabolomic profiles. Briefings in bioinformatics, 18, 43–56.
Fukushima, A., Kusano, M., Redestig, H., Arita, M., & Saito, K. (2011). Metabolomic correlation-network modules in Arabidop-sis based on a graph-clustering approach. BMC System Biology .https ://doi.org/10.1186/1752-0509-5-1.
Gao, J., et al. (2010). Metscape: A Cytoscape plug-in for visualizing and interpreting metabolomic data in the context of human meta-bolic networks. Bioinformatics, 26, 971–973.
García-Alcalde, F., García-López, F., Dopazo, J., & Conesa, A. (2011). Paintomics: A web based tool for the joint visualization of transcriptomics and metabolomics data. Bioinformatics, 27, 137–139.
Ghini, V., Saccenti, E., Tenori, L., Assfalg, M., & Luchinat, C. (2015). Allostasis and resilience of the human individual metabolic phe-notype. Journal of Proteome Research, 14, 2951–2962. https ://doi.org/10.1021/acs.jprot eome.5b002 75.
Gipson, G. T., Tatsuoka, K. S., Sokhansanj, B. A., Ball, R. J., & Connor, S. C. (2008). Assignment of MS-based metabolomic datasets via compound interaction pair mapping. Metabolomics, 4, 94–103.
Gloaguen, Y., et al. (2017). PiMP my metabolome: An integrated, web-based tool for LC-MS metabolomics data. Bioinformatics. https ://doi.org/10.1093/bioin forma tics/btx49 9.
Goeman, J. J., Van De Geer, S. A., De Kort, F., & Van Houwelingen, H. C. (2004). A global test for groups of genes: Testing association with a clinical outcome. Bioinformatics, 20, 93–99.
Goodacre, R., et al. (2007). Proposed minimum reporting standards for data analysis in metabolomics. Metabolomics, 3, 231–241.
Griffin, J. L. (2006). The Cinderella story of metabolic profiling: Does metabolomics get to go to the functional genomics ball? Philo-sophical Transactions of the Royal Society of London B, 361, 147–161.
He, L., Wu, S. G., Zhang, M., Chen, Y., & Tang, Y. J. (2016). WUFlux: An open-source platform for 13 C metabolic flux analysis of bacterial metabolism. BMC Bioinformatics, 17, 444.
Hendrickx, D. M. (2013). Network inference from time-resolved metab-olomics data. Amsterdam: University of Amsterdam.
Hendrickx, D. M., Hendriks, M. M., Eilers, P. H., Smilde, A. K., & Hoefsloot, H. C. (2011). Reverse engineering of metabolic net-works, a critical assessment. Molecular BioSystems, 7, 511–520.
Hendrickx, D. M., Hoefsloot, H. C. J., Hendriks, M. M. W. B., Canelas, A. B., & Smilde, A. K. (2012). Global test for metabolic pathway differences between conditions. Analytica Chimica Acta, 719, 8–15. https ://doi.org/10.1016/j.aca.2011.12.051.
Higashi, R. M., Fan, T. W.-M., Lorkiewicz, P. K., Moseley, H. N., & Lane, A. N. (2014). Stable isotope-labeled tracers for metabolic pathway elucidation by GC-MS and FT-M. In D. Raftery (Ed.), Mass spectrometry in metabolomics: Methods and protocols (pp. 147–167). New York: Humana Press
Holmes, E., et al. (2008). Human metabolic phenotype diversity and its association with diet and blood pressure. Nature, 453, 396–400.
Horning, E. C., & Horning, M. G. (1971). Metabolic Profiles: Gas-Phase Methods for Analysis of Metabolites. Clinical Chemistry, 17, 802–809.
Hu, T., et al. (2015). Metabolomics differential correlation network analysis of osteoarthritis biocomputing 2016. In Pacific sym-posium on biocomputing 2016 (pp.120–131). World Scientific, Singapore.
Hulsegge, I., Kommadath, A., & Smits, M. A. (2009). Globaltest and GOEAST: Two different approaches for gene ontology analysis. In BMC proceedings (Vol. 3, p. S10). London: BioMed Central
Hummel, M., Meister, R., & Mansmann, U. (2008). GlobalANCOVA: Exploration and assessment of gene group effects. Bioinformat-ics, 24, 78–85.
Jeong, H., Mason, S. P., Barabási, A.-L., & Oltvai, Z. N. (2001). Lethality and centrality in protein networks. Nature, 411, 41–42.
Jiang, J., Wolters, J. E., van Breda, S. G., Kleinjans, J. C., & de Kok, T. M. (2015). Development of novel tools for the in vitro inves-tigation of drug-induced liver injury. Expert Opinion on Drug Metabolism & Toxicology, 11, 1523–1537.
Jourdan, F., Breitling, R., Barrett, M. P., & Gilbert, D. (2007). MetaN-etter: Inference and visualization of high-resolution metabolomic networks. Bioinformatics, 24, 143–145.
Kanehisa, M., Furumichi, M., Tanabe, M., Sato, Y., & Morishima, K. (2017). KEGG: New perspectives on genomes, pathways, diseases and drugs. Nucleic Acids Research, 45, D353–D361.
Kanehisa, M., Goto, S., Sato, Y., Furumichi, M., & Tanabe, M. (2012). KEGG for integration and interpretation of large-scale molecular data sets. Nucleic Acids Research, 40, D109–D114.
Kanehisa, M., Sato, Y., Kawashima, M., Furumichi, M., & Tanabe, M. (2015). KEGG as a reference resource for gene and protein annotation. Nucleic Acids Research, 44, D457–D462.
Kankainen, M., Gopalacharyulu, P., Holm, L., & Orešič, M. (2011). MPEA—metabolite pathway enrichment analysis. Bioinformat-ics, 27, 1878–1879.
Karnovsky, A., et al. (2012). Metscape 2 bioinformatics tool for the analysis and visualization of metabolomics and gene expression data. Bioinformatics, 28, 373–380.
Kelder, T., et al. (2012). WikiPathways: Building research commu-nities on biological pathways. Nucleic Acids Research, 40, D1301–D1307.
King, Z. A., et al. (2016). BiGG Models: A platform for integrating, standardizing and sharing genome-scale models. Nucleic Acids Res, 44, D515-22. https ://doi.org/10.1093/nar/gkv10 49.
Klipp, E., Liebermeister, W., & Wierling, C. (2004). Inferring dynamic properties of biochemical reaction networks from structural knowledge. Genome Informatics, 15, 125–137.
Kolbe, A., Oliver, S. N., Fernie, A. R., Stitt, M., van Dongen, J. T., & Geigenberger, P. (2006). Combined transcript and metabolite profiling of Arabidopsis leaves reveals fundamental effects of
A. Rosato et al.
1 3
37 Page 18 of 20
the thiol-disulfide status on plant metabolism. Plant Physiology, 141, 412–422.
Kose, F., Weckwerth, W., Linke, T., & Fiehn, O. (2001). Visualizing plant metabolomic correlation networks using clique–metabolite matrices. Bioinformatics, 17, 1198–1208.
Kruger, N. J., & Ratcliffe, R. G. (2009). Insights into plant metabolic networks from steady-state metabolic flux analysis. Biochimie, 91, 697–702.
Krumsiek, J., et al. (2015). Gender-specific pathway differences in the human serum metabolome. Metabolomics, 11, 1815–1833. https ://doi.org/10.1007/s1130 6-015-0829-0.
Krumsiek, J., Bartel, J., & Theis, F. J. (2016). Computational approaches for systems metabolomics. Current Opinion in Biotechnology, 39, 198–206. https ://doi.org/10.1016/j.copbi o.2016.04.009.
Krumsiek, J., Suhre, K., Illig, T., Adamski, J., & Theis, F. J. (2011). Gaussian graphical modeling reconstructs pathway reactions from high-throughput metabolomics data. BMC Systems Biol-ogy, 5, 21. https ://doi.org/10.1186/1752-0509-5-21.
Langfelder, P., & Horvath, S. (2007). Eigengene networks for studying the relationships between co-expression modules. BMC Systems Biology, 1, 54.
Langfelder, P., & Horvath, S. (2008). WGCNA: An R package for weighted correlation network analysis. BMC Bioinformatics, 9, 559.
Langfelder, P., Zhang, B., & Horvath, S. (2007). Defining clusters from a hierarchical cluster tree: The dynamic tree cut library for R. Bioinformatics. https ://doi.org/10.1093/bioin forma tics/btm56 3.
Latorre-Pellicer, A., et al. (2016). Mitochondrial and nuclear DNA matching shapes metabolism and healthy ageing. Nature, 535, 561–565.
Lee, D.-S., Park, J., Kay, K., Christakis, N., Oltvai, Z., & Barabási, A.-L. (2008). The implications of human metabolic network topology for disease comorbidity. Proceedings of the National Academy of Sciences, 105, 9880–9885.
Lee, J. M., Gianchandani, E. P., Eddy, J. A., & Papin, J. A. (2008). Dynamic analysis of integrated signaling, metabolic, and regula-tory networks. PLOS Computational Biology, 4, e1000086.
Lee, W. N. P. (2006). Characterizing phenotype with tracer based metabolomics. Metabolomics, 2, 31–39.
Lusczek, E., Lexcen, D., Witowski, N., Mulier, K., & Beilman, G. (2013). Urinary metabolic network analysis in trauma, hemor-rhagic shock, and resuscitation. Metabolomics, 9, 223–235. https ://doi.org/10.1007/s1130 6-012-0441-5.
Ma’ayan, A. (2011). Introduction to network analysis in systems biol-ogy. Science Signaling, 4, tr5.
Mamer, O., & Crawhall, J. (1971). The identification of urinary acids by coupled gas chromatography-mass spectrometry. Clinica Chimica Acta, 32, 171–184.
Mansmann, U., & Meister, R. (2005). Testing differential gene expression in functional groups Goeman’s global test versus an ANCOVA approach. Methods Archive, 44, 449–453.
Marbach, D., et al. (2012). Wisdom of crowds for robust gene network inference. Nature Methods, 9, 796–804.
Marcotte, E. M. (2001). The path not taken. Nature biotechnology, 19, 626–628.
Margolin, A. A., et al. (2006). ARACNE: An algorithm for the reconstruction of gene regulatory networks in a Mammalian cellular context. BMC Bioinformatics, 7, S7–S7. https ://doi.org/10.1186/1471-2105-7-s1-s7.
Menichetti, G., Bianconi, G., Castellani, G., Giampieri, E., & Remon-dini, D. (2015). Multiscale characterization of ageing and cancer progression by a novel network entropy measure. Molecular Bio-Systems, 11, 1824–1831
Meuzelaar, H. C., & Kistemaker, P. G. (1973). Technique for fast and reproducible fingerprinting of bacteria by pyrolysis mass spec-trometry. Analytical Chemistry, 45, 587–590.
Moreno, P., et al. (2015). BiNChE: A web tool and library for chemical enrichment analysis based on the ChEBI ontology. BMC Bioin-formatics, 16, 56. https ://doi.org/10.1186/s1285 9-015-0486-3.
Moritz, F., Kaling, M., Schnitzler, J. P., & Schmitt-Kopplin, P. (2017). Characterization of poplar metabotypes via mass difference enrichment analysis. Plant, Cell & Environment, 40, 1057–1073.
Neuweger, H., et al. (2009). Visualizing post genomics data-sets on customized pathway maps by ProMeTra–aeration-dependent gene expression and metabolism of Corynebacterium glutami-cum as an example. BMC Systems Biology, 3, 82.
Nicholson, G., et al. (2011). Human metabolic profiles are stably con-trolled by genetic and environmental variation. Molecular Sys-tems Biology, 7, 525
Nicholson, J. K., & Lindon, J. C. (2008). Systems biology: Meta-bonomics. Nature, 455, 1054–1056.
Nicolae, A., Wahrheit, J., Bahnemann, J., Zeng, A. P., & Heinzle, E. (2014). Non-stationary 13C metabolic flux analysis of Chinese hamster ovary cells in batch culture using extracellular labeling highlights metabolic reversibility and compartmentation. BMC Systems Biology, 8, 50.
Niedenführ, S., Wiechert, W., & Nöh, K. (2015). How to measure meta-bolic fluxes: A taxonomic guide for 13 C fluxomics. Current Opinion in Biotechnology, 34, 82–90.
Nikiforova, V. J., Daub, C. O., Hesse, H., Willmitzer, L., & Hoefgen, R. (2005). Integrative gene-metabolite network with imple-mented causality deciphers informational fluxes of sulphur stress response. Journal of Experimental Botany, 56, 1887–1896.
Oliver, S. G., Winson, M. K., Kell, D. B., & Baganz, F. (1998). Sys-tematic functional analysis of the yeast genome. Trends in Bio-technology, 16, 373–378.
Oresic, M., et al. (2011). Metabolome in progression to Alzheimer’s disease. Translational Psychiatry, 1, e57.
Ovadi, J. (1991). Physiological significance of metabolic channelling. Journal of Theoretical Biology, 152, 1–22.
Pauling, L., Robinson, A. B., Teranishi, R., & Cary, P. (1971). Quan-titative analysis of urine vapor and breath by gas-liquid partition chromatography. Proceedings of the National Academy of Sci-ences, 68, 2374–2376.
Pirhaji, L., et al. (2016a). Revealing disease-associated pathways by network integration of untargeted metabolomics. Nature Meth-ods, 13, 770–776.
Quek, L.-E., Wittmann, C., Nielsen, L. K., & Krömer, J. O. (2009). OpenFLUX: Efficient modelling software for 13 C-based meta-bolic flux analysis. Microbial Cell Factories, 8, 25.
Raamsdonk, L. M., et al. (2001). A functional genomics strategy that uses metabolome data to reveal the phenotype of silent muta-tions. Nature Biotechnology, 19, 45–50.
Rao, C. R. (1948). Large sample tests of statistical hypotheses con-cerning several parameters with applications to problems of esti-mation. In Mathematical Proceedings of the Cambridge Philo-sophical Society (Vol. 44, pp. 50–57). Cambridge: Cambridge University Press.
Ravasz, E., Somera, A. L., Mongru, D. A., Oltvai, Z. N., & Barabási, A.-L. (2002). Hierarchical organization of modularity in meta-bolic networks. Science, 297, 1551–1555.
Roessner, U., et al. (2001). Metabolic profiling allows comprehensive phenotyping of genetically or environmentally modified plant systems. The Plant Cell, 13, 11–29.
Romero, P., Wagg, J., Green, M. L., Kaiser, D., Krummenacker, M., & Karp, P. D. (2004). Computational prediction of human meta-bolic pathways from the complete human genome. Genome Biol-ogy, 6, R2. https ://doi.org/10.1186/gb-2004-6-1-r2.
From correlation to causation: analysis of metabolomics data using systems biology approaches
1 3
Page 19 of 20 37
Saa, P. A., & Nielsen, L. K. (2016). Construction of feasible and accu-rate kinetic models of metabolism: A Bayesian approach. Scien-tific Reports, 6, 29635.
Saccenti, E. (2016). Correlation patterns in experimental data are affected by normalization procedures: Consequences for data analysis and network inference. Journal of Proteome Research. https ://doi.org/10.1021/acs.jprot eome.6b007 04.
Saccenti, E., Menichetti, G., Ghini, V., Remondini, D., Tenori, L., & Luchinat, C. (2016). Entropy-based network representation of the individual metabolic phenotype. Journal of Proteome Research, 15, 3298–3307. https ://doi.org/10.1021/acs.jprot eome.6b004 54.
Saccenti, E., Suarez-Diez, M., Luchinat, C., Santucci, C., & Tenori, L. (2014). Probabilistic networks of blood metabolites in healthy subjects as indicators of latent cardiovascular risk. Journal of Proteome Research, 14, 1101–1111. https ://doi.org/10.1021/pr501 075r.
Sauer, U. (2006). Metabolic networks in motion: 13C-based flux analy-sis. Molecular Systems Biology, 2, 62.
Savageau, M. A. (1992). Critique of the enzymologist’s test tube. In E. E. Bittar (Ed.), Fundamentals of medical cell biology (Vol. 3A, pp. 45–108). Greenwich, CT: JAI Press.
Scheer, M., et al. (2011). BRENDA, the enzyme information system in 2011. Nucleic Acids Research, 39, D670–D676. https ://doi.org/10.1093/nar/gkq10 89.
Schellenberger, J., Park, J. O., Conrad, T. M., & Palsson, B. (2010). BiGG: A biochemical genetic and genomic knowledgebase of large scale metabolic reconstructions. BMC Bioinformatics, 11, 213.
Schnell, S., & Turner, T. E. (2004). Reaction kinetics in intracellular environments with macromolecular crowding: Simulations and rate laws. Progress in Biophysics and Molecular Biology, 85, 235–260.
Schomburg, I., et al. (2013). BRENDA in 2013: Integrated reactions, kinetic data, enzyme function data, improved disease classifi-cation: New options and contents in BRENDA. Nucleic Acids Research, 41, D764–D772. https ://doi.org/10.1093/nar/gks10 49.
Selivanov, V. A., et al. (2005). Rapid simulation and analysis of isoto-pomer distributions using constraints based on enzyme mecha-nisms: An example from HT29 cancer cells. Bioinformatics, 21, 3558–3564.
Shannon, P., et al. (2003). Cytoscape: A software environment for inte-grated models of biomolecular interaction networks. Genome Research, 13, 2498–2504.
Smilde, A. K., Timmerman, M. E., Saccenti, E., Jansen, J. J., & Hoefsloot, H. C. J. (2015). Covariances simultaneous compo-nent analysis: A new method within a framework for modeling covariances. Journal of Chemometrics, 29, 277–288. https ://doi.org/10.1002/cem.2707.
Smyth, G. (2005). Limma: Linear models for microarray data. In R. Gentleman, V. Carey, S. Dudoit, R. Irizarry, & W. Huber (Eds.), Bioinformatics and computational biology solutions using R and bioconductor (pp. 397–420). New York: Springer.
Sokol, S., Millard, P., & Portais, J.-C. (2012). Influx_s: Increasing numerical stability and precision for metabolic flux analysis in isotope labelling experiments. Bioinformatics, 28, 687–693.
Song, L., Langfelder, P., & Horvath, S. (2012). Comparison of co-expression measures: Mutual information, correlation, and model based indices. BMC Bioinformatics, 13, 1–21. https ://doi.org/10.1186/1471-2105-13-328.
Spicer, R., Salek, R. M., Moreno, P., Cañueto, D., & Steinbeck, C. (2017). Navigating freely-available software tools for metabo-lomics analysis. Metabolomics, 13, 106.
Stanford, N. J., Lubitz, T., Smallbone, K., Klipp, E., Mendes, P., & Liebermeister, W. (2013). Systematic construction of kinetic models from genome-scale metabolic networks. PLoS ONE, 8, e79195.
Stelling, J., Sauer, U., Szallasi, Z., Doyle, F. J., & Doyle, J. (2004). Robustness of cellular functions. Cell, 118, 675–685.
Steuer, R., Kurths, J., Fiehn, O., & Weckwerth, W. (2003). Observing and interpreting correlations in metabolomic networks. Bioinfor-matics, 19, 1019–1026.
Suarez-Diez, M., et al. (2017). Plasma and serum metabolite associa-tion networks: Comparability within and between studies using NMR and MS profiling. Journal of Proteome Research. https ://doi.org/10.1021/acs.jprot eome.7b001 06.
Suarez-Diez, M., & Saccenti, E. (2015). Effects of sample size and dimensionality on the performance of four algorithms for infer-ence of association networks in metabonomics. Journal of Pro-teome Research. https ://doi.org/10.1021/acs.jprot eome.5b003 44.
Subramanian, A., et al. (2005). Gene set enrichment analysis: A knowledge-based approach for interpreting genome-wide expression profiles. Proceedings of the National Academy of Sciences of the United States of America, 102, 15545–15550. https ://doi.org/10.1073/pnas.05065 80102 .
Suhre, K., & Schmitt-Kopplin, P. (2008). MassTRIX: Mass transla-tor into pathways. Nucleic Acids Research, 36, W481–W484.
Swainston, N., et al. (2016). Recon 2.2: From reconstruction to model of human metabolism. Metabolomics, 12, 109. https ://doi.org/10.1007/s1130 6-016-1051-4.
Szymanski, J., et al. (2009). Stability of metabolic correlations under changing environmental conditions in Escherichia coli—A sys-tems approach. PLoS ONE, 4, e7441.
Thimm, O., et al. (2004). Mapman: A user-driven tool to display genomics data sets onto diagrams of metabolic pathways and other biological processes. The Plant Journal, 37, 914–939.
Tokimatsu, T., et al. (2005). KaPPA-View. A web-based analysis tool for integration of transcript and metabolite data on plant meta-bolic pathway maps. Plant Physiology, 138, 1289–1300.
Trethewey, R. N., Krotzky, A. J., & Willmitzert, L. (1999). Metabolic profiling: A Rosetta Stone for genomics? Current Opinion in Plant Biology, 2, 83–85.
Trygg, J., Holmes, E., & Lundstedt, T. (2007). Chemometrics in metabonomics. Journal of Proteome Research, 6, 469–479.
Urbanczyk-Wochniak, E., et al. (2003). Parallel analysis of transcript and metabolic profiles: A new approach in systems biology. EMBO Reports, 4, 989–993.
Ursem, R., Tikunov, Y., Bovy, A., van Berloo, R., & van Eeuwijk, F. (2008). A correlation network approach to metabolic data analysis for tomato fruits. Euphytica, 161, 181. https ://doi.org/10.1007/s1068 1-008-9672-y.
Van Den Berg, R. A., Hoefsloot, H. C. J., Westerhuis, J. A., & Smilde, A. K., Van Der Werf, M. J. (2006). Centering, scal-ing, and transformations: Improving the biological information content of metabolomics data. BMC Genomics, 7, 142.
van der Greef, J., & Smilde, A. K. (2005). Symbiosis of chemomet-rics and metabolomics: Past, present, and future. Journal of Chemometrics, 19, 376–386.
Vignoli, A., Tenori, L., Luchinat, C., & Saccenti, E. (2017). Age and sex effects on plasma metabolite association networks in healthy subjects. Journal of Proteome Research, 17, 97–107
Weckwerth, W., & Fiehn, O. (2002). Can we discover novel pathways using metabolomic analysis? Current Opinion in Biotechnol-ogy, 13, 156–160.
Weckwerth, W., Loureiro, M. E., Wenzel, K., & Fiehn, O. (2004). Differential metabolic networks unravel the effects of silent plant phenotypes. Proceedings of the National Academy of Sci-ences of the United States of America, 101, 7809–7814. https ://doi.org/10.1073/pnas.03034 15101 .
Weitzel, M., Nöh, K., Dalman, T., Niedenführ, S., Stute, B., & Wiechert, W. (2013). 13CFLUX2—High-performance soft-ware suite for 13C-metabolic flux analysis. Bioinformatics, 29, 143–145.
A. Rosato et al.
1 3
37 Page 20 of 20
Wiechert, W., & Nöh, K. (2013). Isotopically non-stationary meta-bolic flux analysis: Complex yet highly informative. Current Opinion in Biotechnology, 24, 979–986.
Windig, W., Kistemaker, P. G., Haverkamp, J., & Meuzelaar, H. L. (1980). Factor analysis of the influence of changes in experi-mental conditions in pyrolysis—mass spectrometry. Journal of Analytical and Applied Pyrolysis, 2, 7–18.
Wishart, D. S. (2007). Current progress in computational metabo-lomics. Briefings in Bioinformatics, 8, 279–293.
Wishart, D. S., et al. (2013). HMDB 3.0—The human metabolome database in 2013. Nucleic Acids Research, 41, D801–D807. https ://doi.org/10.1093/nar/gks10 65.
Wittig, U., et al. (2012). SABIO-RK–database for biochemical reac-tion kinetics. Nucleic Acids Research, 40, D790–D796. https ://doi.org/10.1093/nar/gkr10 46.
Wold, S. (1995). Chemometrics; what do we mean with it, and what do we want from it? Chemometrics and Intelligent Laboratory Systems, 30, 109–115.
Wold, S., & Sjöström, M. (1998). Chemometrics, present and future success. Chemometrics and Intelligent Laboratory Systems, 44, 3–14.
Xia, J., Sinelnikov, I. V., Han, B., & Wishart, D. S. (2015). Metabo-Analyst 3.0—Making metabolomics more meaningful. Nucleic Acids Research. https ://doi.org/10.1093/nar/gkv38 0.
Yang, L., et al. (2012). Potential metabolic mechanism of girls’ cen-tral precocious puberty: A network analysis on urine meta-bonomics data. BMC Systems Biology, 6, S19. https ://doi.org/10.1186/1752-0509-6-s3-s19.
Yates, J. R. (2016). Change. Journal of Proteome Research, 15, 2355–2355. https ://doi.org/10.1021/acs.jprot eome.6b006 40.
Yoo, H., Antoniewicz, M. R., Stephanopoulos, G., & Kelleher, J. K. (2008). Quantifying reductive carboxylation flux of glutamine to lipid in a brown adipocyte cell line. Journal of Biological Chemistry, 283, 20621–20627.
Young, J. D. (2014). INCA: A computational platform for isotopi-cally non-stationary metabolic flux analysis. Bioinformatics, 30, 1333–1335.
Zamboni, N. (2011). 13 C metabolic flux analysis in complex systems. Current Opinion in Biotechnology, 22, 103–108.
Zamboni, N., Fischer, E., & Sauer, U. (2005). FiatFlux—A software for metabolic flux analysis from 13 C-glucose experiments. BMC Bioinformatics, 6, 209.
Zhang, B., & Horvath, S. (2005). A general framework for weighted gene Co-expression network analysis. Statistical Appli-cations in Genetics and Molecular Biology. https ://doi.org/10.2202/1544-6115.1128
Zhao, W., Langfelder, P., Fuller, T., Dong, J., Li, A., & Hovarth, S. (2010). Weighted gene coexpression network analysis: State of the art. Journal of Biopharmaceutical Statistics, 20, 281–300.
Zhong, S., Storch, K.-F., Lipan, O., Kao, M.-C. J., Weitz, C. J., & Wong, W. H. (2004). GoSurfer: A graphical interactive tool for comparative analysis of large gene sets in Gene Ontology space. Applied Bioinformatics, 3, 261–264.