asl.,,, · asl.,,, m:t aeronau33cal systems labop.ato _y experimental studies of the effect of...
TRANSCRIPT

ASL.,,,M:T AERONAU33CAL SYSTEMS LABOP.ATO _Y
EXPERIMENTAL STUDIES OF THE EFFECT OF
INTENT INFORMATION ON COCKPIT TRAFFIC DISPLAYS
Richard Barhydt and R. John Hansman
Aeronautical Systems LaboratoryDepartment of Aeronautics & Astronautics
Massachusetts Institute of TechnologyCambridge, Massachusetts USA
May 1997
ASL-97-3
https://ntrs.nasa.gov/search.jsp?R=20020029084 2018-06-03T01:23:22+00:00Z


Experimental Studies of the Effect of Intent Information on
Cockpit Traffic Displays
by
Richard Barhydt
Submitted to the Department of Aeronautics and Astronautics on May 9, 1997 in partial fulfillmentof the requirements for the Degree of Master of Science in Aeronautics and Astronautics
ABSTRACT
Intent information provides knowledge of another aircraft's current and future trajectory states.Prototype traffic displays were designed for four different levels of intent: Position, Rate,Commanded State, and FMS-Path. The current TCAS Display, which shows altitude rate inaddition to current position and altitude, was used as a baseline and represents the lowest level ofintent. The Rate, Commanded State, and FMS-Path Displays show increasing levels of intent
information using TCAS-like symbology in addition to incorporating a conflict probe and profileview display. An initial experiment was run on the MIT Part Task Flight Simulator in which eightairline pilots flew five traffic scenarios with each of the four displays. Results show that pilots had
fewer separation violations and maneuvered earlier with the three intent displays. Separationviolations were reduced when pilots maneuvered earlier. A second experiment was run to compare
performance between displaying intent information directly and incorporating it into a conflictprobe. A different set of eight amine pilots flew four traffic scenarios with the TCAS andCommanded State Displays with and without the conflict probe. Conflict probes with two minute
and long range look-ahead times were tested. Displaying conflict bands or showing intentinformation directly both led to fewer separation violations and earlier avoidance mane_'ers thanthe base TCAS Display. Performance was similar between the two minute and long range look-ahead conflict probes. Pilots preferred all intent displays over the TCAS Display.


Acknowledgments
This research was supported by the NASA Ames Research Center under grant NAG2-716.
The authors also thank the 16 pilots who donated over four hours of their time to participate in the
experiments. Their input was very valuable. Alan Midkiff offered advice on operational issues
related to the research, and provided helpful suggestions on the thesis.


Table of Contents
List of Figures ................................................................................................. 9
List of Tables ................................................................................................. 11
List of Acronyms ............................................................................................. 13
1 Introduction .............................................................................................. 15
Experiment 1 ............................................................................................. 212.1 Display Design .................................................................................... 23
2.1.I TCAS Display ............................................................................ 232.1.2 Rate Display .............................................................................. 242.1.3 Commanded State Display .............................................................. 27
2.1.4 FMS-Path Display ............................................................... . ....... 292.2 Scenario Design ................................................................................... 35
2.2.1 Scenario 1: Intruder Overtake .......................................................... 36
2.2.2 Scenario 2: Intruder Trajectory Change ............................................... 37
2.2.3 Scenario 3: Ownship Overtake ......................................................... 382.2.4 Scenario 4: Long Range Conflict and Intruder Level-Off .......................... 382.2.5 Scenario 5: Dual Conflict ............................................................... 40
2.2.6 Use of Repeated Scenarios .............................................................. 402.3 Method ............................................................................................. 43
2.3.1 Apparatus .................................................................... .'7............ 432.3.2 Procedure ................................................................................. 44
2.3.3 Training ................................................................................... 452.3.4 Performance Metrics ..................................................................... 46
2.3.5 Data Analysis ............................................................................. 462.4 Results ............................................................................................. 49
2.4.1 Subjects ................................................................................... 492.4.2 Objective Results: Overall .............................................................. 492.4.3 Objective Results: Scenario Specific .................................................. 532.4.4 Subjective Results ........................................................................ 58
2.5 Discussion ......................................................................................... 61
3 Experiment 2 ............................................................................................. 633.1 Display Design .................................................................................... 65
3.1.1 TCAS Display ............................................................................ 653.1.2 Commanded State Display .............................................................. 66
3.2 Scenario Design ................................................................................... 693.2.1 Scenario I: Short Range Conflict ...................................................... 693.2.2 Scenario 2: Intruder Maneuvers During Conflict .................................... 703.2.3 Scenario 3: Long Range Conflict ...................................................... 7!3.2.4 Scenario 4: Intruder Overtake and Multiple Conflict ................................ 71
3.3 Method ............................................................................................. 73
3.3.1 Apparatus ................................................................................. 733.3.2 Procedure ................................................................................. 73
3.3.3 Training ................................................................................... 733.3.4 Performance Metrics ..................................................................... 73
3.3.5 Data Analysis ............................................................................. 74
7
3.4 Results............................................................................................. 753.4.1 Subjects................................................................................ 753.4.2 ObjectiveResults:Overall.................................................................... 753.4.3 ObjectiveResults:ScenarioSpecific....................................................... 783.4.4 SubjectiveResults............................................................................. 84
3.5 Discussion......................................................................................... 87
4 Conclusions.............................................................................................. 89
Appendix A
Appendix B
Appendix C
Appendix D
Appendix E
Appendix F
Experiment 1 Pilot Briefing .............................................................. 93
Experiment 1 Pilot Questionnaire ....................................................... 95
Experiment 1 Scenario Specific Results ................................................ 99
Experiment 2 Pilot Briefing ............................................................ 103
Experiment 2 Pilot Questionnaire ..................................................... 105
Experiment 2 Scenario Specific Results .............................................. 109

List of Figures
Figure
Figure
Figure
Figure
Figure
Figure
Figure
Figure
Figure
Figure
Figure
Figure
Figure
Figure
Figure
Figure
Figure
Figure
Figure
Figure
Figure
Figure
Figure
Figure
Figure
Figure
Figure
Figure
Figure
Figure
Figure
Figure
1.1:
1.2:
2.1:
2.2:
2.3:
2.4:
2.5:
2.6:
2.7:
2.8:
2.9:
2.10:
2.11:
2.12:
2.13:
2.14:
2.15:
2.16:
2.17:
2.18:
2.19:
2.20:
2.21:
2.22:
2.23:
2.24:
2.25:
2.26:
2.27:
2.28:
2.29:
2.30:
Intruder Trajectory Segments Showing Different Levels of Intent Information ... 17
Aircraft Mode Diagram .................................................................... 18
TCAS Display .............................................................................. 24
Rate Display ................................................................................ 25
Commanded State Display ................................................................ 28
Sample Conflict Scenarios ................................................................ 29
FMS-Path Display ......................................................................... 30
Sample FMS-Path Conflict Scenarios .................................................. 32
Comparison of Range of Possible Trajectories with Assumed Trajectory .......... 33
ATC Simulator Screen .................................................................... 35
Intruder Overtake Scenario ................................................................ 36
Intruder Trajectory Change Scenario .................................................... 37
Ownship Overtake Scenario .............................................................. 38
Long Range Conflict and Intruder Level-Off Scenario ............................... 39
Dual Conflict Scenario ..................................................................... 40
Mirror Imaged Scenarios .................................................... :. ........... 41
Pilot Display Screen ....................................................................... 43
Sample Display Preference Question .................................................... 47
Total Separation Violations ............................................................... 50
Average Time Before Separation ViolationWhen Avoidance Maneuver Initiated .................................................... 50
Average Time Before Separation Violation that a Conflict Band Appeared ......... 51
Time to Initiate Avoidance Maneuver After Conflict Band Appeared ................ 52
Percentage of Conflicts Resulting in Separation Violation vs. Maneuver Time .... 53
Separation Violation Percentage vs. Scenario .......................................... 54
Separation Violation Percentage vs. Display Type ..................................... 54
Maneuver Time Before Separation Violation vs. Display Type ...................... 55
Scenario 2, Intruder Trajectory Change:
Maneuver Time Before Separation Violation ........................................... 56
Profile View of Scenario 4, Intruder Level-Off ........................................ 57
Pilot Display Preference ................................................................... 58
Percentage of Pilots Indicating Display Was Too Cluttered ........................... 59
Value of Information Elements ........................................................... 59
Subjective Questions Regarding Profile View Display ................................ 60

Figure
Figure
Figure
Figure
Figure
Figure
Figure
Figure
Figure
Figure
Figure
Figure
Figure
Figure
Figure
Figure
FigureFigure
Figure
3.1:
3.2:
3.3:
3.4:
3.5:
3.6:
3.7:
3.8:
3.9:
3.10:
3.11:
3.12:
3.13:
3.14:
3.15:
3.16:
3.17:
3.18:
3.19:
TCAS Displaywith ConflictBands...................................................... 65
CommandedStateDisplaywith ConflictBands........................................ 66
ShortRangeConflict Scenario........................................................... 69
IntruderManeuversDuringConflictScenario.......................................... 70
LongRangeConflict Scenario............................................................ 71
IntruderOvertakeandMultipleConflictScenario...................................... 72
TotalSeparationViolationsvs.DisplayOption........................................ 75
AverageManeuverTimeBeforeSeparationViolation................................. 76AverageTimeto ConductAvoidanceManeuverAfterConflictBandAppeared...77
SeparationViolationPercentagevs.ManeuverTime.................................. 78
SeparationViolationPercentagevs.ScenarioandDisplayType..................... 79Scenario4, IntruderOvertake:ManeuverTimeBeforeSeparationViolation...... 80
SeparationViolationPercentagevs.ScenarioandConflictBandOption ........... 81SeparationViolation Percentagefor IntruderOvertakeScenariowith andwithoutProfileView Display.................................................. 82
LongRangeConflict Scenario,SeparationViolation Percentagevs.DisplayOption................................... 83
LongRangeConflict Scenario,ManeuverTimeBeforeSeparationViolation...... 83
PilotDisplayPreference.................................................................. 84Percentageof PilotsIndicatingDisplayWasTooCluttered........................... 85Valueof InformationElements........................................................... 86
10

List of Tables
Table 2.1:
Table 3.1"
Experiment 1 Test Matrix ................................................................. 21
Experiment 2 Test Matrix ................................................................. 63
11

12
List of Acronyms
AHP
ANOVA
ASL
ATC
CDTI
CDU
EHSI
FAA
FMS
LNAV
MCP
MIT
PFD
RA
RTCA
SID
STAR
TA
TIC
TCAS
T/D
VNAV
VOR
Analytic Hierarchy Process
Analysis of Variance
Aeronautical Systems Laboratory
Air Traffic Control
Cockpit Display of Traffic Information
Control Display Unit
Electronic Horizontal Situation Indicator
Federal Aviation Administration
Flight Management System
Lateral Navigation
Mode Control Panel
Massachusetts Institute of Technology
Primary Flight Display
Resolution Advisory
Radio Technical Commision for Aeronautics
Standard Instrument Departure
Standard Terminal Arrival Route
Traffic Advisory
Top of Climb
Traffic Alert and Collision Avoidance System
Top of Descent
Vertical Navigation
Very High Frequency Omnidirectional Range
13

14

Chapter 1
Introduction
In the early 1980"s, significant work was done toward the development of a Cockpit
Display of Traffic Information (CDTI). Many experiments showed that predictor information
added to intruder airplane symbols aided pilots in determining the future position of those aircraft
(Palmer et. al, 1980 and Palmer, 1983). However, the traffic display used in conjunction with the
Traffic Alert and Collision Avoidance System (TCAS) in today's commercial aircraft shows only
the current position, altitude, and altitude rate of intruder aircraft. TCAS alerts pilots to potential
conflicts by issuing a Traffic Alert (TA) or a more serious Resolution Advisory (RA), which
includes a command to climb or descend. The TCAS system functions well in the current airspace
system, in part because its primary function is to supplement and compensate for errors by Air
Traffic Control (ATC).
With the possible transition to a more unstructured air traffic management system
underway, the CDTI may take on a more active role (RTCA Technical Report, 1995). Pilots may
eventually be given more liberty in choosing their own routes, but could incur more responsibility
for maintaining separation from other traffic (FAA Technical Report, 1995). To make informed
decisions about potential conflicts, pilots would likely need to "know more information about the
intruder's future position than is provided by the current TCAS system. This information, known
as "aircraft intent", exists at many different levels, with higher levels representing a more complete
knowledge of the other aircraft's intended trajectory.
By showing only current position, altitude, and altitude rate, the current TCAS system
represents a low level of intent information. A somewhat higher level adds horizontal rate
information, such as current airspeed and heading. With rate and position information, a linear
prediction of an aircraft's future position can be made. This prediction becomes invalid, however,
as soon as the aircraft changes velocity. To more accurately predict position, information about an
intruder's autopilot states can be considered. For example, knowing the first target state would
15

providetheroll-outheadingor level-off altitude,if maneuvering.Theseelementsareknownasthe
commandedheadingandcommandedaltitude,respectively.An evenhigherintentlevelwould
considermultiple futuretrajectorystates.Obtaininganintruder'sflightplanprogrammedinto its
FlightManagementSystem(FMS)wouldallow its positionto bepredictedevenafterseveral
changesof state.Flightplan informationcould includethelocationandcrossingaltitudeof future
waypoints.
Figure 1.1showsseveralintrudertrajectorysegments,drawnin orderof increasinglevel
of intent.Thelowestintentleveldepictedis thePosition Level, which shows the aircraft's current
position and its altitude of 20,000 ft. The Rate Level shows the intruder's current heading and
indicates that it is descending. The level of intent provided by the current TCAS System falls
between the Position and Rate Levels, since TCAS shows the altitude rate but does not provide
horizontal rate information. At the First Target State Level, next conunanded state information is
added to the information available at the Rate Level. The intruder's commanded heading is
represented by the dashed arrow. In addition, its next level-off altitude of 17,000 ft. is known.
The highest level of intent shown is the Trajectop3' Level, which adds information about multiple
future states. This level shows the location and crossing altitude of upcoming waypoints. The
intruder will cross Waypoint A at 17,000 ft., and then turn to Waypoint B, where it will cross at
15,000 ft.
16

Increasing Levels of Intent
Position
20000
20000
Rate
20000
Trajectory
17000
A
15000
First Target State
20000
17000
S
Figure 1. I: Intruder Trajectory Segments Showing Different Levels of Intent Information
Actual implementation of the intent levels discussed above depends on several factors.
Among prominent limitations are the capability of air to air datalink systems used to exchange the
information and the operating mode of intruder aircraft.
Any intent information incorporated into a CDTI would likely be communicated via an air
to air datalink system. One form of datalink, the Mode S transponder, sends and receives
information in small data packets called squitters. TCAS equipped aircraft identify each other by
exchanging unique addresses through the Mode S squitter. Current squitters only have room to
carry these Mode S addresses. The MIT Lincoln Laboratory has conducted tests on extended
squitters which allow position and altitude to be exchanged (Orlando, Knittel, and Boisvert, 1994).
Additional developments will likely be required before higher levels of intent information can be
accessed.
17

The amount of information available at a given time also depends on the operating mode
of the intruder aircraft. Available information can be examined by considering the block diagram
of Figure 1.2, which shows the available modes and the pilot/aircraft interface.
Pilot
ITrajectoryCommands
l C_ontrols
IState
CommandsManual ._ontrol
FlightManagement
Computer
Increasing Amount of Intent Information Available
I___._ Autopilot
Autothrust
State
Navigation
Figure 1.2: Aircraft Mode Diagram
The pilot interacts with the aircraft through three primary modes: manual, state, and trajectory.
Each level involves the pilot issuing a command to the aircraft and receiving feedback about the
aircraft states through various displays. With each additional outer loop, the pilot communicates
more intentions about future states to his own aircraft. Since this information is available, it can be
passed to other aircraft, assuming a capable datalink system.
Manual control, the innermost control loop, is the simplest mode because the pilot bypasses
the autopilot and commands the aircraft directly with the flight controls. While in manual mode,
18

the intent information available includes only current state variables such as heading, altitude,
airspeed, and vertical speed.
The middle control loop is referred to as the state mode. Instead of controlling the aircraft
directly, the pilot issues a target state to the autopilot. Commanded states, such as heading or
altitude, are entered into a Mode Control Panel (MCP). The autopilot will make the necessary
control inputs to achieve the desired state. In this mode, both the aircraft's current and commanded
state variables are available, representing a higher level of intent. For instance, an aircraft may
currently be climbing through 17,500 ft. with a command to level-off at 18,000 ft. The current
altitude is 17,500 ft. and the commanded altitude is 18,000 ft.
The outermost loop is the trajectory mode. At this level, the pilot interacts with a Control
Display Unit (CDU) to command multiple future states. The pilot may enter an entire trajectory
complete with waypoints, crossing altitudes, and speed restrictions. Future systems could allow
the pilot to specify a waypoint arrival time. The Flight Management System (FMS) will determine
where climbs and descents should begin and where speed changes should occur in order to achieve
the desired trajectory.
Several levels of intent information were selected for study in an exploratory experiment.
Intent levels were chosen to correspond to information available in each of the three control modes.
The Rate Level corresponds to the Manual Mode and incorporates information about an aircraft's
current state. The Commanded State Level adds first target state commands to the current state
variables available at the Rate Level. The FMS-Path Level, which represents the Trajectory Mode,
includes information about the FMS programmed Lateral (LNAV) and Vertical (VNAV)
Navigation paths. Additionally, the current TCAS System was used as a baseline, and represents
the lowest level of intent information.
19

20

Chapter 2
Experiment I
An exploratory experiment was conducted to determine whether intent information could
improve pilots' ability to resolve traffic conflicts. The relative benefit between the four different
levels of intent described in Chapter 1 was considered. To evaluate pilots' ability to use intent
information, prototype displays were developed corresponding to each intent level discussed in
Chapter 1. It was assumed that the specified level of intent information would always be available.
As shown in the test matrix of Table 2. I, subject pilots flew five different traffic scenarios
with each of the four prototype displays.
Table 2.1: Experiment I Test Matrix
Levels of Intent Information
u)O
=mL_
c(9oU3
t_=mm
c-o
ro
1
Intruder Overtake
2Intruder
Trajectory Change
3
Ownship Overtake
4
Long Range Conflictand Intruder Level-Off
5
Dual Conflict
TCAS
X
X
X
X
X
Rate
X
X
X
X
X
CommandedState
X
X
X
X
X
FMS-Path
X
X
X
X
X
21

The primary objective of the scenarios was to maintain a safe distance from other traffic. Scenarios
were designed to represent common traffic situations. Lateral, vertical, and combined
lateral/vertical conflict geometries in addition to single and multiple aircraft conflicts were tested.
An intruder level-off safely above the subject pilot's aircraft was also considered.
The two independent variables tested were the level of intent information and the scenario type.
The matrix was counterbalanced by varying the order in which displays were presented to the
pilots. Design of the displays and scenarios is described below.
22

2.1 Display Design
Prototype displays were designed for the TCAS, Rate, Commanded State, and FMS-Path
levels of intent. The primary goal of the display design process was to provide a clear picture of
the traffic situation using the specified level of intent information. The following functional
requirements were established for the design of each display: show the specified level of intent,
identify intruder aircraft that are a potential threat and indicate the level of threat, and show where a
minimum separation will be violated.
Each traffic display is superimposed onto an Electronic Horizontal Situation Indicator
(EHSI), based on the Boeing format and color conventions. The ownship is drawn as a white
triangle at the bottom of the display. Navigation aids are shown in cyan and the ownship heading
bug is represented by a dashed magenta line. Intruder aircraft and navigation fixes move relative to
the stationary ownship symbol. Each display uses current TCAS symbology to represent the
position and relative altitude of intruder aircraft. In addition, the TCAS climb or descent arrow is
shown if an intruder is climbing or descending at least 500 fpm. TCAS II logic, including traffic
advisories and resolution advisories, is available on all prototype displays.
2.1.1 TCAS Display
The current TCAS Display is used as the baseline intent display. Figure 2.1 shows a
sample TCAS Display. The intruder aircraft is represented by the open white diamond. An up
arrow is drawn between the traffic symbol and the aircraft ID, indicating a climb rate of at least 500
fpm. In Figure 2.1, the intruder's altitude is 700 feet lower than the ownship. The relative altitude
is depicted below the traffic symbol.
If TCAS anticipates a conflict based on the range and range rate between the ownship and
intruder, the traffic symbol changes color and/or shape to indicate the level of threat. Proximate
traffic is drawn as a filled white diamond. If a traffic advisory is issued, the intruder symbol is a
filled yellow circle. Threat aircraft requiring a resolution advisory are drawn as a filled red square.
23

-¢a_"
Figure 2.1: TCAS Display
2.1.2 Rate Display
The Rate Display incorporates three major additions to the TCAS Display: rate information
shown on the display, a conflict probe, and a profile view display. A sample Rate Display is given
in Figure 2.2.
The intruder's heading is represented by a short arrow drawn from the center of the traffic
symbol. The heading arrow is drawn in the direction of the intruder's absolute heading. Since the
EHSI uses the current position of the ownship as the origin of the display, the intruder will not
necessarily appear to move in the same direction as its heading arrow. The absolute heading was
found to present a more intuitive picture of an aircraft's flight direction than its heading relative to
24

A
,E
Distance Along Flight Path (nm)
Figure 2.2: Rate Display
25

theownship.Whennavaidsareshownon theEHSI,apilot canusetheabsoluteheadingto
compareanintruder'sdirectionof flight with fixedspatialcoordinates.Thiscomparisonis
especiallyvaluablewheneitheraircraftis maneuvering.
A conflict probelinearlyextrapolatestheownshipandintrudertrajectoriestodetermine
whetherdefinedseparationcriteriawill beviolated.Consistentwith thelevelof intent,theprobe
assumesaconstantairspeed,heading,andverticalspeedfor bothaircraft. A yellowcautionzone
is drawnif anintruderis projectedto bewithin 3 nm.laterallyand700ft. verticallyof the
ownship.Likewise,if thespacingis projectedto bewithin 2 nm.laterallyand500ft. vertically, a
redwarningzoneis drawn. Cautionandwarningzonesareshownasaconflict banddrawnon the
ownshipflight path,wherethetwo aircraftwill bewithin the indicatedspacing.If aconflict is
predictedfor morethanoneaircraft,theconflict bandswill superimpose,with redalways
overwritingyellow. Whentheownshipor intrudermaneuver,theshapeandlocationof the
conflict bandchange,givinganindicationof whetherthemaneuveris improvingor deteriorating
thesituation. Oncetheconflict banddisappears,theownshippilot is assuredthatseparationwill
bemaintained,absentanyfurthermaneuveringbyeitheraircraft.
As anadditionalpartof theconflict probe,thecolorof boththeheadingarrowandthe
aircraftID arechangedto indicatethe intruder'slevelof threat.White is usedif thereis no
conflict,yellow if acautionzoneis predicted,andredif awarningzoneispredicted.This
conventionisusedto makeit easierto identifywhichaircraftis causingthethreatindicatedby the
conflict band.
A profileview displayis alsoprovidedto helpenhancethepilot's understandingof the
traffic situationin theverticalplane.Thedisplayis basedonaprototypeElectronicVertical
SituationDisplaydesignedto improvepilots' situationawarenessof verticalautoflightmode
transitions(Vakil, Midkiff, andHansman,1996).Thehorizontalaxisis thedistancealongthe
ownship'sflight pathan=dthevertical_i-s is theabsolutealtitude. Thedistanceaheadof the
ownship shown on the profile display corresponds to the range on the EHSI. A dashed magenta
arrow represents the ownship's vertical velocity vector. The TCAS traffic symbol and aircraft ID
26

areshownonthedisplay. UsingthesamecriteriaastheTCAS Display,aclimb/descentarrowis
drawnfrom thecenterof thesymbolif thealtituderateexceeds500fpm. TheaircraftID andthe
climb/descentarrowarecoloredto indicatethelevelof threat.Sinceanypositionalongaline
perpendicularto theownshipflight pathrepresentsasinglepoint onthedisplay'shorizontalaxis,it
is notunusualto havemultipleairplanesymbolsmergetogether.For thisreason,only those
aircraftprojectedto causeaconflictwith theownshipareshownon theprofiledisplay.
2.1.3 Commanded State Display
TheCommandedStateDisplayaddstheintruder'scommandedheadingandaltitude,if
maneuvering,tothe informationshownon theRateDisplay. A sampleCommandedStateDisplay
is providedin Figure2.3.
If anintruderaircraft is turning,thecommandedheadingis shownwith a magentaarrow.
Thecurrentheadingwill appearto sweeptowardthecommandedheadinguntil theaircraftrolls out
of theturn, atwhichpointthecommandedheadingarrowwill disappear.A magentaarrowwas
selectedto beconsistentwith theBoeingcolor schemefor showingcommandedstateinformation.
If anintruderprojectedto causeaconflict is climbingordescending,its commandedaltitudeis
shownasashortmagentaline on theprofile view display. A yellow or redarrow,consistentwith
the levelof threat,is drawnfromtheairplanesymbolto thecommandedaltitude.
27

A
P_
Distance Along Flight Path (nm)
Figure 2.3: Commanded State Display
28

Conflictpredictionis performedin thesamewayastheRateDisplay,by consideringthe
ownshipandintruder'scurrentairspeed,heading,andverticalspeed.Commandedstate
informationis notconsideredbecauseit couldcauseadeveloping conflict to be suppressed based
on an intruder's intended actions.
Scenario A
An exampIe of such a situation is shown in Figure 2.4.
Scenario B
Intrude9
Ownship
l Conflict Region
Actual Path
.... Projected Path
Figure 2.4: Sample Conflict Scenarios
Intrude_
The ownship is flying to the right at constant altitude and the intruder is descending. In both
scenarios, a conflict is predicted based on current state information. In Scenario A, the intruder
maintains a constant vertical speed through the ownship's altitude, and the conflict occurs as
predicted. In Scenario B, the intruder levels off safely above the ownship, as indicated by its
commanded altitude. In this case, the conflict band would not disappear until the intruder starts to
level-off.
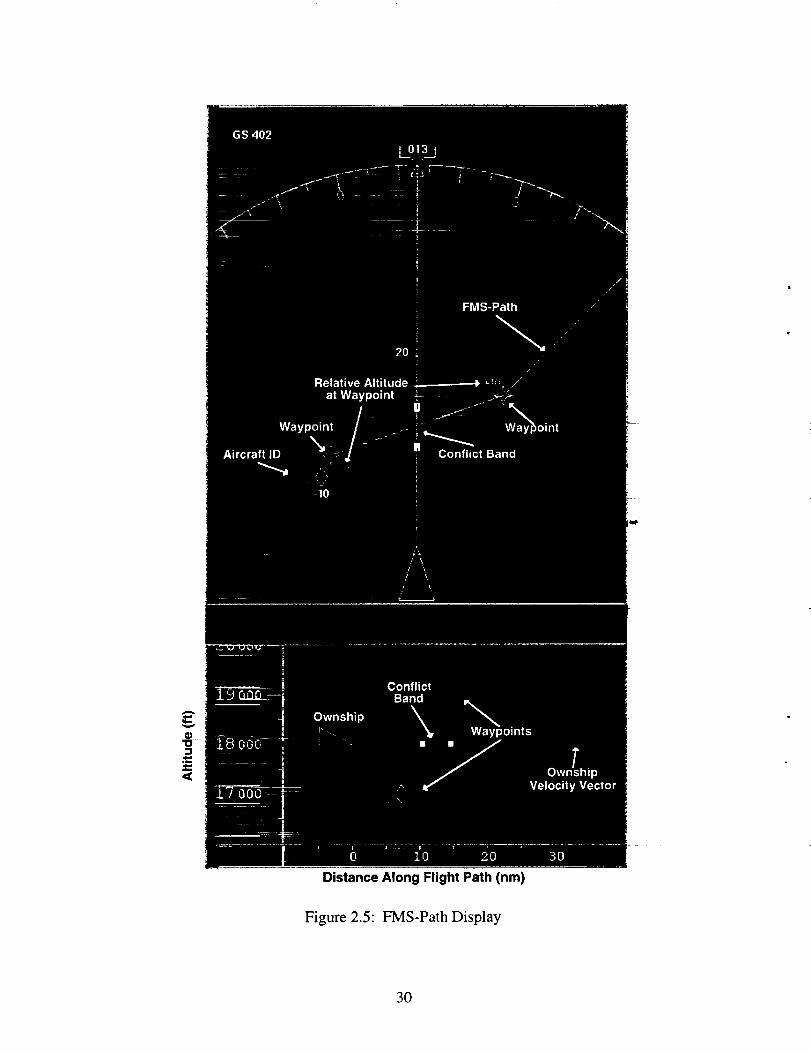
2.1.4 FMS-Path Display
The FMS-Path Display adds an intruder's programmed trajectory, including Lateral
Navigation (LNAV) and Vertical Navigation (VNAV) path information, to the TCAS Display. A
sample display is shown in Figure 2.5. LNAV waypoints are shown with the conventional
29
A
'U
Distance Along Flight Path (nm)
Figure 2.5: FMS-Path Display
3O
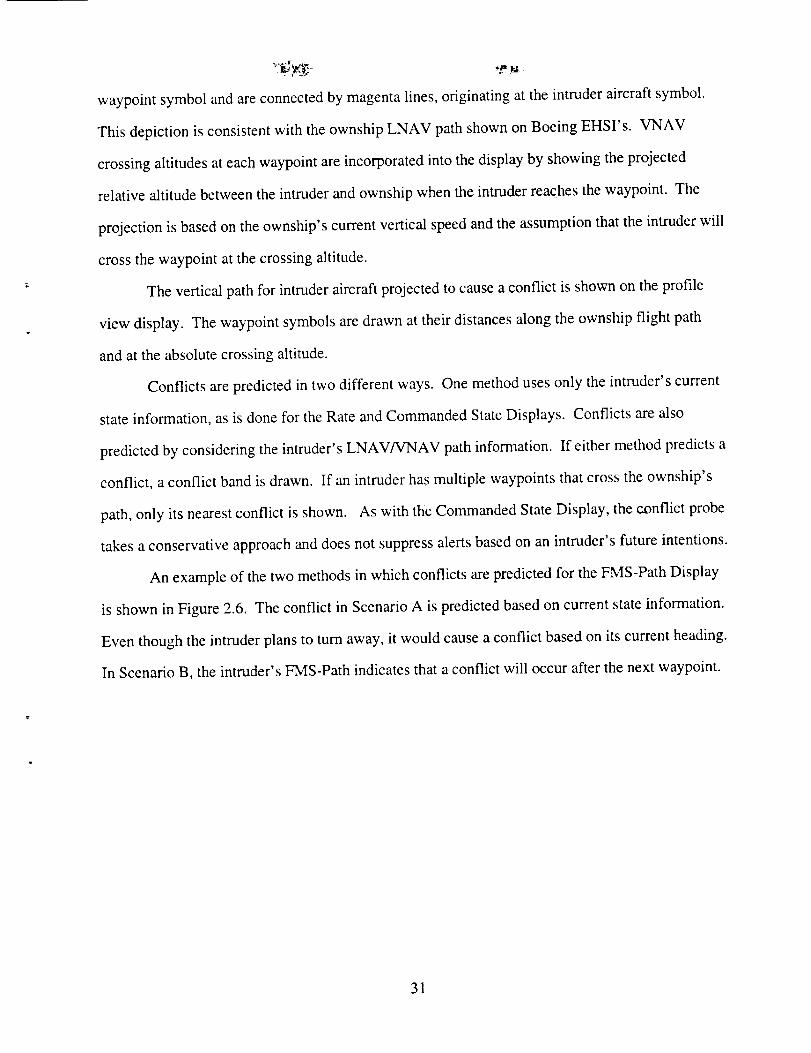
waypointsymbolandareconnectedby magentalines,originatingatthe intruderaircraftsymbol.
Thisdepictionis consistent with the ownship LNAV path shown on Boeing EHSI's. VNAV
crossing altitudes at each waypoint are incorporated into the display by showing the projected
relative altitude between the intruder and ownship when the intruder reaches the waypoint. The
projection is based on the ownship's current vertical speed and the assumption that the intruder will
cross the waypoint at the crossing altitude.
The vertical path for intruder aircraft projected to cause a conflict is shown on the profile
view display. The waypoint symbols are drawn at their distances along the ownship flight path
and at the absolute crossing altitude.
Conflicts are predicted in two different ways. One method uses only the intruder's current
state information, as is done for the Rate and Commanded State Displays. Conflicts are also
predicted by considering the intruder's LNAV/VNAV path information. If either method predicts a
conflict, a conflict band is drawn. If an intruder has multiple waypoints that cross the ownship's
path, only its nearest conflict is shown. As with the Commanded State Display, the conflict probe
takes a conservative approach and does not suppress alerts based on an intruder's future intentions.
An example of the two methods in which conflicts are predicted for the FMS-Path Display
is shown in Figure 2.6. The conflict in Scenario A is predicted based on current state information.
Even though the intruder plans to turn away, it would cause a conflict based on its current heading.
In Scenario B, the intruder's FMS-Path indicates that a conflict will occur after the next waypoint.
31

Scenario A Scenario B
" I%%
%%
Intruder _.
Figure 2.6:
Ownship C_
'_lntruder
Ownship _
Conflict Region
Actual Path
.... Projected Path
Sample FMS-Path Conflict Scenarios
....... TO perform the conflict prediction based on !he FMS-Path, several simplifying assumptions
had to be made about the intruder's operating mode and its actual trajectory. It was assumed that
all aircraft were flying in LNAV/VNAV path mode, therefore ensuring that the FMS-Path was
always available. Most trajectory assumptions were related to the VNAV Path. The vertical profile
is very difficult to predict precisely because it depends on uncertain environmental factors and
differences in FMS architecture between aircraft.
Most flight management systems use models of wind and temperature profiles to predict
when the aircraft will reach its next altitude in a climb (Top of Climb or T/C) and where a descent
needs to begin to make a crossing altitude at a downline waypoint (Top of Descent or T/D). As the
aircraft flies along, a change in forecasted wind or temperature conditions will change the location
of the T/C and/or T/D. The vertical profile can also change if the aircraft encounters unforecasted
conditions while climbing or descending. In a climb, this difference would affect the location of
the T/C. In a descent, the aircraft could miss the crossing altitude if an unexpected tailwind is
encountered.
32

Differencesin FMSarchitecturebetweenaircraftalsolimit theability to accuratelypredict
theVNAV Path. For example,in ahighspeeddescent,anaircraftmaybeunableto meetbotha
speedandanaltituderestrictionatthenextwaypoint. Someaircraftmayreducespeedandfail to
reachthecrossingaltitude,whileothersmaymeetthealtituderestrictionandwait to reducespeed
until afterpassingthewaypoint. Constructingamodelthatcouldaccuratelyrepresentsituations
suchasthesefor manydifferentaircraftwouldbeverydifficult.
To managetheseissues,asimplifieddeterministicpathbetweenwaypointswasassumed.
Uncertaintiesin the locationof theT/CandT/D wereeliminatedby assumingtheintruderwould
maintainaconstantverticalspeedbetweenwaypoints,effectivelyputtingtheT/C atthenext
waypointandtheT/D at thepreviouswaypoint. Figure2.7showstherangeof possiblereal
trajectoriescomparedto theassumedtrajectory.
TIC _ _ T/D
Range of Possible Trajectories
Assumed Trajectory
Figure 2.7: Comparison of Range of Possible Trajectories with Assumed Trajectory
The descent profile is curved to show the possible overshoot that can occur if the aircraft is unable
to make the crossing altitude. Secondly, it was assumed that the intruder would maintain a
constant speed throughout the trajectory. This eliminated the need to consider the many possible
acceleration or deceleration tactics that could be used. Finally, a linear trajectory was assumed for
level-offs and turns between waypoints. This was done to mitigate the differences in flight
dynamics between aircraft.
33

34

2.2 Scenario Design
Five scenarios were designed to represent common traffic situations. To keep the subject
from focusing only on the conflict causing airplane, several background aircraft were included in
each scenario. Scenario design was done on an ATC simulator, developed as part of a study on
remote situation generation (Johnson & Hansman, 1995). The ATC simulator is an interactive tool
for designing trajectories for multiple intruder aircraft. A sample of the display screen is given in
Figure 2.8.
Figure 2.8: ATC Simulator Screen
35

The simulator allows the user to select 4D trajectories for the intruder aircraft. The location,
altitude, and time of arrival at the waypoint are selected. Performance constraints such as
maximum speed, climb, and descent rates are employed to prevent unrealistic intruder trajectories.
Intruders fly at constant vertical speed between the waypoints, which also serve as the T/C and
T/D. These trajectories are consistent with the assumptions made for the FMS-Path Display.
2.2.1 Scenario 1: Intruder Overtake
The Intruder Overtake Scenario was developed as a strictly vertical conflict. The scenario
also tested pilots' ability to recognize a conflict from behind. It was thought that pilots may have
trouble interpreting the intruder's flight path, which overlaps the ownship path. As shown in
Figure 2.9, the intruder starts directly behind and 4000 ft. above the ownship. It overtakes the
ownship and descends through the ownship altitude, causing a separation violation one minute, 22
seconds (1:22) after the start of the scenario.
I
,0,4I
i
I
X1:22
Ownship Nominal Path
Intruder Path
Point of Separation Violation| XI (time given in minutes and
seconds from start of -
_ Ownship scenario)
+40 l ................ - -" .--
Intruder ----- _
Figure 2.9: Intruder Overtake Scenario
Z
36

2.2.2 Scenario 2: Intruder Trajectory Change
In this scenario, the intruder has an original trajectory that will take it away from the
ownship. At 1:30, the intruder changes a waypoint to the other side of the ownship flight path,
creating a co-altitude conflict. The trajectory change occurs one minute before its arrival at the
turn-in waypoint. A conflict band is issued as soon as the trajectory change is initiated on the
FMS-Path Display, but not until the intruder turns into the subject on the Rate and Commanded
State Displays. A schematic is provided in Figure 2.10.
0.0 0- Old Trajectory
-/."'U" I "2:30 New Trajectory
New Trajectory Cued T1:30 !
1:00 <_00 I
+OO
,Intruder I
I
_ Ownship
Figure 2.10: Intruder Trajectory Change Scenario
37

2.2.3 Scenario 3: Ownship Overtake
As shown in Figure 2.1 i, the geometry of this conflict is similar to that of the Intruder
Overtake in Scenario 1. The two aircraft eventually fly on the same flight path, with the intruder
climbing through the ownship's altitude. The intruder starts 2000 feet lower and does not climb
until it turns onto the ownship flight path. The faster ownship has caught up by the time the
intruder reaches the ownship altitude.
I
4:17
-20
!_ Intruder
-20
_ Ownship
Figure 2.11: Ownship Overtake Scenario
2.2.4 Scenario 4: Long Range Conflict and Intruder Level-Off
This scenario, shown in Figure 2.12, involves two distinct events, a long range co-altitude
conflict and an intruder that appears to create a conflict, but levels off safely 1000 ft. above the
ownship. The long range conflict was developed to see how pilots would use intent information in
a situation where they had enough time to plan a maneuver strategy. Of particular interest was
whether pilots would maneuver as soon as the conflict band appeared for the intent displays. This
conflict is a co-altitude convergence that occurs 45 miles ahead of the ownship when the intruder
turns into the ownship flight path.
38

i _...._ °°j_Z°°
6:39
•0-10 1:00
Intruder #2 i Intruder #1Long Range Conflict ntruder Level-Off
' "NOwnship -20
Figure 2.12: Long Range Conflict and Intruder Level-Off Scenario
An intruder level-off safely above the ownship' s altitude was constructed to see whether
pilots would rely on intent information indicating a safe level-off or would maneuver in response to
a conflict band based on current state information. For all intent displays, a conflict band appears
after the intruder begins the descent and disappears when the intruder commences the level-off.
39

2.2.5 Scenario 5: Dual Conflict
The dual conflict shown in Figure 2.13 involves two converging intruders descending and
climbing through the ownship's flight path.
• I +20 /,
._ I 1:44 "_ _. +10
Intruder #2 _" i I Intruder #1
-20 _ Ownship
Figure 2.13: Dual Conflict Scenario
Of particular interest in this scenario was whether pilots could evaluate the extra information
provided with the intent displays in a more complicated situation.
2.2.6 Use of Repeated Scenarios
To reduce the possibility that a pilot would recognize a scenario after repeated trials,
scenarios were mirror imaged both laterally and vertically to produce four different scenario
groups. The location and altitude of intruder aircraft and their waypoints were kept symmetric with
respect to the original ownship flight path and altitude. Both the conflict causing aircraft and the
background traffic were adjusted. An example group of mirror imaged scenarios is shown in
Figure 2.14.
40

Scenario A Scenario B Scenario C Scenario D
.3o I / I
i _o_ i , &+3o i &30Intruder Intruder Intruder Intruder
I I I I
/_ Ownship & Ownship ,/_ Ownship /_ Ownship
Figure 2.14: Mirror Imaged Scenarios
Scenario combinations AfB and C/D are mirrored vertically, and A/C and B,rD are mirrored
]aterally.
41

42

2.3 Method
2.3.1 Apparatus
The experiment to test the four prototype traffic displays and the five scenarios was
conducted on the MIT Part-Task Flight Simulator, located in the Aeronautical Systems Laboratory
(ASL). Aside from the difference in traffic displays, the simulator setup was identical for each
experimental run. A Silicon Graphics computer was used to fly the intruder aircraft through their
preprogrammed trajectories and to show a Primary Flight Display and the traffic enhanced EHSI to
the pilot. Subject pilots could use the autopilot or a side-stick to control the ownship.
A sample display screen is shown in Figure 2.15.
Figure 2.15: Pilot Display Screen
43

The Primary Flight Display (PFD), modeled after a B-747-400, is placed on the left side of the
screen. The current autopilot modes are printed in green, above the attitude indicator. Speed and
altitude tapes are shown on the left and right sides of the display, respectively. At the far right of
the PFD, a vertical speed tape is provided. Commanded states dialed into the MCP are shown in
magenta above the speed and altitude tapes, in addition to on a separate box at the top of the display
screen. Flap and gear position indicators are shown, but were not used during the experiment.
The EHSI/traffic display is placed on the right side of the screen. Figure 2.15 shows the
Commanded State Display being run with Scenario 5, the Dual Conflict.
In an effort to reduce display clutter, intent information on the Rate, Commanded State, and
FMS-Path Displays was initially suppressed if there was no predicted conflict. Pilots had the
option to request or suppress this information for a particular airplane by clicking the computer
mouse on the airplane symbol. Information for all airplanes could be displayed or suppressed
simultaneously by clicking on the "Show All Information" or "Show No Information" boxes to the
left of the traffic display. Information for airplanes projected to cause a conflict was always
shown.
Pilots used keyboard buttons to increase or decrease the range on the display. For displays
incorporating plan and profile views, the forward range was the same on each view and was
adjusted simultaneously. Separate buttons were available to adjust the profile view's vertical
range. There were no minimum or maximum range limits.
Autopilot control was accomplished through a Mode Control Panel (MCP), which had
heading hold, heading select, altitude hold, vertical speed, and level change modes available.
Buttons on the side-stick were used to disengage or re-engage the autopilot. The side-stick was
used for manual control.
2.3.2 Procedure
The primary task of each scenario was the pilot's ability to maintain a minimum safe
separation from other traffic, defined to be 2 nm. laterally or 500 ft. vertically. To see how pilots
44

coulduseintentinformationto resolveconflicts,thescenariostookplacein anunstructuredAir
Traffic Control(ATC) environment.Pilotswereentirelyresponsiblefor maintainingtheir own
traffic separationandwerefreeto conductanavoidancemaneuverof theirchoiceat anytime. A
secondaryobjectivewasto arriveataterminalareaVOR asquicklyaspossiblewithout increasing
theaircraft's speed,andto maketheminimumamountof coursedeviationsnecessaryto meetthe
requiredtraffic separation.
Scenariosbeganwith thepilot flying towardthedestinationVOR at 18,000ft. After
maneuveringto avoidaconflict,pilotswereinstructedto turnbackto theVOR andreturnto
18,000ft. asquickly aspossible,consistentwith safety.ThedestinationVOR wastheonly
navigationaid shownon theEHSI.
In additionto maneuveringto avoidtraffic conflicts,pilotswereaskedto identify intruder
aircraftthatpresentedapotentialthreat.This identificationwasmadeif thesubjectpilot perceived
athreatthathefelt couldrequireanavoidancemaneuver.Whenapilot perceivedsuchathreat,he
wouldpushabuttonon thesidestick.
2.3.3 Training
Prior to beginningtheexperiment,subjectpilotsweregivenabriefingcoveringtheflight
environment,simulator,andtherequiredtasks.A samplebriefing is givenin AppendixA. Since
a primary goal of the experiment was to determine how pilots could use both intent and TCAS
information to resolve conflicts, the briefing emphasized that pilots were not restricted to current
TCAS procedures such as performing a vertical maneuver after an RA is issued. Instead, pilots
were asked to consider all of the information presented on the display and given by TCAS
commands when deciding how and when to maneuver.
During the briefing, features of the primary flight display, TCAS traffic display, and mode
control panel were explained in detail. Pilots were given several practice scenarios to become
accustomed to the displays and the handling characteristics of the simulator. While running these
scenarios, pilots were given the opportunity to fly with both the autopilot and the side-stick.
45

Practicewasgivenwith thebaseTCASDisplayandthenwith thefirst displayusedin the
experiment. Duringtheexperiment,practicescenariosweregivenbeforetestingadisplaythat
includednewinformation.
2.3.4 Performance Metrics
The primary objective performance metrics were the number of separation violations and
the time in which the pilot conducted an avoidance maneuver. The time before separation violation
and the time after a conflict band appeared (on displays employing a conflict probe) were
considered.
At the end of the experiment, subject pilots filled out a questionnaire, asking them to rate
the displays and elements of intent information and to describe their strategies for avoiding traffic
conflicts. A sample questionnaire is provided in Appendix B.
2.3.5 Data Analysis
Within subjects paired t-tests were used to test for significance between means-of both the
separation violation percentage and the avoidance maneuver time. Since each subject was given all
display and scenario combinations, paired t-tests were able to account for differences in
performance between pi!ots. Error bars on all graphs represent one standard error.
Subjective display ratings were analyzed using the Analytic Hierarchy Process (Yang and
Hansman, 1995). T0 perfo_ the AHP, subjects were asked to give a Preference rating for each
possible display combination. A sample comparison question is provided in Figure 2.16.
TCAS Display Rate Display
abso!utely much better slightly same sliqhttv better much absolutelyoener better better b_ttef better better
Figure 2.16: Sample Display Preference Question
This question asks subjects to give their preference between the Rate and TCAS Displays. If a
subject prefers the Rate Display, a check is placed to the right of the middle "same" box.
46

Likewise, if the TCAS Display is preferred, a check is placed to the left of the "same" box.
Stronger preferences are indicated by checking a box further from the middle. Comparison
questions for each display pair are combined to produce overall rankings for each display. The
sum of the overall rankings is normalized to 1. The overall rankings can then be represented as
areas on a pie chart. The relative preference between two display options can be determined by
dividing their respective pie chart areas.
47

48

2.4 Results
2.4.1 Subjects
Eight current commercial airline pilots from major US carriers served as volunteer subject
pilots in the experiment. All had experience in "glass cockpit" and TCAS equipped airplanes.
Their flight time ranged between 5,000 and 24,000 hours, with a mean of 10,875 hours and their
age varied from 39 to 53, with a mean of 46. Four of the eight pilots were captains and six had
military flying experience.
2.4.2 Objective Results: Overall
The first results to be presented are those that are averaged across all scenarios. Of primary
importance are the occurrence of separation violations (cases where the subject pilot came within 2
nm. laterally or 500 ft. vertically of another aircraft) and the time in which the subject pilot initiated
an avoidance maneuver. Plots of separation violation percentage and maneuver time vs. display
type for individual scenarios are provided in Appendix C.
Separation violations are considered to be the most important performance metric, since the
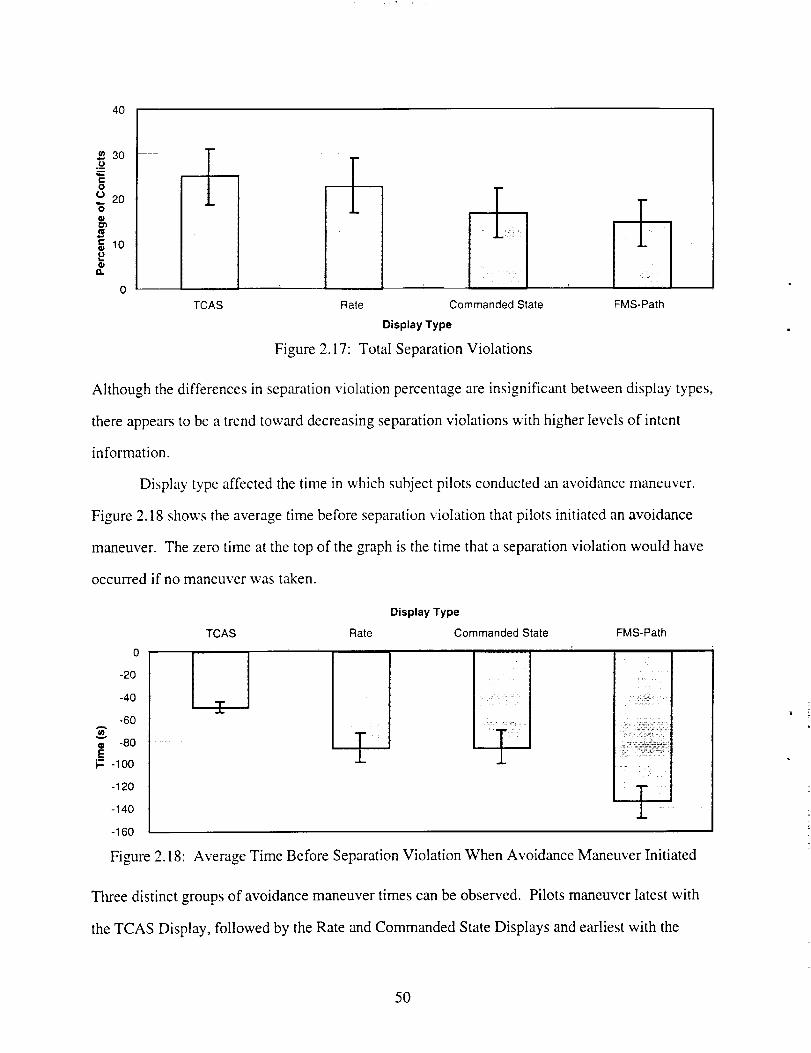
ultimate goal of a traffic display is to keep pilots safely separated from other aircraft. Figure 2.17
shows the percentage of all conflicts that resulted in a separation violation as a function of display
type. Separation violations with background aircraft were included. The eight pilots flew six
conflicts per display, leading to a total of 48 conflicts per display. One should note that the
scenarios were designed to be difficult so that differences in performance between displays could
be detected.
49
4O
30._i
C
oo 2O
lO
0
r
!
- L
Rate Commanded State
Display Type
Figure 2.17: Total Separation Violations
[CAS FMS-Path
Although the differences in separation violation percentage are insignificant between display types,
there appears to be a trend toward decreasing separation violations with higher levels of intent
information.
Display type affected the time in which subject pilots conducted an avoidance maneuver.
Figure 2.18 shows the average time before separation violation that pilots initiated an avoidance
maneuver. The zero time at the top of the graph is the time that a separation violation would have
occurred if no maneuver was taken.
0
-20
-4O
-6O
-80Ei= -100
-120
-140
-160
Display Type
Rate Commanded State FMS-Path
i
]
-5-Figure 2.18: Average Time Before Separation Violation When Avoidance Maneuver Initiated
Three distinct groups of avoidance maneuver times can be observed. Pilots maneuver latest with
the TCAS Display, followed by the Rate and Commanded State Displays and earliest with the
50

FMS-Path Display. Significant differences exist between the TCAS and the Rate or Commanded
State Displays (p < 0.01) and between the Rate or Commanded State Displays and the FMS-Path
Display (p < 0.001). Differences between the Rate and Commanded State Displays are
insignificant.
Any combination of the three features added to the TCAS Display to produce the Rate
Display (conflict bands, display of rate information, or profile view) could have contributed to the
difference in maneuver times between the two displays. The small difference between the Rate and
Commanded State Displays suggest that the addition of commanded heading and altitude to the
Rate Display had little effect on when pilots maneuvered, but may have affected the type of
maneuver.
Two key differences exist between the Commanded State and FMS-Path Displays. The
LNAV/VNAV path information is added to the display and the conflict probe predicts conflicts
based on both the intruder's FMS-Path and current state information. A conflict band is drawn if
either of the two methods predict a conflict. Since future trajectory information is considered, the
FMS-Path Display always produces a conflict band at the same time or earlier than the Rate or
Commanded State Displays. The average time before separation violation that a conflict band
appeared for the displays incorporating a conflict probe is shown in Figure 2.19.
-5O
,._ -1 O0
].7. -150
-20O
-250
Display Type
Rate Commanded State FMS-Path
i_:_ ? i_! ¸¸_:
Figure 2.19: Average Time Before Separation Violation that a Conflict Band Appeared
51

Onaverage,aconflict bandbasedonFMS-Pathinformationappeared72secondsearlierthanone
basedonly oncurrentstateinformation.Oneshouldnotethatthesequantitiesaredeterministicand
dependonly on thedesignof thescenariosfor thisexperiment.
Eventhoughpilotsmaneuveredearliestwith theFMS-PathDisplay,theytendedto wait
longerafteraconflict bandappearedthantheydid with theRateor CommandedStateDisplays.
This resultis shownin Figure2.20. DifferencesbetweentheRateandCommandedStateDisplays
areinsignificant,butdifferencesbetweentheCommandedStateandFMS-PathDisplaysare
significant(p < 0.01).
60
5O
4O
v
30E
i_ 2O
10
--R
Rate Commanded State FMS-Path
Display Type
Figure 2.20: Time to Initiate Avoidance Maneuver After Conflict Band Appeared
This result suggests that pilots are either taking longer to process information on the FMS-Path
Display or the FMS-Path conflict band appears too early for pilots to consider an avoidance
maneuver.
Being alerted to conflicts earlier appears to be a significant asset, as shown in Figure 2.21.
52

100
8O
W
i
= 60o
o"6
en 40tll
O
a. 20
m
!
0 T
0-20 20-40 > 10040-60 60-80
Maneuver Time Before Separation Violation (s)
&80-100
Figure 2.21 : Percentage of Conflicts Resulting in Separation Violation vs. Maneuver Time
Figure 2.21 is a histogram of the percentage of conflicts resulting in separation violation when the
subject pilot maneuvered at different time intervals before the conflict. The plot clearly shows a
benefit to maneuvering earlier. When pilots waited until within 20 seconds of a conflict, they were
unable to avoid a separation violation over 80% of the time. Performance improved monotonically
as pilots maneuvered earlier. The latest avoidance maneuver to result in a separation violation
occurred 85 seconds before the conflict.
2.4.3 Objective Results: Scenario Specific
A further comparison between the current state Rate and Commanded State Displays and
the future state FMS-Path Display can be made by considering the results of the two scenarios
producing the most separation violations. Figure 2.22 shows the separation violation percentage
for each of the five scenarios averaged across all display types.
53

6O
5O
40
8"6 30
20
0
1
Intruder Overtake
2 3 4 5
Intruder Ownship Overtake Long Range Dual Conflict
Trajectory Change Conflict
Scenario
Figure 2.22: Separation Violation Percentage vs. Scenario
The highest percentage of separation violations (48%) occurred with Scenario 1, the Intruder
Overtake. The next most difficult scenario was Scenario 5, the Dual Conflict, in which 23% of all
conflicts and 38% of all scenarios resulted in a separation violation.
Figure 2.23 shows a plot of separation violation percentage vs. display type for Scenario 1,
the Intruder Overtake and Scenario 5, the Dual Conflict.
100
8O
tJ
q,.,- 60O
oo® 40O_
.ca 20
0
TCAS
Figure 2.23:
Rate Commanded FM S-Path
State
Display Type
Separation Violation Percentage vs. Display Type
13Scenario 5,Dual Conflict
• Scenario 1,IntruderOvertake
54

In addition, the time the conflict band appeared and the maneuver time is shown in Figure 2.24.
Display Type
0
-2O
-40
-6O
"_ -80G)
EiT. -100
-120
-140
-16O
Commanded
TCAS Rate State FMS-Path
r_ scenario 5, --
Dual Conflict
• Scenario 1,
Intruder
Overtake
Conflict Band Appears
Figure 2.24: Maneuver Time Before Separation Violation vs. Display Type
Pilots performed significantly better with the FMS-Path Display when compared to the Rate or
Commanded State Displays on Scenario 5, the Dual Conflict (p < 0.05), but not on Scenario l, the
Intruder Overtake. Figure 2.24 highlights a major difference in these two scenarios.
On Scenario 5, the Dual Conflict, the FMS-Path conflict band appears at the beginning of
the scenario, 160 sec. before separation violation. For the Rate and Commanded State Displays,
the conflict band does not appear until 56 sec. before separation violation, when the first intruder
starts to descend toward the subject pilot's aircraft. The conflict band on the FMS-Path Display
gives a full 104 sec. of additional alert time. Pilots appeared to take advantage of this additional
alert time by maneuvering an average of 78 sec. earlier with the FMS-Path than they did with the
Rate or Commanded State Displays (p < 0.01).
When pilots don't maneuver earlier, the FMS-Path Display appears to offer little additional
benefit to the other intent displays. On Scenario l, the Intruder Overtake, the conflict band appears
at the same time for all three displays and the pilots tended to maneuver at nearly the same time.
On this scenario, the only difference between the FMS-Path and the Rate and Commanded State
55
Displaysis thedepictionof theFMS-Path instead of the current and next commanded state
information. Showing multiple future states as opposed to only the next state on the display
appears to have very little effect on when the pilot maneuvers or on whether a separation violation
occurs.
By examining these two scenarios, it appears that the time the conflict band appears plays a
more significant role in when pilots maneuver and in their ability to avoid conflicts than does the
difference between showing FMS-Path and current/next commanded state information on the
display. As shown in Figure 2.21, a display feature that leads to earlier maneuvers, up to several
minutes before the conflict, appears to be an asset. However, with longer range alerts, the number
of false alarm conflicts and unnecessary maneuvers would likely increase.
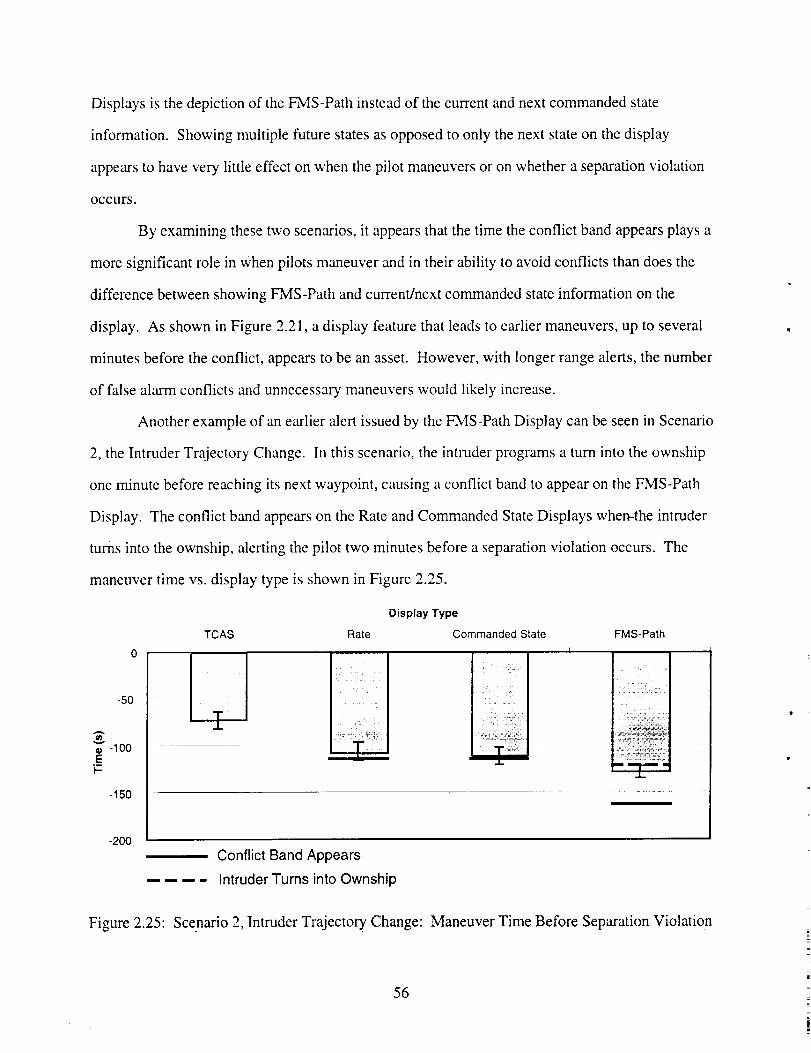
Another example of an earlier alert issued by the FMS-Path Display can be seen in Scenario
2, the Intruder Trajectory Change. In this scenario, the intruder programs a turn into the ownship
one minute before reaching its next waypoint, causing a conflict band to appear on the FMS-Path
Display. The conflict band appears on the Rate and Commanded State Displays when-the intruder
turns into the ownship, alerting the pilot two minutes before a separation violation occurs. The
maneuver time vs. display type is shown in Figure 2.25.
Display Type
TCAS Rate Commanded State FMS-Path
EI-
-5O
-100
-150
-200
i¸ _
T..L
T _
,.I..
Conflict Band Appears
.... Intruder Turns into Ownship
Figure 2.25: Scenario 2, Intruder Trajecto_ Change: Maneuver Time Before Separation Violation
56

On average, pilots maneuvered before the intruder reached the turn-in waypoint when flying with
the FMS-Path Display. As opposed to Scenario 5, the Dual Conflict, where the FMS-Path Display
led to significantly fewer separation violations, pilots did not appear to have a problem avoiding the
conflict in this scenario. Only one out of a possible 32 conflicts resulted in a separation violation.
The results of this scenario reaffirm that pilots tend to maneuver when shown a conflict band based
on FMS-Path information. However, there appears to be little benefit to this earlier alert when the
intruder commences a turn, climb, or descent toward the ownship several minutes before the
conflict.
In addition to the long range conflict, Scenario 4 included an event where an intruder
started a descent into the ownship but leveled off 1000 feet above the ownship altitude. A conflict
band based on current state information was drawn for all three intent displays and didn't disappear
until the intruder started to level-off. A profile view of the level-off event is shown in Figure 2.26.
_43
1000 ft.
Ownship z
Intrud_
Conflict Region
Actual Path
.... Projected Path
Figure 2.26: Profile View of Scenario 4, Intruder Level-Off
A level-off event was scripted to occur with each run of Scenario 4, the Long Range Conflict and
Intruder Level-Off. However, many pilots maneuvered early in response to the long range conflict
and never encountered the level-off event. On cases where the level-off event did occur, pilots
57

maneuvered5 outof 6 times(83%)with theCommandedStateDisplayand4 outof 4 timeswith
theFMS-PathDisplay. Pilotsmaneuveredasfrequentlyfor thesedisplaysshowingtheintruder's
intentionsto level-off astheydid for theRateandTCASDisplays. Onthisparticularevent,pilots
did notseemto noticethelevel-off informationor mayhavebeenunwilling to rely onit.
Likewise,pilots mayalsohavemaneuveredin responseto theconflict bandshownon thedisplay.
2.4.4 Subjective Results
The overall rankings for pilot display preference are provided in Figure 2.27.TCAS0.05
FMS-Path0.26 Rate
0.23
CommandedState0.46
Figure 2.27: Pilot Display Preference
Pilots greatly preferred all of the intent displays to the TCAS Display. The Commanded State
Display had the highest overall ranking, being preferred by pilots twice as much as the Rate and
FMS-Path Displays and nine times as much as the TCAS Display.
In addition to rating the displays, pilots were asked to indicate which displays were too
cluttered. Figure 2.28 shows these results.
58

100
O
8O
6O
4O
20
0
TCAS Rate
Display Type
', i I|
Commanded FMS-Path
State
Figure 2.28: Percentage of Pilots Indicating Display Was Too Cluttered
More than half of the pilots found the FMS-Path Display to be too cluttered, a significantly higher
percentage than any of the other displays (p < 0.05).
Another question asked pilots to rate each element of intent information, if available, for itsw
value in enabling them to recognize and resolve traffic conflicts. The average scores are given in
Figure 2,29.
SCALE
1: Very Detrimental2: Somewhat Detrimental3: Neutral4: Somewhat Valuable
5: Very Valuable
Conflict FMS-PathBands
_ ili!i_i¸!
, i!ii !i!!
CommandedAltitude
1"
T
Current
Heading
|
-- I
" ';? Il
Commanded
Heading
Figure 2.29: Value of Information Elements
59

The "Altitude Rate" refers to the altitude rate arrow on the profile view Rate Display and not to the
standard TCAS altitude rate arrow on the plan view display. Although all information elements
were deemed to have some value, current and commanded state information scored the highest.
To help determine whether the profile view display provided an additional benefit, pilots
were asked for their level of agreement with the two questions shown in Figure 2.30.
"The profile view display made me more awareof the traffic situation in the vertical plane."
5o
"5 _ 25
4.-¢..1
o
StronglyDisagree
Neutral AgreeDisagree StronglyAgree
"1 could get traffic information as easily from the
EHSI as I could from the profile view display."
E..E,,,.. "OO t-
fl.
5O
25
Strongly Disagree Neutral Agree StronglyDisagree Agree
Figure 2.30: Subjective Questions Regarding Profile View Display
These results suggest that pilots felt the profile view display had some benefit, but they didn't have
trouble obtaining the same information from the plan view EHSI.
60
2.5 Discussion
Both objective and subjective data suggest that there is a benefit to adding some level of
intent information to the base TCAS Display. With the intent displays, pilots had fewer separation
violations and tended to maneuver earlier to avoid conflicts. Separation violation data suggest that
there is not an overall benefit to the FMS-Path Display over the other intent displays, although it
did lead to better performance on Scenario 5, the Dual Conflict. Most pilots preferred the
Commanded State Display, in addition to finding the FMS-Path Display to be too cluttered.
Seeing the lack of a clear benefit to providing FMS-Path information, one should take a
closer look at the many practical issues involved with implementing such a display. As discussed
previously, the FMS trajectory was simplified to a basic linear model, neglecting speed changes,
mode transitions, and differences in FMS architecture between aircraft. Considering that
numerous problems have been documented with pilots becoming confused over the state of their
own aircraft (Vakil and Hansman, 1995), one could question whether pilots would be capable of
monitoring and interpreting the states of other aircraft. In addition, all intruder aircraf_'flew in
LNAV/VNAV mode during the experiment, so FMS-Path information was always available. A
real FMS-Path Display would not be able to show LNAV and VNAV information for aircraft
flying in manual or state modes or for those unequipped with an FMS. These "mixed mode"
operations were not considered in this experiment.
A profound decrease in separation violations was observed when pilots maneuvered earlier.
This result suggests that displays that encourage pilots to maneuver earlier, within several minutes
of the conflict, are beneficial. No separation violations were observed in cases where pilots
maneuvered at least two minutes before the conflict. Considering the likelihood of more alerts and
unnecessary avoidance maneuvers as the alert time increases, a display that alerts pilots within
several minutes of the conflict may be advantageous to one that issues even longer range alerts.
For the Rate, Commanded State, and FMS-Path Displays, results suggest that the time the
conflict band appears has a greater affect on when pilots maneuver than does the level of intent
information shown directly on the display. Across all scenarios, the Rate and Commanded State
61

Displaysledto similarmaneuvertimes. Also,pilotsmaneuveredataboutthesametimefor the
threeenhanceddisplaysonscenarioswherethecurrentstateandFMS-Pathbasedconflict bands
appearedatthesametime.
Theresultsof thefirst experimentledto threekeyquestionsthatwarrantedfurtherstudy.
First,whichof thethreeadditionsto theTCASDisplay: conflict bands,intentinformationshown
on thedisplay,or theprofileview weremostresponsiblefor thereductionin separationviolations
andtheearliermaneuvertimes?Secondly,wouldpilotsperformaswell with adisplaythatalerts
severalminutesin advanceof aconflict aswith onethathasalongerrangealert? Finally, is there
anaddedbenefitto aplan/profileview combinationoveraplanview displayalone?
62

Chapter 3
Experiment 2
The second experiment examined the individual and collective effect of displaying intent
information directly to the pilot and incorporating it into a conflict probe. The Test Matrix is
shown in Table 3.1. The matrix was evaluated on four new traffic scenarios and was
counterbalanced by varying the order of the six display options.
Table 3.1" Experiment 2 Test Matrix
Applied Intent Information
co
,m
Ei._
O14--
r"m
,,I,d
t-
t-inqDG)>,
m
¢2.¢)
im
CI
TCAS
CommandedState
No Conflict Band
X
X
Conflict Band with2 Minute Look-Ahead
X
X
Conflict Band withLong RangeLook-Ahead
X
X
The TCAS and Commanded State Levels were tested as two different ways to display
intent information to the pilot. The Commanded State Display was chosen to represent the three
enhanced displays from Experiment 1 since it led to similar performance, was preferred by the
pilots, and would be easier to implement than the FMS-Path Display.
Intent information can also be incorporated into the display through the use of a conflict
probe. Cases were run with and without a conflict probe. To compare performance with short and
long range alerts, conflict probes with two minute and long range look-ahead times were tested.
With the two minute look-ahead, a conflict band only appeared within two minutes of a projected
conflict. The look-ahead time of the long range conflict probe was longer than any of the scenarios
used during the experiment, causing a conflict band to appear as soon as a conflict was projected.
\\
\
63

Finally,to evaluatepilot performancewith andwithouta profileview, theCommanded
StateDisplaywasmodifiedto includeonly aplanview. In orderto provideadirectcomparison,
thesameIntruderOvertakeScenariousedin Experiment1wasincludedin thescenarioset.
64

3.1 Display Design
Four different displays were tested, corresponding to the options of TCAS and
Commanded State, with and without conflict bands, All displays provided only a plan view.
3.1.1 TCAS Display
The TCAS Display with Conflict Bands is shown in Figure 3.1. Conflict prediction is
based on current state information and the same separation criteria is used as in Experiment 1. The
aircraft ID was always printed in white for displays without conflict bands.
Figure 3.1: TCAS Display with Conflict Bands
65

3.1.2 Commanded State Display
A minor change was made to the Commanded State Display from Experiment 1. Since the
profile view was not used, the commanded altitude was shown on the plan view display in
magenta. The altitude shown is the relative altitude between the intruder's commanded altitude and
the ownship's current altitude. A sample Commanded State Display with Conflict Bands is
provided in Figure 3.2.
Figure 3.2: Commanded State Display with Conflict Bands
Unlike the first experiment, commanded state information was shown for all aircraft regardless of
conflict status. Pilots were not able to deselect the information.
66

Forthesecondexperi_elat,pilots weregiventheoptionof showingtheintruder'scurrent
andcommandedaltitudewith respectto meansealevelor relativeto theownship,asdepictedon
thedisplaysabove. Sixpilotsusedtherelativealtitudeandtwousedtheabsolutealtitude.
67

68

3.2 Scenario Design
Four scenarios were designed to highlight features of the displayed intent information and
the conflict probe.
3.2.1 Scenario 1: Short Range Conflict
The Short Range Conflict Scenario is shown in Figure 3.3.
i i i
I
I
I
-10 • Ii_ scenario)
1:47 __20
I
I
_ Ownship
-- Ownship Nominal Path
Intruder Path
X Point of Separation Violation
(time given in minutes andseconds from start of
Intruder
Figure 3.3: Short Range Conflict Scenario
The intruder turns and descends into the ownship fifty seconds before a separation violation. In
this scenario, both the two minute and long range conflict bands appear when the intruder turns in.
For this reason, it was expected that separation violations and maneuver times would be similar for
both conflict band cases of the same display. Thescenario was also designed to see how pilots
would perform with the various display options under a close-in tactical conflict.
69

3.2.2 Scenario 2: Intruder Maneuvers During Conflict
This dynamic conflict scenario was designed to determine whether pilots could use intent
information to detect an intruder that maneuvers toward them while they are maneuvering. Unlike
the scenarios for Experiment 1 and the other scenarios for Experiment 2, the intruder's trajectory
depends on the actions of the ownship. A drawing is given in Figure 3.4.
Intruder /4
+00 _ 0:47
+00 _lntruder
I
I 3:35
"-X--*_Possible Point of Separation Violation
I
!
I
i
I
g Ownship
Figure 3.4: Intruder Maneuvers During Conflict Scenario
Forty-seven seconds from the start of the scenario (0:47), the intruder turns in to pass over the
ownship's flight path co-altitude at 4:03, causing a separation violation at 3:35. Cues for the
intruder to maneuver a second time are an ownship deviation of 15 degrees or 300 ft. from its
original flight path. If the ownship triggers the turning cue first, the intruder turns into the
ownship to recreate the conflict at 3:35. If the subject triggers the climb/descent cue first, the
intruder climbs or descends to an altitude 1000 ft. above or below the subject's altitude at the time
the cue is triggered. In each case, the traffic situation is made worse by the secondary maneuver of
the intruder.
70

3.2.3 Scenario 3: Long Range Conflict
The Long Range Conflict Scenario, shown in Figure 3.5 is similar to the one used in
Experiment I.
+30):33
+30
"_ Intruder
7:40
_ Ownship
Figure 3.5: Long Range Conflict Scenario
Little data was obtained for the long range conflict in Experiment 1 due to the presence of the
intruder level-off event. It was hoped that the long range conflict would show whether pilots'
response time depended on the look-ahead time of the conflict band. Differences in maneuver
times for all options of displayed and applied intent information were examined.
3.2.4 Scenario 4: Intruder Overtake and Multiple Conflict
The intruder overtake airplane is the same as the one used in the Intruder Overtake Scenario
of Experiment 1. Separation violation with this aircraft happens at 1:22 if no avoidance maneuver
is taken. In addition, a multiple conflict with three other aircraft is designed at 4:00. This scenario
is drawn in Figure 3.6.
71

+6c ! +10j ,ntru er,4'
I +4_0:>+00Intruder #2
-40 _o[ 30
1:22 Intruder #3
I
Ownship
_ Intruder#1-40 Intruder Overtake
Figure 3.6: Intruder Overtake and Multiple Conflict Scenario -
Conflict bands for the multiple conflict appear at the start of the scenario for the long range conflict
band, but not for the two minute band. It was thought that pilots might become distracted by
trying to interpret all of the conflicts, causing them to delay maneuvering for the nearest conflict.
Separation violation differences between the two minute and long range conflict band were
examined for each display. Results were also compared between this scenario and the Intruder
Overtake Scenario from Experiment 1 to determine whether the profile view had a significant
effect.
72

3.3 Method
3.3.1 Apparatus
The MIT Part Task Flight Simulator was again used as the experimental apparatus.
pilots were unable to select or deselect intent information, the mouse was not used.
Since
3.3.2 Procedure
The general procedure for each experimental run was identical to Experiment 1. As before,
pilots were to fly direct to the VOR shown on the EHSI at 18,000 ft. unless necessary to avoid
other traffic. After a conflict was resolved, pilots would turn back to the VOR and return to
i8,000 ft. As in Experiment 1, the primary goal of each scenario was to maintain the required
separation of 2 rim. laterally or 500 ft. vertically from all other traffic.
3.3.3 Training
A pre-experiment briefing similar to the first experiment was given to the pilots, a sample
of which is provided in Appendix D. As with Experiment 1, aspects of the simulator, displays,
and flight environment were reviewed. Practice scenarios were given before the experiment with
the base TCAS Display and before conducting test runs using a display with new information.
3.3.4 Performance Metrics
As in the first experiment, the primary performance metrics were the percentage of conflicts
resulting in a separation violation and the maneuver time. A similar subjective questionnaire was
used at the end of the experiment. A sample is provided in Appendix E. Subjects were asked to
give their preferred combination of intent information and conflict bands and to rate the value of the
available information elements. Other questions asked for their collision avoidance strategies with
and without intent information and conflict bands and for their opinion on the best time and range
to issue an alert.
73

3.3.5 Data Analysis
Within subjectspairedt-testswereagainusedto testfor significancebetweenmeansof
separationviolationpercentageandmaneuvertime. All errorbarsshownonplotsrepresentone
standarderror. A twofactorwithin subjectsANOVA wasalsoperformedto testwhetherchanging
thedisplayedintentinformationor thelook-aheadtimeontheconflictbandshadanoveralleffect
on thepercentageof separationviolationsor themaneuvertime. TheAHP wasusedto produce
overallrankingsfor pilot preferenceof displaytypeandconflict bandoption.
74Z

3.4 Results
3.4.1 Subjects
Eight commercial airline pilots served as volunteer test subjects for the second experiment.
Six were active and two had retired within the preceding four months. All had experience on glass
cockpit aircraft. Their flight experience ranged between 8,300 and 28,000 hours with a mean of
16,225 hours. Their ages ranged from 35 to 60 with a mean of 49. Six of the eight were captains
and four had military flying experience.
3.4.2 Objective Results: Overall
The most direct result of pilot performance, the separation violation percentage, is plotted
vs. display option in Figure 3.7. Each of the six display options of displayed and applied intent
information had four possible conflicts per pilot. Only the intruder overtake conflict was
considered for Scenario 4, the Intruder Overtake and Multiple Conflict. There were eight pilots,
leading to a total of 32 conflicts per display option. As in Experiment 1, conflict scenarios were
designed to be difficult.
I OO
8o
c: 60o
L)
"6¢ 40
_ 207"
[] No Conflict Band
• 2 Minute Conflict Band
o Long Range Conflict Band
TCAS CommandedState
Display Type
Figure 3.7: Total Separation Violations vs. Display Option
75

Theresultsshowthattheadditionof eitherconflictbandsor intent information to the base TCAS
Display resulted in fewer separation violations. Each enhanced option led to significantly better
performance than the TCAS Display alone (p < 0.05). The differences between the two minute
and long range conflict bands for each display type were insignificant (p > 0.05). A two factor
ANOVA considering the effect of displayed and applied intent information showed that neither had
a significant overall effect on the number of separation violations.
The time the subject pilots conducted an avoidance maneuver can be seen in Figure 3.8.
Display Type
Commanded
TCAS State
0
-25
-50
-75
-100
-125
-150
E°uI--
[] No Conflict Band
• 2 Minute Conflict Band
[] Loncl Ranqe Conflict Band
Figure 3.8: Average Maneuver Time Before Separation Violation
Figure 3.8 shows that displaying either intent information or conflict bands cause pilots to make
earlier avoidance maneuvers. A two factor within subjects ANOVA shows that both effects have
overall significance (p < 0.05).
Pilot maneuver times can also be considered in reference to when the conflict band
appeared. These results are shown in Figure 3.9.
76

EV-
140
120
100
8O
6O
TCAS
Display Type
CommandedState
4O
2O
0
[] 2 Minute Conflict Band
• Long Range Conflict Band
Figure 3.9: Average Time to Conduct Avoidance Maneuver After Conflict Band Appeared
Two significant results can be obtained from Figure 3.9. With the two minute conflict band, pilots
maneuvered 42 sec. after the band appeared when using the TCAS Display and only 14 sec. after
with the Commanded State Display. This difference is significant (p < 0.01). This result suggests
that when given current and commanded state information, pilots are more willing to conduct an
avoidance maneuver promptly when a conflict band appears. The intent information shown on the
display seems to reinforce the issuance of the alert, thus reassuring pilots that an avoidance
maneuver is appropriate.
With the long range conflict band, pilots waited over a minute to maneuver after the alert
was issued. This significantly longer delay time with the long range band when compared to the
two minute band for each display type (p < 0.01) implies that the pilots consciously ignored the
longer alerts, possibly feeling that they were issued too early.
The relationship between the separation violation percentage and the maneuver time is
shown in Figure 3.10.
77
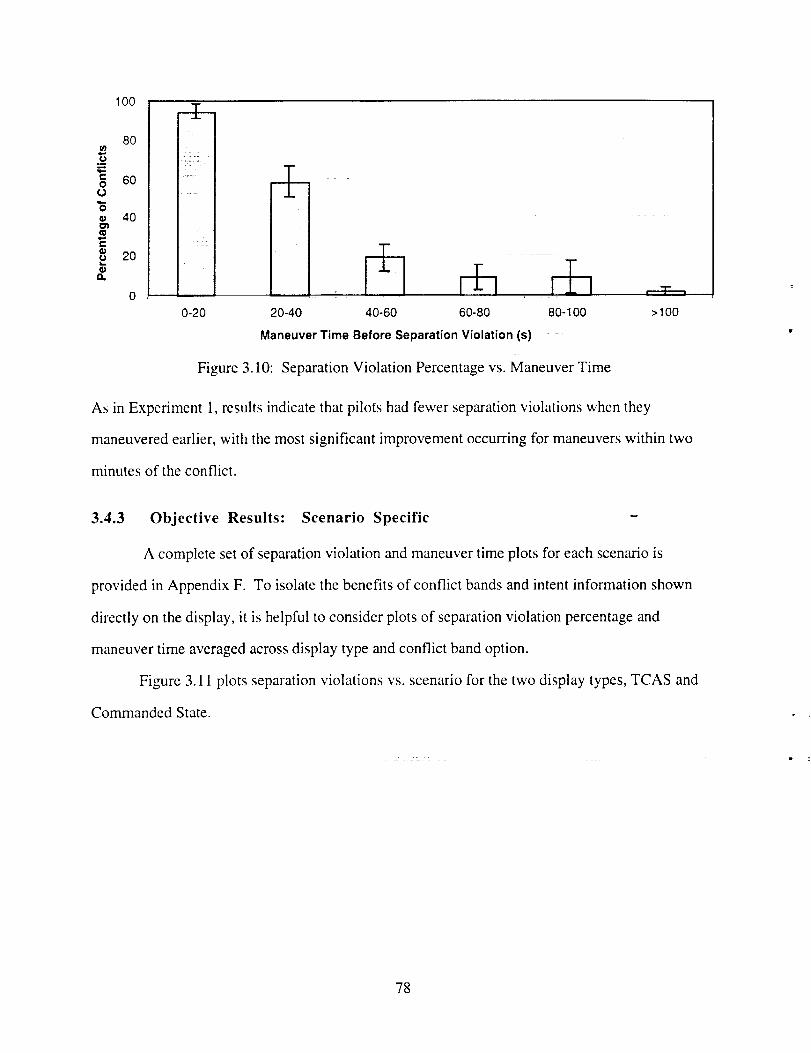
0q
C
0
0
C
I O0
8O
60
40
2O
0
t
F
r
L .....
0-20
.,,.,,..,=i.,=.,,.
,..u.,,=
_ r-h20-40 40-60 60-80
Maneuver Time Before Separation Violation (s)
Figure 3.10:
80-100
Separation Violation Percentage vs. Maneuver Time
>100
As in Experiment l, results indicate that pilots had fewer separation violations when they
maneuvered earlier, with the most significant improvement occurring for maneuvers within two
minutes of the conflict.
3.4.3 Objective Results: Scenario Specific
A complete set of separation violation and maneuver time plots for each scenario is
provided in Appendix F. To isolate the benefits of conflict bands and intent information shown
directly on the display, it is helpful to consider plots of separation violation percentage and
maneuver time averaged across display type and conflict band option.
Figure 3.11 plots separation violations vs. scenario for the two display types, TCAS and
Commanded State.
78

8O
I
1 2 3 4
Short Range Intruder Maneuvers Long Range Intruder Overtake
Conflict During Conflict Conflict
Scenario
13 TCAS
• Commanded State
Figure 3.11" Separation Violation Percentage vs. Scenario and Display Type
Separation violations are averaged across all conflict band options. It is interesting to note that
performance is very similar between the TCAS and Commanded State Displays except for Scenario
4, the Intruder Overtake, where pilots performed significantly better with the Comman-ded State
Display (p < 0.05). One possible explanation is that pilots maneuvered earlier with the
Commanded State Display for all conflict band options, as shown in Figure 3.12.
79

0
-10
-20
-30
_" -40
E -50i=
-60
-70
-80
-90
Display Type
Commanded
TCAS State
Conflict Band Appears
[] No Conflict Band
• 2 Minute Conflict Band
[] Long Range Conflict Band
Figure 3. t2: Scenario 4, Intruder Overtake: Maneuver Time Before Separation Violation
In this scenario, maneuver times averaged across all conflict band options are significantly earlier
for the Commanded State Display (p < 0.05). The intruder overtake was a strictly vertical conflict,
which suggests that the commanded altitude may have been a dominant factor in the earlier
maneuvers.
In order to consider the performance effect of the conflict band, separation violations can be
plotted for each scenario with and without the conflict band. These results are shown in Figure
3.13. The "with conflict band" data is the combined separation violation percentage for the 2
minute and long range look-ahead conflict bands.
80

Ill
e"Ill
oIlaII.
wo
C
.o
tllQ.
¢/)
80 i
70 -
60 :
40
a0
20
10
0
1
Short RangeConflict
I
2 3 4
Intruder Maneuvers Long Range Intruder OvertakeDuring Conflict Conflict
Scenario
[] Without Conflict Band
• With Conflict Band
Figure 3.13: Separation Violation Percentage vs. Scenario and Conflict Band Option
The presence of the conflict band appears to reduce the number of separation violations for all
scenarios, however, the result is only significant for Scenario 2, Intruder Maneuvers During
Conflict (p < 0.05). This scenario involved the intruder maneuvering toward the subject at very
close range. It is possible that the conflict band provided an immediate notification that the
situation had deteriorated and could be interpreted more quickly than intent information shown on
the display. The addition of displayed intent information without conflict bands did not appear to
be helpful in this scenario, as seen from Figure 3.11.
One objective of the second experiment was to compare results between displays that
showed both plan and profile views and those that had the plan view alone. The Intruder Overtake
Scenario from Experiments I and 2 is used to make this comparison. Figure 3.14 shows the
separation violation percentage for this scenario with the Commanded State Display. Each bar
represents the percentage of eight conflicts that resulted in a separation violation.
81

6OCommanded State Display
50
C
• 40
Q.
tll
o 20
C
.2_ lO
oWith Profile View Display Without Profile View Display
2 Minute Conflict Band
I
!Without Profile View Display
Long Range Conflict Band
Experiment 1 Experiment 2
Figure 3.14: Separation Violation Percentage for Intruder Overtake Scenario
with and without Profile View Display
Performance is very similar regardless of whether the profile view display is used. InExperiment
2, a long range multiple conflict was added, making the Intruder Overtake Scenario more difficult
than Experiment 1. Even so, pilots performed as well in both the two minute and long range
conflict band cases.
Performance on Scenario 3, the Long Range Conflict is offered in contrast to the tactical
scenarios discussed previously. Separation violation percentage varied little between display
option, as shown in Figure 3.15.
82

100
80
f-q)
=o60
a.
c
_o__ 400
C
_o 20
e,J
0
Figure 3.15:
TCAS
13No Conflict Band
• 2 Minute Conflict Band
[] Lonq Ranqe Conflict Band
Long Range Conflict
Commanded
State
Display Type
Scenario, Separation Violation Percentage vs. Display Option
As shown in Figure 3.16, pilots maneuvered significantly earlier with the Commanded State
Display (p < 0.05). A trend is also observed toward earlier maneuvers with the long range conflict
band.
-50
-100
-150
_" -200
.E -250I,-
-300
-350
-400
-450
Display Type
Commanded
TCAS State
[] No Conflict Band
• 2 Minute Conflict Band
I_ Long Range Conf!ict Band
Conflict Band Appears
Figure 3.16: Long Range Conflict Scenario, Maneuver Time Before Separation Violation
The presence of either the conflict bands or displayed intent information appeared to alert pilots to
the conflict earlier, however this advance notice had little affect on their ability to avoid the conflict.
83

3.4.4 Subjective Results
An AHP analysis was performed on all display options and is shown in Figure 3.17.
TCAS Alone0.06
CommandedState with
Conflict Bands0.47
TCAS withConflict Bands
0.18
CommandedState Alone
0.30
Figure 3.17: Pilot Display Preference
Pilots preferred all display options over the base TCAS Display by at least a 3:1 margin.
They tended to prefer the Commanded State Display with Conflict Bands the most, but if required
to make a choice, they would rather have intent information shown directly on the display than
incorporated into a conflict probe.
Pilots were asked to indicate which display options were too cluttered. These results are
provided in Figure 3.18.
84
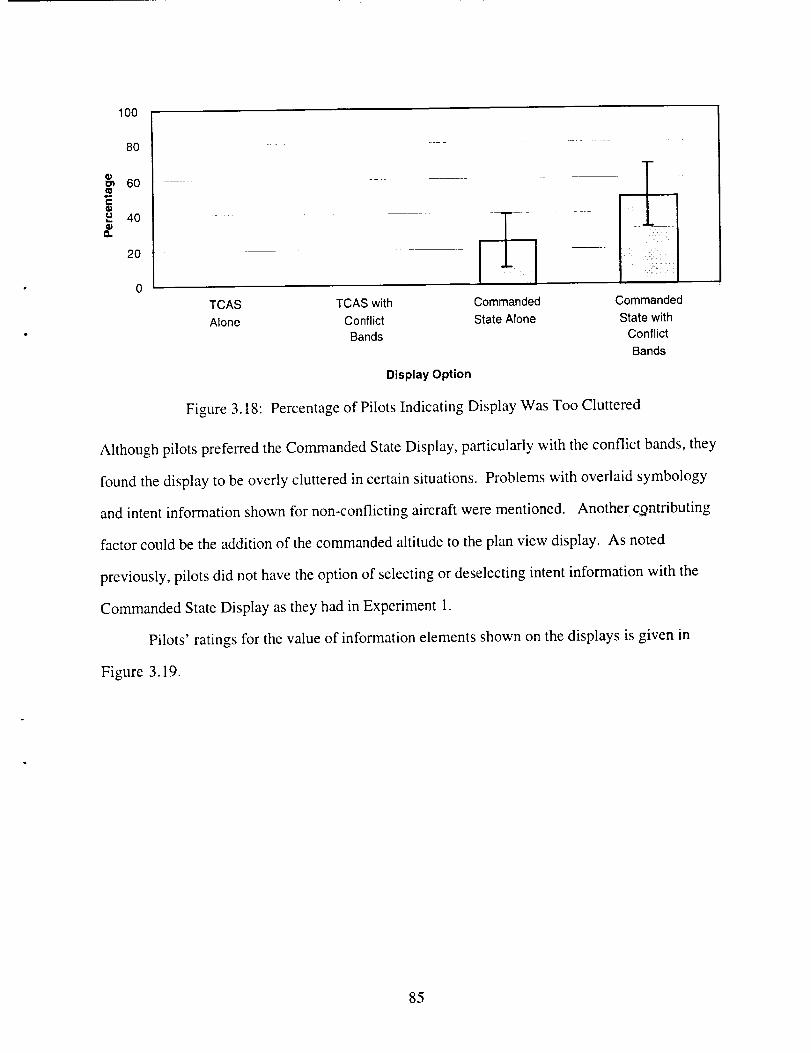
100
8O
60
40
2O
0
TCAS
Alone
TCAS with
Conflict
Bands
Commanded
State Alone
Commanded
State with
Conflict
Bands
Display Option
Figure 3.18: Percentage of Pilots Indicating Display Was Too Cluttered
Although pilots preferred the Commanded State Display, particularly with the conflict bands, they
found the display to be overly cluttered in certain situations. Problems with overlaid symbology
and intent information shown for non-conflicting aircraft were mentioned. Another cgntributing
factor could be the addition of the commanded altitude to the plan view display. As noted
previously, pilots did not have the option of selecting or deselecting intent information with the
Commanded State Display as they had in Experiment 1.
Pilots' ratings for the value of information elements shown on the displays is given in
Figure 3.19.
85

SCALE
1: Very Detrimental2: Somewhat Detrimental
3: Neutral4: Somewhat Valuable
5: Very Valuable
1
Conflict
Bands
Figure 3.19:
Current Commanded
Heading Heading
Value of Information Elements
Aircraft ID CommandedAltitude
Pilots rated all of the information elements to be valuable, but rated displayed intent information
higher than the conflict bands. Commanded altitude received the highest rating, with 7 out of 8
pilots rating it "very valuable".
When asked what the maximum range in miles or minutes should be for showing conflicts,
pilots gave answers ranging from 10 to 40 miles and 1.5 to 5 minutes. Some gave varying ranges
depending on the traffic density. Three pilots mentioned that all conflicts should be shown within
the range indicated, four preferred to see only the nearest one or two conflicts, and one wanted to
see the nearest 5 to 7 conflicts.
86

3.5 Discussion
Separation violations were reduced by almost the same amount over the base TCAS
Display when intent information was either displayed directly or incorporated into a conflict probe.
When displayed intent and conflict bands were used in combination, there was little improvement
in separation violations over cases where they were provided individually, although pilots
preferred the combined Commanded State with Conflict Bands Display.
As with Experiment 1, there were fewer separation violations when pilots maneuvered
earlier, within several minutes of the conflict. The addition of either displayed intent or conflict
bands both led to earlier maneuvers. Pilots tended to maneuver faster in response to a conflict
band when using the Commanded State Display. The displayed intent information appeared to
complement the conflict band, encouraging pilots to maneuver soon after the conflict band was
issued.
Separation violation percentage was similar between the two minute and long range look-
ahead conflict bands. For the conflicts used in this experiment, there seemed to be no additional
benefit to alerting to conflicts beyond two minutes. In addition, pilots waited much longer to
maneuver after a long range conflict band was issued when compared to their response to a two
minute band. This result suggests that pilots may have felt that the long range alert was issued too
early.
A limited comparison showed that pilots performed as well with the plan view display
alone as they had in Experiment 1 with the combined plan/profile view display. This comparison
only considered the results for the Commanded State Display on the Intruder Overtake Scenario.
Pilots found the commanded altitude to be more valuable in conflict recognition and
avoidance than any other piece of intent information. Their ability to use this information seems to
be supported by their significantly better performance with the Commanded State Display on the
vertical conflict, Intruder Overtake Scenario.
87

88

Chapter 4
Conclusions
Results from the two experiments show that intent information is valuable in enabling pilots
to recognize and resolve traffic conflicts. Displaying intent directly or incorporating it into a
conflict probe both appear to be beneficial. With intent in either form, pilots maneuvered earlier
and had fewer separation violations. Also, pilots rated all intent displays higher than the basic
TCAS Display.
The Commanded State Display led to the best overall performance on the two experiments.
In the first experiment, pilots performed as well with the Commanded State Display as they had
with the other intent displays, and better than with the TCAS Display. The Commanded State
Display was preferred by the pilots and would be more practical to implement than the FMS-Path
Display. Pilots consistently rated the current heading, commanded heading, and commanded
altitude as "somewhat valuable" or "very valuable".
A two minute look-ahead time for conflict bands appears to be sufficient in alerting pilots to
conflicts in these two experiments. In the second experiment, pilots performed as well with the
two minute conflict band as they did with the long range band. Also, most of the reduction in
separation violation percentage occurred for maneuvers performed within two minutes of the
conflict. In practice, varying workload conditions and differences in the flight environment would
likely have an influence on the most desirable time to alert. Different look-ahead times may be
needed for terminal and en-route operations.
Many additional display issues will need to be carefully examined before intent information
can be incorporated into a CDTI. Symbology must be tuned to fit into the small traffic displays
common in current commercial airline cockpits. Strategies to prevent information overload,
especially in time critical situations will need to be considered. These two experiments have
shown, however, that pilots are supportive of intent information and are able to use it effectively in
a variety of traffic situations.
89

90

References
Beringer, D. (1991). When High is Big and Low is Small, Decisions Aren't That Hard at All:Analog Encoding of Altitude in C.D.T.I. Revisited. In R. S. Jensen & L. A. Rakovan(Eds.), Proceedings of the Sixth bzternational Symposium on Aviation Psychology.(pp. 126-132). Columbus, OH.
Beringer, D. B. & Allen, R. C. (1993). Encoding Altitude and Rate Information in CockpitTraffic D!splays: CoIor My World. In R. S. Jensen & L. A. Rakovan (Eds.), Proceedingsof the Se_ enth International Symposium on Aviation Psychology. (pp. 103-107).Columbus, OH.
Beringer, D. B., Allen, R. C., Kozak, K. A., & Young, G. E. (1993). Responses of Pilots andNonpilots to Color-coded Altitude Information m a Cockpit Display of Traffic Information.In Proceedings of the Human Factors and Ergonomics Society 37th Annual Meeting.(pp. 84-87). Santa Monica, CA: Human Factors Society.
Boucek, Jr., G. P., Smith, W. D., and Pfaff, T. A. (1985). The Consideration of Pilot Factorsin Development of Future Collision Avoidance Systems. In Fourth Aerospace BehavioralEnghleerb_g Technology Conference Proceedings (pp. 93-101). Long Beach, CA: SALE.
Burgess, D. W., Altman, S. I., & Wood, M. L. (1994). TCAS: Maneuvering Aircraft in theHorizontal Plane. The Lincohz Laboratory Journal 7(2), 295-311.
Chappell, S. L. (1990). Pilot Performance Research for TCAS. In Third Human ErrorAvoidance Techniques Conference Proceedings (pp. 51-68). Warrendale, PA: SAE.
Chappell, S. L., Scott, B. C., & Billings, C. E. (1987). Information Transfer in Pil6ts' Use of aCollision Avoidance System. In Proceedings of the Hunzan Factors Society-31st AnnualMeeting (pp. 428-431). Santa Monica, CA: Human Factors Society.
David, H. & Thomas, V. (1994). Choice of Climb/Descent Symbols for Air Traffic ControlDisplays. In Proceedings of the Ergononffcs Society's 1994 Annual Conference.(pp. 311-316). London, England: Contemporary Ergonomics
Federal Aviation Administration. (1995). Advancing Free Flight Through Human FactorsWorkshop Report..
Hahn, E. C. & Wanke, C. R. (1995). Preliminary Requirements for Avionics Intent Informationfor Free Flight. In Proceedings of the 14th Digital Avionics Systems Conference (pp. 146-15 i). New York, NY: The Institute of Electrical and Electronics Engineers, Inc.
Harman, W. H. (1989). TCAS: A System for Preventing Midair Collisions. The LincohzLaboratory Journal, 2(3), 437-457.
Hart, S. G. & Loomis, L. L. (1980). Evaluation of the Potential Format and Content of a CockpitDisplay of Traffic Information. Human Factors Journal, 22(5), 591-604.
Johnson, E. N. & Hansman, R. J. (1995). Multi-Agent Flight Simulation with Robust SituationGeneration. NASA Grant NAG2-716.
Jones, R., Knittel, G. H., & Orlando, V. A. (1995). Automatic Dependent SurveillanceBroadcast via GPS-Squitter: a Major Upgrade to the National Airspace System. In AirTraffic Control Technologies Proceedings (pp. 2-13). Bellingham, WA: SPIE-TheInternational Society for Optical Engineering.
91

Orlando,V. A., Knittel, G. H., & Boisvert,R. E. (1994). GPS-Squitter:SystemConcept,Performance,andDevelopmentProgram.The Lincoln Laboratory JoupvTal 7(2), 271-293.
Palmer, E. (1983). Conflict Resolution Maneuvers During Near Miss Encounters with CockpitTraffic Displays. In Proceedings of the Human Factors Societ3'-2 7th Annual Meeting(pp. 757-761). Santa Monica, CA: Human Factors Society.
Palmer, E., Jago, S. J., Baty, D. L., & O'Connor, S. L. (1980). Perception of HorizontalAircraft Separation on a Cockpit Display of Traffic Information. Human Factors Journal,22(5), 605-620.
RTCA, Inc. (1994). Report of the RTCA Board of Directors' Select Committee on Free Flight.
RTCA, Inc. (1995). RTCA Task Force 3 hlterim Report on Free Flight bnplementation.
Scallen, S. F., Smith, K., & Hancock, P. A. (1996). Pilot Actions During Traffic Situations in aFree Flight Airspace Structure. In Proceedings of the Human Factors and ErgonomicsSociety 40th Annual Meeting. (pp. 111-115). Santa Monica, CA: Human FactorsSociety.
Sorensen, J. A., Hollister, W., Burgess, M., & Davis, D. (1991). Traffic Alert and CollisionAvoidance System (TCAS)- Cockpit Display of Traffic Information (CDTI) InvestigationPhase t- Feasibility Study. Washington, DC: Research and Development Service.
Stokes, A. F. & Wickens, C. D. (1988). Aviation Displays. In E. L. Wiener & D. C. Nagel(Eds.), Human Factors in Aviation. (pp. 393-396). San Diego, CA: Academic Press.
Vakil, S. S., Midkiff, A. H., & Hansman, R. J. (1995). Development and Evaluation of anElectronic Vertical Situation Display. NASA Grant NAG 1-1581.
Yang, L. C., & Hansman, R. J. (1995). Application of the Analytic Hierarchy Process forMakin_ Subiecth e Comparisons Between Multiple Automation/Display Options.In 6th _FAC/IFIP/IFORS/IEA Symposium on Analysis, Design, and Evaluation of Man-Machine Systems (pp 555-559). Cambridge, MA.
Zeitlin, A. D., Love, W. D., & Cieplak, J. J. (1995). Enhancements to the Next GenerationCollision Avoidance System: Opportunities for Greater Safety and Efficiency. InProceedings of the 14th Digital Avionics Systems Conference (pp. 146-151). New York,NY: The Institute of Electrical and Electronics Engineers, Inc.
92

Appendix A Experiment 1 Pilot Briefing
AT TABLE
Future datalink systems will likely be able to pass current state and intent information
between planes.
Experiment being conducted to test 4 different prototype traffic displays, based onthe TCAS system.
Displays emphasize different elements of intent information.
Experimental scenarios take place in a free flight-like environment, near a terminalare a.
No rules or procedures have yet been established for free flight.
Since free flight is assumed, no rules concerning odd/even altitudes for east/west travel, noset procedures (SID' s, STAR's) for entering or leaving the terminal area.
During experiment, pilots are responsible for maintaining their own traffic separation -no ATC.
Pilots are free to maneuver at any time, but must maintain minimum separation of 2
nm. laterally or 500 ft. vertically from all other traffic. J ,,
All intruder aircraft fly in LNAV/VNAV mode, but the amount of information shown about
their trajectories is varied.
In each scenario, pilot will be cleared direct to a VOR (the only navigation fixshown on the EHSI).
Unless necessary to avoid a traffic conflict, pilot should fly direct to the VOR, levelat the initial altitude of 18000 ft..
As soon as a conflict is resolved, pilot should turn direct to the VOR and returnto 18000 ft.
Pilot may maneuver the aircraft in any way necessary to avoid other traffic except for
increasing the aircraft's speed.
Goals of each scenario are:
1. Maintain the minimum traffic separation (most important).2. Arrive at the VOR as quickly as possible, without increasing speed.3. Turn direct to the VOR and return to 18000 ft. as soon as a conflict is
resolved.
In addition to maneuvering to avoid the conflict, the pilot should indicate when a
potential conflict is identified. This is done by pushing the left button on thesidestick. The button should be pushed when the pilot perceives a threat which
he/she thinks will require an avoidance maneuver.
93

Pilot shouldtell experimenterwhichairplanehasbeenidentifiedasapotentialconflict andwhichairplanehe/sheis maneuveringto avoid.
Pilotwill fly 5differenttraffic scenariosfor eachdisplay.
Practicetimewill beallottedfor eachdisplayprior to runningscenariosfor thatdisplay. Practiceshouldcontinueuntil thesubjectiscomfortablewith thedisplaysandsimulator.
Generalinformationaboutdisplays.- ShowTCAS Display.- Traffic informationissuperimposedonEHSI andusesTCASsymbology.- AircraftID printednextto airplanesymbol(canbeusedfor identificationpurposeswhenpushingsidestickbuttons).
- TCAS TA's andRA's givenfor all displays.- No wind in anyscenarios,sotrack= heading.
Will havesummarysheetavailablenextto simulator.
AT ShMULATOR
Simulator:- PrimaryFlightDisplay.- TCASTraffic Display.- Keyboardbuttons(start,stop,zoomirdzoomout).- Sidestickwith 4 buttons(only 3used):
- Left button:conflict identified.- Rightbutton:disengageautopilot.- Triggerbutton:engageautopilot.
- B-737 MCP.- CDU (notused).- Dynamics-similar to B-737.
Pilotmayfly theaircraftmanuallyor with autopilot(altitude,heading,speed,verticalspeed- noLNAV or VNAV), whicheveris preferred.
Showandreviewtasksummarysheet.
PRACTICESCENARIOS
Practicescenarioscancontinueuntil pilot comfortablewith displays,simulator.
Practicescenariowith TCAS.
Practicescenariowith first display.
Emphasizepracticewith:- Conflictidentification.- ManualandMCPcontrol.- InformatiOntoggles.
94

Appendix B Experiment 1 Pilot Questionnaire
Background
Age
Total Flight Hours
Military Flight Experience (Y/N) __
Hours in Glass Cockpit Airplanes
Hours in Airplanes
Hours in TCAS Equipped Airplanes
Aircraft Certificates and Ratings
Aircraft Flown and Position (Captain, 1st, or 2nd Officer)
TCAS Questions
What is your opinion of TCAS?
Do you ever use the TCAS traffic display for purposes other than collision avoidance?
How many RA's have you had? ._
Have you ever had a problem with TCAS? If so, did the problem create a hazardous situation?
95

1. Which is the better display?
TCAS Display
absolutely muchbetter )etter
Itlt I11tbetter slightly same shghfly better
better :_e]ter
Rate Display
TCAS Display
•,o [ Iabsolutely much
better _etter
t I 1better slightly same sliqhtly better
better ._etter
Commanded StateDisplay
much absolutely +15better better t
TCAS Display
.,oilab_eol_ete_y much
:)etter
J IIRIbetter slightly same sEightly better
better _etter
FMS-Path Display
+20
_ne__: r a b_'t_te'y
Commanded State
Rate Display Display
ab_oI{Jtre_ _eqtht;i same sl,eC{het_ better _:_e_tcehr abSb°et_teer'Y .,s i
FMS-Path Display
Rate Display ,20
a_o,_
Commanded State
Display
+IS better setter bettersame slightly better
_etter
FMS-Path Display
o-20
96

2. Please rate each information element for its value in resolving traffic conflicts. Consider the displayswhere the information was available.
Ai rc raft ID
Very Somewhat Neutral Somewhat VeryDetrimental Detnmental Valuable Valuable
ConflictBands q
Very Somewhat Neulral Somewhat VeDetnmental Detnmental Valuable ValuarYble
CurrentHeading ]
Very Somewhat Neutral Somewhat VeryDetrimental Detrimental Valuable Valuable
AltitudeRate
Very Somewhat Neutral Somewhat VeryDetnmental Detnmental Valuable VaFuable
CommandedHeading
very :5omewhat Neutral Somewhat VeryDetrimental Detrimental Valuable Valuable
CommandedAltitude
Very Somewhat Neutral Somewhat VeryDetrimental Detrimental Valuable Valuable
FMSFlight Plan
MeVery Somewhat Neutral Somewhat Valua%leDetnmental Detrimental Valuable
97

3. The profile view display made me more aware of the traffic situation in the vertical plane.
• P tStrongly !JIsagree Neutral Agree _trongiyDisagree Agree
4. I could get vertical information as easily from the EHSI as I could from theprofile view display.
5tr0ngTy U_sagree Neutral Agree _5tr0nglyDisagree Agree
5. Please check an)' displays that were too cluttered.
TCAS Display Rate Display
+20 +20
o ¥FMS-Path Display-
Commanded State .zo
DisplaY+2o.,si' _ .,o
6. What was your strategy for avoiding traffic conflicts? Did it change with the display?
7. When did you decide to turn on an intruder's information?
8. What information should be added to the displays?
9. What information was unnecessary?
10. Do you have any additional comments or suggestions? (Please use back if necessary.)
98

Appendix C Experiment 1 Scenario Specific Results
Scenario 1Intruder Overtake
Separation Violations
100
9O
80
¢_ 70
= 60c-O
5O
4o{:• 30u
a. 2o
lO
TCAS
=it-
1!
Rate
.w.=
t
iCommanded State
Display Type
I
; i̧ !
t
]FMS-Path
-10
-2O
-3O
-40
=_ -50
-60
-7O
-8O
-9O
Maneuver Time Before Separation Violation
Rate
Display Type
TCAS
r
I
lr. .k
T
Commanded State FMS-Path
!
L_T_
i
|I
.Ll
...L .....
Conflict Band Appears
99

Scenario 2
Intruder Trajectory Change
Separation Violations
.u
t-O
o
a.
100
90
80
70
60
50
40
30
20
10
0
TCAS Rate Commanded State
Display Type
FMS-Path
oF-20
-40
-60
-80
"-" -100
EiT. -120
-140
-160
-180
-2O0
Maneuver Time before Separation Violation
TCAS
URate
Display Type
Commanded State
: ii _: _Z_
T
I
FMS-Path
:Zi ....
I
Conflict Band Appears
lO0

Scenario 3
Ownship Overtake
Separation Violations
1 O0
.2"E0
ooG)ol
oD.
90
8O
70
60
50
40 I30
20
10
0
TCAS
Display
I IIRate Display
Display Type
Commanded
State
Display
iIi
FMS-Path
Display
Maneuver Time before Separation Violation
-40
-8O
.-- - 120
@t
E -16oiT.
-200
-240
-28O
Display Type
TCAS
URate Commanded State FMS-Path
i '-!i̧ ¸_'__i!_ ¸__, _.,/ _,i__
• i
I
Conflict Band Appears
101

Scenario 5Dual Conflict
Separation Violations
¢-0
01
(.)
ft.
100
8O
60
40
20
]-
TCAS Rate Commanded State
Display Type
i JFMS-Path
Maneuver Time Before Separation Violation
-4O
-60
¢_ -80._I,.-
-100
-120
-140
-160
TCAS
0
-20 [
Display Type
Rate Commanded State
.-r I.. 1.a..
FMS-Path
T,J.
Conflict Band Appears
102

Appendix D Experiment 2 Pilot Briefing
AT TABLE
Future datalink systems will be able to pass current state and intent information
between planes.
Experiment being conducted to test several prototype traffic displays, based onthe TCAS system.
Displays represent varying amounts of information available about intruder aircraftin addition to different ways of presenting the information.
Experimental scenarios take place in a free flight-like environment, near a terminalarea.
No rules or procedures have yet been established for free flight.
Since free flight is assumed, no rules concerning odd/even altitudes for east/west travel, no
set procedures (SID's, STAR's) for entering or leaving the terminal area.
During experiment, pilots are responsible for maintaining their own traffic separation - noATC.
Pilots are free to maneuver at any time, but must maintain minimum separation of 2 nm.
laterally or 500 ft. vertically from all other traffic.
In each scenario, pilot will be cleared direct to a VOR (the only navigation fixshown on the EHSI).
Unless necessary to avoid a traffic conflict, pilot should fly direct to the VOR, levelat the initial altitude of 18000 ft..
As soon as a conflict is resolved, pilot should turn direct to the VOR and returnto 18000 ft.
Pilot may maneuver the aircraft in any way necessary to avoid other traffic except forincreasing the aircraft's speed.
Goals of each scenario are:1. Maintain the minimum traffic separation (most important).2. Arrive at the VOR as quickly as possible, without increasing speed.3. Turn direct to the VOR and return to 18000 ft. as soon as a conflict is
resolved.
In addition to maneuvering to avoid the conflict, the pilot should indicate when apotential conflict is identified. This is done by pushing the left button on thesidestick. The button should be pushed when the pilot perceives a threat which
he/she thinks may require an avoidance maneuver.
Pilot should tell experimenter which airplane has been identified as a potential conflict and
which airplane he/she is maneuvering to avoid.
103

Generalinformationaboutdisplays.- ShowTCAS Display.- Traffic informationis superimposedonEHSI andusesTCAS symbology.- Aircraft ID printednextto airplanesymbol(canbeusedfor identificationpurposeswhenpushingsidestickbuttons).
- TCAS TA's andRA's givenfor all displays.- Nowind in anyscenarios,sotrack= heading.
Will havesummarysheetavailablenextto simulator.
AT SIMULATOR
Simulator:- PrimaryFlightDisplay.- TCAS TrafficDisplay.- Keyboardbuttons(start,stop,zoomin/zoomout).- Sidestickwith 4 buttons(only 3used):
- Left button:conflict identified.- Rightbutton:disengageautopilot.- Triggerbutton:engageautopilot.
- B-737 MCP.- CDU (not used).- Dynamics-similarto B-737.
Subjectmayfly theaircraftmanuallyor with autopilot(altitude,heading,speed,verticalspeed- noLNAV or VNAV), whicheveris preferred.
Showandreviewtasksummarysheet.
PRACTICESCENARIOS
Practicescenarioscancontinueuntil pilot comfortablewith displays,simulator.
PracticescenariowithTCAS.
Practicescenariowith first display.
Emphasizepracticewith:- Conflictidentification.- ManualandMCPcontrol.
104

Appendix E Experiment 2 Pilot Questionnaire
Background
Age __
Total Flight Hours
Military Flight Experience (Y/N) __
Hours in Glass Cockpit Airplanes
Hours in Airplanes
Hours in TCAS Equipped Airplanes
Aircraft Certificates and Ratings
Aircraft Flown and Position (Captain, 1st, or 2nd Officer)
TCAS Questions
What is your opinion of TCAS?
Do you ever use the TCAS traffic display for purposes other than collision avoidance?
How many RA's have you had?
Have you ever had a problem with TCAS? If so, did the problem create a hazardous situation?
105

1. Which is the better display?
Basic TCAS
._0[- ]--1absolutely much betterbetter better
.tt H t Islightiy same Shghtly better much absoFutely
_etter better better better
Basic TCASwith Conflict Bands
+20
Basic TCAS
_-20 1
_IP absolutely
I.... It I1 tt111much be.el siightly same slighlly better much absolutely
:,e.er better better betterbetter better
Enhanced TCAS
Basic TCAS
._0 J i 1I_ absotutely much better
better better
1 Hi IILIslightly same _,lightly better much absolutely
3etter better better better
Enhanced TCASwith Conflict Bands
g.
Basic TCAS
with Conflict Bands
• •
• l t t Illslightly same shghtly better much absolutely
3etter better better better
Enhanced TCAS
Basic TCASwith Conflict Bands
+20
0I--absolutely
better
Z I I I t t jt Jl 1much better slightly same shghtly better much absolutelybetter ::.etter better better better
Enhanced TCAS
with Conflict Bands
Enhanced TCAS
absolutely
better
Enhanced TCAS
with Conflict Bands
106

2. Please rate each information element for its value in resolving traffic conflicts. Consider the displayswhere the information was available.
Aircraft ID
Very Somewhat Neutral SomewhatDetrimental Detrimental Valuable
tVery
Valuable
ConflictBands
Very Somewhat Neutral SomewhatDetrimental Detrimental Valuable
VeryValuable
CurrentHeading
Very Somewhat Neutral SomewhatDeldmental Detnmenlal Valuable
VeryValuable
CommandedHeading
Very Somewhat NeutralDetrimental Detnmeetal
ISomewhat Very
Valuable Valuable
CommandedAltitude
Very Somewhat NeutralDelrimental Detrimental
Somewhat VeryValuable Valuable
107

3. Please check any displays that were too cluttered.
Basic TCAS
+20
0
Basic TCASwith Conflict Bands
+20
0
.
Enhanced TCAS
Enhanced TCAS with Conflict Bands
Did your strategy for avoiding conflicts change with the addition of the heading arrows? With theaddition of the conflict bands? If so, how?
5. What is the maximum range or time that a conflict band should appear?
6. What is the maximum number of conflicts it is useful to show or should all conflicts be shown
within the range indicated above?
7. Do you have any additional comments or suggestions?
108

Appendix F Experiment 2 Scenario Specific Results
Scenario 1Short Range Conflict
u
CO
o
"6O
t-
O
a.
100
80
60
40
20
0
Separation Violations
TCAS Commanded State
Display Type
[] No Conflict Band
• 2 Minute Conflict Band
[] Long Range Conflict Band
0
-10
-20
-30I0
E -4oI,-
-50
-60
-70
Maneuver Time Before Separation Violation
Display Type
TCAS Commanded State
Conflict Band Appears
t ......i
1] NO Confiict Band
• 2 Minute Conflict Band
[] Long Range Conflict Band
109

Scenario 2Intruder Maneuvers During Conflict
Separation Violations
O
"603
t_
a)
a.
100
8O
60
40
2O
I
i
T
TCAS Commanded State
1[] No Conflict Band
• 2 Minute Conflict Band
[] Long Range Conflict Band
Display Type
0
-25
-5O
-75
";" .lOOE,w
I- -125
-150
-175
-200
Maneuver Time Before Separation Violation
Display Type
TCAS Commanded State
_.....-- Conflict Band Appears
¢3No Conflict Band =
• 2 Minute Conflict Band
O Long Range Conflict Band
II0

Scenario 3
Long Range Conflict
Separation Violations
100
8O
.9
"E 60O
(J
o¢_ 40o_
C
_ 20
TCAS Commanded State
[] No Conflict Band
• 2 Minute Conflict Band
[] Long Range Conflict Band
Display Type
Maneuver Time Before Separation Violation
Display Type
0
-50
-100
-150
_- -200
4)
E -250
-300
-350
-400
-450
TCAS Commanded State
Conflict Band Appears
[] No Conflict Band
• 2 Minute Conflict Band
[] Long Range Conflict Ba_cl
lll

Scenario 4Intruder Overtake
Separation Violations
o)
Oo"6
0.
100
80
60
40
20
TCAS Commanded State
[] No Conflict Band
• 2 Minute Conflict Band
[] Long Range Conflict Band
Display Type
Maneuver Time Before Separation Violation
Display Type
0
-10
-20
-30
--- -40
E -50
-60
-70
-80
-90
TCAS Commanded State
-- Conflict Band Appears
[] No Conflict Band
==2 Minute Conflict Band
1:3Long Range Conflict Band
112

113

IP