asian economic integration - icriericrier.org/pdf/working_paper_186.pdf · 1 asian economic...
TRANSCRIPT

INDIAN COUNCIL FOR RESEARCH ON INTERNATIONAL ECONOMIC RELATIONS
Working Paper No. 186
Asian Economic Integration ASEAN+3+1 or ASEAN+1s?
Amita Batra
September 2006
Contents
Foreword................................................................................................................................... i
Abstract.................................................................................................................................... ii
1 Introduction..................................................................................................................1
2 Sample period and data...............................................................................................3
3 Previous empirical literature ......................................................................................3
4 The case for ASEAN+4 as a potential trade bloc......................................................4
4.1 The potential strength of ASEAN+4.....................................................................4 4.2 Trends in intra-regional trade..............................................................................5
5 The case for India in ASEAN+4 .................................................................................8
5.1 Rate of growth of total trade with ASEAN+4.......................................................8 5.2 Trade with ASEAN+4 vis-à-vis other regional blocs...........................................9 5.3 Trade with ASEAN+4 vis-à-vis Rest of the World ...............................................9 5.4 India as a market for the ASEAN+4...................................................................11
6 India vis-à-vis the plus three economies...................................................................12
7 The most efficient route to ASEAN+4: ASEAN+3+1 or the ASEAN+1s?............15
7.1 Regional orientation and comparative advantage .............................................15 7.2 Efficiency costs vis-à-vis multilateral liberalization..........................................17 7.2.1 Alignment of comparative advantage..........................................................17 7.2.2 Alignment of comparative advantage and shifts in factor intensity............19
8 If ASEAN+1: is there a first mover advantage? .....................................................21
8.1 Export Overlap...................................................................................................22 8.2 Overlap of comparative advantage ....................................................................24 8.2.1 Overlap of existing comparative advantage ...............................................24 8.2.2 Potential for overlap of comparative advantage ........................................25
9 Conclusions.................................................................................................................26
References...............................................................................................................................28

List of Tables
Table 4.1: ASEAN+4 Region: Summary Indicators.............................................................5
Table 4.2: Intra-Bloc Trade (%).............................................................................................5
Table 4.3: Intra Bloc Exports (%)..........................................................................................6
Table 4.4: Intra Bloc Imports (%)..........................................................................................6
Table 4.5: Intra-regional Trade Intensity Index ...................................................................7
Table 4.6: Share of the +4 Economies in Intra ASEAN+4 Exports and Imports (%) ......8
Table 5.1: Rate of Growth of Total Trade with ASEAN+4 (%)..........................................9
Table 5.2: Shares of Select Trade Blocs in India’s Total Trade (%) ..................................9
Table 5.3: India’s Top Ten Trading Partners .....................................................................10
Table 5.4: India as a Market for ASEAN+4: A Comparison with the +3 Economies .....11
Table 5.5: ROG of Exports and Imports of the Plus Four Economies: 1995-2003..........11
Table 6.1: Share of ASEAN+4 in Total Trade of the Plus Four Economies: 2003 ..........12
Table 6.2: Trade Intensity Indices with ASEAN and ASEAN+4 ......................................13
Table 6.3: Index of Trade Bias..............................................................................................13
Table 7.1: Efficiency Costs: Regional Orientation and Comparative Advantage ...........16
Table 7.2: Alignment of Comparative Advantage vis-à-vis Multilateral Liberalization 18
Table 7.3: Alignment of Comparative Advantage and Shifts in Factor Intensity ...........19
Table 7.4: Shifts in Factor Intensity: % Count of Products: ASEAN ..............................20
Table 7.5: Shifts in Factor Intensity: % Count of Products: ASEAN+4 ..........................20
Table 8.1: Export Similarity of the +4 Economies in ASEAN: 2003. (HS 2 digit) ..........22
Table 8.2: Export Similarity of the +4 Economies in ASEAN: 2003. (HS 6 digit) ..........23
Table 8.3: Finger-Kreinin Index: ASEAN (HS 2 digit) ......................................................23
Table 8.4: Finger-Kreinin Index: ASEAN (HS 6 digit) ......................................................23
Table 8.5: Commodities with Potential for Overlap of Comparative Advantage between
India and China in the Unskilled labor Intensive Category ..................................26

List of Figure
Figure 5.1: Share of ASEAN+4 vs. ROW in India’s Total Trade .....................................10
Appendix
Table A.1: India: Sector -wise Trade Intensity Index with ASEAN+4............................30
Table A.2: India: Sector-wise Complimentarity Index with ASEAN+4 ...........................30
Table A.3: India: Sector-wise Bias Index with ASEAN+4 .................................................30
Table A.4: Efficiency Costs: Alternative Calculations .......................................................30
Table A.5: Overlap of Existing Comparative Advantage: India and China ....................31
i
Foreword
This working paper is an outcome of the project on “Preferential Trading Agreements
in Asia: towards an Asian Economic Community” being undertaken by ICRIER. The
project is funded by the IDRC, Ottawa. On the basis of an empirical analysis, the
paper establishes the economic rationale for a regional trading bloc in Asia that
consists of ASEAN and four large Asian economies viz China, India, Japan and
Korea, the so called ASEAN+4 arrangement. The findings of the empirical analysis
suggest that India’s prior alignment with the ASEAN in the ASEAN+1 framework
may be a more efficient or the least cost path to entering the ASEAN+4 bloc. This
holds true for all the four major economies in forging their ties with ASEAN. The
paper also highlights the possible adverse impact of the China-ASEAN free trade
agreement (FTA) on India and identifies the sectors that are likely to be most affected
by the implementation of the Early Harvest Programme of this FTA.
The findings of the paper assume importance in the context of India’s ongoing efforts
at regional integration and its vision of a Pan Asian FTA. I am confident that this
paper will provide an important contribution in shaping India’s policy stance on
bilateral and regional trading arrangements.
Rajiv Kumar Director and Chief Executive
ICRIER
September 8, 2006

ii
Abstract
In this paper an attempt is made to evaluate the most efficient approach to regional
economic integration in Asia. For the purpose, Asia is defined as inclusive of
ASEAN, the plus three economies of China, Japan, Korea and India that is the
ASEAN plus four. Given that ASEAN is an existing regional bloc in Asia, alternative
approaches to the alignment of the plus four economies with ASEAN for the
formation of the ASEAN+4 trade bloc have been evaluated to determine if there are
efficiency costs by way of distortion in the patterns of trade away from those expected
on the basis of comparative advantage. The findings of our analysis underscore the
efficiency of a prior alignment with ASEAN for all the plus four economies.
Key words: regional economic integration, Asia, efficiency cost, comparative
advantage, first mover advantage, trade diversion.
JEL Classification: F13, F14, F15
1
Asian Economic Integration∗ ASEAN+3+1 or ASEAN+1s?
1 Introduction
The concept of an Asian economic community was first proposed at the Bali ASEAN
summit in 2003. The concept has been taken forward in the East Asia Summit held in
December 2005. At this summit ASEAN+3, India and Australia and New Zealand
came together to deliberate on the evolution of an Asian Economic Community on the
lines of the European Union (EU). These developments notwithstanding several
initiatives are already under way towards achieving the objective of regional
economic integration in Asia. Among these are agreements between the ASEAN
regional grouping and Japan (AJCEP), China (ACCEC), Korea1 (AKCCP) and India
(AICEC). The framework agreement has been signed for all these initiatives. A
further initiative at forming a preferential trading arrangement in the region
comprising ASEAN +3 is under discussion and is seen by many as the building bloc
of a future East Asian Community (EAC). The EAC can then become the harbinger of
the Asian Economic Community.
Regional economic integration or preferential trading arrangements (PTAs) among
economies in any region have however raised several concerns. A primary concern is
if the PTA implies an efficiency cost and as a consequence undermines trade
liberalization through the multilateral process. Given that a PTA accords preferential
treatment to members vis a vis non- members there is always a possibility of trade
being diverted away from non-members to members. On occasion when non-
members are more efficient producers this process of trade diversion will imply a cost
in terms of denying both the producers and the consumers access to lower cost and
more efficiently produced goods. A preferential trading arrangement therefore needs
∗ This works was carried out with the aid of a grant from the International Development Research
Centre, Ottawa, Canada. The paper was presented at the Lee Kuan Yew School of Public Policy and Institute of Southeast Asian Studies, Singapore in August 2006. An earlier version of the paper was presented at the international workshop on “Preferential Trading Agreements in Asia: towards an Asian Economic Community” held in New Delhi in March 2006.
Research assistance by Raju Huidrom is thankfully acknowledged. 1 In this paper Korea represents Republic of Korea.
2
to be evaluated to determine if there are efficiency costs by way of distortion in the
patterns of trade away from those expected on the basis of comparative advantage.
Having regard to this background of regional economic integration in Asia and the
concerns raised on efficiency costs there is a need to undertake an analysis of the
proposed new regional arrangement in Asia. Understanding the efficiency
implications of the preferential trading arrangement will help policymakers in the
participating countries to better prepare for and cope with economic integration in the
region and evaluate the worth of the formation of future PTAs vis a vis multilateral
liberalization. It is in this context that we set out the research agenda for this paper.
As such an attempt is made to evaluate the most efficient approach to regional
economic integration in Asia. For the purpose, we define Asia as inclusive of
ASEAN, the plus three economies of China, Japan, Korea and India i.e. the
ASEAN+42. Given that ASEAN is an existing regional bloc in Asia, alternative
approaches to the alignment of the plus four economies with ASEAN for the
formation of the ASEAN+4 trade bloc have been examined in terms of their
efficiency costs. As a first step to our analysis, however, we establish the economic
credentials of ASEAN+4 as a potential candidate for regional economic integration in
Asia.
The paper proceeds as follows. A brief description of the sample period and data and
review of previous empirical literature are given in Sections 2 and 3 respectively. In
Section 4 a detailed analysis of the trends in intra-regional trade of the ASEAN+4
economies is undertaken to determine if there is a significant trade bias evident
among the member countries. The index of trade intensity and the more sophisticated
measures like trade bias and complementarity indices have been used to establish the
case for ASEAN+4 as a regional trade bloc. The westward extension of ASEAN+3 to
include India as an integral member of the ASEAN+4 is explained in Section 5.
Alternative routes to Asian economic integration in terms of their economic efficiency
are examined in Section 6. Efficiency is interpreted in terms of least cost of 2 The ASEAN-Australia &New Zealand Comprehensive Economic Partnership Agreement i.e. AFTA-
CER CEP has trade facilitation rather than trade liberalization as its agenda. Our analysis is therefore restricted to 14 of the 16 countries that were represented in the East Asia Summit in December 2005.

3
adjustment of a country’s production structure for participation in the preferential
trading arrangement by itself as also against multilateral liberalization. The regional
orientation index has been used jointly with the index of comparative advantage to
analyze existing and potential inefficiencies in trade patterns. Costs that may have to
be incurred by any of the plus four countries on account of trade diversion following a
pre-emptive entry in ASEAN by any one country are estimated in Section 7. Section 8
concludes with a presentation of the main findings of our analysis and their
implications for shaping economic regionalism in Asia.
2 Sample period and data
The drive towards regionalism in Asia gained momentum only after the 1997-98 East
Asian crisis. The reference period for the analysis in this paper is therefore 1999-
2003. For the purpose of comparison, where required, the analysis has also been
undertaken for the period 1995-99. UNCOMTRADE based trade (export and import)
data classified according to the Harmonized System (HS) at the 2 and 6-digit levels
have been used for analysis.
3 Previous empirical literature
Several studies have examined the idea of regional economic integration in Asia.
Most of these studies have focused on separate regions of ASEAN like North East
Asia (the plus three economies of China, Japan and Korea) and the ASEAN+3.
Mingqui (2003) has analyzed the ASEAN+3 region for economic integration. In his
study Mingqui provides evidence of increased interdependence among the 13
economies in the area of trade, capital flows and human resource mobility in support
of economic integration in the region. ADB (2005) presents data indicative of the
extent of trade and investment integration in Asia by sub-regions like East Asia and
South Asia. In the study East Asia is defined as the ASEAN 10 and the PRC, Japan,
Hong Kong, China and Taipei, China. The extent of regional integration has been
indicated on the basis of the intra-regional trade and investment shares and intensity
measures. A large number of studies, however, deal with the impact of trade bloc
formation in terms of welfare and economic gains by undertaking ex post analysis
using the gravity model e.g. Lee, Park and Shin (2004) and/ or an ex ante analysis

4
using CGE techniques3. The most comprehensive study by Scollay and Gilbert (2001)
highlights the small benefits associated with bilateral arrangements and points out the
damage that some of them could inflict upon member and non-member nations.
A systematic comparison or assessment of the many arrangements that have been
proposed for economic integration in Asia has, however, not been undertaken so far.
Studies on the efficiency of alternative regional arrangements or on the strategy of
optimal sequencing of regional economic integration in Asia are missing.
Furthermore, India does not find a mention in the limited number of impact studies
undertaken for Asian FTAs. Even where options for economic integration of ASEAN-
East Asia that are inclusive of India are considered the focus remains on simplistic
statements on India’s complementarities with East Asia in the services sector and the
emerging trends of India’s competitive advantage as an outsourcing hub in the
region4. The focus of this study is at variance with issues discussed in the available
literature as it aims at identifying the most efficient approach to the formation of a
regional economic/trade arrangement in Asia that is inclusive of India. This is the first
ever efficiency - based analysis of sequencing regional economic integration in Asia.
4 The case for ASEAN+4 as a potential trade bloc
4.1 The potential strength of ASEAN+4
The ASEAN+4 region comprising two of the most dynamic economies in the world
that is India and China is referred to as the ‘Arc of Advantage’. As may be noticed
from the available facts presented in Table 4.1, the gross national income of the
countries comprising this regional bloc is over US $ 7.6 trillion in 2003 and is
comparable to the US $ 9.4 trillion gross national income of the EU. In terms of
purchasing power parity, the national income of ASEAN+4 is US $ 16 trillion and is
more than the national income of NAFTA which is US $ 13 trillion or of the EU
which is US $ 11 trillion. The combined total reserves of this region are about US$ 2
3 For example Scollay and Gilbert (2001) and Yamazawa (2001) have estimated the potential effect of
FTAs in North East Asia on welfare, trade and productivity. 4 The strengthening of India’s linkages with ASEAN (5-in particular) finds a mention in Rajan and Sen
in ADB (2005). The context however continues to be the ‘increasing complementarities in the services sector’.
5
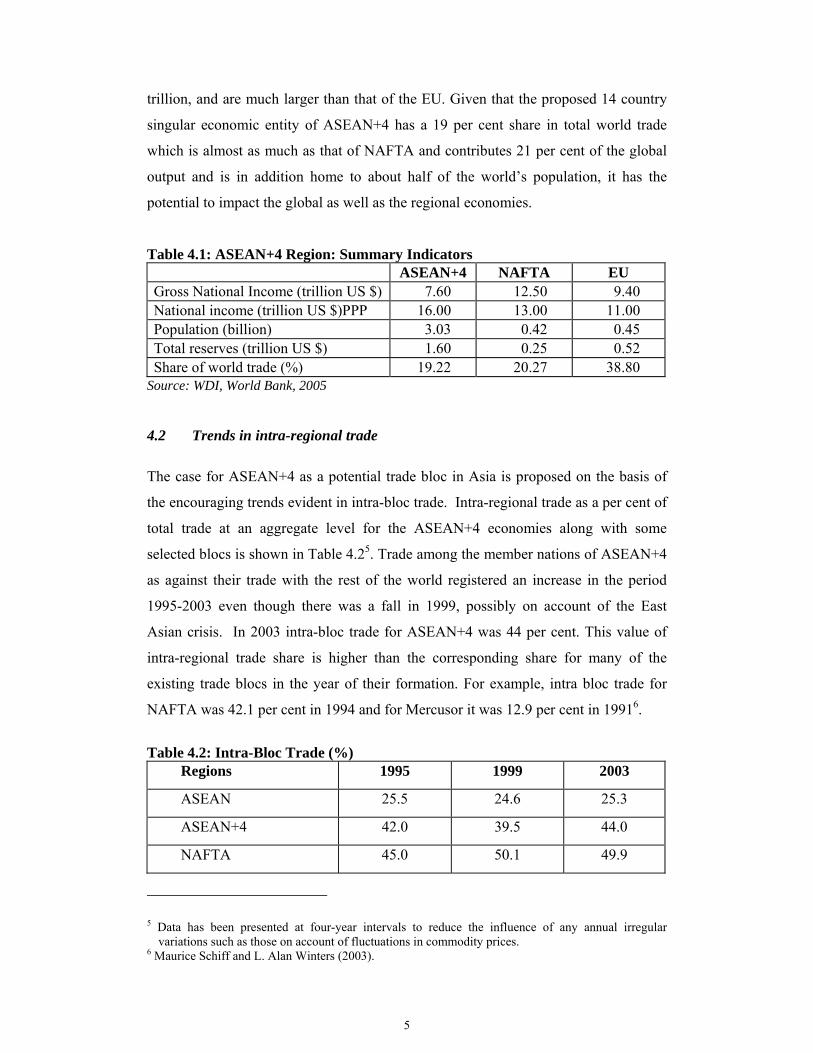
trillion, and are much larger than that of the EU. Given that the proposed 14 country
singular economic entity of ASEAN+4 has a 19 per cent share in total world trade
which is almost as much as that of NAFTA and contributes 21 per cent of the global
output and is in addition home to about half of the world’s population, it has the
potential to impact the global as well as the regional economies.
Table 4.1: ASEAN+4 Region: Summary Indicators ASEAN+4 NAFTA EU
Gross National Income (trillion US $) 7.60 12.50 9.40 National income (trillion US $)PPP 16.00 13.00 11.00 Population (billion) 3.03 0.42 0.45 Total reserves (trillion US $) 1.60 0.25 0.52 Share of world trade (%) 19.22 20.27 38.80
Source: WDI, World Bank, 2005
4.2 Trends in intra-regional trade
The case for ASEAN+4 as a potential trade bloc in Asia is proposed on the basis of
the encouraging trends evident in intra-bloc trade. Intra-regional trade as a per cent of
total trade at an aggregate level for the ASEAN+4 economies along with some
selected blocs is shown in Table 4.25. Trade among the member nations of ASEAN+4
as against their trade with the rest of the world registered an increase in the period
1995-2003 even though there was a fall in 1999, possibly on account of the East
Asian crisis. In 2003 intra-bloc trade for ASEAN+4 was 44 per cent. This value of
intra-regional trade share is higher than the corresponding share for many of the
existing trade blocs in the year of their formation. For example, intra bloc trade for
NAFTA was 42.1 per cent in 1994 and for Mercusor it was 12.9 per cent in 19916.
Table 4.2: Intra-Bloc Trade (%)
Regions 1995 1999 2003
ASEAN 25.5 24.6 25.3
ASEAN+4 42.0 39.5 44.0
NAFTA 45.0 50.1 49.9
5 Data has been presented at four-year intervals to reduce the influence of any annual irregular
variations such as those on account of fluctuations in commodity prices. 6 Maurice Schiff and L. Alan Winters (2003).

6
It is also evident from Table 4.2 that the potential of ASEAN+4 as a candidate for
regional economic integration is higher than that of the existing regional bloc in Asia
that is ASEAN. Intra-ASEAN trade is less than that for ASEAN+4. This fact is
further corroborated when the trends for intra-bloc exports and imports shown in
Tables 4.3 and 4.4 are analyzed. There exists a positive difference between the levels
of intra-bloc exports and imports for the proposed ASEAN+4 grouping as against the
existing ASEAN. In 2003, intra-ASEAN trade– both exports and imports stood at 22
per cent and this is much lower than the 35 per cent and 43 per cent of intra-
ASEAN+4 exports and imports respectively.
Table 4.3: Intra Bloc Exports (%)
Year 1995 1999 2003
ASEAN 25.5 22.5 22.4
ASEAN+4 35.2 31.1 35.0
Table 4.4: Intra Bloc Imports (%) Year 1995 1999 2003
ASEAN 17.5 21.8 22.0
ASEAN+4 38.9 39.8 43.0
Trends in intra-regional trade are therefore suggestive of the strength of the
ASEAN+4 as a potential candidate for a regional bloc in Asia7.This conclusion is
further substantiated when the degree of ‘trade bias’ among member nations of the
proposed bloc is evaluated using the index of trade intensity (TI). As noted by Petri
(1992), increases in intra-regional trade signify an increase in interdependence but do
not give a strong indication of the ‘bias’ towards regionalization, as they may reflect
changes in other variables, especially income growth. The growth in internal trade 7 A series of earlier papers like Wonnacott, Paul and Mark Lutz (1989), Summers, Lawrence (1991),
Krugman (1993) and Frankel et al (1995) argue that RTAs with larger pre–trade volumes and geographically proximate countries are likely to be welfare improving. Member nations of RTAs are referred to as ‘natural trading partners’ based on the criterion of the volume of trade. The volume of trade, may not, even though it is the most popular criterion, necessarily provide an objective measure of the extent to which the trading partners are ‘natural’ given that the volume of trade is itself affected by trade policy.

7
shares may, therefore, reflect income-induced changes in imports, rather than a rise in
‘natural’ tendency to trade. To control this effect the TI index normalizes the bilateral
or intra-regional trade shares according to the importance of the country or region in
total world trade. The index of trade intensity with a value greater than one is
indicative of higher bilateral trade than can be expected on the basis of the countries’
share in world trade. The change in the value of the index over time reveals if any two
countries/groupings are experiencing an increased or decreased tendency to trade with
one another. An increasing value of the index is indicative of enhanced prospects for
further integration while a decreasing value would suggest diminished prospects. The
TI index therefore, provides additional insights into the prospects for regional
economic integration.
Table 4.5 below summarizes the change in the TI index8 at 3 time points9 in our
reference period. For a comparative picture the TI indices at the same time points are
also shown for NAFTA. The TI index for ASEAN+4 clearly documents the increase
in the concentration of trade within the region. The TI index as shown in Table 4.5
exceeds unity for all the three time points in our reference period. This is indicative of
‘intense’ trade relations within the ASEAN+4 regional grouping10. The TI index for
ASEAN+4 is comparable to that for NAFTA, particularly at the time of the latter’s
coming into effect11. Trends in the index of trade intensity further confirm the claim
of ASEAN+4 as a potential candidate for a regional trade bloc in Asia.
Table 4.5: Intra-regional Trade Intensity Index
8 Intra-ASEAN Trade Intensity equals: (Intra ASEAN Exports/Total World Exports)/{(Total ASEAN
Exports/Total World Exports)*(World Exports to ASEAN/Total World Exports)}: Kawai (2004) 9 A limitation that is often cited of the TI index is that it fails to account for the distance between
individual countries. Ng and Yeats (2003) have calculated the distance adjusted TI at a time point. The calculation of the TI over three different time points in our analysis should take care of this as bilateral distance remains constant over the period of time.
10 Relative to ASEAN the TI index for ASEAN+4 that is inclusive of China, Japan, Korea and India is smaller in magnitude as the TI indices control for a region’s relative size in world trade.
11 This corroborates earlier evidence in favor of the ASEAN+4. Intra-regional trade shares for ASEAN+4 in contrast with that of ASEAN are comparable to that for NAFTA at the time of the latter’s formation.
Regions 1995 1999 2003 ASEAN 3.9 4.5 4.4 ASEAN+4 2.1 2.2 2.2 NAFTA 2.4 2.3 2.7

8
While available trends on intra-ASEAN+4 trade establish the strength of the group by
itself and relative to the existing bloc in Asia, that is, ASEAN for regional economic
integration, there is a need to ascertain the relative positioning of India vis-à-vis the
other three economies. The need to contextualize India in the proposed bloc becomes
evident when we look at the share of each of the plus four economies in intra-
ASEAN+4 trade (Table 4.6). It is observed that India makes the lowest contribution to
intra-regional trade (exports and imports) for the proposed trade bloc. In comparison
with Japan that has the maximum share of 28 and 25 per cent in total regional exports
and imports respectively in 2003, India’s share at about 2.0 and 3.0 per cent in exports
and imports respectively is the lowest.
Table 4.6: Share of the +4 Economies in Intra ASEAN+4 Exports and Imports (%) Countries Share in Intra ASEAN+4
Exports Share in Intra ASEAN+4
Imports 1999 2003 1999 2003
China 15.7 20.3 18.7 27.8
India 1.4 2.0 2.9 2.8
Japan 30.1 27.8 30.1 25.4
Korea 14.2 13.5 12.9 12.8
India’s alignment with ASEAN+4 is, however, justifiable on account of the rate at
which its trade with India is growing relative to that with the plus three economies,
increased share vis-à-vis other major trading blocs and partner countries in India’s
total trade and the growing importance of India as a market for exports of ASEAN+4
economies. We present evidence in support of India’s increasing trade linkages with
the proposed bloc.
5 The case for India in ASEAN+4
5.1 Rate of growth of total trade with ASEAN+4
The rate of growth of total trade of the plus four economies with ASEAN+4 is
presented in Table 5.1. It is observed that the rate of growth of India’s total trade with
ASEAN+4 over 1999–2003 is close to that of China and greater than that of Japan

9
and Korea. Among the plus four economies, India, registered the highest annual rate
of growth of total trade with ASEAN+4 over the period 2001-2003.
Table 5.1: Rate of Growth of Total Trade with ASEAN+4 (%) Year India China Japan Korea 1999/2000 - 3.2 33.0 28.3 31.22000/2001 11.4 5.4 - 9.5 - 11.82001/2002 24.8 21.9 5.3 13.22002/2003 37.3 37.4 20.6 23.8Average annual rate of growth 9.5 12.7 3.0 5.3
5.2 Trade with ASEAN+4 vis-à-vis other regional blocs
India’s trade with regional blocs presents an interesting picture (Table 5.2). In 1995,
the EU (15/25) was the most significant trading bloc for India in terms of its share in
total trade. Trade with the EU constituted 28 per cent of India’s total trade. This was
followed by NAFTA at around 15 per cent and ASEAN at 8 per cent. In 2003, the
share of EU in India’s total trade has fallen to 21 per cent and the share of the
proposed ASEAN+4 bloc has increased to about 20 per cent12. With its share in
India’s total trade having increased to equal that of the EU, ASEAN+4 has emerged
as the other dominant partner bloc for India.
Table 5.2: Shares of Select Trade Blocs in India’s Total Trade (%)
Year EU15 EU25 NAFTA Mercosur ASEAN ASEAN+4 SAARC
1995 27.4 28.0 14.9 0.8 7.8 18.1 2.9
1999 23.5 24.0 15.2 1.1 8.5 17.5 2.1
2003 20.2 20.7 12.9 0.9 9.3 19.9 3.4
5.3 Trade with ASEAN+4 vis-à-vis Rest of the World
India’s trade orientation towards the proposed trade bloc is also apparent when we
look at the increasing divergence between the shares of ASEAN+4 and the rest of the
world in India’s total trade. As is evident from Figure 5.1, there is a clear increase in
the share of ASEAN+4 in India’s total trade at the expense of the rest of the world.
12 It may be noted that the share of ASEAN in India’s total trade has remained at about the same level
over 1995-2003.
10
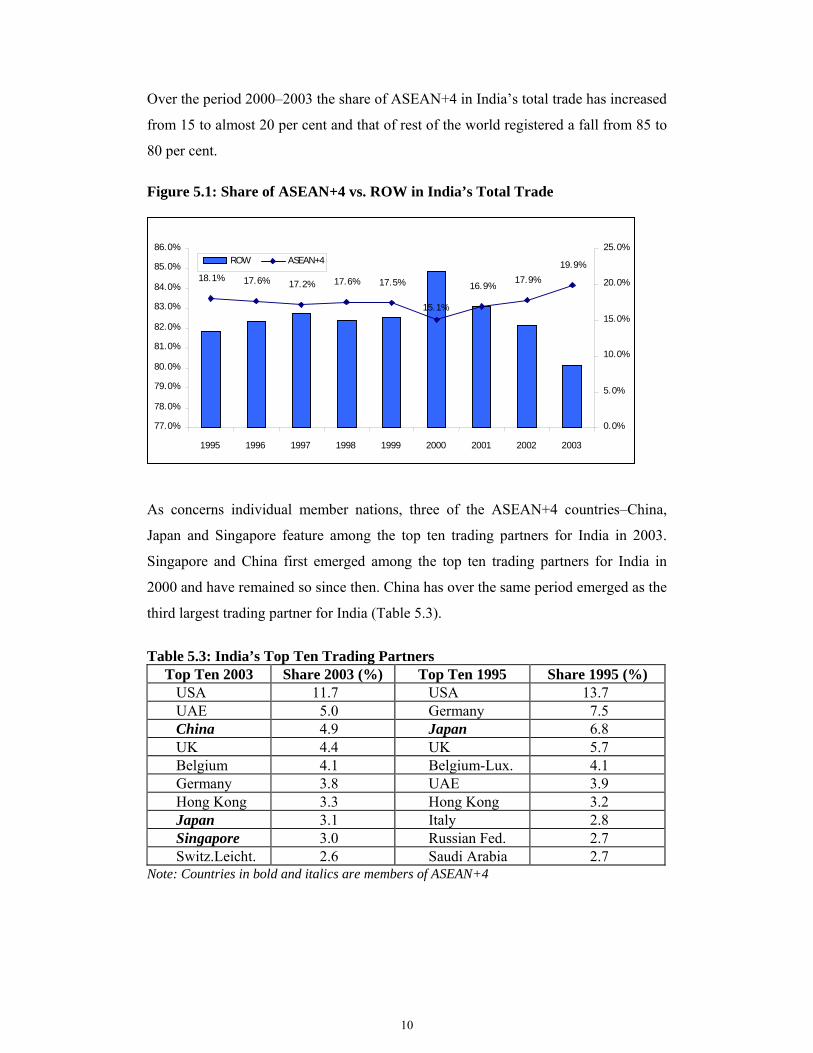
Over the period 2000–2003 the share of ASEAN+4 in India’s total trade has increased
from 15 to almost 20 per cent and that of rest of the world registered a fall from 85 to
80 per cent.
Figure 5.1: Share of ASEAN+4 vs. ROW in India’s Total Trade
As concerns individual member nations, three of the ASEAN+4 countries–China,
Japan and Singapore feature among the top ten trading partners for India in 2003.
Singapore and China first emerged among the top ten trading partners for India in
2000 and have remained so since then. China has over the same period emerged as the
third largest trading partner for India (Table 5.3).
Table 5.3: India’s Top Ten Trading Partners
Top Ten 2003 Share 2003 (%) Top Ten 1995 Share 1995 (%) USA 11.7 USA 13.7 UAE 5.0 Germany 7.5 China 4.9 Japan 6.8 UK 4.4 UK 5.7 Belgium 4.1 Belgium-Lux. 4.1 Germany 3.8 UAE 3.9 Hong Kong 3.3 Hong Kong 3.2 Japan 3.1 Italy 2.8 Singapore 3.0 Russian Fed. 2.7 Switz.Leicht. 2.6 Saudi Arabia 2.7
Note: Countries in bold and italics are members of ASEAN+4
18.1% 17.6% 17.2% 17.6% 17.5%
15.1%
16.9%17.9%
19.9%
77.0%
78.0%
79.0%
80.0%
81.0%
82.0%
83.0%
84.0%
85.0%
86.0%
1995 1996 1997 1998 1999 2000 2001 2002 2003
0.0%
5.0%
10.0%
15.0%
20.0%
25.0%ROW ASEAN+4

11
5.4 India as a market for the ASEAN+4
Simultaneous with the increase in the share of ASEAN+4 in India’s total trade it is
observed that there is an increase in India’s relevance for the ASEAN+4 nations.
Evidence shows that India is increasingly being looked at as a market for exports
(Table 5.4). Over the years 1995-2003 India registered the highest rate of growth in
the region for Chinese and Indonesian exports. India is second only to China as the
most attractive market in the region for Korean, Malaysian and Thai exports.
Table 5.4: India as a Market for ASEAN+4: A Comparison with the +3 Economies Markets Bru.
Dar. China India Indon. Japan Korea Malay. Phili. Singap. Thai.
CHINA - - 86.7 13.1 17.9 31.6 27.6 - 29.7 27.5
INDIA - 37.4 - 39.7 - 0.6 17.0 22.8 - 7.2 13.5
JAPAN - 12.1 - 2.6 1.2 - 6.1 2.2 - 0.6 2.3
KOREA
REP.
- 22.3 7.7 5.4 1.3 - 5.3 9.6 11.0
Notes: figures in the table represent average annual rog of exports to the specific markets over 1999-2003.
The fact that India is emerging as an important market for intra-regional exports is
corroborated when we look at India’s trade with ASEAN+4. It may be seen from
Table 5.5 that the average annual rate of growth of imports of India from ASEAN+4
exceeds the rate of growth of India’s exports to ASEAN+4. In addition, when
compared with other plus four economies, the rate of growth of India’s imports from
ASEAN+4 is second to China and significantly higher than that of Japan and Korea.
Table 5.5: ROG of Exports and Imports of the Plus Four Economies: 1995-2003
India China Japan Korea Imports from ASEAN+4 10.8 14.6 4.4 4.8 Exports to ASEAN+4 7.7 10.5 1.7 5.8
To recap:
• Trends in intra-bloc trade reveal the strength of ASEAN+4 as a potential
candidate for regional economic integration.
• Trends in index of trade intensity further substantiate the claim of ASEAN+4 as a
regional trade bloc in Asia.
12
• In the proposed trade bloc, though India’s share in total intra-bloc trade is the
lowest relative to the plus three economies yet its alignment with the ASEAN+4
bloc is justified on account of its growing trade linkages with the proposed bloc.
Having noted the case for the justification for the inclusion of India in the proposed
bloc of ASEAN+4, we analyze if India can be positioned in a manner similar to the
plus three economies or if there are any features characterizing India that make it
distinct from the other three economies and which may have implications for trade
integration in Asia. For this purpose we undertake a comparative analysis of the trade
bias towards the proposed bloc as exhibited by India and the plus three economies.
6 India vis-à-vis the plus three economies
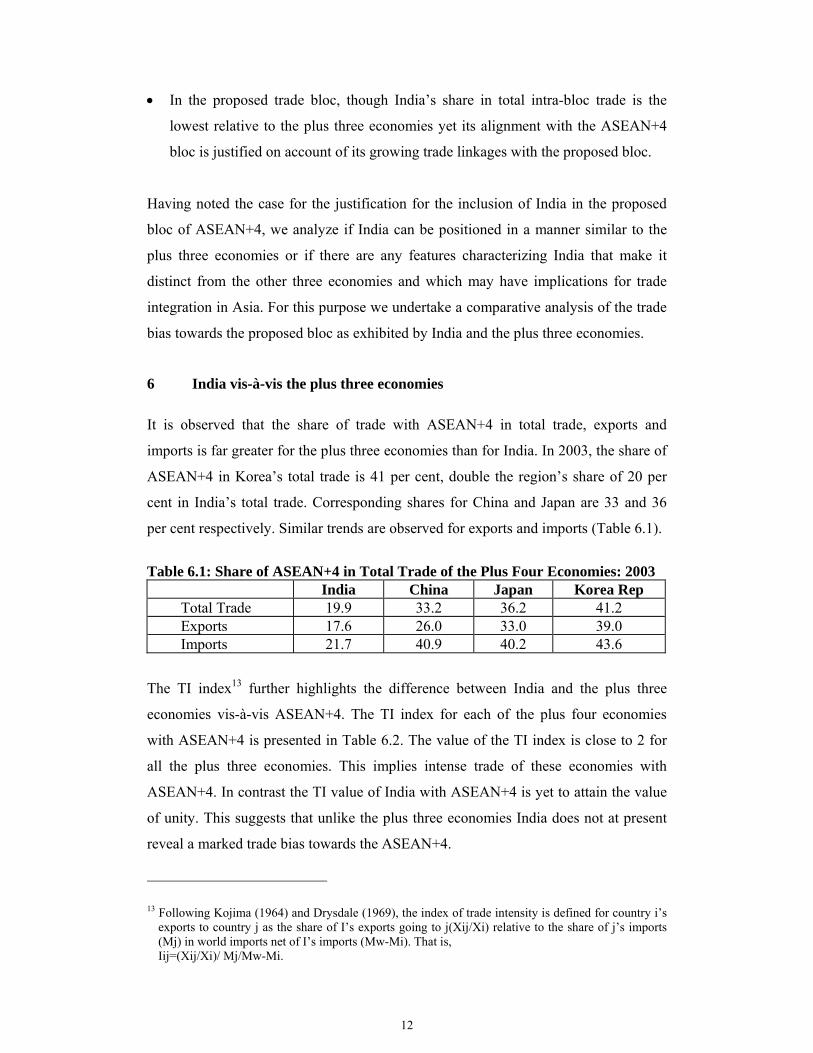
It is observed that the share of trade with ASEAN+4 in total trade, exports and
imports is far greater for the plus three economies than for India. In 2003, the share of
ASEAN+4 in Korea’s total trade is 41 per cent, double the region’s share of 20 per
cent in India’s total trade. Corresponding shares for China and Japan are 33 and 36
per cent respectively. Similar trends are observed for exports and imports (Table 6.1).
Table 6.1: Share of ASEAN+4 in Total Trade of the Plus Four Economies: 2003
India China Japan Korea Rep Total Trade 19.9 33.2 36.2 41.2 Exports 17.6 26.0 33.0 39.0 Imports 21.7 40.9 40.2 43.6
The TI index13 further highlights the difference between India and the plus three
economies vis-à-vis ASEAN+4. The TI index for each of the plus four economies
with ASEAN+4 is presented in Table 6.2. The value of the TI index is close to 2 for
all the plus three economies. This implies intense trade of these economies with
ASEAN+4. In contrast the TI value of India with ASEAN+4 is yet to attain the value
of unity. This suggests that unlike the plus three economies India does not at present
reveal a marked trade bias towards the ASEAN+4.
13 Following Kojima (1964) and Drysdale (1969), the index of trade intensity is defined for country i’s
exports to country j as the share of I’s exports going to j(Xij/Xi) relative to the share of j’s imports (Mj) in world imports net of I’s imports (Mw-Mi). That is, Iij=(Xij/Xi)/ Mj/Mw-Mi.
13
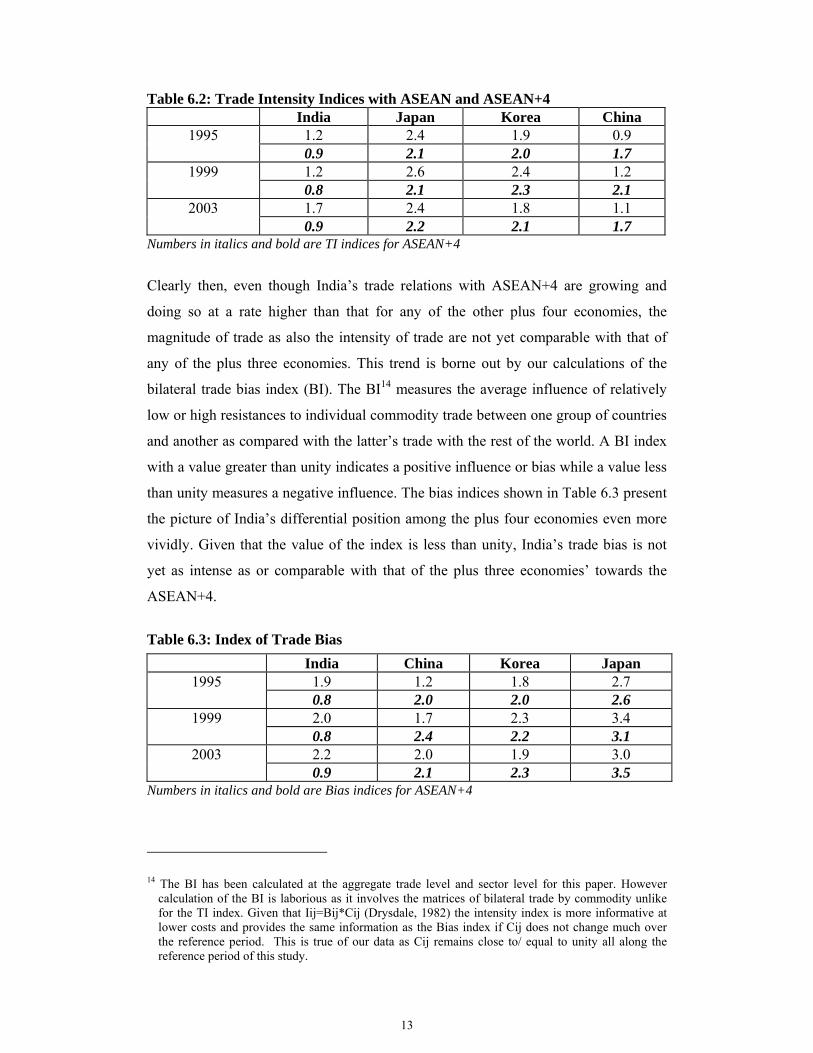
Table 6.2: Trade Intensity Indices with ASEAN and ASEAN+4 India Japan Korea China
1.2 2.4 1.9 0.9 1995 0.9 2.1 2.0 1.7 1.2 2.6 2.4 1.2 1999 0.8 2.1 2.3 2.1 1.7 2.4 1.8 1.1 2003 0.9 2.2 2.1 1.7
Numbers in italics and bold are TI indices for ASEAN+4
Clearly then, even though India’s trade relations with ASEAN+4 are growing and
doing so at a rate higher than that for any of the other plus four economies, the
magnitude of trade as also the intensity of trade are not yet comparable with that of
any of the plus three economies. This trend is borne out by our calculations of the
bilateral trade bias index (BI). The BI14 measures the average influence of relatively
low or high resistances to individual commodity trade between one group of countries
and another as compared with the latter’s trade with the rest of the world. A BI index
with a value greater than unity indicates a positive influence or bias while a value less
than unity measures a negative influence. The bias indices shown in Table 6.3 present
the picture of India’s differential position among the plus four economies even more
vividly. Given that the value of the index is less than unity, India’s trade bias is not
yet as intense as or comparable with that of the plus three economies’ towards the
ASEAN+4.
Table 6.3: Index of Trade Bias
Numbers in italics and bold are Bias indices for ASEAN+4
14 The BI has been calculated at the aggregate trade level and sector level for this paper. However
calculation of the BI is laborious as it involves the matrices of bilateral trade by commodity unlike for the TI index. Given that Iij=Bij*Cij (Drysdale, 1982) the intensity index is more informative at lower costs and provides the same information as the Bias index if Cij does not change much over the reference period. This is true of our data as Cij remains close to/ equal to unity all along the reference period of this study.
India China Korea Japan 1.9 1.2 1.8 2.7 1995 0.8 2.0 2.0 2.6 2.0 1.7 2.3 3.4 1999 0.8 2.4 2.2 3.1 2.2 2.0 1.9 3.0 2003 0.9 2.1 2.3 3.5

14
So, India’s trade with ASEAN+4 increasing at a rate greater than that of any of the
plus three economies and its increasing importance as a market for ASEAN+4
provides the basis for accepting India as an integral part of ASEAN+415. However,
the share of the proposed bloc in the plus three economies’ total trade is far greater
than and more intense relative to its share in India’s total trade. So a de facto market
led integration of the plus three economies with ASEAN (the ASEAN+3)16 is evident.
In the ASEAN+4 set of countries India thus stands out as the ‘distant’ economy. For a
trade bloc comprising the ASEAN, China, Japan, Korea and India it is therefore
imperative that the path of integration for the ‘distant’ economy be identified.
Considering that the index of trade intensity and bias is greater than unity for India-
ASEAN trade over 1995-200317 we suggest that India should enter the ASEAN+4 by
first aligning with ASEAN in an ASEAN+1 arrangement. This may happen through
either of the following two options18:
a. ASEAN+1s: India’s alignment on a plus one basis combined with all the plus
three economies also entering through a plus one arrangement. A convergence of
all the ASEAN+1 agreements will lead to the emergence of ASEAN+4; or
b. ASEAN+3+1: As stated above the ASEAN +3 already exists as a de facto market
led arrangement. India enters last through the ASEAN+1 route to constitute
ASEAN+4.
We evaluate these two routes in terms of their efficiency costs using a two part
methodology which is explained below.
15 India’s trade intensity index with ASEAN+4 is less than one for aggregate trade. However when a
sector-wise TI index is calculated it is greater than one for sectors like agriculture and allied commodities, minerals and mineral fuels and more recently in the chemicals and plastics sector. This is borne out by our calculations of the sector-wise CI and BI indices. This therefore supports our earlier inference on India’s justified alignment with ASEAN+4. Results of sector-wise BI, CI and TI index are presented in the Appendix –Tables A.1-A.3.
16 ASEAN+3 has been referred to as the most suitable candidate for East Asian regionalism in the literature (Baldwin, 2006; Drysdale, Peter 2001). At this stage the ASEAN+3 group is not a regional trading agreement. The focus in ASEAN+3 is on financial cooperation.
17 See Tables 15 and 16. 18 Note that for the plus three economies the TI and BI in Tables 15 and 16 indicate equal bias towards
the existing and proposed bloc.
15
7 The most efficient route to ASEAN+4: ASEAN+3+1 or the ASEAN+1s?
7.1 Regional orientation and comparative advantage
To estimate the efficiency costs associated with alignment of the plus four economies
with ASEAN we examine if the additional trade that is generated on account of the
anticipatory effects of the proposed/under negotiation/signed preferential
arrangements is primarily in products in which these countries reveal comparative
advantage in the global market. The analysis will allow us to infer if additional trade
and increased export dynamism is in products where the plus four countries have low
enough costs to be competitive in the world market. If this does not hold true then the
comparison suggests that the additional trade within the respective markets/trading
arrangements is inefficient, has attached costs and could have been replaced by more
efficient outside suppliers19.
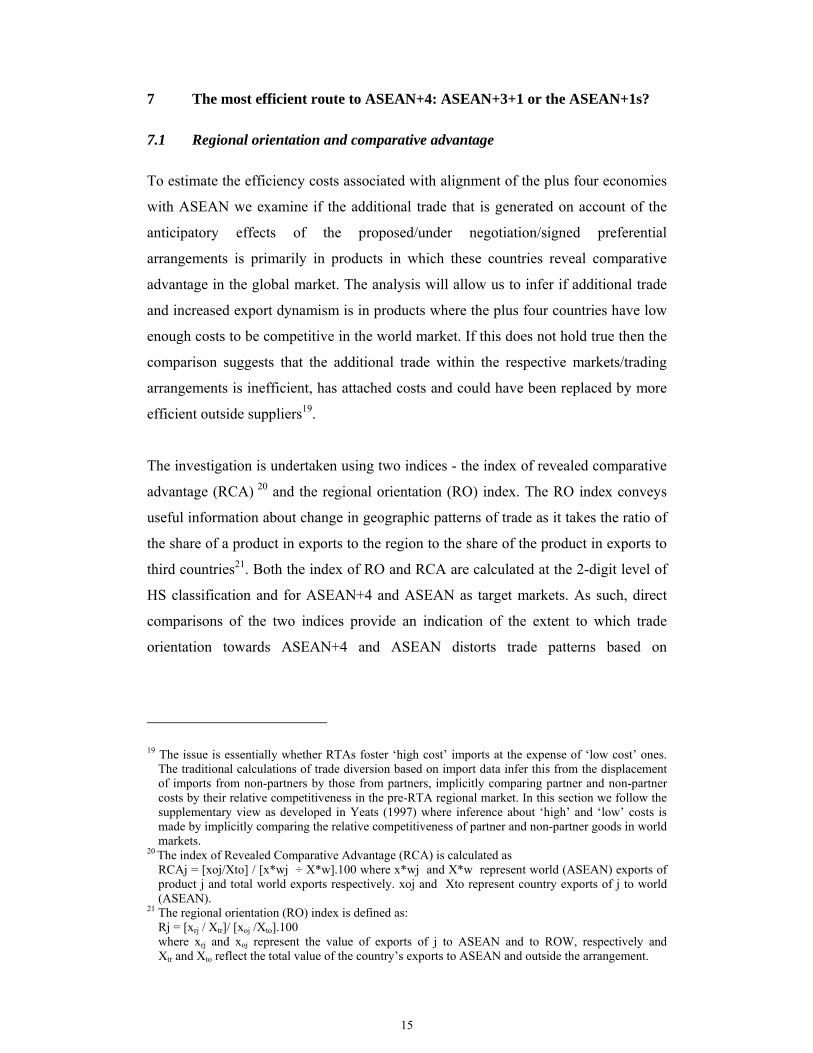
The investigation is undertaken using two indices - the index of revealed comparative
advantage (RCA) 20 and the regional orientation (RO) index. The RO index conveys
useful information about change in geographic patterns of trade as it takes the ratio of
the share of a product in exports to the region to the share of the product in exports to
third countries21. Both the index of RO and RCA are calculated at the 2-digit level of
HS classification and for ASEAN+4 and ASEAN as target markets. As such, direct
comparisons of the two indices provide an indication of the extent to which trade
orientation towards ASEAN+4 and ASEAN distorts trade patterns based on
19 The issue is essentially whether RTAs foster ‘high cost’ imports at the expense of ‘low cost’ ones.
The traditional calculations of trade diversion based on import data infer this from the displacement of imports from non-partners by those from partners, implicitly comparing partner and non-partner costs by their relative competitiveness in the pre-RTA regional market. In this section we follow the supplementary view as developed in Yeats (1997) where inference about ‘high’ and ‘low’ costs is made by implicitly comparing the relative competitiveness of partner and non-partner goods in world markets.
20 The index of Revealed Comparative Advantage (RCA) is calculated as RCAj = [xoj/Xto] / [x*wj ÷ X*w].100 where x*wj and X*w represent world (ASEAN) exports of product j and total world exports respectively. xoj and Xto represent country exports of j to world (ASEAN).
21 The regional orientation (RO) index is defined as: Rj = [xrj / Xtr]/ [xoj /Xto].100 where xrj and xoj represent the value of exports of j to ASEAN and to ROW, respectively and Xtr and Xto reflect the total value of the country’s exports to ASEAN and outside the arrangement.

16
comparative advantage in the global market22 for each of the plus one economies.
Efficiency costs are measured as the percentage of sectors in which the economy is
getting increasingly oriented towards the respective region over 1995-200323 even
though it is not competitive in these sectors in the global market. In other words we
identify the percentage number of sectors which satisfy the following criterion.
(RO2003 - RO1995) > 0 & RO2003 > 1 and RCA2003 < 1
in two target markets- ASEAN and ASEAN+4
The results of our analysis are presented in Table 7.1. The efficiency costs are lower
Table 7.1: Efficiency Costs*: Regional Orientation and Comparative Advantage ASEAN ASEAN+4
India 50.0 53.6 China 26.1 66.7 Japan 90.9 85.1 Korea 68.3 77.5
*% number of Sectors
for alignment with ASEAN relative to ASEAN+4 for all the economies except Japan.
For China the cost of alignment with ASEAN is low relative to alignment with
ASEAN+4 and lowest among the plus four economies. In comparison with about 67
per cent for ASEAN+4 only 26 per cent sectors are such that despite being
comparatively disadvantageously placed in the world market China’s exports from
these sectors are getting increasingly oriented towards ASEAN. For India, in about 50
per cent of the sectors increased export orientation towards ASEAN is observed
despite a lack of comparative advantage in the world market in comparison with 54
per cent such sectors in case of ASEAN+4. Corresponding figures for Korea are 68
and 78 per cent for ASEAN and ASEAN+4 respectively. Clearly, ASEAN+1 is a
more cost efficient arrangement for all the economies except Japan24.
22 An attempt has also been made to do the same for the rest of the world market or the Non-ASEAN
world. The results are not significantly altered. 23 The change in RO index is calculated over a period of time as it conveys only limited information
about trade patterns if computed for a single point in time. Inter-temporal comparisons over relatively short periods provide useful information on the way the geographic pattern of trade is changing.
24 As an alternative to this strict efficiency criterion if costs are calculated as percentage number of sectors that are increasingly getting oriented towards the target market-ASEAN or ASEAN+3 but

17
7.2 Efficiency costs vis-à-vis multilateral liberalization
7.2.1 Alignment of comparative advantage
In this section we estimate the efficiency costs by undertaking a comparison of the
comparative advantage of each of the plus four economies in the ASEAN+4/ASEAN
market and the world market. Alignment of the structure of a country’s comparative
advantage in the two markets (ASEAN and world or ASEAN+4 and world) will
imply fewer shifts in the production structure and lower costs as a consequence of an
FTA with either ASEAN+4 or ASEAN. In addition, we have also compared the RCA
across the three markets cross classified by factor intensity. The analysis will provide
evidence of a shift, if any, of the factors of production, between industries that may be
required as a consequence of regional integration. The efficiency costs as estimated in
this section will also be indicative of the cost of participation in the regional FTA
relative to participation in multilateral liberalization which, according to conventional
wisdom, is considered the ‘first best’ solution for attaining the potential benefits of a
more open world economy.
The index of RCA has been calculated at HS-6 digit level for the most recent year of
our sample period that is 200325. The alignment of RCAs has been checked using the
Spearman Rank Correlation Coefficient (SRCC) at the aggregate level (for all sectors)
and separately for agriculture, manufacturing, minerals and fuels, chemicals and
plastics and manufactures chiefly by materials and miscellaneous manufactures26. The
SRCC, a non-parametric test, is often used to test for independence between two
random variables. The range of possible values is from –1 to +1. A value close to +1/-
1 will be interpreted to mean strong positive/negative rank correlation while a value
of zero indicates a complete lack of correlation. For the purpose of our analysis, a
experiencing a fall in comparative advantage in the world market i.e. (RO2003 - RO1995) > 0 & (RCA2003 - RCA1995) < 0 alignment with ASEAN emerges as the lower cost and hence more efficient option for all the plus four economies. The results are reported in the Appendix Table A.4.
25 As the arrangements are yet to fructify we calculate efficiency costs using the most recent year 2003 as indicative of future costs.
26 The alignment of the structure of comparative advantage has been undertaken irrespective of the value of the index. Alternately alignment of only those commodities where countries are comparatively advantageously placed has also been tried. The results do not alter the earlier implications.

18
high27 rank correlation will be interpreted to mean the ranking of a country’s
industries by comparative advantage in a particular market, in this case, ASEAN or
ASEAN+4 is similar to its ranking in the global market. A low coefficient will
indicate that the ranking is considerably different across the two markets. The former
implies lower cost of alignment with the respective preferential arrangement vis-à-vis
the multilateral participation. The results are presented in Table 7.2.
Table 7.2: Alignment of Comparative Advantage vis-à-vis Multilateral Liberalization India China Japan Korea
0.66 0.72 0.73 0.63 All Sectors
0.73 0.84 0.79 0.78
0.63 0.60 0.59 0.55 Agriculture & Allied
0.74 0.81 0.67 0.74
0.67 0.74 0.72 0.63 Manufacturing
0.73 0.85 0.78 0.78
0.64 0.44 0.68 0.48 Minerals & Mineral Fuels
0.82 0.85 0.89 0.78
0.70 0.75 0.65 0.67 Chemicals & Plastics
0.75 0.86 0.73 0.82
0.69 0.74 0.71 0.61 Manufacturers chiefly by Mat.
0.74 0.83 0.79 0.77
0.55 0.72 0.76 0.65 Machinery
0.57 0.82 0.84 0.79
0.38 0.85 0.73 0.60 Misc (HS 90-99)
0.50 0.85 0.82 0.75
Note: Italicized: ASEAN+4; Bold: Moderate; pink: high: All others: Low; All significant
The value of the coefficient of SRC is fairly high at the aggregate level and for
individual sectors for all economies. As against multilateral liberalization,
participation in either of the two arrangements, that is, ASEAN+4 or ASEAN, does 27 While no strict definitions are available we specify the range of 0-0.4 as low, 0.5-0.7 as modest and
0.8 and above as high for the SRCC.

19
not imply significant shifts in the comparative advantage and, consequently, in the
production structure. The extent of alignment is slightly higher at the aggregate level
for all the economies for the ASEAN+4 market.
7.2.2 Alignment of comparative advantage and shifts in factor intensity
Five categories of factor intensity (FI) are identified. These are primary, unskilled -
labour intensive, natural - resource intensive, human-capital intensive and technology
intensive. The export patterns of the economies reclassified according to these five
categories are compared across markets-world and ASEAN and world and
ASEAN+4-for alignment using the SRCC. The results, presented in Table 7.3, are
interesting. The value of the coefficient varies across countries but again falls in the
range of being classified as modest to high, with very few in the latter category. India
stands out as distinctly different from the other plus three economies. The export
structure is aligned broadly similarly in ASEAN and world and ASEAN+4 and world
for India. The value of the SRCC is almost the same in the two target markets. This
implies an indifference between alignment with ASEAN or ASEAN+4 for India as
neither implies any major shift of factors from their current employment in industries
as oriented towards production for the global market. For the plus three economies
ASEAN+4 is marginally more efficient than ASEAN.
Table 7.3: Alignment of Comparative Advantage and Shifts in Factor Intensity India China Japan Korea
0.71 74 0.72 0.65 Human-Capital Intensive 0.75 0.82 0.79 0.78 0.65 0.55 0.62 0.57 Primary
0.77 0.82 0.77 0.79 0.62 0.66 0.71 0.60 Unskilled-Labour Intensive 0.68 0.75 0.78 0.75 0.71 0.62 0.75 0.60 Natural-Resource Intensive 0.75 0.77 0.80 0.77 0.64 0.72 0.71 0.66 Technology Intensive 0.67 0.85 0.79 0.81
Note: Italicized: ASEAN+4; Bold: Moderate; pink: high All others: Low; To consolidate our results efficiency costs in terms of a shift in factor intensity has
been analyzed using another approach. The number of commodities for which a
country enjoys comparative advantage in each market has been counted in each FI
20
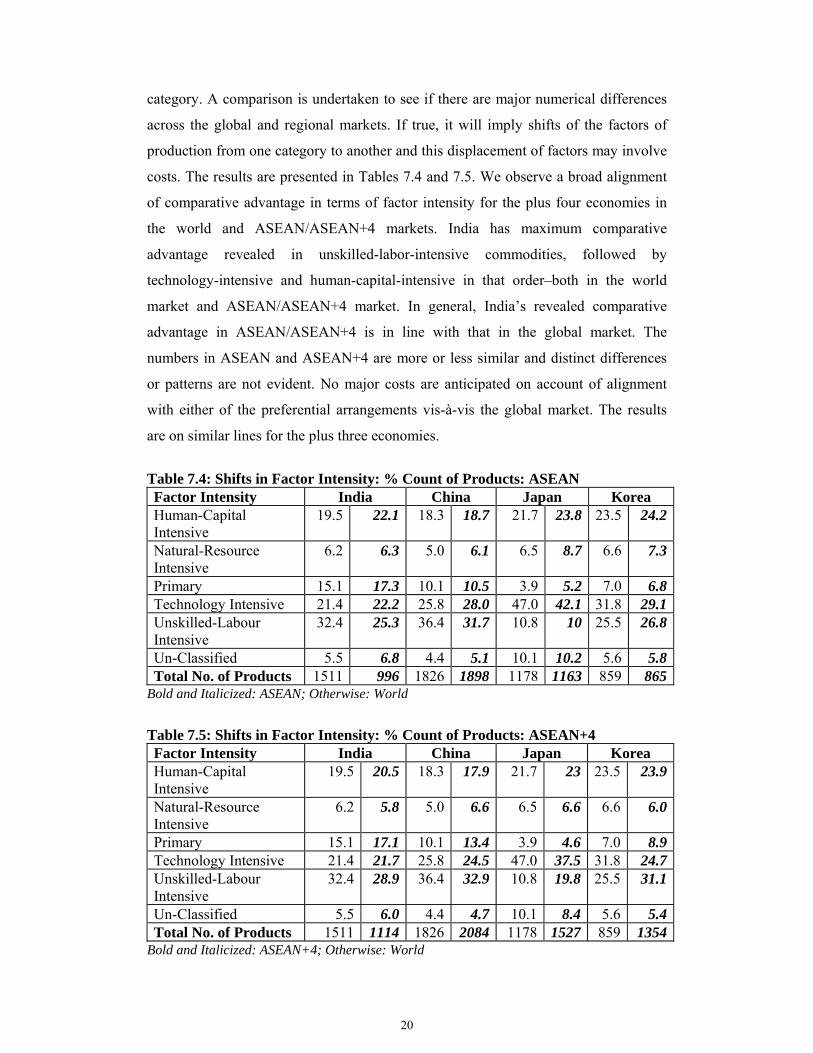
category. A comparison is undertaken to see if there are major numerical differences
across the global and regional markets. If true, it will imply shifts of the factors of
production from one category to another and this displacement of factors may involve
costs. The results are presented in Tables 7.4 and 7.5. We observe a broad alignment
of comparative advantage in terms of factor intensity for the plus four economies in
the world and ASEAN/ASEAN+4 markets. India has maximum comparative
advantage revealed in unskilled-labor-intensive commodities, followed by
technology-intensive and human-capital-intensive in that order–both in the world
market and ASEAN/ASEAN+4 market. In general, India’s revealed comparative
advantage in ASEAN/ASEAN+4 is in line with that in the global market. The
numbers in ASEAN and ASEAN+4 are more or less similar and distinct differences
or patterns are not evident. No major costs are anticipated on account of alignment
with either of the preferential arrangements vis-à-vis the global market. The results
are on similar lines for the plus three economies.
Table 7.4: Shifts in Factor Intensity: % Count of Products: ASEAN Factor Intensity India China Japan Korea Human-Capital Intensive
19.5 22.1 18.3 18.7 21.7 23.8 23.5 24.2
Natural-Resource Intensive
6.2 6.3 5.0 6.1 6.5 8.7 6.6 7.3
Primary 15.1 17.3 10.1 10.5 3.9 5.2 7.0 6.8Technology Intensive 21.4 22.2 25.8 28.0 47.0 42.1 31.8 29.1Unskilled-Labour Intensive
32.4 25.3 36.4 31.7 10.8 10 25.5 26.8
Un-Classified 5.5 6.8 4.4 5.1 10.1 10.2 5.6 5.8Total No. of Products 1511 996 1826 1898 1178 1163 859 865
Bold and Italicized: ASEAN; Otherwise: World
Table 7.5: Shifts in Factor Intensity: % Count of Products: ASEAN+4 Factor Intensity India China Japan Korea Human-Capital Intensive
19.5 20.5 18.3 17.9 21.7 23 23.5 23.9
Natural-Resource Intensive
6.2 5.8 5.0 6.6 6.5 6.6 6.6 6.0
Primary 15.1 17.1 10.1 13.4 3.9 4.6 7.0 8.9Technology Intensive 21.4 21.7 25.8 24.5 47.0 37.5 31.8 24.7Unskilled-Labour Intensive
32.4 28.9 36.4 32.9 10.8 19.8 25.5 31.1
Un-Classified 5.5 6.0 4.4 4.7 10.1 8.4 5.6 5.4Total No. of Products 1511 1114 1826 2084 1178 1527 859 1354
Bold and Italicized: ASEAN+4; Otherwise: World
21
Based on the above analysis of efficiency conditions it is considered that India’s entry
into the ASEAN+4 trade bloc will be more efficient if made through an ASEAN+1
arrangement. For China and Korea also the ASEAN+1 framework will be the more
appropriate route. While the ASEAN+4 is marginally more efficient vis-à-vis
multilateral liberalization, costs of regional orientation of exports are lower for both
Korea and China in an alignment with ASEAN in the ASEAN+1 arrangement.
Alternative calculations of efficiency costs give a similar inference for Japan also. A
convergence of the plus one initiatives of all the plus four economies with ASEAN
may therefore be the more efficient route to achieving regional economic integration.
8 If ASEAN+1: is there a first mover advantage?
If Asian economic integration is to be achieved through a convergence of the
ASEAN+1 initiatives it is necessary that we analyze if a pre emptive entry to ASEAN
by any of the plus four economies will give it a first mover advantage vis-à-vis the
other economies. Context and sequence of events is important in evaluating a
preferential trading arrangement. The ASEAN-China FTA triggered a positive
domino effect in the region. First, Japan followed suit by submitting a similar
proposal and soon India and Korea also followed. The late entrants–Japan, India and
Korea may face export diversion on account of China being the first mover for FTA
formation with ASEAN. This is particularly relevant as the Early Harvest Programme
of the ASEAN-China framework agreement is already in implementation and the
FTA itself will be the first to be effective. In this section we examine if China‘s prior
entry in ASEAN has an adverse impact through trade diversion on the other three
economies. The degree to which each country is affected through trade diversion will
depend critically on how much overlap there is between the exports of these
countries28. Empirical analysis of the trade diversion effect of the ASEAN-China FTA
on partners in the Asian FTA has not been undertaken so far. We undertake an
analysis of the export similarity of the plus four economies using conventional
28 Unlike the econometric analysis of trade diversion and trade creation effects of the PTAs using the
gravity model and general equilibrium techniques this exercise enables us to distinguish the trade diversion effects at the commodity level. Commodities/product groups where India is most threatened on account of trade diversion as a consequence of the China-ASEAN FTA are thus identified in this paper.
22
techniques and, in addition, introduce innovations by evaluating the existing and
potential overlap of comparative advantage of the plus four economies at the sector
and commodity levels.
8.1 Export Overlap
First, an evaluation of the degree of overlap of exports of the plus four economies has
been undertaken by a simple analysis of export composition. The observations thus
made are substantiated using the statistical technique of Spearman Rank Correlation
Coefficient (SRCC). The SRCC is calculated for exports both at the 2 and 6-digit HS
level for India, China, Japan and Korea to ASEAN in 2003. As a check of the
robustness of the results, the above exercise using correlations is repeated using a
separate and equally popular export similarity technique known as the Finger–Kreinin
Index (F-KI) 29.
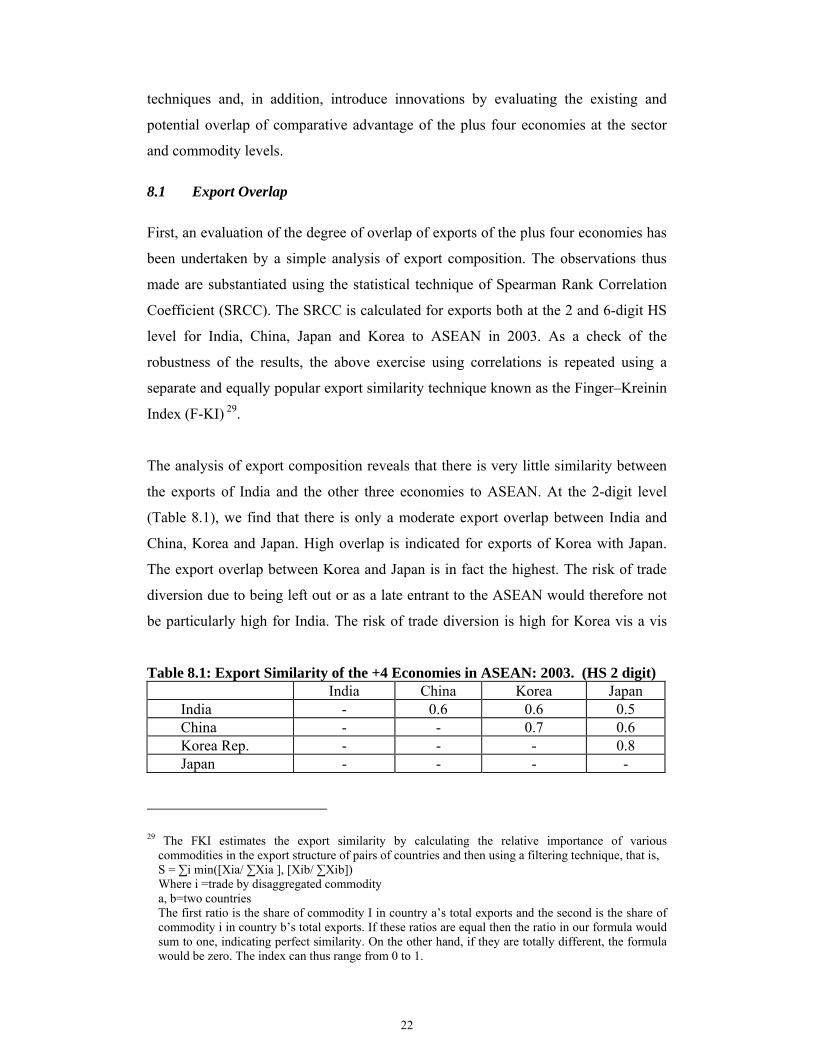
The analysis of export composition reveals that there is very little similarity between
the exports of India and the other three economies to ASEAN. At the 2-digit level
(Table 8.1), we find that there is only a moderate export overlap between India and
China, Korea and Japan. High overlap is indicated for exports of Korea with Japan.
The export overlap between Korea and Japan is in fact the highest. The risk of trade
diversion due to being left out or as a late entrant to the ASEAN would therefore not
be particularly high for India. The risk of trade diversion is high for Korea vis a vis
Table 8.1: Export Similarity of the +4 Economies in ASEAN: 2003. (HS 2 digit) India China Korea Japan
India - 0.6 0.6 0.5 China - - 0.7 0.6 Korea Rep. - - - 0.8 Japan - - - -
29 The FKI estimates the export similarity by calculating the relative importance of various
commodities in the export structure of pairs of countries and then using a filtering technique, that is, S = ∑i min([Xia/ ∑Xia ], [Xib/ ∑Xib]) Where i =trade by disaggregated commodity a, b=two countries The first ratio is the share of commodity I in country a’s total exports and the second is the share of commodity i in country b’s total exports. If these ratios are equal then the ratio in our formula would sum to one, indicating perfect similarity. On the other hand, if they are totally different, the formula would be zero. The index can thus range from 0 to 1.

23
Japan. The results of the SRCC calculations at the 6-digit level of dis-aggregation
presented in Table 8.2, however, allay the fears of trade diversion for all the four
economies. The value of SRCC is low and, therefore, indicative of a negligible export
overlap between the plus four economies reinforcing further our conclusion that the
risk of trade diversion for a late entrant is low as is the first mover advantage.
Table 8.2: Export Similarity of the +4 Economies in ASEAN: 2003. (HS 6 digit) India China Korea Japan
India - 0.4 0.3 0.2 China - - 0.4 0.4 Korea Rep. - - - 0.5 Japan - - - -
* Significant at all levels
The F-K index is estimated at the 2 and 6-digit level of disaggregation for India,
China, Japan and Korea. The results are given in Tables 8.3 and 8.4. At the
commodity level (HS-6 digit) the value of the index is small, thus corroborating the
evidence on the SRCCs of the export structure of the plus four economies to ASEAN.
The extent of competition between the plus three and India in the ASEAN market is
almost non-existent.
Table 8.3: Finger-Kreinin Index: ASEAN (HS 2 digit) India China Japan Korea
1995 - 0.50 0.34 0.44 India 2003 - 0.46 0.36 0.44 1995 0.50 - 0.50 0.58 China 2003 0.46 - 0.67 0.71 1995 0.34 0.50 - 0.71 Japan 2003 0.36 0.67 - 0.81 1995 0.44 0.58 0.71 - Korea 2003 0.44 0.71 0.81 -
Table 8.4: Finger-Kreinin Index: ASEAN (HS 6 digit) India China Japan Korea
1995 - 0.24 0.15 0.15 India 2003 - 0.27 0.16 0.18 1995 0.24 - 0.33 0.26 China 2003 0.27 - 0.31 0.43 1995 0.15 0.33 - 0.27 Japan 2003 0.16 0.31 - 0.46 1995 0.15 0.26 0.27 - Korea 2003 0.18 0.43 0.46 -

24
As the scope for trade diversion on account of export similarity of the plus four
economies to ASEAN+4 is almost negligible, the ASEAN+1 arrangement can be
perceived as an efficient vehicle to achieve regional economic integration in Asia.
8.2 Overlap of comparative advantage
For greater robustness of our results we also examine the extent of overlap in
comparative advantage that each economy enjoys in the ASEAN market at present or
is likely to enjoy in the future. Two sets of commodities are identified.
i) Overlap of existing comparative advantage: The first set comprises
commodities for which more than one of the plus four economies currently
enjoys comparative advantage in the ASEAN market.
ii) Potential for overlap of comparative advantage: The second set comprises
commodities for which the plus four economies can in future develop
comparative advantage in ASEAN as they are currently advantageously placed
in the world market. The potential possibility for exports of these
commodities to ASEAN would be lost/threatened on account of one of the
plus four economies making a prior entry into the ASEAN market. The threat
is more real if one of the plus four countries is at present the main country of
origin of imports of these products for ASEAN.
8.2.1 Overlap of existing comparative advantage
Among the plus four economies maximum overlap of existing comparative advantage
in the ASEAN market is observed between India and China. For 52 per cent of the
commodities where India and China have an advantage in the world market as well as
in ASEAN, India enjoys greater comparative advantage relative to China in the
ASEAN market. Indian exports of these commodities are likely to be adversely
affected if China makes a prior entry in ASEAN. Trade will be diverted away from
India. Further, for 72 per cent of these commodities, India is actually more
competitive than China even in the world market. Among these are commodities like
marine products (fish and mollusks) and leguminous vegetables that belong to sectors
25
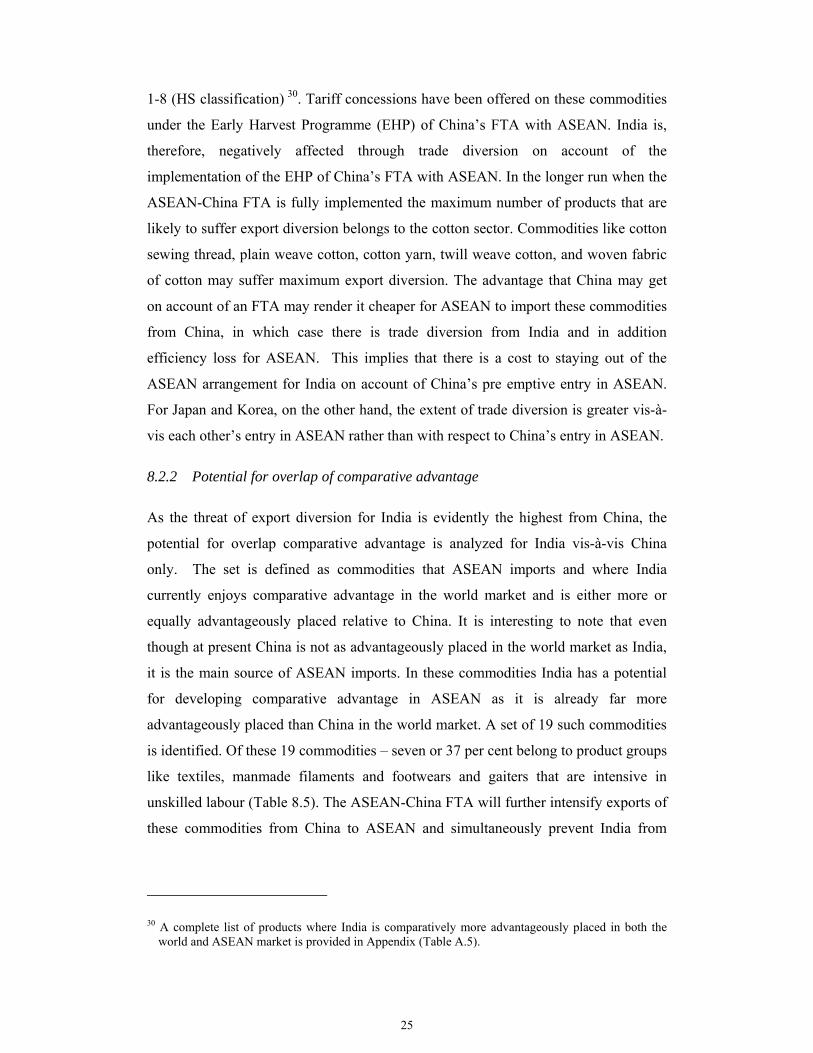
1-8 (HS classification) 30. Tariff concessions have been offered on these commodities
under the Early Harvest Programme (EHP) of China’s FTA with ASEAN. India is,
therefore, negatively affected through trade diversion on account of the
implementation of the EHP of China’s FTA with ASEAN. In the longer run when the
ASEAN-China FTA is fully implemented the maximum number of products that are
likely to suffer export diversion belongs to the cotton sector. Commodities like cotton
sewing thread, plain weave cotton, cotton yarn, twill weave cotton, and woven fabric
of cotton may suffer maximum export diversion. The advantage that China may get
on account of an FTA may render it cheaper for ASEAN to import these commodities
from China, in which case there is trade diversion from India and in addition
efficiency loss for ASEAN. This implies that there is a cost to staying out of the
ASEAN arrangement for India on account of China’s pre emptive entry in ASEAN.
For Japan and Korea, on the other hand, the extent of trade diversion is greater vis-à-
vis each other’s entry in ASEAN rather than with respect to China’s entry in ASEAN.
8.2.2 Potential for overlap of comparative advantage
As the threat of export diversion for India is evidently the highest from China, the
potential for overlap comparative advantage is analyzed for India vis-à-vis China
only. The set is defined as commodities that ASEAN imports and where India
currently enjoys comparative advantage in the world market and is either more or
equally advantageously placed relative to China. It is interesting to note that even
though at present China is not as advantageously placed in the world market as India,
it is the main source of ASEAN imports. In these commodities India has a potential
for developing comparative advantage in ASEAN as it is already far more
advantageously placed than China in the world market. A set of 19 such commodities
is identified. Of these 19 commodities – seven or 37 per cent belong to product groups
like textiles, manmade filaments and footwears and gaiters that are intensive in
unskilled labour (Table 8.5). The ASEAN-China FTA will further intensify exports of
these commodities from China to ASEAN and simultaneously prevent India from
30 A complete list of products where India is comparatively more advantageously placed in both the
world and ASEAN market is provided in Appendix (Table A.5).

26
exploiting its potential for exports to ASEAN. China’s entry in ASEAN prior to India
through the ASEAN- China FTA thus also implies potential trade diversion for India.
Table 8.5: Commodities with Potential for Overlap of Comparative Advantage between India and China in the Unskilled labor Intensive Category HS Code Product
520543 Cotton yarn,>/=85%,multi,combed,232.56 >dtex>/=192.31,nt put up,nes
540262 Yarn of polyester filaments, multiple, nes, not put up
550999 Yarn of other synthetic staple fibres, not put up, nes
560750 Twine, cordage, ropes and cables, of other synthetic fibres
560900 Articles of yarn, strip, twine, cordage, rope and cables, nes
630710 Floor-cloths,dish-cloths,dusters & similar cleaning cloths,of tex mat
640420 Footwear with outer soles of leather and uppers of textile materials
9 Conclusions
In this paper alternative approaches to the alignment of the plus four economies with
ASEAN for the formation of the ASEAN+4 trade bloc have been examined in terms
of their efficiency costs. On the basis of an analysis of the trends in intra-regional
trade the study establishes the strength of ASEAN+4 as a potential trade bloc in Asia.
Evidence on India’s increasing trade linkages with ASEAN+4 is used to justify
India’s inclusion in the regional trade bloc. The share of the plus four economies
reveals a de facto market led integration for the ASEAN+3. India stands out as the
‘distant’ economy in this set of countries. It is imperative therefore that any proposal
for regional economic integration in Asia that is inclusive of India should focus on the
optimal route for India’s integration into the trade bloc.
Our results show that a prior alignment with ASEAN in the ASEAN+1 framework
may be a more efficient or least cost path to entering the ASEAN+4 bloc for all the
plus four economies. The costs of aligning with ASEAN in the plus one framework
are lowest for China. Regionally oriented export patterns do not imply any significant
costs of adjustment of the production structure or shift of factors of production away
from those that are consistent with the orientation towards the global market. A
convergence of the plus one initiatives may therefore be a more efficient route to
27
achieving regional economic integration. This is also the more practical path to the
emergence of an ASEAN plus four regional bloc as even though the ASEAN
initiatives with China, Japan, Korea and India maybe seen as leading the region
towards an economically integrated whole they are as yet within the framework of the
ASEAN+1 agreements and ASEAN negotiates with each country separately.
Efforts will however need to be made within the region to ensure that the ‘ASEAN+1’
agreement can act effectively as a stepping stone to an ‘ASEAN+4” agreement. Only
if the ASEAN+1 agreements of the plus four economies are compatible with each
other would there be hope of linking these agreements to constitute a regional
economic entity in Asia in future. Compatibility is possible as the elements of the +1
agreements are still being negotiated. A greater focus on harmonization and
consistency within ASEAN is required-say for e.g. with respect to the rules of origin
that at present may be scattered and inconsistent with one another.
Finally, in case China makes a pre-emptive entry into ASEAN, which it is bound to
considering that the Early Harvest Programme (EHP) is already in effect and the FTA
will be the first to be implemented, India, among the plus four economies, will be the
most adversely affected due to trade diversion. The EHP of the ASEAN-China FTA
that offers tariff concessions on commodities of sectors 1-8 (HS) will have a negative
impact on India. Products like marine products - fish and molluscs and leguminous
vegetables are likely to suffer. In the longer run when the ASEAN-China FTA is fully
implemented the maximum number of products that are likely to suffer export
diversion in India belongs to the cotton sector. Commodities like cotton sewing
thread, plain weave cotton, cotton yarn, twill weave cotton, and woven fabric of
cotton may suffer maximum export diversion. In the long run the ASEAN-China FTA
may also limit India’s export potential in ASEAN in product groups like textiles,
manmade filaments and footwears and gaiters that are largely unskilled labor
intensive commodities. It is imperative therefore that India should hasten its process
of negotiations for an early conclusion of the India-ASEAN FTA. For Japan and
Korea trade diversion is expected to be greater vis a vis each other’s entry in ASEAN
rather than with respect to the early implementation of the ASEAN -China FTA.

28
References
Asian Development Bank, 2005, Asian Economic Cooperation and Integration in Asia: Progress, Prospects and Challenges, Manila, Philippines.
Baldwin, Richard E., 2006, “Managing the Noodle Bowl: The Fragility of East Asian
Regionalism”. Graduate Institute of International Studies, Geneva. Drysdale, Peter, 2001, The East Asia Community: What Trade Arrangements make
Sense? Presentation to ‘Asian Values and Japan’s Options’ conference, University of Singapore.
Drysdale, Peter and Ross Garnaut, 1982, Trade Intensities and the Analysis of
Bilateral Trade Flows in a Many Country World: A Survey, Hitotsubashi Journal of Economics, 2, (2).
Drysdale, Peter, 1969, “Japan, Australia and New Zealand: The Prospects for Western
Pacific Economic Integration”’ Economic Record, 45(111). Frankel, Jeffrey, Ernesto Stein, and Shang-Jin Wei, 1995, “Trading blocs and the
Americas: The Natural, the Unnatural and the Super-natural”, Journal of Development Economics, 47.
Kawai, Masahiro, 2004, Regional Economic Integration and Cooperation in East
Asia, mimeo. Kojima, Kiyoshi, 1964, “The Pattern of Trade among Advanced Countries”,
Hitotsubashi Journal of Economics, vol. 5, No. 1. Krugman, P, 1993, Regionalism Vs Multilateralism: Analytical Notes,” in Jaime de
Melo and Arvind Panagariya (eds) New Dimensions in Regional Integration, CEPR.
Lee, Jong-Wha, Innwon Park and Kwanho Shin, 2004, Proliferating Regional trade
Arrangements: Why and Whither? Mingqui, Xu, 2003, East Asian Economic Integration: China’s Perspective and
Policy, Pacific Economic Papers, 341, Australian National University.

29
Ng, Francis and Alexander Yeats, 2003, Major Trade Trends in East Asia: What are their Implications for Regional Cooperation and Growth? Policy Research Working Paper 3084, The World Bank.
Petri, P., 1992, The East Asian Trading Bloc: An Analytical History, Working Paper
No. 315, Brandeis University, Waltham, MA. Ramkishen S. Rajan and Rahul Sen, 2005, The New Wave of Free Trade Agreements
in Asia, with particular reference to ASEAN, People’s Republic of China and India, in Asian Economic Cooperation and Integration in Asia: Progress, Prospects and Challenges, Asian Development Bank, Manila, Philippines.
Schiff, Maurice and L. Alan Winters, 2003, Regional Integration and Development,
World Bank. Scollay, Robert and John P. Gilbert 2001, New Regional Trading Arrangements in the
Asia Pacific? Policy Analyses in International Economics 63, Washington: Institute for International Economics.
Soesastro, Hadi 2003, An ASEAN Economic Community and ASEAN+3: How do
they Fit Together? Pacific Economic Papers, 338, Australian National University.
Summers, Lawrence, 1991, Regionalism and the World Trading System, paper
presented at a seminar for the Federal Reserve Bank of Kansas City. Vollrath, Thomas L. 1991, A Theoretical Evaluation of Alternative Trade Intensity
measures of Revealed Comparative Advantage, Weltwirtschaftliches Archiv, 127(2).
Wonnacott, Paul and Mark Lutz, 1989, Is there a Case for Free Trade Areas? in Free
Trade Areas and U.S. Trade Policy ed. Jeffrey J. Schott, Washington: Institute for International Economics.
Yamazawa, Ippei, 2001, Assessing a Japan-Korea Free Trade Agreement, The
Developing Economies 39(1). Yeats, Alexander, 1997, Does Mercusor’s Trade Performance Raise Concerns about
the Effects of Regional Trade Arrangements? Policy Research Working Paper 1729, The World Bank, Washington DC.

30
APPENDIX
Table A.1: India: Sector -wise Trade Intensity Index with ASEAN+4 Sectors 1995 1996 1997 1998 1999 2000 2001 2002 2003Agriculture & Allied 1.4 1.5 1.5 1.3 1.4 1.3 1.4 1.5 1.3 Minerals & Mineral Fuels
1.3 1.3 1.2 1.7 1.6 0.6 0.6 1.6 1.7
Chemicals & Plastics
0.9 0.9 0.9 1.0 1.1 1.0 1.1 1.2 1.3
Manufacturers chiefly my Materials
0.7 0.7 0.5 0.5 0.6 0.5 0.6 0.7 0.7
Machinery 0.8 0.8 0.8 0.8 0.9 0.9 0.9 0.8 0.6 Misc. 0.4 0.4 0.5 0.6 0.6 0.7 1.3 1.0 1.1
Table A.2: India: Sector-wise Complimentarity Index with ASEAN+4 Sectors 1995 1996 1997 1998 1999 2000 2001 2002 2003Agriculture & Allied 1.2 1.2 1.2 1.2 1.2 1.2 1.2 1.2 1.2 Minerals & Mineral Fuels
1.1 1.1 1.1 1.1 1.0 1.0 1.0 1.1 1.1
Chemicals & Plastics
1.0 1.0 0.9 0.9 0.9 1.0 1.0 1.0 1.0
Manufacturers chiefly by Materials
1.0 1.1 1.1 1.1 1.1 1.0 1.1 1.1 1.1
Machinery 0.9 0.9 1.0 1.0 1.0 1.0 1.0 1.0 0.9 Misc. 0.9 0.8 0.8 0.8 0.9 0.8 0.9 0.9 0.8 Aggregate 1.1 1.0 1.0 0.9 1.1 1.0 1.0 1.0 1.1
Table A.3: India: Sector-wise Bias Index with ASEAN+4 Sectors 1995 1996 1997 1998 1999 2000 2001 2002 2003Agriculture & Allied 1.14 1.20 1.04 0.95 0.99 0.97 1.20 1.18 1.12 Minerals & Mineral Fuels
0.98 0.91 0.87 1.25 1.44 0.46 0.44 1.22 1.40
Chemicals & Plastics
0.82 0.92 0.90 1.18 1.26 1.03 1.10 1.28 1.23
Manufacturers chiefly by Materials
0.62 0.54 0.47 0.49 0.56 0.55 0.62 0.70 0.55
Machinery 0.78 0.77 1.05 0.82 1.40 1.31 1.17 1.19 0.97 Misc. 0.52 0.57 0.65 0.81 0.61 0.94 1.68 1.10 1.92 Aggregate 0.75 0.74 0.69 0.69 0.80 0.75 0.86 0.92 0.88 Table A.4: Efficiency Costs*: Alternative Calculations ASEAN ASEAN+4
India 33 38 China 51 75 Japan 18 42
Korea Rep. 44 58 *% number of Sectors

31
Table A.5*: Overlap of Existing Comparative Advantage: India and China Sl. No HS Code Product
1 030379 Fish nes, frozen, excluding heading No 03.04, livers and roes 2 030799 Molluscs nes,shelld o not&aquatic invert nes,fz,drid,saltd o in brine 3 071390 Leguminous vegetables dried,shelled,whether or not skinnd or split,nes 4 090240 Black tea (fermented) & partly fermented tea in packages exceedg 3 kg 5 100630 Rice, semi-milled or wholly milled, whether or not polished or glazed 6 120220 Ground-nuts shelld,whether or not broken,not roastd or otherwise cookd 7 150810 Ground-nut oil, crude 8 151550 Sesame oil&its fractions whether/not refind,but not chemically modifid 9 250820 Decolourising earths and fuller
10 251400 Slate, whether or not roughly trimmed or merely cut etc 11 282120 Earth colours cntg 70%/more by wght of combind iron evaluatd as Fe2O3 12 290342 Dichlorodifluoromethane 13 290490 Derivs of hydrocarbons cntg mixtures of sulpho,nitro or nitroso groups 14 290611 Menthol 15 292142 Aniline derivatives and their salts 16 292143 Toluidines and their derivatives; salts thereof 17 292221 Aminohydroxynaphthalenesulphonic acids and their salts 18 293319 Heterocyclic compds cntg an unfused pyrazole ring in the structure,nes 19 293626 Vitamin B12 and its derivatives, unmixed 20 293942 Pseudoephedrine (INN) and its salts 21 294190 Antibiotics nes, in bulk 22 320412 Acid and mordant dyes and preparations based thereon 23 320415 Vat dyes and preparations based thereon 24 320417 Synthetic organic pigments and preparations based thereon 25 320641 Ultramarine and preparations based thereon 26 380810 Insecticides, packaged for retail sale or formulated 27 401120 Pneumatic tires new of rubber for buses or lorries 28 401390 Inner tubes of rubber nes 29 401511 Gloves surgical of rubber 30 401691 Floor coverings and mats of rubber exc cellular and hard rubber 31 410429 Bovine and equine leather, tanned or retanned, nes 32 420100 Saddlery and harness for any animal, of any material 33 481610 Paper, carbon or similar copying, nes 34 500600 Silk yarn&yarn spun from wilk waste,put up f retail sale;silk-worm gut 35 500720 Woven fabrics of silk/silk waste,o/t noil silk,85%/more of such fibres 36 500790 Woven fabrics of silk, nes 37 520411 Cotton sewg thread >/=85% by wght of cotton,not put up for retail sale 38 520522 Cotton yarn,>/=85%,single,combed, 714.29 >dtex>/=232.56, not put up 39 520523 Cotton yarn,>/=85%, single, combed, 232.56 >dtex>/=192.31, not put up 40 520541 Cotton yarn,>/=85%, multiple, combed,>/=714.29 dtex, not put up, nes 41 520811 Plain weave cotton fabric,>/=85%, not more than 100 g/m2, unbleached 42 520821 Plain weave cotton fabrics,>/=85%, not more than 100 g/m2, bleached 43 520831 Plain weave cotton fabric,>/=85%, not more than 100 g/m2, dyed 44 520912 Twill weave cotton fabric,>/=85%, more than 200 g/m2, unbleached 45 520921 Plain weave cotton fabric,>/=85%, more than 200 g/m2, bleached 46 520941 Plain weave cotton fabrics,>/=85%, more than 200 g/m2, yarn dyed 47 520959 Woven fabrics of cotton,>/=85%, more than 200 g/m2, printed, nes 48 521122 Twill weave cotton fab,<85% mixd w m-m fib,more than 200 g/m2,bleachd 49 550922 Yarn,>/=85% of polyester staple fibres, multiple, not put up, nes 50 551012 Yarn,>/=85% of artificial staple fibres, multiple, not put up, nes 51 551299 Woven fabrics,containg>/=85% of other synthetic staple fib,o/t unbl/bl
Cont’d….
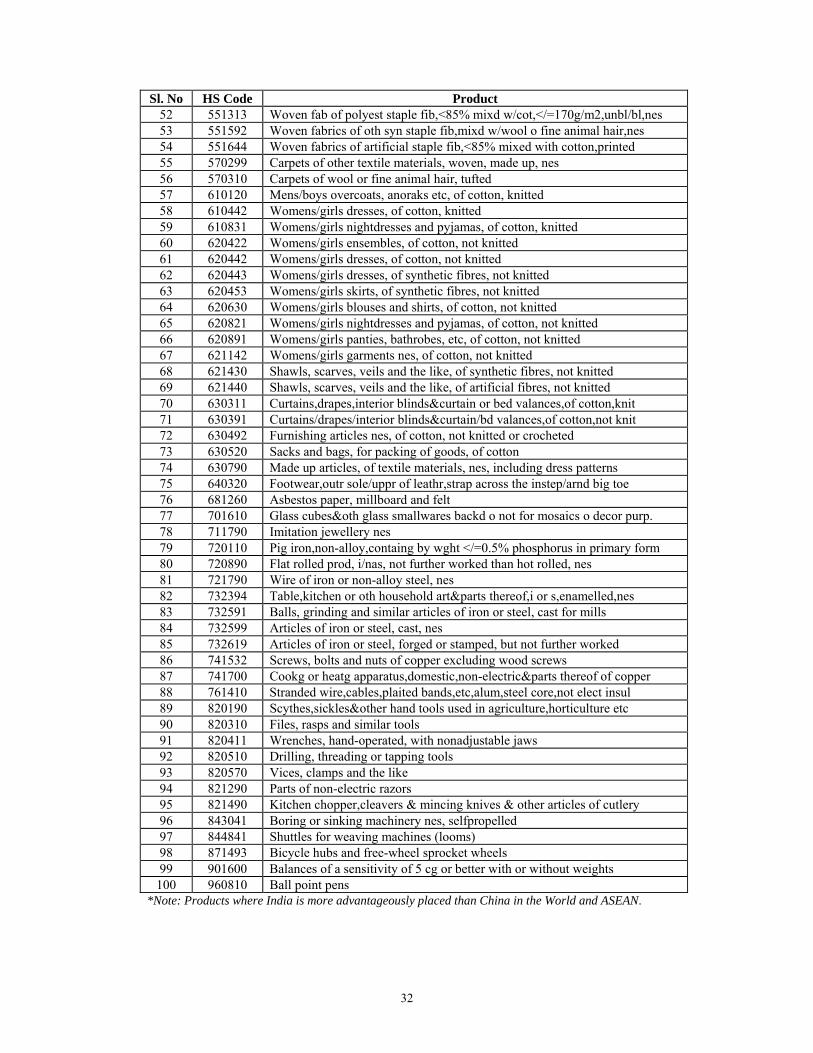
32
Sl. No HS Code Product 52 551313 Woven fab of polyest staple fib,<85% mixd w/cot,</=170g/m2,unbl/bl,nes 53 551592 Woven fabrics of oth syn staple fib,mixd w/wool o fine animal hair,nes 54 551644 Woven fabrics of artificial staple fib,<85% mixed with cotton,printed 55 570299 Carpets of other textile materials, woven, made up, nes 56 570310 Carpets of wool or fine animal hair, tufted 57 610120 Mens/boys overcoats, anoraks etc, of cotton, knitted 58 610442 Womens/girls dresses, of cotton, knitted 59 610831 Womens/girls nightdresses and pyjamas, of cotton, knitted 60 620422 Womens/girls ensembles, of cotton, not knitted 61 620442 Womens/girls dresses, of cotton, not knitted 62 620443 Womens/girls dresses, of synthetic fibres, not knitted 63 620453 Womens/girls skirts, of synthetic fibres, not knitted 64 620630 Womens/girls blouses and shirts, of cotton, not knitted 65 620821 Womens/girls nightdresses and pyjamas, of cotton, not knitted 66 620891 Womens/girls panties, bathrobes, etc, of cotton, not knitted 67 621142 Womens/girls garments nes, of cotton, not knitted 68 621430 Shawls, scarves, veils and the like, of synthetic fibres, not knitted 69 621440 Shawls, scarves, veils and the like, of artificial fibres, not knitted 70 630311 Curtains,drapes,interior blinds&curtain or bed valances,of cotton,knit 71 630391 Curtains/drapes/interior blinds&curtain/bd valances,of cotton,not knit 72 630492 Furnishing articles nes, of cotton, not knitted or crocheted 73 630520 Sacks and bags, for packing of goods, of cotton 74 630790 Made up articles, of textile materials, nes, including dress patterns 75 640320 Footwear,outr sole/uppr of leathr,strap across the instep/arnd big toe 76 681260 Asbestos paper, millboard and felt 77 701610 Glass cubes&oth glass smallwares backd o not for mosaics o decor purp. 78 711790 Imitation jewellery nes 79 720110 Pig iron,non-alloy,containg by wght </=0.5% phosphorus in primary form 80 720890 Flat rolled prod, i/nas, not further worked than hot rolled, nes 81 721790 Wire of iron or non-alloy steel, nes 82 732394 Table,kitchen or oth household art&parts thereof,i or s,enamelled,nes 83 732591 Balls, grinding and similar articles of iron or steel, cast for mills 84 732599 Articles of iron or steel, cast, nes 85 732619 Articles of iron or steel, forged or stamped, but not further worked 86 741532 Screws, bolts and nuts of copper excluding wood screws 87 741700 Cookg or heatg apparatus,domestic,non-electric&parts thereof of copper 88 761410 Stranded wire,cables,plaited bands,etc,alum,steel core,not elect insul 89 820190 Scythes,sickles&other hand tools used in agriculture,horticulture etc 90 820310 Files, rasps and similar tools 91 820411 Wrenches, hand-operated, with nonadjustable jaws 92 820510 Drilling, threading or tapping tools 93 820570 Vices, clamps and the like 94 821290 Parts of non-electric razors 95 821490 Kitchen chopper,cleavers & mincing knives & other articles of cutlery 96 843041 Boring or sinking machinery nes, selfpropelled 97 844841 Shuttles for weaving machines (looms) 98 871493 Bicycle hubs and free-wheel sprocket wheels 99 901600 Balances of a sensitivity of 5 cg or better with or without weights 100 960810 Ball point pens
*Note: Products where India is more advantageously placed than China in the World and ASEAN.

33
LATEST ICRIER'S WORKING PAPERS
NO. TITLE AUTHOR YEAR
185
AN EXAMINATION OF THE RELATIONSHIP BETWEEN HEALTH AND ECONOMIC GROWTH
GARIMA MALIK
SEPTEMBER 2006
184
STRUCTURAL SHIFT IN DEMAND FOR FOOD: PROJECTIONS FOR 2020
SURABHI MITTAL
AUGUST 2006
183
DOMESTIC MARKET INTEGRATION
ARVIND VIRMANI SURABHI MITTAL
JULY 2006
182
INDIA - PAKISTAN TRADE
NISHA TANEJA
JUNE 2006
181 DISCIPLINING VOLUNTARY ENVIRONMENTAL STANDARDS AT THE WTO: AN INDIAN LEGAL VIEWPOINT
SAMIR R. GANDHI JUNE 2006
180 HIGHER EDUCATION IN INDIA : THE NEED FOR CHANGE
PAWAN AGARWAL JUNE 2006
179 HIGHER EDUCATION IN INDIA: SEIZING THE OPPORTUNITY
SANAT KAUL MAY 2006
178 CHINA’S SOCIALIST MARKET ECONOMY: LESSONS OF SUCCESS
ARVIND VIRMANI JAN 2006
177 CURRENT NEGOTIATIONS ON DOMESTIC SUBSIDIES IN AGRICULTURE: IMPLICATIONS FOR INDIA
PARTHAPRATIM PAL
DEC 2005
176 INDIA-ASEAN COOPERATION IN SERVICES: AN OVERVIEW
SUPARNA KARMAKAR
NOV 2005
175 GLOBAL POWER FROM THE 18th TO 21st CENTURY: POWER POTENTIAL (VIP2), STRATEGIC ASSETS & ACTUAL POWER (VIP)
ARVIND VIRMANI NOV 2005
174 TOWARDS DEVELOPING SUBSIDY DISCIPLINES UNDER GATS
RAJEEV AHUJA DEC 2005
34
About ICRIER ICRIER, established in August, 1981, has successfully completed its 25 years, as an autonomous, policy oriented, not-for-profit research institute. We have nurtured our cherished autonomy by establishing an endowment fund, income from which meets all our administration expenses. ICRIER's offices are located in the prime institutional complex of Indian Habitat Centre, New Delhi. The prime focus of all our work is to support India's interface with the global economy. ICRIER's research and related activities are intended to foster improved understanding of policy choices for India in an era of growing international economic integration and interdependence. As one of India's premier think-tank, ICRIER promotes multi disciplinary research at the cutting edge of knowledge domain. ICRIER's mandate also covers regional and bilateral dimensions of India's. ICRIER enables, provides and nurtures a forum where policy makers with responsibilities in economic and political governance; academia representing a diversity of inter-disciplinary talents and corporate leaders from industry and finance; regulatory bodies and civil society regularly interact to discuss and shape the core policy agenda. ICRIER's highly qualified core team of researchers includes several Ph.Ds from reputed Indian and foreign universities. The team is headed by Dr. Rajiv Kumar, D.Phil, Oxford, who is the current Director and Chief Executive. ICRIER's governing body, chaired by Dr. Isher Judge Ahluwalia, reflects a rich diversity of professional background and experience.