the asean economic community into 2025 and beyond · asean integration under the afta and towards...
TRANSCRIPT

1
The ASEAN Economic Community Into 2025 and BeyondRebecca Sta. MariaSenior Policy Fellow, Economic Research Institute for ASEAN and East Asia (ERIA)
Shujiro UrataSenior Research Advisor to the President, ERIA
Ponciano S. Intal, Jr.Senior Economist, ERIA
As the Association of Southeast Asian Nations (ASEAN) turns 50, it is appropriate to reflect on how this diverse group has worked at integrating countries at varying stages of economic development and with different political systems, ethnicities, and cultural backgrounds. Can the steps taken thus far lay the foundations for what may be regarded as a 21st century model for inclusive integration? What are the challenges that ASEAN must address if it is to continue to be a significant player on the global economic stage?
While it has achieved much over the 5 decades, the ASEAN community–building story has its share of critics and fans. Many are encouraged by steps taken to deepen the group’s economic integration. Just as many challenge the notion of the ASEAN Economic Community (AEC) specifically, and the ASEAN Community in general, claiming there is little substance to it beyond political rhetoric. To appreciate the strides made by this regional grouping, one must explore ASEAN’s economic journey from its modest goals of a preferential trade agreement in the 1970s through the establishment of the ASEAN Free Trade Area (AFTA) in the 1990s, the AEC Blueprint 2015, and the AEC Blueprint 2025.
ASEAN’s economic journey reflects the grouping’s step-by-step confidence-building approach towards integration. This served the members well, allowing for domestic adjustments even as it deepened its regional commitments, moving from voluntary liberalisation under the preferential trade agreement, through the rules-based AFTA and services liberalisation under the ASEAN Framework Agreement on Services (AFAS), and laying the foundations for an integrated investment region through the ASEAN Comprehensive Investment Agreement.

2 ASEAN@50 • Volume 5 | The ASEAN Economic Community Into 2025 and Beyond
In 2006, when the proposal to push for the realisation of the AEC by 2015 was mooted, it made economic sense. The region had just come out of a major economic crisis, and initiatives towards the AFTA were well on the way. Only after assessing and being comfortable with the progress achieved under the AFTA did the economic leaders of the grouping take the next big step by bringing forward the timeline for the establishment of the AEC from 2020 to 2015. That was the genesis of the AEC Blueprint 2015 as the guiding framework for economic community–building. The AEC Scorecard was put in place to track the implementation of the AEC Blueprint 2015 measures.
The AEC 2015 was an ambitious attempt at moulding the varied economies towards an entity resembling a community. But ASEAN was also pragmatic in its approach to economic integration. Right at the outset, it was clear that the grouping was not looking to be a customs union. That would evolve with time. Because of the differing economic and political systems, as well as differing levels of economic development, the grouping adopted an ‘open regionalism’ approach. This would mean that regional economic integration would not be a drag on the growth plans of the member states. Rather, they took the ‘rising tide’ stance, a ‘prosper thy neighbour’ attitude, as they addressed the development gaps amongst member states.
To some extent this approach has worked out successfully for the grouping. It has contributed positively to the region’s economic growth and industrial development. There has been substantial elimination of tariffs, significant work on services liberalisation, and some measure of streamlining of investment rules. Much work has also been done on mutual recognition agreements and standards and conformance. The region has undeniably moved ahead and produced commendable outcomes towards the creation of an economic community.
The integrative chapters of Volume 3, entitled ASEAN and Member States: Transformation and Integration, a companion of this volume, elaborate on the commendable outcomes of ASEAN regional integration. As Volume 3 highlights, ASEAN has the highest intra-regional trade share amongst the regional integration areas involving the world’s developing and emerging countries and has a rising share of global trade. Similarly, intra-ASEAN foreign direct investment (FDI) forms the largest share of FDI inflows into ASEAN, while ASEAN’s share to global FDI inflows (especially FDI inflows into the developing world) has risen secularly. Equally important, ASEAN integration under the AFTA and towards the AEC has contributed to the domestic reform process in several member states, while also benefiting from unilateral liberalisation and the domestic reforms undertaken especially under the auspices of the World Trade Organization (WTO).

3The ASEAN Economic Community Into 2025 and Beyond
Even as the grouping worked to deepen intra-ASEAN economic ties, it engaged and expanded economic relations with its dialogue partners through free trade agreements (FTAs) and comprehensive economic partnerships.
As the AEC 2015 measures were being implemented, the grouping took the next step to ensure the continuation of efforts to deepen economic integration. Indeed, the discussion in Volume 3, which echoes the results of previous analyses – especially those undertaken by the Economic Research Institute for ASEAN and East Asia (ERIA) – show there is much to be done to ensure that ASEAN would indeed be a ‘single market and production base that is competitive and globally engaged while at the same time a region of equitable development’. The year 2015 was just another milestone. The AEC Blueprint 2025 – the follow-up to the AEC Blueprint 2015 – aims to complete the unfinished business of the AEC 2015 and further deepen the integration process with new reform and cooperation initiatives consistent with the dynamically changing international environment.
Drawn up in collaboration with the ASEAN business and research communities, the AEC 2025 is expected to have the following characteristics: (i) a highly integrated and cohesive economy; (ii) a competitive, innovative, and dynamic ASEAN; (iii) an ASEAN with enhanced connectivity and deeper sector cooperation; (iv) a resilient, inclusive, people-oriented, and people-centred ASEAN; and (v) a global ASEAN. These key features show the strong continuity with the AEC 2015 while moving forward into 2025.
It needs to be emphasised, however, that only with enhanced synergy amongst the ASEAN blueprints can there be inclusive and dynamic regional integration under the AEC that supports robust community–building within ASEAN. Of special importance are the complementarity of the AEC Blueprint 2025 with the Master Plan on ASEAN Connectivity (MPAC) 2025 and the ASEAN Socio-Cultural Community (ASCC) Blueprint 2025.
The papers and essays in this volume examine several key areas of integration that are of critical interest to the AEC moving into 2025 and beyond. The rest of this integrative chapter weaves the papers together, highlights their key ideas and recommendations, and situates a number of them in terms of the changing international environment. Section 1 presents the results of the ERIA survey of ASEAN people on their aspirations, expectations, and perceived pressing problems into 2025. This is elaborated in Volume 2, Voices of ASEAN: What Does ASEAN Mean to ASEAN Peoples, a companion to this volume. The section also discusses the two key international developments that have a critical bearing on ASEAN’s future. Thus, Section 1 provides the compelling contexts to the measures and initiatives that ASEAN needs to undertake to realise the

4 ASEAN@50 • Volume 5 | The ASEAN Economic Community Into 2025 and Beyond
four key features of the AEC 2025 listed above. Section 2 discusses the key strategies or measures for the AEC into 2025 and beyond, based mainly on the papers and essays in the volume. Section 3 concludes and summarises the key recommendations and presents a possible snapshot of ASEAN by 2025 and 2035.
Framing ASEAN Integration, Domestic Reform, and Economic Transformation Into 2025 and Beyond
ASEAN Economic Community and ASEAN Community–building. As part of the ASEAN@50 project to commemorate the 50th anniversary of ASEAN, ERIA, together with partner institutions in all ASEAN Member States, undertook an internet- and paper-based survey of what ASEAN means to ASEAN peoples. The results of the survey are presented in Volume 2, a companion of this volume. Amongst the questions in the survey are the respondents’ aspirations and expectations for ASEAN by 2025. In addition, they were also asked to list the five most pressing concerns or problems for their countries, as well as for the ASEAN region to be addressed concertedly under ASEAN. More than 2,200 people took part, including students and youth, government and business people, and people from civil society and academe.
The results of the survey are noteworthy (see Chapter 1 of Volume 2). There is a strong aspiration for an ASEAN that is (i) integrated and connected; (ii) resilient, equitable, and sustainable; (iii) characterised by good governance; and (iv) with a significant global and regional presence and contribution.
At the same time, there is a significant gap between aspirations and expectations for 2025. ‘Expectations’ refers to what the respondents expect to happen by 2025; ‘aspirations’ are what they hope will happen by 2025. The gap is narrowest for integrated and connected ASEAN and widest for ASEAN good governance. The gap is also considerable or large for a resilient ASEAN, ASEAN’s global and regional engagement, and an equitable and sustainable ASEAN (Figures 1 to 3). As Figure 1 suggests, ASEAN people strongly aspire to having easy access to goods and services from any ASEAN source, as well as good information and transport connectivity within the region. They are mildly less enthusiastic about easy mobility of skilled workers and professionals within the region. Figures 2 and 3 indicate that nearly four in five respondents also aspire to an ASEAN that is resilient to natural disasters and a significant player on the international and regional stage. Nearly three in four respondents also would like to see good governance with little corruption, less income disparity, and less polluted cities in the region.

5The ASEAN Economic Community Into 2025 and Beyond
Figure 2: ASEAN Governance, Equity, Resilience, and Sustainability (% of respondents who agree with the statement)
Expectations by 2025Aspirations and Hopes by 2025
80
60
40
20
0
100
There is goodgovernance andvery much less
corruption
There is equitableaccess to
opportunities forASEAN peoples
ASEAN major citiesare less pollutedand more livable
than they are today
ASEAN is able toanticipate, respond,
and recover fastertogether from
natural disasters
74
39
73
49
73
44
78
58
ASEAN = Association of Southeast Asian Nations.Source: Intal and Ruddy (2017).
Figure 1: Integrated and Connected ASEAN (% of respondents who agree with the statement)
Expectations by 2025Aspirations and Hopes by 2025
80
60
40
20
0
100
Consumers haveeasy access to
goods and servicesfrom any ASEAN
country
It is easy forskilled workers and
professionalsto find work in othercountries in ASEAN
ASEAN countriesare well connected
through roads,railways, air,and shipping
People andbusinesses can
communicate easilywith one another
through ICT.
8274 76
61
8168
8477
ASEAN = Association of Southeast Asian Nations; ICT = information and communications technology.Source: Intal and Ruddy (2017).

6 ASEAN@50 • Volume 5 | The ASEAN Economic Community Into 2025 and Beyond
Figure 3: ASEAN Global and Regional Engagement (% of respondents agreeing with the statement)
Expectations by 2025Aspirations and Hopes by 2025
80
60
40
20
0
100
79
61
77
ASEAN is a strong voiceand important player in
global negotiations and forums
ASEAN deeply engages powers in theregion and the world (e.g. US, China) to
ensure peace in the region and Asia–Pacific
61
ASEAN = Association of Southeast Asian Nations.Source: Intal and Ruddy (2017).
Figure 4 shows the results on the most pressing problems facing ASEAN and the respondents’ own countries. Note that these are simple averages for the whole region. Although significant differences exist amongst ASEAN Member States in terms of the priority concerns at the national level, there is considerable unanimity amongst the respondents, especially on the top three problems.1 The most pressing problems for ASEAN to address at the regional level were deemed to be corruption; climate change and natural disasters; income disparity and social inequality; trade, investment, and regulatory coherence; and agriculture and food security. The results show that the most pressing national concerns or problems are corruption, income disparity and social inequity, agriculture and food security, unemployment and poverty, infrastructure availability and quality, quality education provision and access, and climate change and natural disasters.
1 For more details, see Chapter 1 of Intal and Ruddy (2017).

7The ASEAN Economic Community Into 2025 and Beyond
Figure 4: Most Pressing Problems in ASEAN and Own Country (% of all respondents)
Faced by CountryFaced by ASEAN
Corruption
Climate change and natural disasters
Income disparity and social inequality
Trade, investment, and regulatory coherence
Agriculture and food security
Poverty
Human rights
Infrastructure availability and quality
Unemployment
0 20 40 60 80 100
Quality education provision and access
47
4629
3639
3522
3233
3027
2818
2729
2431
2329
47
ASEAN = Association of Southeast Asian Nations.Source: Intal and Ruddy (2017).
Figure 4 indicates a significant overlap between the regional and national concerns. Moreover, significant concordance also exists between the areas where there is an aspirations–expectations gap and the common pressing concerns or problems. Noteworthy are the issues of corruption; income disparity and social inequity; and climate change, natural disasters, and resiliency. Also of interest are the issues of poverty and unemployment, which to some extent are also related to the issues of income disparity, social inequity, and agriculture and food security. While the issue of trade, investment, and regulatory coherence is inherently more regional than national, nonetheless, the figure indicates that at least one in five of the respondents see it as one of the five most pressing problems in their own countries.

8 ASEAN@50 • Volume 5 | The ASEAN Economic Community Into 2025 and Beyond
The significant overlap between the pressing regional and national concerns suggests that regionally concerted national actions would give rise to synergy amongst the ASEAN Member States. Thus, for example, member states working together to improve governance and reduce corruption would allow synergies through learning from one another on good practices and the experiences of other member states, and through the beneficial impact on the region’s foreign investment attractiveness from the regionally concerted national programmes and measures against corruption.
At the same time, many of the AEC blueprint measures can significantly address the concerns and expectations gaps raised above. Thus, for example, the implementation of the National Single Window (NSW) demands streamlined procedures, strong and seamless inter-agency coordination, and transparency, and allows for contactless transactions. Therefore, a NSW not only strengthens trade facilitation but is also an anti-corruption measure, given corruption tends to be prevalent in the customs operations of several member states. Similarly, the implementation of a well-performing national trade repository increases transparency, which itself is also an anti-corruption initiative. The AEC Blueprint 2025 includes the adoption and implementation of good regulatory practice (GRP), which is also a powerful tool to reduce corruption.
The figures also suggest that addressing the pressing concerns and the expectations gap calls for synergy amongst the various ASEAN blueprints. As such, there is a need to harness the complementarity of the measures in the AEC Blueprint 2025, the ASEAN Political–Security Community Blueprint 2025, and especially the MPAC Blueprint 2025 and the ASCC Blueprint 2025 to ensure the success of the AEC 2025 for the benefit of the ASEAN people. The salience of ensuring greater complementarity amongst the ASEAN blueprints becomes clearer from the discussion in the next section on the major international developments that would help frame ASEAN integration and domestic reform into 2025 and beyond.
Finally, enhancing the synergy amongst ASEAN Member States and amongst the ASEAN blueprints would bring out and bring forth a critical underpinning of the ASEAN integration effort. The pursuit of the AEC into 2025 and beyond is an essential element of ASEAN community–building. The results of the Voices of ASEAN peoples survey indicate a growing sense of ASEAN belonging and identity. The pursuit of the AEC into 2025 and beyond can be expected to contribute further to, and in turn also benefit from, community–building in ASEAN.

9The ASEAN Economic Community Into 2025 and Beyond
The changing international economic environment into 2025 and beyond. This section discusses the changed international economic environment and elaborates on the framework of enhancing synergy amongst integration, connectivity, cooperation, and domestic reform and institution building.
Brexit and the Trump victory in the United States (US) presidential elections have dominated the international headlines during most of the latter part of 2016 and in 2017. Both reflect popular disaffection about globalisation and integration in the two countries, which hitherto were bastions of global free trade. East Asia, being the beneficiary of the global shift in labour-intensive manufacturing, does not suffer from the Trumpian scepticism; nonetheless, it faces heightened anxieties about the impact of globalisation in the region. Brexit and the Trump victory highlight the issues of inclusivity and the management of adjustment in an increasingly integrated world. They tell us that globalisation and integration, if not managed well, and especially in the light of middle skilled labour–saving technology changes, could result in substantial inequitable outcomes, increased disaffection of a large segment of the population, and a greater call for more populist and inward-looking policies.
At the same time, however, the world has been seeing a tectonic geo-economic and technological change that offers tremendous opportunities to ASEAN from deeper integration and greater engagement with the global economy. For ASEAN, the most important is the tectonic geo-economic shift from the developed economies to the emerging markets – most importantly, China, India, and ASEAN – as the increasingly dominant drivers of global market and economic growth. The graduation of a huge mass of people in the emerging markets to the middle-income and consuming class, resulting in the surge in disposable consumption, offers what McKinsey calls the ‘... biggest growth opportunity in the history of capitalism’ (Atsmon, Child, and Kopka, 2012: 1). ASEAN, being at the geographic centre of the India–ASEAN–China ‘golden arc of opportunity’ – the largest rising consumer market in the world – needs to be well positioned to benefit from the challenges that such opportunity offers.
The future opportunities offered by robustly growing China, India, and ASEAN are large. For example, Atsmon, Child, and Kopka (2012) projected an increase in the number of Chinese households with annual income of US$16,000–US$34,000 from about 14 million in 2010 to about 167 million (representing about 400 million people) in 2020. China’s affluent households earning more than US$34,000 per year would increase from 4.3 million to about 21 million (60 million people) during the same period.

10 ASEAN@50 • Volume 5 | The ASEAN Economic Community Into 2025 and Beyond
This is clearly a huge market. And as China becomes a high-income country, based on the World Bank definition, by about 2030 (OECD Development Centre, 2016), many more Chinese households will be added to the huge consumer market, with tremendous potential implications for expanded trade within the region.
Similarly, the McKinsey Global Institute (2007) projects that India’s middle class (households with an annual income of US$4,380–US$21,890) will increase from 13 million households (50 million people) in 2005 to 128 million households (583 million people) by 2025, making India the world’s fifth-largest consumer market by 2025.
Likewise, ASEAN is already one of the largest economic zones in the world, and its ‘consuming class’, or households with incomes capable of making significant discretionary purchases, is projected to increase from about 67 million in 2010 to about 125 million households by 2025 (Vinayak, Thompson, and Tonby, 2014).
The sheer magnitude of the projected consuming class in China, India, and ASEAN makes developing East Asia the largest source of market growth in the future.
In addition, the world is amid a digital revolution and globalisation where digital technologies and platforms have been reshaping business arrangements, dramatically expanding the market reach of small and medium-sized enterprises (SMEs) globally, enabling increased productivity in various ways, enhancing competition and the pressure for innovation, and expanding the potential for inclusive growth. Such digital dividends are particularly substantial where the ‘analogue complements’ in the form of better regulations, human capital, and good governance are present (World Bank, 2016).
As World Bank President Jim Yong Kim said in his foreword to the World Development Report 2016, we are ‘... in the midst of the greatest information and communication revolution in human history’ (World Bank, 2016, xiii). McKinsey is also heralding the era of ‘digital globalisation’, of a digitally connected global economy where data flows are an increasingly important factor and shaper of globalisation, and not just goods and services. Indeed, global data flows have been exploding in the face of the sharply sluggish global trade in goods and slump in global trade in services since the 2008–2009 Great Recession. The explosion and reach of the digital revolution are astounding: cross-border data flows grew 45 times from the mid-2000s to the mid-2010s, when there were about 1 billion social networking users, 360 million cross-border e-commerce shoppers, and 200 billion e-mail exchanges every day (Manyika et al., 2016).

11The ASEAN Economic Community Into 2025 and Beyond
Digitisation is changing the economics of globalisation. Global digital platforms have been driving down tremendously the cost of international communication and transaction, allowing small firms and entrepreneurs to reach a global market. Thus, with digitisation, globalisation is no longer mainly the preserve of large multinational corporations and banks but is becoming more inclusive. Manyika et al. (2016) point out that Amazon has 2 million third-party sellers, Alibaba has about 10 million SMEs, and Facebook has 50 million SMEs. China’s dominant e-commerce platform, Alibaba, serves more SME exporters than the offline market and sells more products per firm. Firms on Alibaba reach an average of 3 (and a maximum of 98) export destinations instead of 1 (and a maximum of 50) export destination in the offline market. A global survey by McKinsey suggests that the tech-savvy start-ups are preponderantly global in reach with 86% of them having cross-border customers. The tremendous success of Alibaba stems partly from its services, including instant communication between sellers and buyers through an online messaging system, guaranteed in-time delivery of money, verification of sellers for business-to-business transactions, and institution of supplier rating with an on-site quality control by a third-party verification company (Manyika et al., 2016). Arguably, these are critical intermediary and facilitating services for successful international trading in which the average SME would find it very expensive to invest.
The information and communications technology (ICT) revolution and digital globalisation phenomenon are providing tremendous benefits. ICT capital accounted for almost one-fifth of global growth during 1995–2014 (World Bank, 2016). Global data flows accounted for more than one-third of the US$7.8 trillion contribution of the global flows of goods, services, finance, and data to global gross domestic product (GDP) in 2014 (Manyika et al., 2016). Most of the contribution to GDP arises from the efficiency and productivity effects of the use of digital technologies to improve processes and optimise production in traditional sectors. The lower start-up and marginal costs enabled by the digital revolution mean newer firms provide stiffer competition with older firms. This induces innovation, which itself is facilitated by the ease of global flow of information and knowledge due to the digital revolution and globalisation. The digital revolution contributes further to growth through enhanced public participation in governance and improved government processes leading to better governance and greater ease of doing business. These benefits in turn encourage more investment.2
2 See World Bank (2016); Manyika et al. (2016); and McKinsey Global Institute (2007).

12 ASEAN@50 • Volume 5 | The ASEAN Economic Community Into 2025 and Beyond
However, the tremendous potential of the ICT revolution and digital globalisation is captured highly unevenly amongst countries. A few deeply globally connected countries have captured a large share of the benefits. In McKinsey’s Connectedness Index of 2014, which Singapore topped, most of the leading globally connected countries are advanced countries and high-income oil-rich Middle East countries, except for China, which is ranked seventh. Malaysia (20th) and Thailand (22nd) are the third- and fifth-highest-ranking emerging non-oil countries in the index after China (7th), Russia (14th), and Mexico (21st). The other ASEAN countries in the McKinsey Connectedness Index are Viet Nam, ranked 37th; Indonesia, ranked 51st; and the Philippines, ranked 54th (Manyika et al., 2016).
The World Development Report 2016 highlights the importance of the analogue complements in capturing the benefits of the digital revolution and minimising its potential adverse effects. First, access to the internet – the quintessential foundation of digital revolution – is still limited in many areas of the developing world, including in ASEAN. Thus, other things being equal, the potential effects of digital connectivity are skewed in favour of areas with access to the internet. And this could worsen inequality.
Besides differential access to digital technology, the World Development Report 2016 highlights the risks of distortionary and adverse effects of digital technologies amid weak ‘analogue complements’ (World Bank, 2016: 18–24). These include the following:
ɂ The scale economies enabled by the internet and other digital technologies could result in the concentration of economic power if the regulatory environment for competition is weak.
ɂ Slow adoption of digital technologies by non-ICT firms in developing countries can lead to wider productivity differentials amongst firms, with ICT-adoptive and skill-intensive firms having greater probability of export (and import competition) success compared to non-ICT firms.
ɂ Digital technologies can potentially engender a ‘hollowing out’ of the labour market where semi-skilled and skilled workers are adversely affected by automation. This may increase the share of unskilled labour in the labour market unless there is a vigorous skills-upgrading programme. The net result of a weak skills development programme in the face of the digital revolution is a reduction in the share of labour income in the national income.
ɂ If the accountability of government institutions is weak, digital technologies could lead to greater government control rather than greater people empowerment and inclusion.

13The ASEAN Economic Community Into 2025 and Beyond
It is apparent that the digital revolution and globalisation carry both tremendous potential benefits and large potential risks. This juxtaposition of large rewards and large risks is also present in the geo-economic shift towards the India–ASEAN–China golden arc of opportunity. To harness the potential rewards of the arc of opportunity, ASEAN needs to integrate more deeply with China and India. This means that ASEAN economies need to open up more to greater competition from China and India, and China and India need to open up more to ASEAN firms. However, experience of the implementation of the ASEAN–China FTA showed dislocations in some industries and a significant rise in protectionist voices in some ASEAN Member States. Being huge countries and economies, the various provinces of China and states of India have varying comparative advantages as have the different ASEAN Member States. This would result in intense competition amongst industries and firms in a more integrated India–ASEAN–China region.
ASEAN, being at the geographic centre of the India–ASEAN–China golden arc of opportunity and the largest rising consumer market in the world, needs to be well positioned to take on the challenges that such opportunity offers. At the same time, however, the lessons of Brexit and the Trump electoral victory highlight the importance of ensuring that growth is inclusive and that the adjustment to deeper economic engagement with the region and the world in a fast-changing technological and market environment does not lead to unnecessarily large costs to vulnerable groups. In addition, the digital revolution that is reshaping the nature of globalisation can lead to a greater development divide, economic concentration, and inequality if the analogue complements of the digital revolution are inadequate.
Thus, the challenge for ASEAN is to manage the adjustment challenges while seizing the long-run opportunities. Arguably, emphasis on the synergy amongst integration and domestic reform and connectivity and cooperation, together with appropriate adjustment or transition measures and institution building, is the way to frame integration and open regionalism for inclusive growth and economic transformation in ASEAN moving into 2025 and beyond. For ASEAN, this means primarily through the AEC Blueprint 2025, the ASCC Blueprint 2025, and the MPAC Blueprint 2025 at the regional ASEAN level; the Regional Comprehensive Economic Partnership (RCEP), when successfully concluded, at the East Asia level; and the complementary domestic policy and institutional improvements at the national level.
Towards inclusive and dynamic integration in ASEAN. In the face of the dynamic changes in the technology environment, which tend to benefit the more globally connected countries, ASEAN faces the challenge of driving integration within ASEAN and deeper economic links within East Asia to provide more of the benefits to its people

14 ASEAN@50 • Volume 5 | The ASEAN Economic Community Into 2025 and Beyond
while also managing effectively the adjustment challenges as the region becomes more open and integrated. For ASEAN, moving forward to 2025 and beyond, engendering an inclusive, dynamically competitive (and increasingly innovative), and robustly growing region entails enhancing the synergies of integration, connectivity, domestic reform, regional and international cooperation, and institution building.
Inclusive growth is about providing all citizens the opportunity to benefit from economic growth. A highly integrated region must necessarily be deeply connected physically not just across countries but, more importantly, within them. A highly integrated region would need to be institutionally connected as well as more connected in terms of people-to-people interactions across borders. Integration and connectivity can contribute to inclusive growth by (i) bringing the peripheries closer to the growth centres; (ii) engendering a more competitive environment that ultimately is supportive of efficient and adaptable firms, be they large enterprises or SMEs; (iii) allowing consumers the wider choice of goods and services and giving firms a wider choice of inputs; and (iv) providing a larger market and business relationships for firms to grow.
All the potentials indicated above become more of a reality if domestic policy reforms and institution building that are consonant with the drive for integration and connectivity are undertaken. Integration does not only mean liberalised markets but, perhaps more importantly, more effective trade and investment facilitation. In turn, the latter demands better coordination amongst agencies; greater clarity and transparency of rules and regulations; and investment in systems, facilities, infrastructure, institutions, and the people manning them. Such investment in infrastructure, institutions, people, and systems would not only require increased financial resources but may also necessitate a change in people’s mindsets or perspectives arising from such initiatives as the sharing of best practices and experiences and other forms of international cooperation. In short, the end result is better governance, which arguably benefits the small enterprises and entrepreneurs more than the large enterprises. This is because small (and non-rent-seeking) firms and entrepreneurs do not have the political clout and the internal resources to properly and effectively navigate complex regulations and ill-performing institutions.
Integration, connectivity, and good governance are attractive to local and foreign businesses and investors. Improvements in these areas are the best way to enable the economic transformation of the region towards the ultimate goal of developed country status. As most ASEAN Member States are still well behind the technology frontier, investments and participation in global and regional production networks bring with them knowledge, people expertise, management and institutional practices, market and

15The ASEAN Economic Community Into 2025 and Beyond
input links, and process innovations that would enable firms and countries to catch up to the frontier. In tandem with these improvements are investments in human capital, especially training and education in the technical and engineering fields, which would enhance the environment for accelerated technology transfer, adaptation, and even innovation. Linking SMEs and entrepreneurs to the industrial and service clusters and production networks locally, regionally, and globally would result in even more inclusive and dynamic economies in the region. This is the dynamic and innovative ASEAN that can feasibly be aimed for in the near and medium term. At the same time, the foundations and urban amenities need to be deepened in the near and medium term for stronger innovation systems geared towards greater product innovation in the medium and long term.
Arguably, the pursuit of the AEC is the embodiment of the drive towards inclusive and dynamic regional economic integration. This is implied by the key features of the AEC Blueprint 2025 noted above that aim for a highly integrated, competitive, dynamic, innovative, inclusive, people-centred, and global ASEAN. Section 2 of this chapter focuses on key measures towards these aims, summarising and drawing from the papers and essays in the volume. They bring out the significant opportunities and challenges of deeper integration in ASEAN. The section also highlights the importance of harnessing the complementarity of the measures in the ASEAN blueprints, especially AEC 2025, MPAC 2025, and ASCC 2025. Enhancing their synergies entails not only keener appreciation of their complementarity but also greater concern for more coordinated implementation of the measures. In as much as the regional measures are ultimately implemented at the national level, the coherence of the regional measures with other domestic measures and policies as well as with the institution and capacity building strategy in each member state is vital for implementation.
Thus, whether the ASEAN blueprints deliver well for the ASEAN citizenry ultimately depends on the quality of implementation of the ASEAN measures and the complementary domestic measures (and to a small extent, the degree of regional and international cooperation measures) in support of the domestic reforms and capacity and institution building, especially in the poorer and more capacity-challenged member states.

16 ASEAN@50 • Volume 5 | The ASEAN Economic Community Into 2025 and Beyond
Towards Dynamic and Inclusive Integration: Deepening the ASEAN Economic Community Into 2025 and Beyond
This section discusses several key or strategic areas that are central to the drive towards an integrated, connected, dynamic, equitable, and global ASEAN into 2025 and beyond. They include non-tariff measures (NTMs), trade facilitation, services development, GRP, connectivity and production networks, and RCEP, which exemplifies ASEAN’s role in the wider regional and global community.
Non-tariff measures. Ing and Cadot’s paper in this volume shows that whereas intra-regional tariffs within ASEAN have declined to near-zero on average (and indeed, are already zero for all but a few exceptions in the older ASEAN 6 countries3) since 2010, the incidence of NTMs has increased during the same period. ASEAN officials have been concerned about this rising trend in the region.
NTMs are, in general, policy measures other than tariffs that can affect international trade. Most NTMs cover sanitary and phytosanitary (SPS) regulations and technical barriers to trade (TBT) regulations. However, they also include a diverse array of policy interventions affecting trade flows and prices such as licensing, price-control measures, and distribution restrictions. NTMs preponderantly have non-trade policy objectives, such as food safety or environmental protection. Arguably, the rising number of NTMs reflects in large part the growing concerns about product quality, safety, and environmental protection as per capita incomes rise. Indeed, the ERIA–United Nations Conference on Trade and Development (UNCTAD) project on NTMs headed by Ing and Cadot shows that the increase in the incidence of NTMs was even faster amongst the ASEAN+6 partners4 than amongst member states themselves during 2000–2015.
It must be emphasised that businesses need to adjust to the changing societal demands as reflected in the rising incidence of NTMs. As Ing and Cadot highlight in their paper in this volume, such costs could result from concomitant changes in the sourcing of inputs, adjustments in production processes, and even the costs of ensuring enforcement, especially in supply chains, to meet NTM requirements. The policy challenge for ASEAN is that although pursuing legitimate, non-trade objectives, NTMs can also be used as instruments of commercial policy in a restrictive or distortionary manner. This is especially because NTMs are more opaque and complex than tariffs, and
3 The older ASEAN 6 countries are Brunei Darussalam, Indonesia, Malaysia, the Philippines, Singapore, and Thailand.4 The ASEAN+6 dialogue partners are Australia, China, India, Japan, the Republic of Korea, and New Zealand.

17The ASEAN Economic Community Into 2025 and Beyond
thereby difficult to determine ex ante their potential negative or distortionary effect on international trade. The proliferation of NTMs in the face of essentially zero tariff rates may end up substituting a more transparent measure with an opaque one that has little or even negative trade gains. Not surprisingly, ASEAN trade officials have become increasingly concerned about NTMs in the region.
One challenge faced by ASEAN regarding NTMs is transparency, which depends on having accurate data and open dissemination. Towards this end, ERIA, in collaboration with UNCTAD and the World Bank, undertook an exhaustive and consistent NTM data collection project in 2015 that has produced data for all 10 ASEAN Member States. The data gathering took the form of national inventories of all NTMs and all products covered by each NTM at the most detailed level following the latest internationally accepted classification scheme. This collaborative project, which started with ASEAN, has been extended to the +6 dialogue partners of ASEAN involved in the ongoing RCEP negotiations. The ERIA–UNCTAD NTM project is a significant contribution towards the implementation of one of the key action lines on NTMs in the AEC Blueprint 2025 stocktaking and updating the ASEAN NTM database and incorporating it into the ASEAN Trade Repository and the National Trade Repository.
Nonetheless, a mechanism needs to be set up to ensure the continuous updating and dissemination of information. The key problem faced by past efforts to promote transparency, whether at the regional or multilateral level, has been incentives, as countries typically do not want to expose themselves to criticism for excessive – and possibly protectionist-minded – regulatory activism. With no ‘sticks’ readily available, the approach Ing and Cadot suggest is that of a ‘beauty contest’ where the ASEAN Secretariat ranks member countries by their transparency. However, ASEAN is uncomfortable with beauty contests. The challenge is whether strengthened monitoring by the ASEAN Secretariat as mandated in the AEC blueprint would be implemented and succeed.
In addition to transparency, streamlining NTMs and preventing unnecessary trade facilitation costs from their use is the ultimate policy concern. Trade negotiations in several regional integration arrangements in the developing world have largely failed. Ing and Cadot propose to view NTM streamlining from the perspective of regulatory improvement because many NTMs in the developing world are designed and implemented in a fragmentary manner and their coherence with other NTMs is often poorly thought through. Thus, Ing and Cadot propose something like a national NTM committee to promote greater coordination and internal consistency in the design and implementation of NTMs.

18 ASEAN@50 • Volume 5 | The ASEAN Economic Community Into 2025 and Beyond
Moreover, if country-level streamlining is ASEAN-wide, the NTM committees or concerned regulatory–supervision bodies created in all 10 ASEAN Member States could share staff training (with assistance from the ASEAN Secretariat and development partners), leading to soft regulatory convergence based on shared review methods and concepts. This would facilitate regulatory cooperation between member states at the technical level. Technical staff could then share information and resolve issues below the media–political radar before these become friction points. As Ing and Cadot highlight, such informal technical cooperation was the hallmark of Franco–German cooperation in the early days of European integration and proved a powerful engine of convergence and reduction of friction. Such a mechanism is lacking in ASEAN and could be particularly beneficial given the relative lack of political drive for integration compared to that in post-war Europe. Complicated processes for certifications to export can be expected to hurt SMEs more than large enterprises. Hence, streamlined procedures to meet NTM requirements are an important consideration for regulatory improvement at the national level.
The AEC 2025 Consolidated Strategic Action Plan (CSAP) emphasises the need to minimise the trade protection impacts and compliance costs of NTMs by stocktaking and updating the NTM database and ensuring it is incorporated in the ASEAN Trade Repository and National Trade Repository. It also stresses strengthening engagement with business and other stakeholders on NTMs, and exploring stronger discipline in the ASEAN Trade in Goods Agreement. Because many NTMs relate to SPS measures and TBT, the CSAP also aims to coordinate all SPS-related activities and facilitate consultations to address problems related to the implementation of SPS measures. In addition, ASEAN has been strengthening and expanding its initiatives on standards, technical regulations, and conformity assessment procedures, a critical means of addressing TBTs. Finally, ASEAN has established the ASEAN Solutions for Investments, Services and Trade, an internet-based facility for receiving and responding to complaints by ASEAN-based firms. However, the private sector has barely used this facility.
There is tremendous overlap and complementarity between the AEC 2025 measures and the regulatory improvement perspective to addressing NTMs. In addressing the trade protection and compliance costs of NTMs, many standards, technical regulations, conformity assessment procedures, and SPSs can be considered within the ambit of regulatory cooperation, and the design and implementation of NTMs can follow GRP principles. The issue of GRP and international regulatory cooperation and the application of the concept of regulatory distance on NTMs as well as the role of international regulatory cooperation as a means of reducing regulatory distance to reduce trade cost are discussed further in a subsequent subsection on GRP, regulatory management, and international regulatory cooperation.

19The ASEAN Economic Community Into 2025 and Beyond
Customs and other trade facilitation measures. The ASEAN Trade Facilitation Framework covers NTMs, customs and transport facilitation, standards and conformance, transparency of trade regulations and procedures, and private sector engagement and business facilitation (Sudjana, 2016). Thus, the discussion above on NTMs falls under the broad scope of trade facilitation in ASEAN. Nonetheless, at the core of this broad trade facilitation framework are customs and export-, import-, and transit-related permitting and control processes, including rules of origin (ROO), which cover the narrow definition of trade facilitation.
The results of a 2011 ERIA survey on private sector concerns in ASEAN to be addressed by AEC measures by 2015 point to trade facilitation issues as their top priorities, specifically with respect to streamlined import–export processes and improved customs efficiency and integrity through greater use of ICT and linked clearance systems as in a single window (Intal, Narjoko, and Simorangkir, 2011). The foreign business sector in ASEAN, such as American and Japanese companies, has also raised the difficulties of importing and exporting in the region as key concerns in relation to doing business in ASEAN. Improvements in the indicators of doing business by the World Bank suggest improvements in the trading environment in the region. However, seamless trading in the region remains a significant challenge. The nature of modern manufacturing production networks, with their reliance on the fast back-and-forth flows of parts, components, and final assemblies for the region and the world, demands seamless movement of goods in the region if ASEAN is to compete with large countries such as China and India as a production base.
ASEAN is deeply cognizant of the critical importance of trade facilitation measures for seamless trading within ASEAN. The AEC Blueprint 2025 explicitly aims for ASEAN Member States to move closer to global best practice in trade facilitation. Amongst the key measures under the AEC 2025 Strategic Action Plan are the full operationalisation of the ASEAN Single Window (ASW) (and therefore also of NSWs) and the national trade repositories and ASEAN Trade Repository, in addition to continuing cooperation in customs modernisation amongst all ASEAN Member States. Well-performing NSWs address several concerns of the private sector. They include streamlined procedures in customs and permit-granting agencies, more effective inter-agency coordination, more harmonised data, paperless trading, and eventually more integrated risk management systems across (at least) key agencies involved in the import and export process. At present, not all ASEAN Member States have fully operational NSWs. The ASW has been successfully piloted with respect to the electronic exchange of the e-Form D (the certificate of origin) between five member states, with live exchange of the e-Form D amongst three member states using the ASW-enabling architecture. Clearly, much more is to be done to ensure all 10 ASEAN Member

20 ASEAN@50 • Volume 5 | The ASEAN Economic Community Into 2025 and Beyond
States are involved in the ASW, including the ratification of the Protocol on the Legal Framework to Implement the ASW by all 10 member states. Equally important, during the 18 September 2012 symposium on the ASW and NSW in Jakarta, the private sector emphasised the importance of ASEAN Member States and their concerned agencies building their capacity for paperless cargo clearance as well as harmonised processes for interoperability and coherence between the NSWs and ASW.5 Thus, implementation is the key challenge towards full operationalisation of the NSWs and the ASW.
ASEAN has been undertaking other important trade facilitation initiatives. The ASEAN Customs Transit System Pilot Project amongst Malaysia, Singapore, and Thailand has been started. If successful, it will be rolled out to other ASEAN Member States. The ASEAN Customs Transit System is ASEAN’s centrepiece mechanism for a more seamless transit trade within the region. There is a significant cooperation programme amongst ASEAN customs authorities in the development of best practice documents for ASEAN in such customs-related areas as advance rulings on tariff classification, post-clearance audit, and strategic management.
With respect to ROO, the AEC 2025 Strategic Action Plan aims to enhance ROO and simplify the certification procedures of origin determination, including the realisation of an ASEAN-wide self-certification system. In their paper in this volume, Ing and Cadot find that, despite the apparent simplicity of ASEAN’s ROO, the average ad valorem equivalent of ROO is still significant at 3.4%, or about one-quarter of ASEAN’s most-favoured-nation tariffs. Equally important, the authors find that the ad valorem equivalents for the lower-skilled and more labour-intensive goods, such as textiles and garments and leather and leather products, are at least two to nearly three times the average for all products. It is in these labour-intensive goods that SMEs can potentially become exporters. However, the high ad valorem equivalents are likely to be important hindrances to SME exports to the rest of the region. The high ad valorem equivalents of ROO for products in which SMEs are more dominant may call for the exploration of mechanisms where self-certification schemes would benefit SMEs, perhaps by providing support to integrator-exporters of SMEs to be self-certified with appropriate controls along the SMEs supply chain.
Moving from the narrow definition of trade facilitation to the broad definition, ASEAN includes standards, conformance, and transport facilitation in addition to addressing NTMs as part of the trade facilitation framework. Standards and conformance are important considerations in trade facilitation because the procedures for conformance
5 Symposium on the ASW and NSW, 18 September 2012 (Borobodur Hotel, Jakarta), ‘Session 4 Summary of Discussions and Recommendations’.

21The ASEAN Economic Community Into 2025 and Beyond
with SPS or TBT requirements, if inefficient, can lead to large trade facilitation costs to exporters. Indeed, studies find that SME exporters in developing countries sometimes find it difficult to meet the conformity assessment requirements because of lack or inadequacy of internationally recognised quality infrastructure in their countries, which is constrained by the difficulty of getting foreign accreditation and establishing internationally recognised accreditation bodies, amongst other issues (ADB and UNESCAP, 2009).
Addressing TBTs was one of the earliest important initiatives of ASEAN. It began with the establishment of the ASEAN Consultative Committee for Standards and Quality in 1992 and its efforts to set frameworks, principles, and guidelines in consonance with the disciplines of the WTO TBT and SPS agreements; develop mutual recognition arrangements; and start harmonising regional standards with international ones. Within ASEAN, harmonised technical regulations, mutual recognition agreements on conformity assessments, and harmonising with international standards can be expected to reduce trade costs because standards and technical requirements are fewer and multiple testing and assessment are not needed. ASEAN’s efforts focused on several priority sectors although there have been significant difficulties in the implementation of the initiatives such as the Cosmetics Directive. The AEC 2025 Strategic Action Plan includes the development of generic guidelines to establish harmonised regulatory regimes (which can in principle expand the current sector coverage) and the strengthening of the regional rapid alert and market surveillance systems in member states. However, a substantial share of private sector concerns do not involve exporting to other ASEAN countries but to non-ASEAN countries, especially developed countries. Here, ASEAN Member States can clearly help their exporters by investing in better-quality national infrastructure, including internationally recognised testing and certification institutions, such as Malaysia’s Standards and Industrial Research Institute, and by streamlining procedures to obtain certifications. The electronic certification system for agricultural products in New Zealand may be too distant a goal for most ASEAN Member States at present (ADB and UNESCAP, 2009). Nonetheless, it highlights the potential for a more efficient, trusted, and effective certification system that would be the essence of a trade facilitative yet secure and credible standards and conformance system for ASEAN.
Transport facilitation is the other component of the broad ASEAN Trade Facilitation Framework. This has become more pressing because of the nature of production networks, especially in manufactures where competitiveness of firms draws in part on the quick and predictable flow of parts and components from both domestic and cross-border sources. To this end, ASEAN has forged several agreements with associated protocols. Most have entered into force, although some have yet to be fully

22 ASEAN@50 • Volume 5 | The ASEAN Economic Community Into 2025 and Beyond
implemented by all member states. For land transport, the agreements are the ASEAN Framework Agreement on the Facilitation of Goods in Transit, the ASEAN Framework on the Facilitation of Inter-State Transport, and the ASEAN Framework Agreement on Multimodal Transport. Of interest is the ratification of Protocols 2 and 7 of the ASEAN Framework Agreement on the Facilitation of Goods in Transit. These protocols are important for the full implementation of the ASEAN Customs Transit System for transit trade in ASEAN, which is undergoing pilot testing. ASEAN is also moving towards the conclusion of the ASEAN Framework Agreement on the Facilitation of Cross Border Transport Passenger by Road Vehicles. The importance of the agreements can be gleaned from the results of the 2008 JETRO logistics study of trucking in ASEAN, which shows the substantial costs involved in cross-border container handling and unloading for customs clearance at the border (Intal et al., 2014). For air transport, ASEAN has three important agreements, each with their respective protocol: the Multilateral Agreement on Air Services, the Multilateral Agreement on the Full Liberalisation of Passenger Air Services, and the Multilateral Agreement on the Full Liberalisation of Air Freight Services. All are in force. Note that all of them involve greater liberalisation aiming towards open skies in ASEAN, thereby allowing for greater responsiveness to the demands of the changing flow of goods and people in the region.
ASEAN aims to reduce trade transactions costs by 10% by 2020. The setting of a quantitative target for trade facilitation is noteworthy because it is the first time ASEAN has done this for trade facilitation. It also means that ASEAN looks at the various factors affecting the trade facilitation environment comprehensively. Indeed, the ASEAN Trade Facilitation Joint Consultative Committee is developing a Trade Facilitation Strategic Action Plan that consolidates the strategic measures of the various sector plans that contribute to trade facilitation. These include customs standards and conformance, transport facilitation, and the additional value added from the trade facilitation group itself.
The setting of a quantitative target for trade facilitation necessarily calls for an indicator system that quantifies various facets of the trade facilitation environment and the implementation of key initiatives and measures of the ASEAN trade facilitation agenda. As ASEAN played an important role in the conclusion of the WTO Trade Facilitation Agreement in 2013, not surprisingly, the AEC Blueprint 2025 includes a general statement ensuring the smooth implementation of this agreement amongst ASEAN Member States, and indeed for ASEAN Member States to move closer to global best practice. The WTO Trade Facilitation Agreement covers a wide range of measures for a much more efficient and effective trade facilitation environment. Thus, it appears logical that the ASEAN Trade Facilitation Indicator System would need to draw significantly on the key measures in the WTO Trade Facilitation Agreement that are adapted to the

23The ASEAN Economic Community Into 2025 and Beyond
ASEAN context and are appropriately calibrated to allow the measurement of progress towards the global best practice aimed for in the AEC Blueprint 2025. In addition, the indicator system would need to embed and/or clearly link up with the measures of implementation of the significant initiatives and measures in the ASEAN Trade Facilitation Strategic Action Plan.
Given some independent estimates of trade transactions costs between ASEAN Member States, such as World Bank estimates of the time to export and import, or trade costs estimates of the World Bank–United Nations Economic and Social Commission for Asia and the Pacific, the quantitative relationship between trade facilitation costs and the various elements of the ASEAN Trade Facilitation Indicator System, including indicators of the performance of the key measures in the ASEAN Trade Facilitation Strategic Action Plan, can be established by the target year 2020. The ASEAN Seamless Trade Facilitation Indicators is currently being developed under the ASEAN Trade Facilitation Joint Consultative Committee and is expected to be a deliverable when the Philippines chairs ASEAN in 2017.
Services development and liberalisation. ASEAN Member States are significant players regionally and/or globally in several services. ASEAN as a group is a formidable tourism destination regionally and even globally. China, Hong Kong, Macau, Malaysia, and Thailand receive the largest number of tourists in East Asia, while Bali and Siem Reap are acknowledged to be amongst the top global tourist destinations. Singapore is a global player in finance and a top location for regional headquarters. The Philippines vies with India for the position of top global business process outsourcing location. ASEAN is also becoming known for health tourism, especially Malaysia, Singapore, and Thailand.
The list indicates that ASEAN is well positioned to benefit from a services revolution, in the same way that ASEAN has been a substantial player in the so-called ‘second unbundling’ characterised primarily by regional and global manufacturing production networks. Indeed, the dating of the start of the second unbundling from the last half of the 1980s coincides with ASEAN’s ‘golden decade’ of very high economic growth and a sharp rise in the export of manufactured goods.
The services revolution concerns the dramatic growth of tradable services facilitated by the digital revolution and globalisation and complemented by the rising share of the service component in manufacturing, in part as a quality and brand differentiator and especially for multinationals. In addition, demand for many services has medium to high income elasticity, which means that the demand for services will increase markedly as per capita incomes rise. Indeed, the surge of outbound tourism in China,

24 ASEAN@50 • Volume 5 | The ASEAN Economic Community Into 2025 and Beyond
for example, reflects the income elasticity of demand for travel in China. This has already made China the global leader in outbound tourism expenditures by a large margin and has contributed substantially to the tourism booms in most of ASEAN. Similarly, Koudal (2006) found that the share of services in total sales revenues of the global manufacturing firms surveyed averaged 25%, with about one-fifth of firms reporting a services share of more than 50%.
Richard Baldwin (2017), populariser of the concept of the second unbundling, points to what may be termed as the ‘third unbundling’ that characterises the new globalisation. The third unbundling would be ushered in by advanced communications technology, such as machine translation, telepresence, and artificial intelligence, which would not necessarily require a labour service provider to be physically near the client. Baldwin highlights that the second unbundling is essentially the offshoring of knowledge (or ‘globalisation as knowledge arbitrage’) made profitable by ICT and the vast differences in wages across countries and manifested in the form of geographically dispersed manufacturing production chain or networks. In contrast, he sees the emerging third unbundling as ‘globalisation as arbitrage of labour services’. In a sense, this entails a deepening and widening of tradable services from the current offshored business process management and information technology services, health information management, knowledge processing services (e.g. legal, research, and engineering), and other related modern services that current ICT infrastructure has engendered in countries such as India and the Philippines. The third unbundling is thus akin to ‘services globalisation’, which is very different from the earlier view of services as non-tradable and non-scalable globally.
The discussion suggests there may be a need to reframe services sector development, facilitation, liberalisation, and integration in ASEAN. Already, as Christopher Findlay shows in his essay in this volume, by 2015, eight ASEAN Member States had a services share in GDP exceeding 40%, in three countries the share was over 50%, and in Singapore it was above 70%. The increase in the share of the services sector to GDP during 2000–2015 was especially significant in the Philippines and Singapore and to a lesser extent Indonesia, the Lao PDR, Malaysia, and Viet Nam. As the dominant sector in most ASEAN economies, robust growth of services is an important driver of overall economic growth. The tourism boom in most of ASEAN and the business process outsourcing boom in the Philippines show this very well. Findlay adds another important channel of robust services growth as impacting on overall economic growth: productivity. In contrast to the productivity pessimism on services in the early economic literature, Findlay presents several channels where services sector productivity can be large and shows that service productivity growth contributes to productivity growth in other economic sectors such as manufacturing. The discussion in the early part of the section

25The ASEAN Economic Community Into 2025 and Beyond
points to the substantial transformative and growth potential of technological advances on the services sector and the whole economy, showing clearly that services will be a key growth driver for many years to come.
Reframing services sector development, facilitation, liberalisation, and integration to better capture the benefits of the services revolution involves several important dimensions highlighted by Findlay. The first is to embed the mindset that exporters are importers. This is especially the case where global or regional value chains in services are involved, similar to production networks in goods especially manufacturing. The second related dimension is that access to skilled labour is important for the emergence of specialist service providers and the growth of competitive service niches. Until advanced technologies make non-face-to-face interactions price competitive and accessible, face-to-face interaction will remain important in the production of the (unique) service. This is because there is a significant element of simultaneity in the production and consumption of many services given that, unlike goods, most services cannot be stored.
The two above-mentioned dimensions necessarily involve greater liberalisation of services and of movement of people. ASEAN has a liberalisation agenda in services and movement of natural persons under the ASEAN Framework Agreement on Services. However, as the analysis in Volume 3 shows, a few member states face substantial challenges in the liberalisation of services under AFAS 9, and the region faces tremendous difficulties in pushing towards the last instalment of the AFAS process – AFAS 10. The great difficulty in moving into the last negotiation stage of AFAS 10 reflects the fact that many of the politically sensitive decisions made and the flexibilities introduced in the eighth and ninth AFAS packages complicate the AFAS 10 negotiations.
Framing service liberalisation from the perspective of the demands of the new services revolution and globalisation, as described above, would provide the impetus for a change in the mindset of people and policymakers towards a much greater openness to liberalisation and enhanced competition in services provision and the movement of natural persons.
Thus, Findlay stresses that for ASEAN to grow its services sector it must lower barriers to trade and investment and reduce restrictions on competition in domestic markets. He shares evidence that (i) higher degrees of restrictiveness are associated with poorer performance in services, (ii) decreasing services trade restrictiveness would also have a positive indirect impact on the manufacturing sectors that use services as intermediate inputs in production, and (iii) there is value in focusing on institutional quality when designing a strategy for the sector.

26 ASEAN@50 • Volume 5 | The ASEAN Economic Community Into 2025 and Beyond
Two other dimensions are related to access to quality infrastructure and the need for aggressive investment in human capital, including retraining. Both dimensions, if lacking, could lead to significantly unequal outcomes of the services revolution on people. As indicated by the World Bank (2016), the benefits of the ICT and digital revolution accrued to the countries (and, likely, firms) that are most globally connected. Also, firms without access to quality services infrastructure could be hurt by lower productivity compared to firms with access to quality infrastructure. On both counts, service liberalisation and integration could lead to more unequal outcomes.
The need for aggressive investment in human capital is also critical because the faster-growing modern services require much more skilled labour (e.g. college graduates) than other services. Hence, a labour force without sufficient skills would not benefit from the higher wages and salaries associated with the modern services sector. Greater income inequality could result unless semi-skilled workers can find remunerative jobs in the semi-skilled labour-intensive industries in other sectors such as manufacturing. This suggests that, for income equality purposes, encouraging manufacturing is an important complement to encouraging growth in the services sector, especially the modern services sector.
Finally, the services revolution and globalisation arising from the ICT revolution and the third unbundling suggest that cooperation in the certification of skills, including specialist skills, and possibly in encouraging the provision of specialist training would be an important regional services facilitation initiative. This goes beyond the ASEAN Qualifications Reference Framework. It may also involve the need to liberalise the education sector, or at least human resources training. This would enable the region to have an ample supply of skills needed in the much more liberalised services and labour markets arising from the improving ICT and emerging advanced communication technologies.
Finance, integration, and contagion. ASEAN has an extensive set of initiatives and measures that aim to strengthen financial links within the region, the foundations for financial and macroeconomic stability, and financial inclusion. The ASEAN Financial Integration Framework focuses on banking (with its ASEAN Banking Integration Framework); insurance (with its ASEAN Insurance Integration Framework); and capital market development with initiatives on the ASEAN Trading Unit, ASEAN Disclosure Standards, ASEAN Corporate Governance Scorecard, and Bond Market Development. The banking, insurance, and capital market development initiatives are to be underpinned by a payment and settlement system that fosters interoperability and efficiency in cross-border payments and is facilitated by adherence to principles of transparency. ASEAN also has a policy dialogue process on capital flows and

27The ASEAN Economic Community Into 2025 and Beyond
safeguard mechanisms for capital account liberalisation. Capacity building and a programmed liberalisation of financial services under AFAS complete a well-rounded and comprehensive set of financial integration initiatives and measures that are expected to support economic growth, improve savings and investment, and promote financial inclusion in the ASEAN region. The AEC 2025 CSAP contains a remarkably lengthy set of measures for financial integration for 2016–2025.6
Several characteristics of the ASEAN financial integration programme are worth mentioning. First, it deeply takes into account the significant difference in the readiness of the institutional and finance sectors of two groups of countries in ASEAN: the more financially developed ‘IMPST’ group of countries (Indonesia, Malaysia, the Philippines, Singapore, and Thailand) and the less financially developed ‘BCLMV’ countries (Brunei, Cambodia, the Lao PDR, Myanmar, and Viet Nam). Second, it relies a lot on the ‘ASEAN – x’ principle which allows the ready, the willing, and frontrunners to move ahead with initiatives and the rest to catch up in the future. Third, there is a strong element of joint learning and exchange of knowledge and experience, which to a large extent flows directly from the first two characteristics. Lastly and most importantly, it is a cautious, gradual, and measured programme, which is arguably appropriate in the light of financial vulnerabilities in several member states and the recent turbulent experience of the eurozone, with its near-total financial integration.
Financial integration is a balancing act between benefits and risks. The benefits are potentially large. For example, a more financially integrated, well-regulated, and stronger finance sector in ASEAN that is linked well with the finance sectors of China, Japan, and the Republic of Korea has the potential to become a more important intermediary between the large savers of Northeast Asia, Malaysia, Singapore, and several investment-hungry ASEAN countries. This is especially the case in infrastructure, which demands longer-term tenor of loans and financial instruments. Gochoco–Bautista and Remolona, in their essay in this volume, also state the benefits of ASEAN banking integration in terms of greater efficiency (through economies of scale, network externalities, and greater competition from the entry of foreign banks); possible lower costs and greater diversity of services offered; and more opportunities for risk sharing. A deep financial and capital market also increases the resiliency of the region’s economies to external shocks. All of these support investment, trade, and growth as well as financial inclusion.
6 See ASEAN Senior Level Committee for Financial Integration (2015).

28 ASEAN@50 • Volume 5 | The ASEAN Economic Community Into 2025 and Beyond
On the other hand, financial integration raises the risk of contagion. Of interest is the regional concentration of cross-border banking activity, which Gochoco–Bautista and Remolona identify as a major contagion factor during the Asian Financial Crisis of 1997–1998. The Gochoco–Bautista and Remolona essay in this volume focuses on these contagion risk factors. In the case of the Asian Financial Crisis, Japanese banks dramatically reduced their exposure to Asia because they were substantially hit by the crisis. In contrast, the European banks, which were less hard hit by the crisis, continued to lend to Asia. The Japanese case illustrates the ‘common lender’ effect – due to adverse effects on the balance sheet of the creditor bank, the creditor bank would reduce its exposure in other countries to restore capital adequacy ratios, meet margin calls, and the like. As a result, other countries become adversely affected or swamped by the crisis as well. The other related contagion risk factor is the ‘wake-up call’ effect where a crisis leads to a general rise in risk aversion (or at least an entire asset class), leading to withdrawal of a creditor bank even from hitherto unaffected countries, but in the process causing greater financial instability or even crisis in those countries.
The ASEAN financial integration agenda can be expected to result in qualified ASEAN banks doing more cross-border banking transactions within ASEAN. In effect, it would encourage greater concentration of their lending exposures in ASEAN, which, other things being equal, increases the common lender risk. Nonetheless, it is worth noting from the Gochoco–Bautista and Remolona essay that no ASEAN bank is a global systemically important bank. Within East Asia, all global systemically important banks are Chinese or Japanese. This brings to the fore that just as ASEAN aims to strengthen its finance sector under the ASEAN financial integration agenda, ASEAN is greatly affected by global and extra-ASEAN events and factors, such as the global financial cycle and the risk profile of East Asia’s global and regional systemically important banks. The Gochoco–Bautista and Remolona essay points to some areas of concern, including the growing concentration of the lending portfolio of the global systemically important banks on China and other emerging countries, the very high share of short-term loans, and the preponderance of loans in foreign currency (US dollars) in the loan portfolio of these banks.
What the Gochoco–Bautista and Remolona essay ultimately brings out is that the search for financial and macroeconomic stability in ASEAN is not confined within ASEAN. Laudable as the ASEAN financial integration measures are, they need to be complemented with at least East Asia–wide measures to improve the regulatory environment in the whole of East Asia, recognise and mitigate the risks from global systemically important banks, and address concerns about currency risk and maturity mismatches that pose potential risks to the whole region – including ASEAN.

29The ASEAN Economic Community Into 2025 and Beyond
Towards this end, Gochoco–Bautista and Remolona propose the extension of the Chiang Mai Initiative Multilateralization into a regional repo that would allow the provision of local currency liquidity, rather than being largely a mechanism for use during a crisis. The authors also propose that complementing the extension of the initiative into a repo market is a system of currency swaps in regional currencies that will provide both a safety net and a boost to the development of local currency capital markets.
Good regulatory practice, regulatory management, and international regulatory cooperation. One major addition in the AEC Blueprint 2025 from the AEC Blueprint 2015 is the incorporation of good regulatory practice (GRP), good governance, and ‘effective, efficient, coherent and responsive regulations’. In addition, GRP is embedded in the key measures for addressing NTMs and in ensuring a more facilitative standards and conformance regime in ASEAN. This is consistent with the view expressed in the Carroll, Gill, and Intal paper in this volume that while regulations are essential for the proper functioning of society and economy, they can nonetheless impose unnecessary burdens on firms and people if the regulations are poorly designed or implemented or are inconsistent with other regulations. Experience suggests that good regulatory quality contributes to foreign direct investment (FDI) attractiveness. See, for example, the performance of Singapore, which remains the top FDI destination in ASEAN despite its high wage, housing, and office space costs, in part because it boasts one of the best regulatory quality environments in the world. Indeed, in the Carroll, Gill, and Intal typology, the countries in East Asia (here defined to include ASEAN, Australia, India, and New Zealand apart from China, Japan, and the Republic of Korea) where GRP is well embedded – Australia, New Zealand, and Singapore – are amongst the global leaders in competitiveness and ease of doing business.
Carroll, Gill, and Intal highlight that embedding GRP throughout government takes a long time, indeed decades in many cases. The authors specify several key drivers for regulatory reform in East Asian countries, the most significant of which is actual or impending crisis and concerns about long-term loss of competitiveness. They present several well-established principles of GRP, including proportionate and effective response to the risk being addressed; minimisation of distortionary side effects; and transparency and stakeholder participation in the design, implementation, monitoring, and review of regulations. Much of the responsibility for engendering GRP in ASEAN would be at the national level. However, concerted national actions by all the ASEAN Member States carried out as a regional initiative can provide an impetus for domestic regulatory improvement. Demand for regionally concerted national actions by ASEAN Member States is supported by the results of the survey of what ASEAN means to ASEAN peoples discussed in Volume 2, Voices of ASEAN, a companion of this volume.

30 ASEAN@50 • Volume 5 | The ASEAN Economic Community Into 2025 and Beyond
Corruption garnered the highest percentage of respondents who considered it amongst the five most pressing problems in the respondent home countries and in ASEAN as a whole. Arguably, regulatory reform and embedding GRP is one major means of addressing corruption.
ASEAN has agreed on a work plan on GRP for the AEC 2025. The work plan includes securing political commitment on GRP first through the agreement on and adoption of the GRP core principles for ASEAN. It also involves institutionalising a sustainable working mechanism on GRP in ASEAN, preparing a handbook on the operationalisation of the GRP core principles, piloting GRP in several sectors, and undertaking awareness raising and capacity building on GRP in the region (Tijaja, 2017).
Carroll, Gill, and Intal also highlight the role of international regulatory cooperation. While largely aimed at improving regulatory coherence across borders on goods and services that move across borders, international regulatory cooperation is also a good means for deeper relationships and greater understanding and trust amongst the regulators in the region. The wide array of approaches to such cooperation provide a good complement to the implementation of the regionally coordinated national GRP measures while at the same time engendering greater regulatory coherence and greater institutional connectivity within the region. Institutional connectivity is a key element of ASEAN connectivity, as discussed below.
An innovative approach and study by UNCTAD provides compelling support for international regulatory cooperation (UNCTAD, 2017). The study on Mercosur uses intensive and extensive mapping of NTMs to determine the impact on trade costs (unit import costs on a cost, insurance, and freight basis) and on economic welfare of the number of NTMs in the importing and exporting countries and the convergence or non-convergence of the NTM technical measures (SPS and TBT) or ‘regulatory overlap/distance’. The study shows that NTM technical measures in the exporting and importing countries raise trade costs, while regulatory convergence or the overlap of regulations between countries reduces trade costs between the countries. The finding that regulatory overlap reduces trade costs is compelling. It means that the more firms in one country face technical measures in the country that are similar to the technical measures of another country, the less would be the costs for firms in the exporting country of meeting the technical measures of the importing country. In the simulations done by UNCTAD on the economic welfare effects of regulatory convergence, the case of regulatory convergence through the adoption of international standards provides the best potential welfare benefits to Mercosur members.

31The ASEAN Economic Community Into 2025 and Beyond
Knebel and Peters (2017) provide results on ‘regulatory distance’ for technical measures amongst ASEAN Member States. The results show that NTMs are more numerous and the regulatory distance amongst ASEAN Member States is significantly bigger for agricultural products than for manufacturing. Concomitantly, the ad valorem equivalents of the NTMs are substantially higher in agriculture and food products – such as animals and meat, fats and oils, fruits, vegetables, and grains, and processed food, beverages, and tobacco – than in manufactures, such as metals and metal manufactures, miscellaneous manufactures, and even machinery and electronics.
The authors also show that by increasing the degree of regulatory overlap amongst the member states, but without increasing the overall number of NTMs, trade costs within ASEAN can be substantially reduced. This is especially pronounced in commodity groups in the primary sector and food products, and in chemicals, plastics and leather, footwear, machinery and electronics, and vehicles. Thus, the study suggests that there is substantial potential for trade cost reduction – and therefore potentially greater positive effect on intra-ASEAN trade and on overall economic welfare – from greater regulatory convergence within the region. Such efforts at regulatory convergence are at the heart of regulatory cooperation through mechanisms such as those on standards and conformance in ASEAN.
Connectivity, production networks, agglomerations, and innovation. One important factor behind the high rates of economic growth of ASEAN Member States in recent years is their involvement in regional production networks, or value chains, with multinational corporations distributing productive tasks across countries according to comparative advantage through FDI. Because of this distribution of tasks, each country in the region tends to produce and export what the country located at the next node of the value chain will buy for further transformation. This had led to increasing industrial specialisation at the country level, making the Asian economy increasingly interdependent economically with its regional partners.
The distribution of productive tasks in manufacturing has taken the form of highly complex networks. The region’s high-income countries, such as Japan, typically supply upstream capital-intensive and high-tech components. Low- or medium-income countries provide downstream assembly services, while several ASEAN countries are in the middle of the value chains. This increasing specialisation has enhanced efficiency by exploiting comparative advantage.
Value chains also played an important role in transferring technology and management know-how from multinational corporations to the countries involved in networks.

32 ASEAN@50 • Volume 5 | The ASEAN Economic Community Into 2025 and Beyond
The countries and companies involved in value chains obtain knowledge and know-how about the production and delivery of the products assigned to them. Through this process, human resources are trained, educated, and nurtured. Indeed, the original ASEAN countries improved their technological and managerial capabilities through their involvement in value chains and they are becoming actively engaged in research and development activities.
The emergence and effective management of value chains contributed significantly to the rapid economic growth of ASEAN Member States and other countries involved in value chains as value chains have enabled them to use their resources efficiently, improve quality of human resources, and develop research and development and innovative capabilities. Two key factors have been important in the emergence and effective management of value chains in ASEAN and in East Asia. First, technological progress and deregulation in communication and transport services, resulting in a substantial decline in the cost of these services and facilitating international transactions in goods, services, and information. Thanks to these developments, internet and smartphone use has skyrocketed in many East Asian countries including ASEAN countries in a short period and cargo shipment and passenger transport has risen sharply. Second, liberalisation of international trade and investment policies in ASEAN and East Asian countries has facilitated cross-border movement of people, goods, services, and information. Many East Asian countries unilaterally reduced tariffs on imported goods and restrictions on inward FDI as they realised that adopting liberalisation policies would promote economic growth by increasing trade and FDI. In particular, ASEAN countries have adopted common policies to lower the barriers to trade in goods and services, investment, and the movement of skilled people between and amongst member states.
In light of growing uncertainty in the international economic policy environment, the continuing digital revolution, and the huge potential for achieving economic growth in ASEAN countries, especially the ‘CLMV’ countries (Cambodia, the Lao PDR, Myanmar, and Viet Nam), ASEAN countries are advised to pursue further integration and connectivity with each other and with other East Asian countries to achieve further economic growth.
Gary Hawke, in his essay in this volume, presents the view that economic integration can be approached not only through the usual liberalisation, facilitation, and capacity building, as in a typical FTA, but also in terms of connectivity. Physical infrastructure and connectivity are important to move goods and services across borders. Efficient movement demands efficient and coordinated border and customs formalities – an important element of institutional connectivity. The compatibility of the regulatory

33The ASEAN Economic Community Into 2025 and Beyond
systems of trading countries – or regulatory connectivity – becomes important if regulators consider regional ambitions and not only the protection of domestic consumers. Like the movement of natural persons in standard FTA discussions, personal knowledge and connections across borders or people-to-people connectivity is critical for business and trading relations. As Hawke points out, virtually all elements of the AEC blueprint can be framed in terms of connectivity. This constellation of connectivity – physical, institutional, and people-to-people – provides the pillars of the MPAC. Currently, however, the MPAC initiatives largely complement and aim to strengthen the AEC blueprint rather than providing an alternative blueprint for economic integration in ASEAN.
In her essay in this volume, Locknie Hsu looks at the legal barriers to supply chain connectivity in ASEAN, noting ASEAN’s goal of enhancing participation in global value chains. She points out that barriers to trade and investments remain significant, and transport facilitation agreements and protocols are not yet all fully ratified and implemented. The diversity of legal systems and laws also calls for some harmonisation to help the business sector and to understand better the application of such laws and thereby reduce their transactions costs and sense of uncertainty. An example of such possible harmonisation is the adoption of internationally accepted standards, such as the United Nations Convention on Contracts for the International Sale of Goods. Similarly, the differences in laws and legal processes in ASEAN translate into legal and time costs to deal with individual transactions or commercial disputes. This is where the ASEAN Solutions for Investments, Services and Trade needs to be an efficient and cost-effective dispute settlement mechanism. It may be particularly important for the region’s SMEs because currently established arbitration mechanisms, such as the Singapore International Commercial Court, are likely to be very expensive and out of reach for the region’s SMEs.
Hsu’s essay alludes to the considerable challenges to achieving seamless connectivity for a truly single production base in ASEAN. Nonetheless, the conception of economic integration from the connectivity lens leads to important insights and benefits. In international diplomacy, Hawke points out, connectivity promotes a cooperative approach to strengthening economic interdependence, in contrast to discussion of liberalisation. More importantly, connectivity leads more easily into discussions of production networks. Finally, connectivity also lends itself to discussions of inclusive growth in terms of both linking peripheries to growth centres and linking SMEs to production networks.
Fukunari Kimura and Yasushi Ueki, in their essay in this volume, focus on connectivity in their discussion of ASEAN’s path towards industrialisation and participation in

34 ASEAN@50 • Volume 5 | The ASEAN Economic Community Into 2025 and Beyond
global value chains. They trace ASEAN’s growth in terms of industrial production fragmentation and agglomeration, and the role of connectivity in facilitating economic growth. Fragmentation describes the dispersion of the production process across geographical locations (i.e. Tier 3- and Tier 2-type operations) or production networks that involve mainly the flow of goods or parts and components. Examples of Tier 3-type operations are industries such as garments, footwear, and natural-resource-based industries. Tier 2 comprises the modern manufacturing sector, particularly machinery industries, with quick and time-sensitive value chains, designed and operated in the form of the second unbundling. In contrast to fragmentation forces that drive Tier 3 and Tier 2 operations, agglomeration is central to Tier 1 involvement in the global value chains. This is characterised by clusters, innovation, and employment of more highly educated and skilled individuals, and involves not only the flow of goods but also of knowledge and ideas.
The progression from Tier 3 through Tier 1 requires a different focus on connectivity. Tiers 3 and 2 call for trade facilitation in the form of tariff elimination and a reduction in logistics costs, and efficient physical connectivity of roads, rail, and ports. Tier 1 operations call for a higher trade and investment facilitation to allow for transfer of knowledge and attraction of higher-level skills. These would include institutional connectivity, and the liberalisation and strengthening of services that support global value chains such as finance, telecommunications, transport, distribution, and professional services. Integral to Tier 1 operations is efficient connectivity and urban amenities. Kimura and Ueki also stress that the quality of urban amenities will be a key point of consideration in attracting human capital for innovation.
Central to the Kimura–Ueki framework is industrial agglomeration, which allows for quick turnaround of a wider range of parts and components, and accelerate process innovations facilitated by outsourcing and subcontracting that may also give rise to more local firm involvement in production networks. Agglomeration is also important in technology transfer because ‘... proximity enables firms to communicate face-to-face more frequently, share more knowledge and experiences, and interact to create new knowledge’ (Kimura and Ueki, this volume). Kimura and Ueki add good urban amenities to agglomeration benefits to promote an environment for innovation. Urban amenities are important to encourage highly talented, internationally mobile individuals to settle down in an area, become an anchor for innovation, and thereby be part of a global network of innovation centres and satellites. From the perspective of Kimura and Ueki, this approach to moving up towards the innovation stage in industrialisation would be a realistic approach in ASEAN, as exemplified by Malaysia’s Multimedia Super Corridor and Singapore’s biotechnology cluster. As the authors point out, other capital cities or major urban centres in ASEAN may generate such windows to global innovation

35The ASEAN Economic Community Into 2025 and Beyond
networks by developing human capital for innovation, and having better urban amenities and public services in addition to good international connectivity and a rich variety of available goods and services.
The drive towards more innovation-driven trade and development needs to be based on national policy and not merely be the product of good urban amenities and agglomeration externalities. This is the focus of Masahito Ambashi’s paper on innovation policy in ASEAN in this volume. After reviewing the national innovation systems and experiences of China, Japan, the Republic of Korea, and Singapore, Ambashi’s proposed innovation system for ASEAN countries draws from those of China and Singapore, complementing and expanding Kimura and Ueki’s discussion. While Japan and the Republic of Korea relied on domestic capital, aggressive technology imports, reverse engineering, and export-oriented incentive systems, China and Singapore relied a lot on FDI together with aggressive innovation-friendly government policies and investments and, in the case of Singapore, openness to highly qualified foreign personnel. The emphasis on FDI, much of it linked to production networks, and investing in human capital and infrastructure, such as technology or industrial parks as platforms for clusters and research centres, are consistent with the broader framework of Kimura and Ueki.
Noting that innovation is a primary source of sustained economic development and inclusive growth, Ambashi points out the importance of understanding innovation from broad perspectives. These include not only the development of new products and technology but also imitating those that already exist. Indeed, for developing countries, innovation through imitation is likely to be very important. He observes that ASEAN Member States are in different phases of innovation activities: Singapore is in the frontier phase, while Cambodia, the Lao PDR, and Myanmar are in the initial phase. Other countries are in between these two phases. He argues that different and appropriate innovation policies should be applied to the countries in different innovation phases by formulating a national innovation system.
Ambashi nonetheless claims that several common elements or factors are important for promoting innovation in all ASEAN Member States. They include stability in micro- and macroeconomic conditions, a favourable business climate, the presence of well-developed hard and soft infrastructure including governance, and the availability of capable human resources. Ambashi also argues that member states should implement region-wide innovation-supporting policies, including trade, investment, and service liberalisation; the promotion of movement of natural persons; and a peer review system of innovation capability. It is noteworthy that the heart of the ASEAN-wide innovation policies proposed by Ambashi are the same as the relevant elements for ASEAN economic integration under the AEC blueprints of 2015 and 2025. This suggests that a

36 ASEAN@50 • Volume 5 | The ASEAN Economic Community Into 2025 and Beyond
successful national innovation policy and programme need to rest on an open economy and outward-oriented development, both nationally and regionally, such as that underpinning Singapore and, for the most part, China.
In addition to Ambashi’s proposed region-wide innovation-supporting policies, the AEC Blueprint 2025 lists several regional cooperation and coordination initiatives to promote innovation in ASEAN. These include (i) sharing information and networking at the university and business levels; (ii) developing and strengthening ASEAN links to global and regional research and development networks; (iii) developing business incubator programmes and encouraging entrepreneurship; (iv) fostering a hospitable intra-ASEAN policy environment for technology transfer, adaptation, and innovation; and (v) promoting strong intellectual property rights protection in the region. ASEAN’s programme of strengthening intellectual property rights cooperation in the region uses such strategies and measures as strengthening member states’ intellectual property offices and infrastructure, expanding the ASEAN Intellectual Property Ecosystem, and enhancing regional mechanisms to promote intellectual property–based asset creation and commercialisation. The latter includes such measures as commercialising geographic indication products in ASEAN and developing protection mechanisms for geographic indications and genetic resources, traditional knowledge, and traditional cultural expressions. The relatively long list of measures related to productivity-driven growth and innovation and to intellectual property rights cooperation reflects ASEAN’s greater focus on productivity, technology transfer, and innovation under the AEC Blueprint 2025 compared with the AEC Blueprint 2015.
Regional Comprehensive Economic Partnership and new issues. Each contributor points out challenges that ASEAN must deal with, whether in the area of connectivity, services integration, NTMs, or deeper integration through involvement in global value chains. Further, as we look to the next phase of ASEAN’s economic growth, it is clear that as complexity increases, ASEAN’s to-do list will also expand. The list covers a myriad of developments including in e-commerce, drone technology, supply chain security, and aspects of the sharing economy.
As Locknie Hsu points out,
‘[ASEAN] will need to keep abreast of the complex amalgam of new technologies, new business models, and new trade and investment opportunities – and possibly, new barriers that develop along with these – to design and implement timely and effective laws and regulations, and explore new legal and policy areas of cooperation and harmonisation.’

37The ASEAN Economic Community Into 2025 and Beyond
She further adds:
‘Beyond intra-ASEAN integration, the next 10 years will also require the bloc to consider – in the face of new, large regional trade alliances and initiatives – how best to leverage on ASEAN’s existing economic integration initiatives, systems, and instruments to ‘plug into’ the wider regional (and global) context so as to generate even more trade and investment for the member states.’
Hsu cites China’s Belt and Road Initiative as an opportunity ASEAN must take advantage of. The potential lies in the benefits from not only physical connectivity (both terrestrial and maritime) but also ‘new supply chains, production networks, investments, and markets’.
Complementing the Belt and Road Initiative is RCEP, which ASEAN is negotiating with its six dialogue partners. RCEP was designed to be a comprehensive and mutually beneficial economic partnership agreement that would involve broader and deeper engagement between ASEAN and its dialogue partners by significantly improving on their existing FTAs. When realised, the integrated FTA of 16 countries will be a huge market of its own representing 47% of the global population and over 40% of global trade.
It is intended to be a living agreement, providing a basis for addressing issues that may emerge in the future. In short, RCEP is forward-looking and inclusive. Ideally, RCEP will offer a 21st century model for inclusive integration amongst countries with different stages of economic development, political systems, ethnicity, and cultural backgrounds.
Given global economic and political developments, and with the Trans-Pacific Partnership Agreement in abeyance, the ASEAN-led RCEP can be the tailwind needed to counter the rising protectionism that increasingly blocks integration and the benefits of free movement of people, goods, and services. Equally important, as ASEAN, China, and India all require supply-side structural reforms to move up the development ladder and raise competitiveness, RCEP can be a concerted integration-cum-supply-side reform agenda facilitated by technical and economic cooperation.
The parties involved are well aware of the benefits that can accrue from deeper regional economic integration. RCEP must be more than just another FTA involving only the traditional elements of market access for goods and services, and investment. For RCEP to truly be the impetus for change, it must include three key interdependent dimensions: (i) broad and deep market access that permits skilled people and products to move

38 ASEAN@50 • Volume 5 | The ASEAN Economic Community Into 2025 and Beyond
much more freely, (ii) rules that promote confidence in trade and commerce, and (iii) an inclusive approach to economic cooperation that will enable the less-developed members to take advantage of the benefits of integration.
Further, in the face of global economic developments and technological advancements and disruptions, a forward-looking RCEP must recognise and accommodate newer elements of trade facilitation, intellectual property rights, e-commerce, and new production technologies, and incorporate an agenda for dealing with these developments and other evolving issues.
RCEP is often compared with the Trans-Pacific Partnership Agreement, which was touted as the gold standard and a model for future ambitious FTAs. The scope and ambition of RCEP may arguably fall short of the Trans-Pacific Partnership Agreement. However, regardless of the level of ambition, in the immediate to short term, it is important for RCEP to aim for balanced and sustainable growth that would (i) facilitate the involvement of micro, small, and medium-sized enterprises (MSMEs) in the production networks and global value chains of larger companies in the region; (ii) use economic and technical cooperation to further MSME development and effective capacity building; (iii) focus on trade facilitation; and (iv) have trade facilitative rules of origin and rules for e-commerce.
In the medium term, the parties must work towards rules or disciplines to support competition (including in the areas of government procurement and state-owned enterprises), intellectual property rights, and the digital economy.
More importantly, in parallel with negotiations, parties, especially those from developing and less-developed economies, must consider adjustment policies at the national level, including in infrastructure, education, and skills development, to prepare to take advantage of the preferences being negotiated. Work on regulatory reform and the management of NTMs must also be continuous.
Many of the fastest-growing economies in the world are in Asia. The completion of RCEP negotiations would validate ASEAN’s role in the economic integration of the region and global trade and investment.
Ultimately, RCEP is a test of ASEAN’s ability to provide economic leadership. RCEP can be the 21st century model for inclusive integration amongst countries with different stages of economic development, political systems, ethnicity, and cultural backgrounds. And it will be key in shaping the Free Trade Area of the Asia Pacific.

39The ASEAN Economic Community Into 2025 and Beyond
Enhancing the AEC for inclusive integration. As indicated above, Brexit, the Trump victory in the US, and the rising voices of protectionism reflect popular disaffection about globalisation and integration primarily in some countries in the developed world. This disaffection is not yet evident in East Asia, which remains the most robustly growing region in the world. It is also worth noting that such disaffection seems to be much stronger in the US, which arguably faces one of the more unequal societies and less-inclusive social safety nets in the developed world. Brexit, the Trump victory, and the rise of protectionism highlight the importance of ensuring a more inclusive as much as dynamic regional integration as well as the issue of management of adjustment in an increasingly integrated world.
Inclusive integration and growth must necessarily aim first at drastically reducing if not eliminating poverty. From this perspective, many of the initiatives highlighted above can contribute significantly to inclusive growth. A very important means of reducing poverty is high economic growth. High rates of investment primarily cause high growth, as the results of the analysis in Volume 3, a companion of this volume, show. Most of the initiatives are meant to improve the investment attractiveness of the region through much more efficient trade facilitation, greater transparency and reduced burden of NTMs, a more open and competitive services sector, much improved connectivity, easier movement of natural persons, and institutionalisation of GRP and regulatory cooperation, amongst other measures. In addition, a stable macroeconomy and deep capital markets would encourage financing of long-term investments (e.g. infrastructure) with appropriate long tenor financial instruments, thereby minimising the problem of maturity mismatch that was one of the reasons for the 1997–1998 Asian financial and economic crises.
There is a very important follow-on effect of the robust and high economic growth on inclusivity. This is through the growth of MSMEs. High economic growth means high demand in the domestic market, which would likely be met by MSMEs simply because they constitute more than 90% of all enterprises in ASEAN. Indeed, much of the impact of integration on MSMEs is not through direct exports but rather through the robust growth of domestic demand arising from the high investment rate expected from the policy reforms and institution building attendant to integration. And most MSMEs are labour-intensive; thus, the expansion of MSMEs would result in a marked rise in the demand for labour, the major means for the poor to earn a living and get out of poverty. To a large extent, the increased direct exporting and number of exporters amongst the MSMEs arising from the integration process would be a secondary and affirming positive effect of integration.

40 ASEAN@50 • Volume 5 | The ASEAN Economic Community Into 2025 and Beyond
Investment, trade, growth, and poverty reduction are also central to the narrowing of development gaps amongst the ASEAN Member States. Indeed, the CLMV countries have been the growth leaders in ASEAN since the latter 1990s. And poverty reduction in the CLMV countries, especially in Viet Nam, is nothing short of impressive.
Poverty reduction would be faster and outcomes would be more equitable if the design and implementation of the measures discussed above and similar measures were to be imbued with significant consideration for inclusive growth and integration. Thus, for example, trade facilitation measures such as the National Trade Repository and the NSW are potentially pro-MSMEs because MSMEs do not have the wherewithal to navigate complex and corruption-ridden export, import, and customs processes, which both initiatives are expected to address. Still, the effective utilisation of the NSW and the National Trade Repository by MSMEs would likely require proactive efforts by the government to inform and train MSMEs on how to utilise them, perhaps through mechanisms specifically geared for MSMEs.
Similarly, the usefulness of mutual recognition agreements in conformance assessment to MSMEs in a country would likely rest on the efficiency of the certification process and the availability of reasonably priced in-country testing facilities, preferably situated near the major production areas in that country. Connectivity generates more inclusive growth if the peripheral areas are also connected to the growth centres instead of connectivity serving only the growth centres. Stakeholder engagement that is part of GRP would need to involve MSME representatives to ensure that the concerns of the MSME sector are well taken care of in the design and implementation of policies, rules and regulations, and procedures in concerned government agencies.
Nonetheless, integration and globalisation, in conjunction with current and emerging technological developments, also provide the seeds for greater inequality if not addressed well. This is best captured by the ongoing digital revolution and globalisation. As the World Bank Development Report 2016 and McKinsey reports emphasised, the digital revolution enables MSMEs to go global directly, thereby tremendously expanding their market, and allows them to grow in market niches. However, apparently only MSMEs with access to good ICT infrastructure, an efficient logistics and payments system, and a good regulatory environment can grow well with their global markets. The World Development Report 2016 notes that it is essentially the digitally well-connected and largely developed countries that so far have benefited primarily from the digital revolution. The World Bank report also emphasises that if the analogue complements to the digital revolution, such as the appropriate policies and regulatory structures, are not in place, then the digital revolution and globalisation could lead to significant adverse distributional impacts.

41The ASEAN Economic Community Into 2025 and Beyond
Finally, purely economic measures are not sufficient to engender robustly inclusive outcomes in the light of technological developments and deepening economic integration. Thus, for example, the emerging technologies appear to make low- to semi-skilled workers redundant. A country without a sufficient and effective programme of skilling-up its workers could then end up facing the problem of unemployment of its low- to semi-skilled workers. Likewise, households in open economies are likely to face greater vicissitudes of the global markets unless their countries have robust safety nets. It is worth noting that open economies with good safety net programmes and institutions, such as Canada, Japan, and the Scandinavian countries, do not seem to harbour heightened protectionist sentiments compared to the US (which has a less adequate safety net, less adequate social security systems, and a more unequal society). Similarly, disasters can impoverish affected families, which may lose or be forced to sell income-earning assets or to borrow more. Thus, programmes that strengthen disaster prevention, enhance capacity to address disasters, and improve disaster relief and rehabilitation would ultimately contribute to more equitable and inclusive growth and integration.
There are likely to be many more possible non-economic measures that can complete economic measures and strategies to engender inclusive growth and integration. What the examples above and many more similar examples suggest is that engendering inclusive outcomes from the economic measures and regional integration in ASEAN would require harnessing the complementarity amongst the measures in the 2025 blueprints of the AEC, the ASCC, MPAC, and even that of the ASEAN Political–Security Community. That is, the pursuit of a dynamic and inclusive AEC and ASEAN is best served by strong coordination and complementation amongst these four major ASEAN blueprints.
ASEAN by 2025 and 2035
How will ASEAN and its member states evolve in the next decade or two? In this volume, Professor Ken Itakura provides some scenarios for 2025 and 2035. The simulations use a recursive dynamic computable general equilibrium model of global trade, which builds on the well-known Global Trade Analysis Project (GTAP) model. Itakura did four simulation scenarios, from a high-growth (H) scenario down to a low-growth scenario. The results are worth considering. Itakura’s H scenario assumes that the World Economic Outlook 2017 projected growth rate of ASEAN Member States in 2022 remains the same until 2035. The medium-growth (M), low-medium-growth, and low-growth scenarios assume average productivity growth of 50%, 25%, and 0%, respectively, of the productivity growth of the H scenario during 2018–2035. Lower productivity growth may result from modest progress in the implementation of the policy measures

42 ASEAN@50 • Volume 5 | The ASEAN Economic Community Into 2025 and Beyond
formulated in the AEC Blueprint 2025. It may also result from limited success in absorbing technology from foreign countries. Slower economic growth may also reflect an unfavourable external environment, which may arise from growing protectionism as well as slower global economic growth.
This section focuses mainly on the H and M scenarios. The H scenario can be considered the optimistic scenario, while the M scenario, which assumes only half the productivity growth of the H scenario, can be considered the conservative scenario. The H scenario assumes the projected growth rates in 2022 in World Economic Outlook 2017 will remain constant up to 2035. This raises the question of how reasonable are the 2022 growth rates. Table 1 shows the average growth rates for 1999–2008 and 2009–2018, and the 2022 growth rate. It shows that the projected growth rate in 2022 is almost equal to the average growth rate for 2009–2018 for Cambodia, Indonesia, Malaysia, Thailand, and Singapore. Brunei Darussalam, the Lao PDR, Myanmar, and the Philippines are projected to have substantially higher growth rates in 2022 than the 2009–2018 average.
ɂ Brunei’s GDP is expected to grow at 5.3% in 2022 in contrast to an average contraction of 0.3% per year during 2009–2018. This probably reflects the effect of improved commodity export prices, which can be also a factor for the slightly higher growth in 2022 in Indonesia and Malaysia compared to the average for 2009–2018.
Table 1: Gross Domestic Product Growth Rates of ASEAN Member States, 1999–2018, 2022 (%)
Member StateAverage
1999–2008Average
2009–2018Projection
2022
Brunei 1.9 (0.3) 5.3
Cambodia 9.5 6.3 6.3
Indonesia 4.9 5.4 5.5
Lao People’s Democratic Republic 6.6 7.5 6.7
Malaysia 5.5 4.6 4.8
Myanmar 11.7 6.8 7.5
Philippines 4.6 5.9 7.0
Singapore 1.4 1.9 1.9
Thailand 4.8 3.1 3.0
Viet Nam 6.8 6.0 6.2
( ) = negative; ASEAN = Association of Southeast Asian Nations.Source: IMF (2017).

43The ASEAN Economic Community Into 2025 and Beyond
ɂ The Lao PDR’s expected 6.7% growth rate in 2022 is lower than the 7.5% average growth rate during 2009–2018. Nonetheless, the 2022 growth rate is consistent with the average growth rate during 1999–2008.
ɂ The growth rate for Myanmar is expected to be 7.5% in 2022, the highest amongst ASEAN Member States. This indicates the surging of the Myanmar economy from a low base arising from the opening up of the economy since the early 2010s. This high-growth phenomenon was also experienced by Cambodia, the Lao PDR, and Viet Nam.
ɂ The Philippine growth rate of 7.0% in 2022 is substantially higher than the average of 5.9% per year during 2009–2018, and reflects the expected continuing robust domestic consumption and the positive growth effect of the expected infrastructure boom under the ‘build, build, build’ strategy of the Duterte administration (2016–2022).
The H scenario, which sees ASEAN GDP growing at an average of 5.2% per year at constant 2011 prices during 2018–2035, is decidedly optimistic, especially in the light of the significant slowdown of ASEAN GDP from 5.9% in 2012 to 4.6% in 2016 and a projected 4.7% in 2017. Given that ASEAN’s total population and working age population are expected to grow by 0.8% and 0.7% annually respectively during 2018–2035, the annual productivity growth rate would have to be about 3.9% during the period (Figure 6), compared to the average productivity growth rate of 3.2% during 2012–2017, to attain the 5.2% average growth rate during 2018–2035.7
It is probably best to view the high annual productivity growth under the H scenario as the result of successes in the policies and programmes on goods and services, trade and investment liberalisation, facilitation of the movement of natural persons, infrastructure development (connectivity), behind-the-border regulatory improvements and institutionalisation of GRP, strengthening of both human capital and research and development investments, and heightened technology transfer in ASEAN. Many of these sorts of improvements are not well captured in computable general equilibrium models such as GTAP. Note that these kinds of improvement are what the AEC Blueprint 2025 aims to achieve. Thus, to a large extent, the optimistic case under the H scenario may approximate a successful implementation of AEC 2025 and later blueprints.
7 Note though that the 3.9% productivity growth rate is a residual number, with overall growth rate and labour force growth rate exogenous. Thus, the productivity growth rate is influenced by the estimated growth rate of investment. This means that underestimating investment growth (which is endogenously determined) would overestimate the productivity growth rate. As investment functions do not capture well all factors affecting investment behaviour, there is a strong likelihood that the investment growth is underestimated, which means that the productivity growth rate is overestimated.

44 ASEAN@50 • Volume 5 | The ASEAN Economic Community Into 2025 and Beyond
Nonetheless, it is worth emphasising that the economic performance of each ASEAN Member State ultimately depends on domestic policies, circumstances, and institutions. The AEC Blueprint 2025, with its implied focus on regionally coordinated or concerted measures, significantly helps strengthen the case for domestic reforms and institution building. Clearly, the H scenario assumes a more favourable external environment than that offered by the prevailing global uncertainties and apparent growing protectionism in 2016 and 2017.
Key Results. Figures 5 and 6 and Table 2 provide snapshots at the aggregate level for 2025 and 2035 for the H and M scenarios. They give the following insights:
ɂ First, under both the H and M scenarios, ASEAN would be an upper-middle-income region on average by 2025 using the World Bank classification. This is because the region’s two most populous members, Indonesia and the Philippines, are projected to be upper-middle-income countries by 2025, albeit at the very low end of the per capita income range for the Philippines. By 2025, Malaysia would join Brunei and Singapore as a high-income country. All member states except Cambodia would be upper-middle-income countries by 2035 under the H scenario.
Note that the total population of ASEAN is expected to increase from 602 million in 2011 to 695 million in 2025 and 744 million in 2035.
ɂ The H scenario envisages an average economic growth rate of 5.2% per year for ASEAN as a whole. This means that the size of the ASEAN economy in 2025 would be twice as large as in 2011 and more than five times larger by 2035. Under the M scenario, ASEAN would grow at an average rate of 4.4% per year, resulting in a quadrupling of the economy by 2035 compared to 2011. In per capita terms, ASEAN GDP would be about 1.75 times higher in 2025 and more than 2.5 times higher in 2035 than in 2011 under the H scenario. Under the M scenario, GDP per capita would be double that of 2011 by 2035.
ɂ Figure 5 shows significant difference in growth performances amongst the ASEAN Member States. Under the H scenario, the growth leaders are Myanmar (represented by ‘rest of Southeast Asia’, which is composed of Myanmar and Timor-Leste), the Philippines, and the Lao PDR. Brunei, Cambodia, and Viet Nam are assumed to average more than 6% per year. Under the M scenario, the Philippines, Brunei, and the Lao PDR are the growth leaders, in that order. Underpinning the continued top performance of these three countries is the implicit high investment growth, and for Lao PDR and the Philippines even under the M scenario, also comparatively high population and labour growth rates.
ɂ Under the H scenario, the per capita GDP of the rest of Southeast Asia would increase nearly fivefold between 2011 and 2035, while those of Cambodia, the Lao PDR, the Philippines, and Viet Nam would increase fourfold. Indonesia and
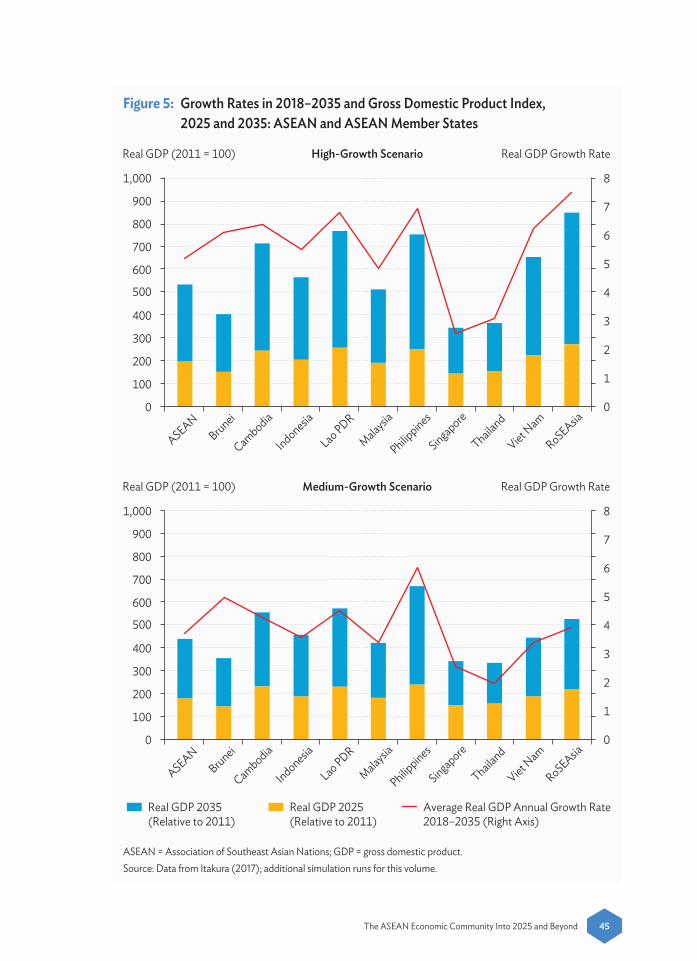
45The ASEAN Economic Community Into 2025 and Beyond
Figure 5: Growth Rates in 2018–2035 and Gross Domestic Product Index, 2025 and 2035: ASEAN and ASEAN Member States
ASEANBrunei
Cambodia
Indonesia
Lao PDR
Malaysia
Philippines
Singapore
Thailand
Viet Nam
RoSEAsia
1,000
900
8
7
6
5
4
3
2
1
0
800
700
600
500
400
300
200
100
0
Real GDP 2025(Relative to 2011)
Real GDP 2035(Relative to 2011)
Average Real GDP Annual Growth Rate2018–2035 (Right Axis)
Real GDP (2011 = 100) Real GDP Growth Rate
Real GDP (2011 = 100) Real GDP Growth Rate
High-Growth Scenario
ASEANBrunei
Cambodia
Indonesia
Lao PDR
Malaysia
Philippines
Singapore
Thailand
Viet Nam
RoSEAsia
1,000
900
8
7
6
5
4
3
2
1
0
800
700
600
500
400
300
200
100
0
Medium-Growth Scenario
ASEAN = Association of Southeast Asian Nations; GDP = gross domestic product.Source: Data from Itakura (2017); additional simulation runs for this volume.

46 ASEAN@50 • Volume 5 | The ASEAN Economic Community Into 2025 and Beyond
Figure 6: Investment Levels (2025, 2035) and Productivity Growth (2018–2035) for ASEAN Member States
ASEANBrunei
Cambodia
Indonesia
Lao PDR
Malaysia
Philippines
Singapore
Thailand
Viet Nam
RoSEAsia
1,600 7
6
5
4
3
2
1
0
1,400
1,200
1,000
800
600
400
200
0
Investment in 2035(Relative to 2011)
Investment in 2025(Relative to 2011)
Average Productivity Annual Growth Rate2018–2035 (Right Axis)
Investment (2011 = 100) Productivity Growth Rate
Investment (2011 = 100) Productivity Growth Rate
High-Growth Scenario
ASEANBrunei
Cambodia
Indonesia
Lao PDR
Malaysia
Philippines
Singapore
Thailand
Viet Nam
RoSEAsia
7
6
5
4
3
2
1
0
Medium-Growth Scenario
1,600
1,400
1,200
1,000
800
600
400
200
0
ASEAN = Association of Southeast Asian Nations; Lao PDR = Lao People’s Democratic Republic.Note: The model does not include or generate productivity growth rates for Singapore.Source: Data from Itakura (2017); additional simulation runs for this volume.
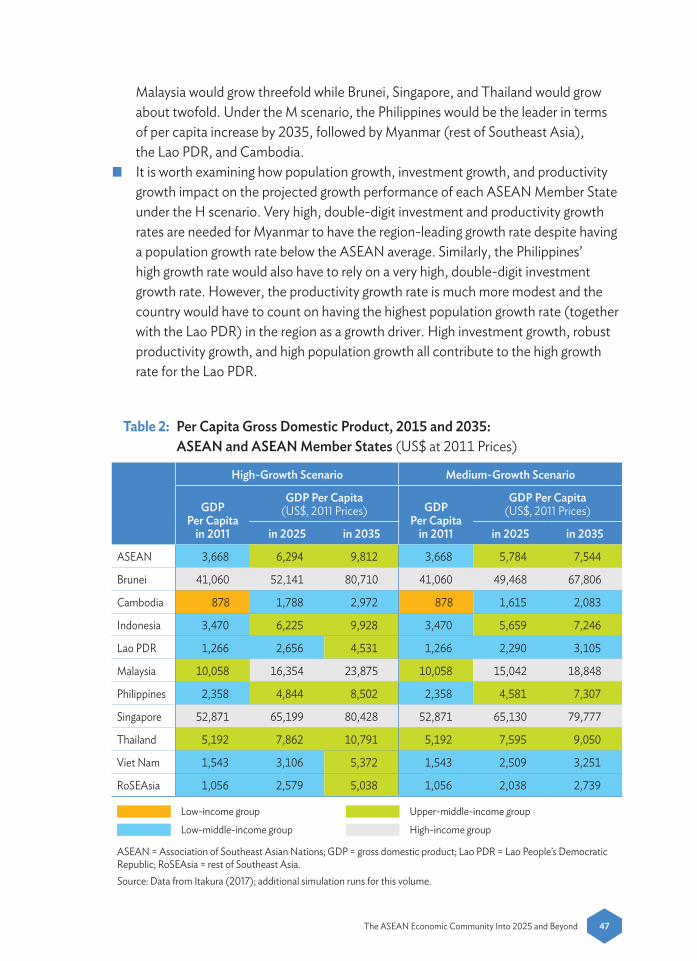
47The ASEAN Economic Community Into 2025 and Beyond
Malaysia would grow threefold while Brunei, Singapore, and Thailand would grow about twofold. Under the M scenario, the Philippines would be the leader in terms of per capita increase by 2035, followed by Myanmar (rest of Southeast Asia), the Lao PDR, and Cambodia.
ɂ It is worth examining how population growth, investment growth, and productivity growth impact on the projected growth performance of each ASEAN Member State under the H scenario. Very high, double-digit investment and productivity growth rates are needed for Myanmar to have the region-leading growth rate despite having a population growth rate below the ASEAN average. Similarly, the Philippines’ high growth rate would also have to rely on a very high, double-digit investment growth rate. However, the productivity growth rate is much more modest and the country would have to count on having the highest population growth rate (together with the Lao PDR) in the region as a growth driver. High investment growth, robust productivity growth, and high population growth all contribute to the high growth rate for the Lao PDR.
Table 2: Per Capita Gross Domestic Product, 2015 and 2035: ASEAN and ASEAN Member States (US$ at 2011 Prices)
High-Growth Scenario Medium-Growth Scenario
GDP Per Capita
in 2011
GDP Per Capita (US$, 2011 Prices) GDP
Per Capita in 2011
GDP Per Capita (US$, 2011 Prices)
in 2025 in 2035 in 2025 in 2035
ASEAN 3,668 6,294 9,812 3,668 5,784 7,544
Brunei 41,060 52,141 80,710 41,060 49,468 67,806
Cambodia 878 1,788 2,972 878 1,615 2,083
Indonesia 3,470 6,225 9,928 3,470 5,659 7,246
Lao PDR 1,266 2,656 4,531 1,266 2,290 3,105
Malaysia 10,058 16,354 23,875 10,058 15,042 18,848
Philippines 2,358 4,844 8,502 2,358 4,581 7,307
Singapore 52,871 65,199 80,428 52,871 65,130 79,777
Thailand 5,192 7,862 10,791 5,192 7,595 9,050
Viet Nam 1,543 3,106 5,372 1,543 2,509 3,251
RoSEAsia 1,056 2,579 5,038 1,056 2,038 2,739
Low-income group Upper-middle-income group
Low-middle-income group High-income group
ASEAN = Association of Southeast Asian Nations; GDP = gross domestic product; Lao PDR = Lao People’s Democratic Republic; RoSEAsia = rest of Southeast Asia.Source: Data from Itakura (2017); additional simulation runs for this volume.

48 ASEAN@50 • Volume 5 | The ASEAN Economic Community Into 2025 and Beyond
The heavy emphasis on investment growth is probably reasonable because the Lao PDR, Myanmar, and the Philippines are particularly deficient in infrastructure and had low investment rates. Brunei needs to have large investment drive if it wants to diversify away from gas and oil or to expand into other byproducts or products derived from oil and gas. The production of products such as petrochemicals tends to be very capital intensive. Brunei had the lowest investment-to-GDP ratio amongst ASEAN Member States during 2000–2012 excluding the Lao PDR and Myanmar (see companion Volume 3, Chapter 1, Figure 2). The policy implication is clear: a policy focus on investing in infrastructure and a more conducive investment climate are warranted to attain high growth in both Brunei and the Philippines.
ɂ Viet Nam stands out as posting the highest rate of productivity growth under both the H and M scenarios. With slower population growth than the ASEAN average, Viet Nam’s high GDP growth rate is heavily dependent on productivity growth. Myanmar, Cambodia, and the Lao PDR follow Viet Nam as the top performers in productivity growth. This seems to indicate that the newer ASEAN members have a lot more room for productivity improvement, including probably a reallocation of resources and labour from the less-efficient sectors to the more-productive sectors. Amongst the older members, Malaysia registers the highest productivity growth rate. (Note, however, that the model does not include or generate productivity growth rates for Singapore.)
Trade. Itakura provides estimates of the trade and production structure for each member state and for ASEAN as a whole under various scenarios. It is worth noting that such estimates are heavily influenced by the structure during the base year of the simulation (2011) because no information is available on the nature of future investment decisions by investors although influenced by real exchange rate (terms of trade) changes. That is, changes would not be very different from the 2011 results.
Foreign trade has contributed to rapid economic growth in ASEAN Member States. Expansion of exports has enabled member states to earn foreign exchange with which they imported intermediate inputs and investment goods to produce manufactured goods. In particular, ASEAN Member States’ exports and imports have been increasing within the framework of regional and global supply chains, contributing to their strong economic growth. Figure 7 examines how the trade structure is projected to change.
The figure shows the trade-to-GDP ratios for 2011 (the base year), 2025, and 2035 for the H and M scenarios for nine ASEAN Member States. The estimates for Myanmar (rest of Southeast Asia) have been excluded because the model does not have a well-articulated Myanmar model and thus the results would be very unreliable. Including Myanmar would make the ASEAN totals less robust as well. Figure 7 shows contrasting

49The ASEAN Economic Community Into 2025 and Beyond
Figure 7: Trade to Gross Domestic Product Ratio, 2011, 2025, 2035: ASEAN and ASEAN Member States
Trade to GDP in 2025(in 2011 prices)
Trade to GDP in 2035(in 2011 prices)
Trade to GDP in 2011
Brunei
Cambodia
Indonesia
Lao PDR
Malaysia
Philippines
Singapore
Thailand
Viet Nam
50
300
250
200
150
100
0
Trade to GDP (%) High-Growth Scenario
Brunei
Cambodia
Indonesia
Lao PDR
Malaysia
Philippines
Singapore
Thailand
Viet Nam
50
300
250
200
150
100
0
Trade to GDP (%) Medium-Growth Scenario
ASEAN = Association of Southeast Asian Nations; GDP = gross domestic product; Lao PDR = Lao People’s Democratic Republic.Note: The model does not include or generate productivity growth rates for Singapore.Source: Data from Itakura (2017); additional simulation runs for this volume.

50 ASEAN@50 • Volume 5 | The ASEAN Economic Community Into 2025 and Beyond
trends amongst the ASEAN Member States. One group of countries has largely marginal changes in ratios between 2011 and 2035: Brunei is largely stable, Cambodia rises and then falls back almost to the 2011 level, Indonesia marginally declines, and Thailand marginally increases. Another group of member states is expected to have higher trade-to-GDP ratios: the Lao PDR and the Philippines have some increase and Singapore has a more significant rise. The last group of member states is expected to have declining trade-to-GDP ratios: Malaysia slightly and Viet Nam more significantly.
It is worth noting that the decline in the trade ratio reflects the increasing importance of domestic activities, including consumption and investment, in generating economic growth for member states such as Malaysia and Viet Nam. The decline in the trade-to-GDP ratios does not mean that international trade is unimportant for economic growth; on the contrary, international trade continues to be important for realising high productivity growth, which is a basis of high economic growth. Export expansion will improve productivity as it enables producers to benefit from large-scale production. Importation of high-quality investment goods and inputs leads to high productivity. Note that both Malaysia and Viet Nam have a relatively high reliance on foreign trade at present. The decline in the ratio suggests essentially a much more robust domestic market, as reflected in the case of Viet Nam in terms of a declining import-to-GDP ratio and a declining export-to-GDP ratio. Despite the expected decline in the trade-to-GDP ratio, both Malaysia and Viet Nam will remain amongst the most trade-oriented ASEAN Member States by 2035. (In the case of Viet Nam, the decline is also likely due to the model having failed to capture well the dramatic growth of electronics and electrical equipment exports and imports, as exemplified by Samsung, in recent years because the structure of the economy in the GTAP model is based on 2011 data.)
Indonesia and the Philippines have been, and will remain, the least trade-dependent ASEAN Member States by 2035. The contrasting simulation results are worth noting. The rise in the trade-to-GDP ratio in the Philippines indicated in Figure 7 is consistent with the expected rise in the share of the machinery sector in the Philippine economy up to 2035. The machinery sector is comparatively more dependent on both importing and exporting as part of regional production networks. The marginal decline in the trade-to-GDP ratio of Indonesia would require more in-depth examination. One likely reason is that the structure of exports of Indonesia embedded in the model is heavily dependent on commodities. GDP growth outpaced the increase in the growth of aggregate real export prices and of export volumes. It may be best to view the Indonesia simulation results as suggestive of the need for Indonesia to aggressively move towards manufacturing exports and to reduce its reliance on commodity exports.

51The ASEAN Economic Community Into 2025 and Beyond
A look at the expected export- and import-to-GDP ratios that underpin the trade-to-GDP ratios of Brunei, Cambodia, and Thailand suggests that the apparent relative stability in the ratios hides significant changes in the export and import performances of the three countries. Specifically, Cambodia and Thailand are expected to have a lower import-to-GDP ratio and higher export-to-GDP ratio (not shown), suggesting that their exports are less import dependent. This is especially noteworthy for Cambodia and probably arises from market-oriented import substitution. In contrast, Brunei is expected to have a lower export-to-GDP ratio and a higher import-to-GDP ratio. With unfavourable terms of trade, the decline in the export-to-GDP ratio is realistic in view of the heavy dependence of the country on oil and gas exports. The expected higher import-to-GDP ratio for Brunei reflects the assumed high investment growth in the country. Investments in the country would be highly import intensive in view of the limited production capacity of the country in non-oil-based manufacturing and resource-based industries.
The simulation results for Singapore show an even greater trade orientation in both exports and imports as a ratio of the country’s GDP. The Lao PDR and the Philippines would also increase their trade orientation through higher export and import shares to GDP.
Production structure. Itakura’s simulation results show that all sector output volumes would increase in all ASEAN Member States, except for Singapore’s primary, energy, and light manufacturing sectors. Nonetheless, like many other countries, ASEAN Member States have experienced a shift in the production structure from the primary sector to manufacturing and services, except for Brunei, where the share of the mining industry (part of the primary sector) has remained high. Itakura presents the projected structure of production for 2035 (Table 3). For ASEAN as a group, the production structure remains more or less the same in 2035 as in 2011, with a slight shift from primary and manufacturing to services, particularly construction. The slight reduction in the shares of the primary and energy sectors appears counter-intuitive: it seems to indicate that the region, or at least several ASEAN Member States, is projected to remain competitive in the primary and energy sectors in the next 2 decades. As Table 3 shows, the slight changes in ASEAN’s overall production structure hide significant changes in the production structure of several member states.
The changes in the production structure are attributable to changes in supply and demand factors. Rapid economic growth resulting from the accumulation of physical and human capital would shift the pattern of comparative advantage away from the primary sector to manufacturing and services. A rapid increase in income resulting from economic growth would shift the pattern of demand from primary to manufacturing and services. An increase in the share of construction reflects active investment, which requires construction services.

52 ASEAN@50 • Volume 5 | The ASEAN Economic Community Into 2025 and Beyond
Table 3: Production Structure 2015 and 2035: ASEAN and ASEAN Member States
Brunei Cambodia Indonesia Lao PDR Malaysia
20112035
20112035
20112035
20112035
20112035
H M H M H M H M H MPrimary, energy 41 18 18 31 32 30 24 17 18 57 45 44 16 15 14Light manufacturing
1 1 1 29 27 31 7 5 6 6 4 4 4 3 3
Heavy intermediates
5 4 4 4 8 6 17 17 17 8 16 18 15 16 16
Machinery 0 0 0 4 2 2 5 4 5 1 1 0 20 17 18Utilities, transport, and communications
11 11 11 8 5 5 7 6 7 8 10 11 9 9 9
Trade, finance 18 37 38 10 11 10 14 16 16 7 8 8 22 24 24Construction, others
25 29 29 15 16 16 27 35 32 15 17 15 13 16 16
Philippines Singapore Thailand Viet Nam ASEAN
20112035
20112035
20112035
20112035
20112035
H M H M H M H M H MPrimary, energy 23 14 13 1 0 0 16 16 15 28 32 33 19 17 16Light manufacturing
5 4 4 1 0 0 8 7 8 17 8 9 6 5 5
Heavy intermediates
9 14 14 18 27 25 19 17 17 12 12 13 16 16 17
Machinery 14 25 26 20 18 18 18 23 24 9 7 7 13 12 14Utilities, transport, and communications
10 8 8 15 16 16 10 8 8 9 8 8 9 8 9
Trade, finance 20 16 16 27 22 22 17 18 18 9 13 12 18 18 18Construction, others
19 20 19 18 18 18 12 12 11 15 20 18 19 24 22
The highest share The second-highest share The third-highest share
ASEAN = Association of Southeast Asian Nations; H = high-growth scenario; M = medium-growth scenario.Source: Data from Itakura (2017); additional simulation runs for this volume.
As indicated above, there are some cases where the patterns and/or magnitude of the changes in production structure are quite notable at the national level. For example, large declines in agriculture and natural resources are projected for Brunei, Indonesia, the Lao PDR, and the Philippines. Of the four ASEAN Member States, the change in the production structure in Brunei is the most striking in view of the historically large
53The ASEAN Economic Community Into 2025 and Beyond
role of the oil and gas sector in Brunei’s economy. Perhaps the best way of viewing the results for Brunei is that the country’s projected high growth arising from a sharp rise in investments would most likely be feasible primarily through a sharp expansion of the trade, finance, and business services sector in view of the projected significant rise in wages in the country.8 The figures show a successful diversification of Brunei’s economy away from the energy sector.
In the Lao PDR, there is a substantial decline in the shares of the primary and energy sectors, together with a marked rise in the share of heavy industry. This shift in production structure in the Lao PDR is interesting because heavy industries tend to be power intensive, and the country is an energy exporter. The decline in the share of the primary sector in the Philippines is also projected to be large, in tandem with a substantial rise in the share of the machinery sector. Overall, this appears as essentially an acceleration of the current trend towards the machinery sector in the country. The marked reduction in the share of the primary sector in the Philippines could slow down if the country’s policy and institutional environment were to become more conducive to investments in mining, because the Philippines is reputed to be one of the most mineral-rich countries in the world.
In Indonesia, the decline in the shares of the primary and energy sectors is much more modest, and reflects the country’s comparative advantage in the sector. Nonetheless, what is interesting in the simulation results for Indonesia is that the share of the construction and other services sector would increase significantly, suggesting that the potential significant growth driver apart from construction concomitant to expected infrastructure build-up and investments in housing is services, most likely tourism, where the country has acknowledged tremendous potential.
Other interesting results in the Itakura simulations would require further analysis. Perhaps the most surprising at first glance are the results for Viet Nam, where there is a significant increase in the shares of the primary and energy sectors and of the ‘other services’ sector and a reduction in the shares of light manufacturing and machinery. The increase in the shares of the primary and energy sectors is due to the slight uptick in the share of the primary sector and the marked rise in the share of the energy sector. The other sector that is expected to increase its share of aggregate output is other services, which includes recreation, public administration, defence, education, health,
8 Note that the estimates for Myanmar are not included in the table because they are unlikely to be reliable given that a Myanmar-specific input–output table is not available to generate the changes in production structure. Note also that modern financial and business services are more skilled, labour intensive, and comparatively higher paying than many other industries in an economy.

54 ASEAN@50 • Volume 5 | The ASEAN Economic Community Into 2025 and Beyond
and dwellings. The other services are income elastic, which means the demand for them increases faster than the growth of income. Thus, to some extent, the surge in the share of other services is the natural result of an economy in which per capita income is rising substantially.
As indicated above, the simulation results for Viet Nam show the share of the primary sector holding up while the share of the light manufacturing sector (which includes textiles, apparel, and leather) will decline by 2035. Perhaps the results could be explained in terms of the high growth of wages, especially relative to Cambodia (which would see a much higher share of light manufacturing) in tandem with the higher productivity growth rate relative to other ASEAN Member States. The high productivity growth rate can be expected to include productivity growth in agriculture, which indicates that Viet Nam would increase its comparative advantage in agriculture vis-à-vis several member states.
The decline in the share of the trade and finance sector in Singapore in the simulations is also worth noting. This seems to suggest rising competition within the region in the trade and finance service sector as reflected in the rising share of the sector in Indonesia, Malaysia, and Thailand. The shifts in the production structure in Malaysia and Thailand appear consistent with the growing reputation of Thailand in the machinery sector and the growing regional strength of Malaysian financial institutions. Also worth noting is the increase in the shares of the primary and energy sectors in Cambodia. This probably reflects Cambodia’s large potential for agriculture because of its high ratio of arable land to population, which is one of the highest in ASEAN, together with the projected high productivity growth in the country indicated in the simulation results.
In summary, using the H scenario as a basis, an examination of the projected patterns of production for ASEAN Member States reveals several interesting patterns concerning the changes in the importance of different economic sectors for member states. The primary and natural resources sector is projected to remain large for new member states Cambodia, the Lao PDR, and Viet Nam, despite some decline in its total share. Light manufacturing is projected to account for a relatively large share for Cambodia. The share of heavy intermediates is relatively large for many member states, including Indonesia, the Lao PDR, Malaysia, the Philippines, Singapore, Thailand, and Viet Nam. The machinery sector accounts for a large share for the founding ASEAN Member States except Indonesia, including Malaysia, the Philippines, Singapore, and Thailand. The share of utilities, transport, and communication is high for Singapore compared to the other member states. Trade and finance are projected to account for a relatively large share for Brunei, Malaysia, the Philippines, Singapore, and Thailand. Construction is projected to make up a large share for Brunei and Indonesia.

55The ASEAN Economic Community Into 2025 and Beyond
Wages. Figure 8 presents the simulation results on the wages of skilled and unskilled labour in real terms (2011 prices) under the H scenario as an illustration of the possible impact on labour. As economic structures change over time and various sectors have different demands on skilled and unskilled labour, wage rate growth can differ between skilled and unskilled workers. However, it should be noted that computable general equilibrium models rely on the base year input–output structures of the economies and the estimates of sector composition and labour demands, and therefore of wage rate growth, can have substantial errors. Thus, such estimates are at best broad indications of changes.
Figure 8: Average Annual Growth Rate of Wages, 2018–2035: ASEAN Member States
Skilled laborUnskilled labor
1
6
7
8
5
4
3
2
0
Rate (%) High-Growth Scenario
Brunei
Cambodia
Indonesia
Lao PDR
Malaysia
Philippines
Singapore
Thailand
Viet Nam
ASEAN = Association of Southeast Asian Nations.Source: Data from Itakura (2017); additional simulation runs for this volume.

56 ASEAN@50 • Volume 5 | The ASEAN Economic Community Into 2025 and Beyond
The results are as follows:
ɂ For ASEAN as a whole, the growth rate of wages at constant 2011 prices (i.e. without an inflation factor) is robust for both unskilled and skilled workers. Equally noteworthy, the growth of wages of unskilled labour is projected to be higher than that of skilled labour. One probable reason for the projected higher rate of increase of unskilled labour compared with skilled labour is the expected sharp rise in infrastructure investments (and likely, housing construction), which use more unskilled labour. If we consider the growth of wages as a good indicator of the change in welfare of the people (since most of them would rely on their labour for their income), then the results of the H scenario indicate a comfortable improvement in the welfare of the ASEAN populace. The projected 4.2% and annual wage growth rate for unskilled labour and 3.5% for skilled labour for ASEAN as a whole in 2018–2035 are higher than the actual 3.7% and annual wage rate for unskilled and 3.0% for skilled workers in the region during 2011–2017. Note the higher growth rate of wages of unskilled labour compared with skilled labour. Other things being equal, this suggests a narrowing of income inequality.
ɂ There is considerable variation amongst member states in the growth of wage rates (Figure 8). The highest rate of wage increase is in Brunei, reflecting the effects of a very high investment rate and a very small labour force. It is important to note that the growth rates of wages under the H scenario are much higher than the actual performance during 2011–2017, which is estimated at a mere 0.3% for unskilled labour and 0.7% per year for skilled labour. In view of the lacklustre actual wage rate growth, the projections under the H scenario can be considered as the potential impact on wages in Brunei if the country experiences high economic growth buttressed by a very high investment rate.
ɂ Viet Nam has the second-highest wage growth rates. In both unskilled and skilled labour, the expected growth rates for 2018–2035 are higher than the actual wage growth rates of 3.3% for unskilled labour and 3.6% for skilled labour during 2011–2017. The highest productivity growth rate amongst ASEAN Member States amidst robust investment growth and high overall economic growth contributes to the robust growth in wages for unskilled labour and especially for skilled labour.
ɂ Wage growth in both unskilled labour and skilled labour is also expected to be robust in Indonesia, the region’s biggest economy and most populous country. Strong investment growth of 6.6% per year, robust productivity growth of 3.7% per year, and overall economic growth of 5.5% per year amidst a low growth of working age population of 0.8% per year explain the strong increase in wages of 3.9% per year for both unskilled and skilled labour during 2018–2035. Arguably, a higher economic growth rate in the 6% per year range, which would likely require a higher rate of growth of investment and productivity, could be expected to result in wage growth rates in excess of the 3.9% indicated in Figure 8.

57The ASEAN Economic Community Into 2025 and Beyond
ɂ Thailand’s expected wage growth rates are comparatively low, and are even lower than the estimated 3.0% annual growth rate during 2011–2017. Underpinning the low growth rates are the low overall economic growth amidst a declining labour force and very modest investment growth. It is important to note that the model does not allow intercountry movement of labour; hence, one likely source of overall growth of the economy – access to relatively cheap labour from Cambodia, the Lao PDR, and Myanmar – is not captured in the model. Equally important, the simulation model assumes that the projected economic growth into 2022, which is low for Thailand at 3.0% in 2022, is maintained up to 2035. Hence, the way for Thailand to raise the wage growth rates is to markedly raise the economic growth rate arising from a substantially higher investment rate and higher productivity growth rate. As it is, the model presents a case of the ‘middle-income trap’ for Thailand.
ɂ Cambodia’s rates of wage growth for both unskilled and skilled labour are the lowest in ASEAN. This is surprising given the high economic growth rate and robust productivity growth. They suggest that the returns to robust productivity growth and high overall growth would go disproportionately to the owners of capital. Perhaps this reflects the low investment growth for Cambodia, especially because construction accounts for about 46% of fixed capital formation in the country and construction tends to be unskilled-labour-intensive (although it is less labour-intensive in Cambodia than in other member states such as Indonesia, the Philippines, and even Viet Nam). Perhaps raising the level of investment growth, such as in infrastructure, and increasing the local labour content of construction would lead to a more significant increase in wages in Cambodia, especially of unskilled labour.
Impact of the Regional Comprehensive Economic Partnership on ASEAN Member States. Negotiations for RCEP involving ASEAN Member States and six ASEAN dialogue partners (Australia, China, India, Japan, the Republic of Korea, and New Zealand) began in 2013 and some progress has been made so far. Although several difficult issues remain before a conclusion can be reached, the negotiating parties are eager to finish the negotiations as soon as they can. Some members think that this is an opportune time to move RCEP negotiations forward because the Trans-Pacific Partnership, which is considered as a competitor to RCEP, is unlikely to be enacted in its original form due to the US’ withdrawal. There is also a view that RCEP members should take a lead in establishing the Free Trade Area of the Asia Pacific, which is seen as an eventual goal of a regional trade agreement in Asia-Pacific.
Itakura conducted a simulation analysis for the case where RCEP enters into force in 2018. Specifically, he assumed the removal of tariffs on trade amongst RCEP members, a 20% logistics improvement of merchandise trade, and a 20% reduction in the tariff

58 ASEAN@50 • Volume 5 | The ASEAN Economic Community Into 2025 and Beyond
equivalents of services trade barriers. The results of the simulation analysis, using the H scenario as a base, are shown in Figure 9. For ASEAN as a group, the real GDP growth rate will increase by 0.2 percentage points from 5.2% to 5.4%. This may be considered as a lower bound because the simulation does not include effects that may be important, such as e-commerce, investment promotion, and connectivity. The changes in real GDP growth for member states resulting from the enactment of the RCEP range between 1.5 percentage points (Cambodia) and –0.07 percentage points (rest of Southeast Asia). A large gain from RCEP for Cambodia probably reflects its high tariff protection, which would be removed vis-à-vis RCEP trading partners. Other countries that can expect a relatively large gain include Thailand (0.62 percentage points) and the Lao PDR (0.57 percentage points). Member states can expect to achieve additional GDP growth if the enactment of RCEP leads to the formation of other mega regional partnerships including an ASEAN–European Union FTA and the Free Trade Area of the Asia Pacific.
Figure 9: Impacts of RCEP on Real Gross Domestic Product Growth in ASEAN and ASEAN Member States (%)
7.0
8.0
9.0
6.0
5.0
4.0
3.0
2.0
1.0
0.0
–1.0
RCEPH
ASEANBrunei
Cambodia
Indonesia
Lao PDR
Malaysia
Philippines
Singapore
Thailand
Viet Nam
RoSEAsia
ASEAN = Association of Southeast Asian Nations; H = high-growth scenario; RCEP = Regional Comprehensive Economic Partnership; RoSEAsia = rest of Southeast Asia.Source: Data from Itakura (2017); additional simulation runs for this volume.

59The ASEAN Economic Community Into 2025 and Beyond
Concluding Remarks: Strengthening the ASEAN Way towards ASEAN Centrality
The scenarios above started with the H scenario, which would result in a major economic transformation of most of ASEAN. Such a scenario demands high investment growth in many member states and a more robust rate of productivity growth than was achieved during 2012–2016. Such high investment growth and robust productivity growth are consistent with the expected outcomes of the various measures under the AEC Blueprint 2025. These include more competitive domestic markets, improved investment regimes, more seamless trade facilitation, institutionalisation of GRP and enhanced good governance, stronger focus on productivity and technology upgrading, greater connectivity, and deeper integration within ASEAN and the rest of the world.
The M scenario, on the other hand, is consistent with slow and limited progress in the implementation of the policy measures formulated in the AEC Blueprint 2025. It may also result from limited success in absorbing technology from foreign countries. Slower growth may reflect an unfavourable external environment, which may arise from growing protectionism as well as slower global economic growth.
The optimistic H scenario essentially assumes that the AEC Blueprint 2025 and the subsequent AEC blueprints would be implemented effectively. Implementation is the most critical element of the AEC Blueprint 2025 and successor blueprints, and it will determine whether the results envisioned by the H scenario are delivered.
The issue of implementation – and with it political will – is usually juxtaposed with ‘the ASEAN way’, as well as more technical-cum-political considerations such as monitoring, review, and sanctions. The ASEAN way, which describes a sequential approach towards economic integration, is a key source of frustration for those in a hurry when dealing with ASEAN. This approach of consensus in forging agreement and in decision-making has shaped ASEAN’s reputation as slow-moving but has also contributed to its longevity and success. Both Peter Drysdale and Gary Hawke reflect positively on this in their essays in the volume. Hawke describes the ASEAN way as a ‘patient evolution of agreement on objectives and frequent peer review of progress’. To some, he says, this may appear ‘imprecise and like subordination of results to process.’ Hawke argues that ‘even before the Greek crisis and Brexit, the “ASEAN way” was delivering more durable integration than agreements apparently enshrined in black-letter law.’
The ASEAN way has worked thus far. The informal nature of the decision-making process has no doubt assisted in the past. For Drysdale, ASEAN is ‘an experiment that has succeeded’. The consensus-building approach to economic cooperation and the

60 ASEAN@50 • Volume 5 | The ASEAN Economic Community Into 2025 and Beyond
idea of open regionalism have been central in shaping its development. Viewing ASEAN through the lens of the economic and political history of the region, Drysdale sees ASEAN as ‘a remarkable story, not only in the annals of regional experience and history but also in the story of modern international affairs’. For him, the ASEAN model is ‘a significant innovation and achievement in international economic diplomacy’.
Its outward-looking and inclusive strategy, moving away from protectionist and inward-looking policies not only contributed to the region’s growth but also underpinned its political security. This approach has enabled the grouping to manage the political and security concerns that have surfaced, whether in the South China Sea or in the border areas.
But the environment is changing fast. To continue on its path of inclusive growth, ASEAN must take proactive steps to avoid domestic opposition to its liberalisation and reform initiatives. Yes, the ASEAN way has worked, but given growing populism and in the face of protectionist headwinds, change is necessary. Drysdale stresses that ASEAN will need to deepen domestic and popular support for ASEAN and regional economic integration.
The success of AEC 2025 also hinges on the speed of implementation and maintaining the sense of urgency needed to see through the commitments made. Recognition must be given to officials for drawing up the AEC 2025 Consolidated Strategic Action Plan (CSAP) to track implementation of the blueprint. The CSAP comprises 153 measures and 513 action lines for implementation through 2025, so it needs to have a rigorous mechanism to track implementation. A compliance scorecard, as was used to track the AEC 2015, will not suffice; ASEAN must also track the impact of the measures.
In addition to reviewing its decision-making process to strengthen the ASEAN way and thereby facilitate a more effective implementation of AEC 2025, ASEAN will need to have in place a rigorous and vigorous dispute-settlement or ombudsman mechanism. This is important because as integration deepens further, margins could tighten, and firms could become more vulnerable to the vagaries of the differences in regulations or in the implementation of ASEAN agreements. These changes could lead to a substantial increase in complaints of discriminatory behaviour by members.
A more important component of the strengthened ASEAN way is a monitoring and evaluation system that engenders deep engagement of and collaboration with the business community, think tanks and research institutes, and civil society for constructive feedback on the implementation of the CSAPs of the AEC Blueprint 2025 and its successors. Deeper stakeholder engagement will not only improve the implementation of the AEC measures but, equally importantly, will also engender a

61The ASEAN Economic Community Into 2025 and Beyond
deeper sense of belonging in and greater ownership of the ASEAN integration process by the ASEAN people. In the process, ASEAN will become not only ‘leaders driven’ but also increasingly ‘people driven’.
The Philippines provides an example of a possible framework and template that could be followed by all ASEAN Member States in the implementation of the AEC Blueprint 2025. The Philippine framework has four Cs: Compliance to meet AEC obligations in conjunction with the national development strategy and initiatives; Collaboration amongst all government agencies and stakeholders for greater synergy and better results; and Communication to target stakeholders for their greater awareness and participation. All of those are in the pursuit of the fourth C – Competitiveness (of firms, industry, and country) arising from better quality, productivity, and innovation (DTI, 2017). Underpinning this framework is the strong alignment of the AEC Blueprint 2025 with the national development plan of the country, which necessarily is the ultimate foundation of the Philippine AEC 2025 Game Plan.
What is particularly noteworthy about the Philippine approach is that it lists the Philippine initiatives that need to be undertaken to implement each key action line corresponding to the strategic measures in the CSAP 2025. The Philippine initiatives include ‘... legislative and policy reform measures, programs and activities [to be or already being] undertaken individually by or in collaborative partnerships among government agencies, and across economic sectors’ (DTI, 2017, p. 11). The Philippine AEC 2025 Game Plan is a whole-of-government approach. It is the product of the inter-agency Committee for the AEC composed of top officials of at least 10 major ministries, and contains detailed listings of what each agency or stakeholder group needs to do or coordinate.
In effect, this is the Philippine implementation plan for the AEC Blueprint 2025. If all member states had their own national implementation plans for AEC Blueprint 2025, then the monitoring and evaluation of the implementation of the AEC 2025 for the whole region would be much more rigorous, and, given transparency, more participatory. The national implementation plans would allow for more in-depth monitoring and peer discussion amongst member states, facilitated by the country visits of the ASEAN Secretariat’s Integration Monitoring Directorate and the regular meetings of the numerous ASEAN committees and working groups. At the national level, the existence of an inter-agency body, such as the Philippine Committee for ASEAN Economic Community, enables structured monitoring and coordination of the implementation of the various country initiatives for AEC 2025. It is also worth noting that the Philippines has been undertaking hundreds of advocacies, communications, and engagements with target audiences to raise awareness and engender deeper engagement of the various

62 ASEAN@50 • Volume 5 | The ASEAN Economic Community Into 2025 and Beyond
stakeholders in AEC initiatives. It is also important to emphasise that many of these AEC-related initiatives are themselves part of Philippine development programmes. It is this congruence of national and regional initiatives, together with stronger engagement of the concerned stakeholders, that provides a hopeful prognosis on the eventual success of the AEC Blueprint 2025.
Finally, that congruence and public awareness and participation – and the implied greater political will – can be expected to animate a bolder and more dynamic ASEAN. Indeed, if ASEAN is to serve as an effective counter-force to the anti-globalisation headwinds, one should expect a bolder, more dynamic ASEAN, and one that gives full meaning of the phrase ‘ASEAN Centrality’. As Drysdale aptly puts it, ‘ASEAN members can no longer simply be support players with the established industrial powers writing the script, as has largely been the case in these decades past’. As the results of the survey of ASEAN peoples on what ASEAN means to them show (see the companion volume, Volume 2, edited by Intal and Ruddy), ASEAN respondents have high aspirations and expectations for ASEAN to have a strong global and regional presence and voice by 2025. Both the AEC and RCEP can work in tandem to provide a good template for the rest of the world on moving towards inclusive and dynamic integration amongst countries of widely varying levels of development but with common aspirations for robust development and deeper economic engagement with one another and the rest of the world.
References
ASEAN Secretariat (2017), ASEAN Economic Community 2025 Consolidated Strategic Action Plan. Jakarta. ASEAN Secretariat. http://asean.org/storage/2017/02/Consolidated-Strategic-Action-Plan.pdf
ASEAN Senior Level Committee for Financial Integration (2015), ‘Summary of Achievements of ASEAN Financial Integration’, 21 March 2015. www.bnm.gov.my/documents.../20150321_Summary_of%20Achievements_final.pdf
Asian Development Bank (ADB) and United Nations Economic and Social Commission for Asia and the Pacific (UNESCAP) (2009), Designing and Implementing Trade Facilitation in Asia and the Pacific. Manila: ADB.
Atsmon, Y., P. Child, and U. Kopka (2012), ‘Winning the $30 Trillion Decathlon: Going for Gold in Emerging Markets’, McKinsey Quarterly, August. McKinsey and Company.

63The ASEAN Economic Community Into 2025 and Beyond
Baldwin, R. (2017), ‘The Great Convergence: Information Technology and the New Globalization’, Presentation at ERIA on 2 May 2017, Jakarta: ERIA.
Department of Trade and Industry (DTI) (2017), The Philippine AEC 2025 Game Plan: Building on Gains, Forging Ahead. Manila: DTI.
IMF (2017), World Economic Outlook 2017, April. Washington, DC: IMF.
Intal, P. and L. Ruddy (2017), Voices of ASEAN: What Does ASEAN Mean to ASEAN Peoples?, Volume 2 of ASEAN@50. Jakarta: ERIA.
Intal, P., Y. Fukunaga, F. Kimura, P. Han, P. Dee, D. Narjoko, and S. Oum (2014), ASEAN Rising: ASEAN and AEC Beyond 2015. Jakarta: ERIA.
Intal, P., D. Narjoko, and M. Simorangkir (2011), Study to Further Improve AEC Scorecard. Jakarta: ERIA.
Knebel, C. and R. Peters (2017), ‘Regulatory Distance and Streamlining NTMs’, Presentation at the Workshop on NTMs at ERIA, Jakarta, 27 July 2017.
Koudal, P. (2006), The Service Revolution in Global Manufacturing Industries. A Deloitte Research Global Manufacturing Study. Deloitte Company.
Kurniati, Y. (2016), ASEAN Banking Integration Framework. Presented at symposium on Advances and Challenges in Regional Integration, 3–4 March 2016, Tokyo, Japan.
Manyika, J., S. Lund, J. Bughin, J. Woetzel, K. Stamenov, and D. Dhingra (2016), Digital Globalization: The New Era of Global Flows. McKinsey Global Institute.
McKinsey Global Institute (2007), The ‘Bird of Gold’: The Rise of India’s Consumer Market. McKinsey & Company.
OECD Development Centre (2016), Economic Outlook for Southeast Asia, China and India 2016: Enhancing Regional Ties. Paris: Organisation for Economic Co-operation and Development.
Sudjana, B. (2016), ‘ASEAN Trade Facilitation Initiatives’, Symposium on the ASW and NSW, 18 September, ‘Session 4 Summary of Discussions and Recommendations’, 20 September, Jakarta, Indonesia.
Tijaja, J. (2017), ‘Good Regulatory Practice: Towards the ASEAN Economic Community 2025’. Presentation at the 3rd ASEAN–OECD GRPN Meeting and Workshops, 14 March, Iloilo City, Philippines.
UNCTAD (2017), Non-Tariff Measures in Mercosur: Deepening Regional Integration and Looking Forward. Geneva, Switzerland: UNCTAD.
Vinayak, H., F. Thompson, and O. Tonby (2014), Understanding ASEAN: Seven Things You Need to Know. McKinsey & Company, May.
World Bank (2016), World Development Report 2016. Washington, DC: The World Bank.