asia pacific fit-out cost guide - united kingdom/media/files/2017/project management/2016... ·...
TRANSCRIPT

ASIA PACIFICFIT-OUT COST GUIDE
Occupier Projects 2016/17 Edition

1CBRE PROJECT MANAGEMENT
FOREWORD
Martin WoodsSenior Managing Director, Asia Pacific CBRE Project ManagementGlobal Leadership & Platform
The evolution of the Asia Pacific Cost Guide into a more holistic guide was a natural progression from the “how much is it going to cost?” topic covered in 2014, to the “what solution will provide the best value?” focus point in 2015. To continue providing our clients with the best integrated service, in the 2016 edition we have addressed commercial office lifecycle costing through the modeling and regional comparisons of key common costs across capital expenses, operating expenses and leasing for Grade A buildings. Again, all the indices and tables provided are the result of analysis of empirical data from CBRE assignments covering the three major cost elements. As always, we are looking at ways to further improve this guide and provide you, the client, with the most relevant data to guide your real estate decisions so please let us have your feedback.
What is the holistic cost over the lifecycle of the corporate office?
CBRE TOKYO OFFICE

2 3ASIA PACIFIC FIT-OUT COST GUIDE CBRE PROJECT MANAGEMENT
CONTENTSINTRODUCTION 5
2016 APAC FIT-OUT COST INDEX 7
FIT-OUT COST BENCHMARKING TABLE 8
FIT-OUT COST TREND FROM 2014 TO 2016 11
LEASING 14
TYPICAL LEASE PERIOD 16
FACILITIES MANAGEMENT COST 18
NET PRESENT LIFECYCLE COSTING 22
ACTIVITY-BASED WORKING: FM COST CONSIDERATIONS 28
REGIONAL FIT-OUT COST ANALYSIS 30
2016 GLOBAL FIT-OUT COST INDEX 44
Disclaimer: CBRE Ltd has taken every care in the preparation of this document. The sources of information used are believed to be accurate and reliable, but no guarantee of accuracy or completeness can be given. The cost estimation are intended to be guides only. Please contact our market leaders, provided within this document or available from our cbre.com website, who can provide an accurate cost estimate based on your specific requirements. Neither CBRE, nor any director, representative or employee of CBRE company, accepts liability for any direct or consequential loss arising from the use of this document. The information and opinions contained in this document are subject to change without notice. No part or parts of this document may be stored in a retrieval system or reproduced or transmitted in reprographics, recording or otherwise, now known or to be devised without prior consent from CBRE.

4 5ASIA PACIFIC FIT-OUT COST GUIDE CBRE PROJECT MANAGEMENT
MACRO-ECONOMIC FACTORS INTRODUCTION
As currencies in APAC generally continue to slide against the USD at rates at least equal to, or greater than, domestic inflation, a pattern of falling cost would appear when reported in USD in all locations except Hong Kong (see Cost Trend, page 11). The cost of construction in local currencies however are showing gradual increase and need to be considered against revenue generated in the local market when making commercial office investment decisions. Pipeline projects should be identified considering lease expiry and changes in headcount, as well as macro and micro economic factors.
Source: CBRE Asia Pacific Research Jun 2016
Driving Dramatic ShiftsCurrency Volatility Inflation
2015-2017
2013-2015
0%
-2%
-3%
-4%
-7%
-7%
-10%
-10%
-11%
-17%
-24%
-24%
-29%
-29%
0.0%
-6.2%
-6.4%
-3.6%
-4.3%
-2.6%
-4.5%
-2.7%
-6.5%
-0.8%
-11.1%
1.7%
-5%
-5.1%
3.81%
1.73%
1.00%
2.82%
0.44%
2.82%
5.94%
0.25%
0.49%
0.76%
2.66%
1.78%
2.02%
6.58%
2.30%
2.26%
1.47%
2.85%
1.25%
2.67%
5.37%
0.49%
1.29%
0.87%
2.74%
0.25%
2.01%
4.05%
Hong Kong
China
South Korea
Vietnam
Taiwan
Philippines
India
Singapore
Thailand
New Zealand
Malaysia
Japan
Australia
Indonesia
Lifecycle costing guides businesses to make the most informed decision for their Real Estate investment strategy
2014Fit-out Cost
2015Fit-out, Leasing& ABW options
2016Lifecycle Costing
Guide Assumptions
• The commercial tower is a Grade A office building within the Central Business District with the following characteristics:
- A modern, flexible, column-free footprint of at least 15,000 square feet
- Total floor area of at least 300,000 square feet - Sheltered parking GFA ratio of 1/2000 - Accessibility to public transport• Commercial office assumptions: - Office size between 25,000 to 30,000 square feet. - Density range of 1 workstation to 90 to 110 square feet - Fixed 1-1 desk ratio• Fit-out costs include: - Consultants fees - Builders works - M&E works - Standard office FF&E - Structured cabling • Exclusions: - Telephony/IT/AV/Security equipment - Consideration for building abnormalities or variances such as
onerous landlord requirements
Additional Guide Assumptions for FM Costs
• Facility Management costs include: - Cleaning - Mechanical & Electrical Maintenance - Security Services - Utilities - Pest control - Mailroom - Reception - Landscaping - Confidential waste disposal• Exclusions: - Dedicated Chiller and Generator maintenance - Property Tax - Management Fee
As part of CBRE’s commitment to delivering advantage for all of our clients, we are delighted to present the third installment of CBRE’s Asia Pacific Cost Guide. The 2016 edition provides industry professionals with a point of reference for capital costs, operational expenditure, and leasing costs to make more informed decisions on real estate strategy. CBRE has gathered data and solicited feedback from a cross-section of clients to derive information that will affect today’s commercial real estate decisions To further develop the APAC Fit-Out Cost Guide we have tried to take a broader view which has enabled us to assess the cost of the facility through to the end of its lifecycle. We have termed this Net Present Lifecycle Costing and used the data obtained to create a Net Present Lifecycle Cost Index.
Zac Zdravev Senior Director, Asia Pacific CBRE Project Management Global Leadership & Platform

6 7ASIA PACIFIC FIT-OUT COST GUIDE CBRE PROJECT MANAGEMENT
HISTORIC FIT-OUT COST INDEX 2016 APAC FIT-OUT COST INDEX
2014 Cost Index
2015 Cost Index
Apart from some notable exceptions in inflation rates, foreign exchange volatility is still the main factor driving the dramatic shifts in the Asia Pacific Index. The index data is generated through the use of CBRE’s Project Management platform used for projects across Asia Pacific.
Despite the continued decline of JPY, award of the 2020 Tokyo Olympics buoyed the market and inspired confidence in the construction industry.
Riding the high demand for commodities from China, the AUD continued to perform well against the USD.
JPY hit a five-year low in June 2015.
AUD slide against the USD started in 2H 2014 & continued to drop until end of 2015.
1.27 1.20
1.18
1.17
1.12
1.06
1.04
1.00
0.98
0.98 0.96 0.95
0.86
0.83
0.82
0.82
0.78
0.77
0.62
0.56 0.52
Hong Kong
Seoul
Sydney
Tokyo
Perth
Auckland
Beijing
Shanghai
Melbourne
Singapore
Guangzhou Brisbane
Kuala Lumpur
Manila
Bangkok
Taipei
HCMC
Jakarta
Mumbai
Bangalore
Hyderabad
Disclaimer:This graph shows the capital expense multiplier for the design and construction of the same office project across Asia Pacific using Shanghai as the unit index. This index should be used as a guide only, for actual project budget estimates please contact the CBRE Project Management Division Lead in your city.
1.27 1.23
1.22
1.12
1.11
1.07
1.04 1.00
1.00 0.98
0.88
0.87
0.76
0.60
0.56 0.49
Tokyo Sydney
Seoul
Hong Kong
Singapore
Guangzhou
Beijing
Kuala Lumpur
Shanghai
Jakarta
Manila
Taipei
HCMC
Mumbai
Bangalore
Hyderabad
1.21 1.13
1.02
1.01
1.01
1.00
0.98 0.89
0.87 0.83 0.83
0.81
0.75
0.75
0.59 0.54
0.49
Seoul
Hong Kong
Beijing
Tokyo
Sydney
Shanghai
Guangzhou
Singapore
Kuala Lumpur Manila
Bangkok
Taipei
Jakarta
HCMC
Mumbai
Bangalore
Hyderabad

8 9ASIA PACIFIC FIT-OUT COST GUIDE CBRE PROJECT MANAGEMENT8 9ASIA PACIFIC FIT-OUT COST GUIDE CBRE PROJECT MANAGEMENT
FIT-OUT COST BENCHMARKING TABLE
10 11ASIA PACIFIC FIT-OUT COST GUIDE CBRE PROJECT MANAGEMENT
FIT-OUT COST BENCHMARKING TABLE
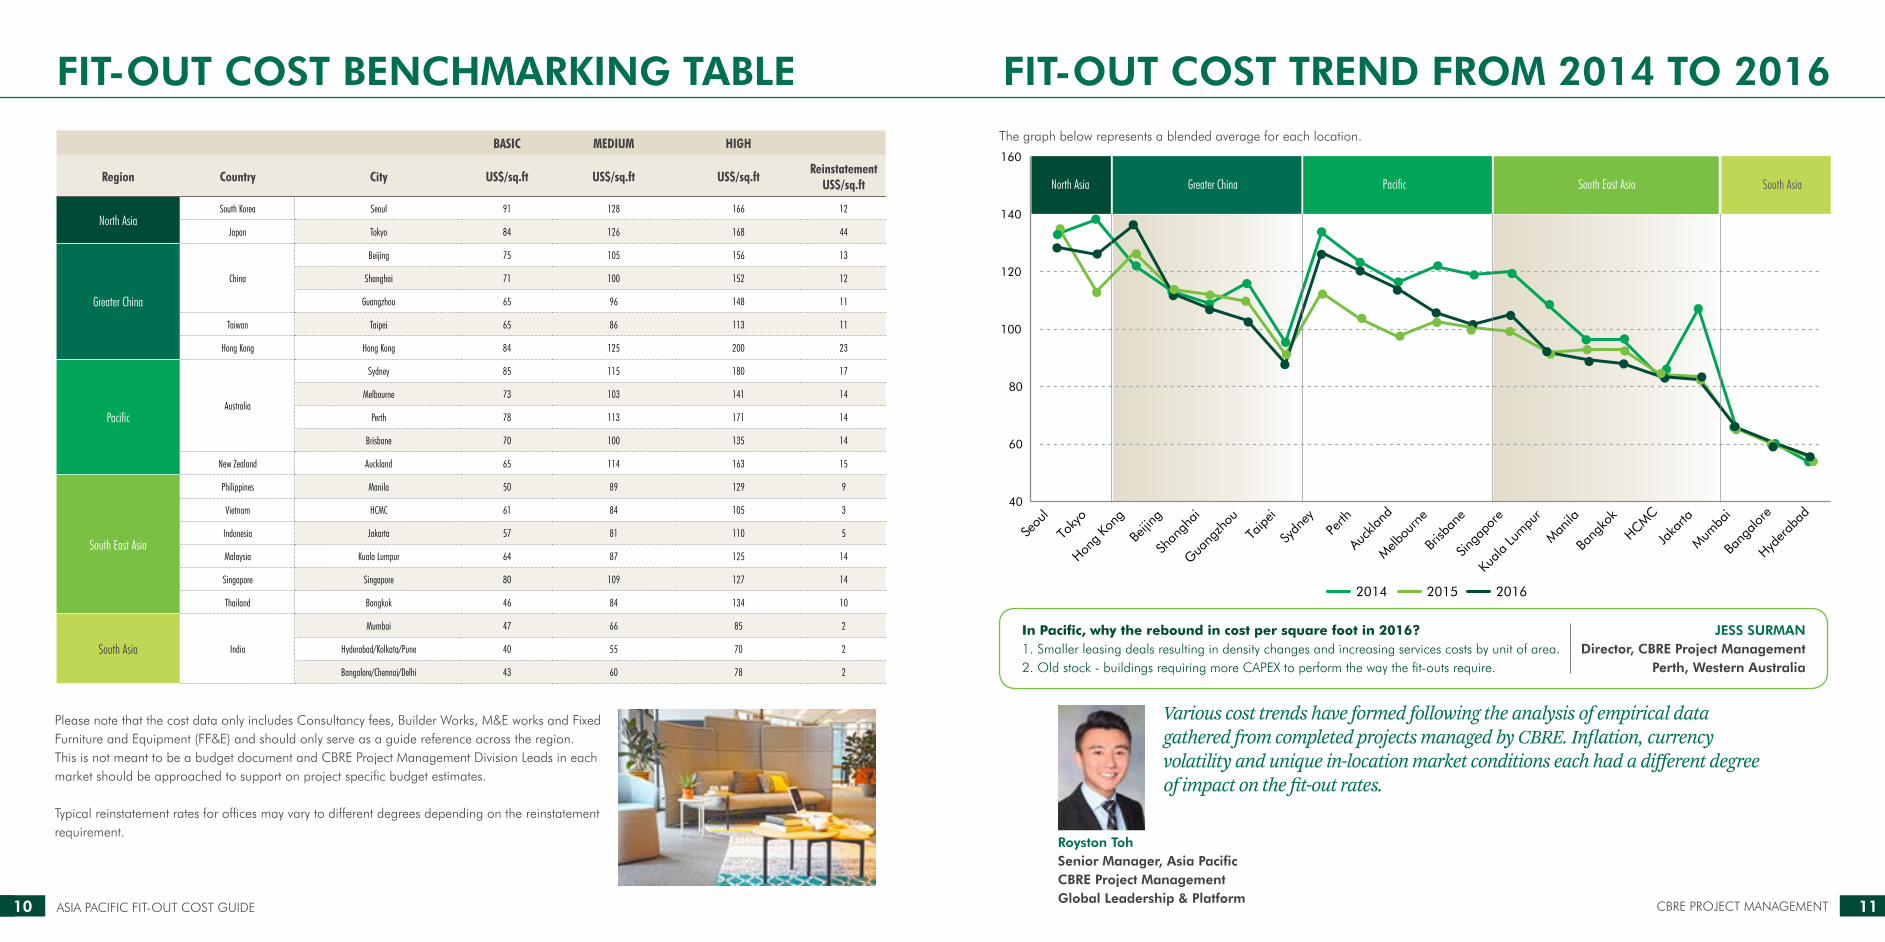
Please note that the cost data only includes Consultancy fees, Builder Works, M&E works and Fixed Furniture and Equipment (FF&E) and should only serve as a guide reference across the region. This is not meant to be a budget document and CBRE Project Management Division Leads in each market should be approached to support on project specific budget estimates.
Typical reinstatement rates for offices may vary to different degrees depending on the reinstatement requirement.
BASIC MEDIUM HIGH
Region Country City US$/sq.ft US$/sq.ft US$/sq.ftReinstatement
US$/sq.ft
North AsiaSouth Korea Seoul 91 128 166 12
Japan Tokyo 84 126 168 44
Greater China
China
Beijing 75 105 156 13
Shanghai 71 100 152 12
Guangzhou 65 96 148 11
Taiwan Taipei 65 86 113 11
Hong Kong Hong Kong 84 125 200 23
PacificAustralia
Sydney 85 115 180 17
Melbourne 73 103 141 14
Perth 78 113 171 14
Brisbane 70 100 135 14
New Zealand Auckland 65 114 163 15
South East Asia
Philippines Manila 50 89 129 9
Vietnam HCMC 61 84 105 3
Indonesia Jakarta 57 81 110 5
Malaysia Kuala Lumpur 64 87 125 14
Singapore Singapore 80 109 127 14
Thailand Bangkok 46 84 134 10
South Asia India
Mumbai 47 66 85 2
Hyderabad/Kolkata/Pune 40 55 70 2
Bangalore/Chennai/Delhi 43 60 78 2
Various cost trends have formed following the analysis of empirical data gathered from completed projects managed by CBRE. Inflation, currency volatility and unique in-location market conditions each had a different degree of impact on the fit-out rates.
Royston TohSenior Manager, Asia PacificCBRE Project ManagementGlobal Leadership & Platform
FIT-OUT COST TREND FROM 2014 TO 2016
2014 2015 2016
40
60
80
100
120
140
160
North Asia Greater China South AsiaSouth East AsiaPacific
Seou
l
Toky
o
Beijin
g
Shan
ghai
Guang
zhou
Taipe
i
Hong
Kong
Sydn
ey
Melbou
rne
Perth
Brisb
ane
Auck
land
Manila
Jaka
rta
Kuala
Lum
pur
Singa
pore
Bang
kok
HCMC
Mumba
i
Hyder
abad
Bang
alore
In Pacific, why the rebound in cost per square foot in 2016?1. Smaller leasing deals resulting in density changes and increasing services costs by unit of area. 2. Old stock - buildings requiring more CAPEX to perform the way the fit-outs require.
JESS SURMANDirector, CBRE Project Management
Perth, Western Australia
The graph below represents a blended average for each location.

12 13ASIA PACIFIC FIT-OUT COST GUIDE CBRE PROJECT MANAGEMENT
PROJECT STANDARD
Description of items Basic Medium High
BASIC OFFICE FUNCTIONALITY
Elaborate Pantry and Breakout Areas
Basic Pantry fit-out
Very open office layout
M&E Redundancy N N+1 2N
MEETING ROOMS
Integrated A/V and lighting control
Basic A/V
Projector & Audio/Telephone
Tables and Chairs only
SECURITY
Min. 3 levels of security
1 level of security
No electronic security
WALL & PARTITIONS
Plasterboard with fabric finish / to slab with high acoustic rating)
Double glazed partition
Single glazed partition
Plasterboard walls
FLOOR FINISHES
Marble/Stone Slab Finishes
Carpet Tile
Vinyl Sheets or basic concrete screed finishes
PROJECT STANDARD
Description of items Basic Medium High
SYSTEM FURNITURE
Flexibility in Workspace Churn & Expansion
Powerhoop as an Uninterrupted Footprint Division
Resolved Design & Seamless Connectivity
Simplicity with reduced kit-of-parts
Unified look and combined usage
Cable trough and various cable outlet application
TASK CHAIRS
Asymmetrical lumbar support system
Pelvic support
4-D arms and seat pan adjustments
Upright back lock
Supportive Mesh with tension zones
Synchronized tilt mechanism
Supportive Mesh with optional upholstery back
PROJECT STANDARD MATRIX

14 15ASIA PACIFIC FIT-OUT COST GUIDE CBRE PROJECT MANAGEMENT
LEASING
While headline rental rates remain a critical component for any office user, we are witnessing an increased emphasis placed on a more holistic understanding of occupancy factors including how location, fit-out, FM cost and workplace program can support and drive corporate objectives.
Manish Kashyap Regional Managing Director, Asia Pacific Brokerage
Leasing wheel – Prime Rent
Leasing wheel – Grade A
257
174
148
118
106
92
81 78
71 62 62 59 57 47
45 39 39 35
33 31 31
Hong Kong Beijing
Tokyo
Shanghai
Delhi
Singapore
Mumbai
Sydney
Seoul
HCMC Jakarta Guangzhou
Taipei
Brisbane
Perth
Gurgaon
Melbourne
Auckland
Bangalore
Bangkok
Manila
117 116
99
85
85
70
63
53 43
42 41 40 39 39
38 35 30 29 27 27
24 20
11
Beijing Tokyo
Hong Kong
Singapore
Shanghai
Delhi
Mumbai
Seoul
Brisbane
Taipei
Jakarta HCMC Perth
Guangzhou
Sydney
Melbourne
Bangkok
Auckland
Gurgaon
Bangalore
Manila
Kuala Lumpur
Hyderabad
CBRE ORLANDO OFFICE
The graph below provides the leasing costs per sq ft in USD for Prime and Grade A building in each market.
16 17ASIA PACIFIC FIT-OUT COST GUIDE CBRE PROJECT MANAGEMENT
TYPICAL LEASE PERIOD
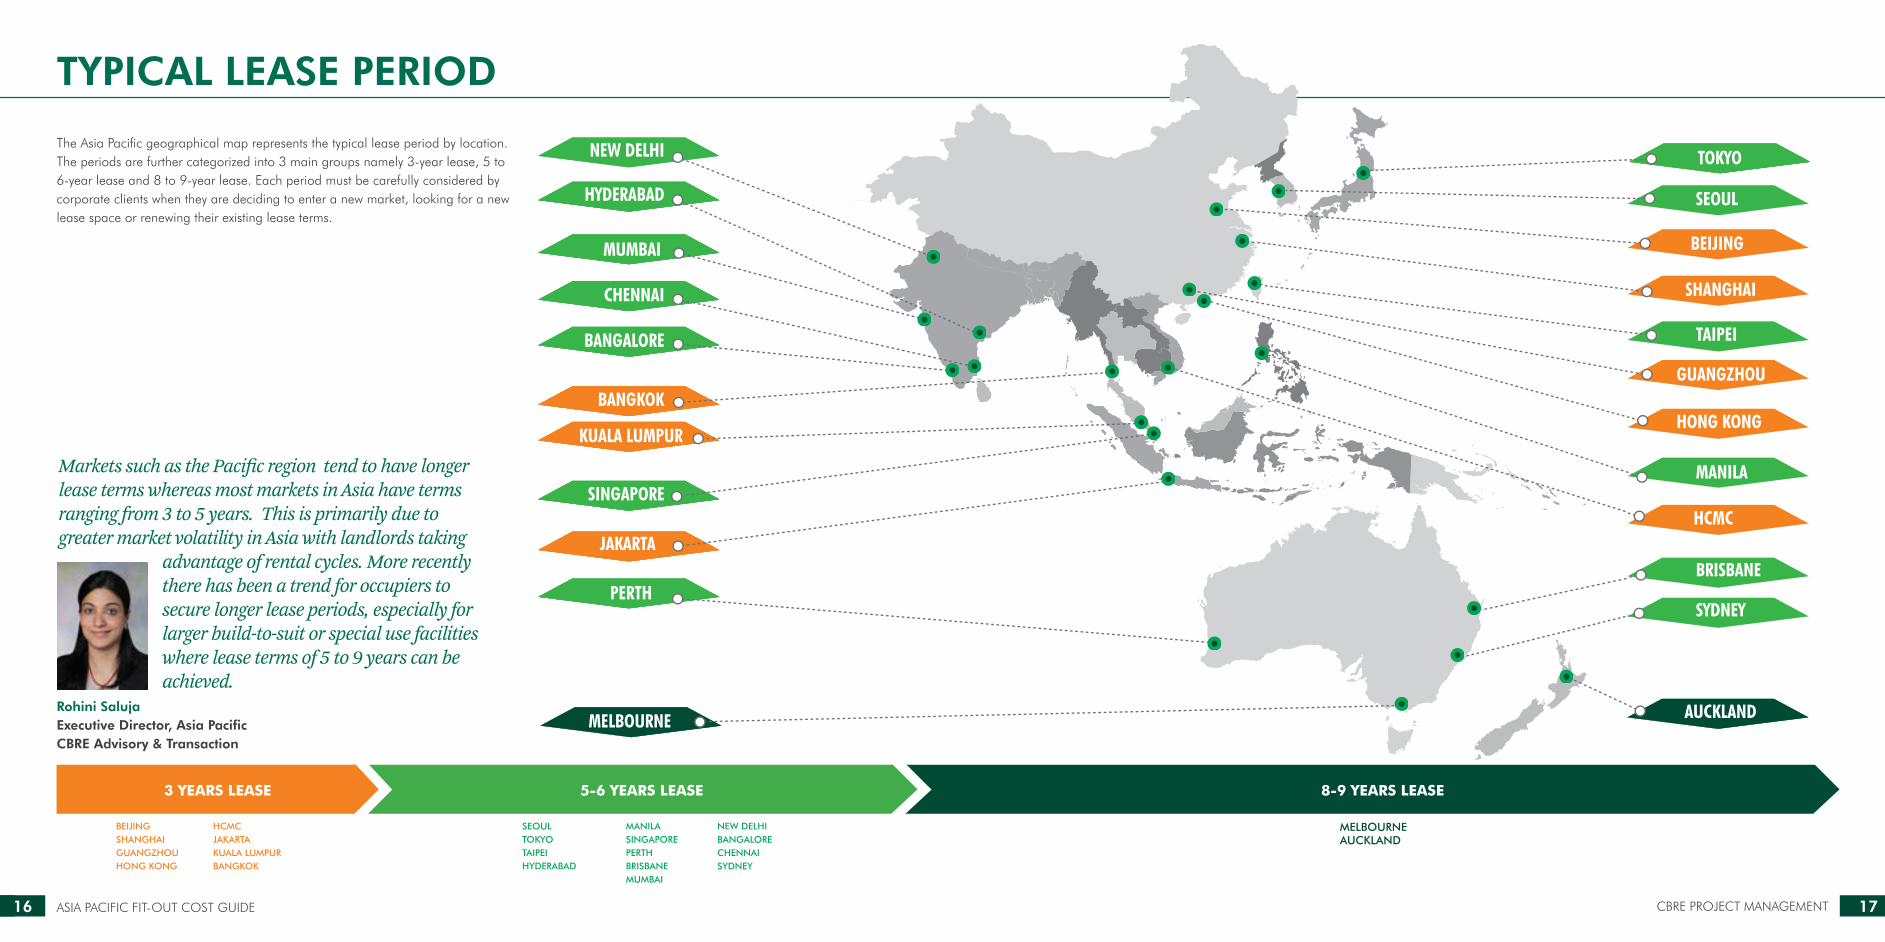
The Asia Pacific geographical map represents the typical lease period by location. The periods are further categorized into 3 main groups namely 3-year lease, 5 to 6-year lease and 8 to 9-year lease. Each period must be carefully considered by corporate clients when they are deciding to enter a new market, looking for a new lease space or renewing their existing lease terms.
3 YEARS LEASE 5-6 YEARS LEASE 8-9 YEARS LEASE
BEIJINGSHANGHAIGUANGZHOUHONG KONG
SEOULTOKYOTAIPEIHYDERABAD
MELBOURNEAUCKLAND
MANILASINGAPOREPERTHBRISBANEMUMBAI
HCMCJAKARTAKUALA LUMPURBANGKOK
NEW DELHIBANGALORECHENNAISYDNEY
Markets such as the Pacific region tend to have longer lease terms whereas most markets in Asia have terms ranging from 3 to 5 years. This is primarily due to greater market volatility in Asia with landlords taking
advantage of rental cycles. More recently there has been a trend for occupiers to secure longer lease periods, especially for larger build-to-suit or special use facilities where lease terms of 5 to 9 years can be achieved.
TOKYO
MUMBAI
SINGAPORE
NEW DELHI
BANGALORE
CHENNAI
HYDERABAD
HCMC
PERTH
BANGKOK
JAKARTA
KUALA LUMPUR
SEOUL
MANILA
SYDNEY
BRISBANE
MELBOURNE
SHANGHAI
BEIJING
GUANGZHOU
HONG KONG
AUCKLAND
TAIPEI

18 19ASIA PACIFIC FIT-OUT COST GUIDE CBRE PROJECT MANAGEMENT18 19ASIA PACIFIC FIT-OUT COST GUIDE CBRE PROJECT MANAGEMENT
FACILITIES MANAGEMENT COST
CBRE MADRID OFFICE

20 21ASIA PACIFIC FIT-OUT COST GUIDE CBRE PROJECT MANAGEMENT
FACILITIES MANAGEMENT COST
Key Components
CLEANING SECURITY SERVICES
CONFIDENTIAL WASTE MECHANICAL & ELECTRICAL MAINTENANCE
PESTS CONTROL
UTILITIES
LANDSCAPING MAILROOM RECEPTION
The operating cost of a corporate office is defined as the Facilities Management (FM) cost in this document. The FM cost shall be
FM Industry professionals would concur that benchmarking spend across markets and industries is a challenging exercise due to the numerous variables included within the spend categories. However, what it does allow us to do is to identify anomalies and question further the operating expenses we manage.
Cameron Ahrens Executive Director, Asia Pacific CBRE Enterprise Facilities Management
The graph below indicates the unit rates per sqft in USD for various components annually. Rates in different locations are directly affected by the labor market condition and local tariff rates.
classified into 9 key components namely, cleaning, M&E maintenance, pest control, security services, utilities, mailroom, confidential
waste, landscaping and reception. Depending on the facility, the cost may differ on the final service standard adopted by the client.
Guide Assumptions for FM cost
• The commercial tower is a Grade A office building within the Central Business District with the following characteristics:
- A modern, flexible, column-free footprint of at least 15,000 square feet
- Total floor area of at least 300,000 square feet • Commercial office assumptions: - Office size between 25,000 to 30,000 square feet. - Density range of 1 workstation to 90 to 110 square feet - Fixed 1-1 desk ratio
• Facility Management costs include: - Cleaning - Mechanical & Electrical Maintenance - Security Services - Utilities - Pest control - Mailroom - Reception - Landscaping - Confidential waste disposal
• Exclusions: - Dedicated Chiller and generator maintenance - Property Tax - Management fee
CLEANING SECURITY SERVICES PESTS CONTROL LANDSCAPING
RECEPTION CONFIDENTIAL WASTEMAILROOM M&E UTILITIES
11..3344
11..6622
11..2255
22..1111
11..2211
11..1122
11..0088
11..2255
11..3311
11..3355
11..1111
11..0077
00..9966
11..5555
00..8877
11..1133
00..9922
00..8866
00..7788
00..7722
00..9911
11..0055
00..8844
00..5588
00..8811
00..7755
00..7733
00..8888
00..3399
00..3399
00..8877
00..8833
00..7755
11..1111
00..3311
00..4400
00..4400
00..4455
00..4411
00..3388
11..6622
11..4488
11..5555
11..6622
11..4444
11..5555
11..5555
11..6622
11..3333
11..3300
00..9977
11..0044
11..0044
00..8866
00..8866
00..8866
00..8866
00..6655
00..6655
00..6688
11..8800
11..6644
11..7722
11..8800
11..6600
11..7722
11..7722
11..8800
11..4488
11..4444
11..0088
11..1166
11..1166
00..9966
00..9966
00..9966
00..9966
00..7722
00..7722
00..7766
22..2255
22..0033
22..0099
11..9922
22..0022
11..8877
11..8800
11..4455
11..6644
22..0077
11..8877
11..7799
11..6622
11..4400
11..9922
00..5511
00..6666
00..7755
00..6699
00..6633
11..6611
11..2233
11..5500
00..8844
11..4455
11..3344
11..2299
00..9988
11..4499
00..8899
11..4455
11..3399
11..2255
00..8800
11..3300
00..8888
00..7766
00..8855
00..7788
00..7722 0.00 1.00 2.00 3.00 4.00 5.00 6.00 7.00 8.00 9.00 10.00
Sydney
Singapore
Perth
Tokyo
Auckland
Melbourne
Brisbane
Seoul
Hong Kong
Taipei
Beijing
Shanghai
Guangzhou
Jakarta
Kuala Lumpur
Bangkok
Manila
Mumbai
Bangalore
Hyderabad
99..7755
99..2266
99..1177
99..0077
88..7744
77..5566
66..8877
66..3388
44..1133
33..9977
44..3399
44..6677
44..8866
66..9966
77..4488
77..6622
77..8811
88..1166
88..3355
88..5555

22 23ASIA PACIFIC FIT-OUT COST GUIDE CBRE PROJECT MANAGEMENT
NET PRESENT LIFECYCLE COSTING
22 23ASIA PACIFIC FIT-OUT COST GUIDE CBRE PROJECT MANAGEMENT
CBRE TOKYO OFFICE

24 25ASIA PACIFIC FIT-OUT COST GUIDE CBRE PROJECT MANAGEMENT
NET PRESENT LIFECYCLE COSTING
Assumptions: Grade A office building and defined as the gross lease cost. Medium standard office fit-out construction rates. FM cost will be adopting the CBRE Research y-o-y inflation rates and the discount rate for NP analysis is 10%.
The below graph indicates the NPLCC proportion percentage between the 4 main cost components of the corporate real estate.
Corporate Real Estate needs to take into account the total cost of an asset when presenting the cost/benefit analysis to the business for real estate decisions. CBRE has provided a holistic cost guide as well as Workplace solutions to support corporate objectives.
The CBRE termed Net Present Lifecycle Costing (NPLCC) is an index that assumes a typical 5 year investment time frame and not necessarily the lease period. NPLCC is a guide that benchmarks potential capital and operating expenses across the region over the investment period brought forward to present value. NPLCC provides holistic cost data to clients, enabling informed decisions and guides real estate strategies.
Nick LeeRegional Director, Asia PacificCBRE Project ManagementGlobal Leadership & Platform
FIT-OUT COST LEASING COST FM COST REINSTATEMENT NPLCC
(USD/Sqft)
673
635
588
511
495
392
372
351
327
325
325
301
297
295
286
282
237
216
207
193
193
121 $55
$60
$60
$87
$89
$84
$114
$81
$103
$96
$86
$100
$113
$115
$66
$60
$128
$100
$109
$125
$105
$126
$46
$113
$113
$83
$100
$125
$121
$171
$146
$163
$175
$179
$163
$158
$263
$292
$221
$354
$354
$413
$488
$484
$18
$19
$19
$28
$20
$21
$37
$31
$37
$30
$32
$36
$40
$42
$20
$19
$35
$32
$39
$34
$33
$38
$0 $100 $200 $300 $400 $500 $600 $700
Hyderabad
Gurgaon
Bangalore
Kuala Lumpur
Manila
Bangkok
Auckland
Jakarta
Melbourne
Guangzhou
Taipei
Brisbane
Perth
Sydney
Mumbai
Delhi
Seoul
Shanghai
Singapore
Hong Kong
Beijing
Tokyo
46% 31% 31%
41% 36% 40% 28%
42% 35% 32% 29%
35% 35% 31% 19% 16%
33% 20% 21% 21% 17% 19%
38% 58% 58%
46% 53% 43% 60%
40% 49% 55% 58% 50% 48% 55% 75% 78%
56% 72% 69% 70% 77% 72%
15% 10% 10% 9% 9% 13% 11% 13% 13% 10% 11% 12% 13% 11%
6% 5% 9% 7% 8% 6% 5% 6%
Hyder
abad
Gurgaon
Bangalore
Manila
Bangkok
Auckl
and
Jaka
rta
Kuala
Lum
pur
Mel
bourn
e
Guangzh
ou
Taip
ei
Perth
Sydney
Brisbane
Mum
bai
Delhi
Seou
l
Shanghai
Singapor
e
Hong K
ong
Beijin
g
Toky
o
FIT-OUT COST LEASING COST FM COST REINSTATEMENT

26 27ASIA PACIFIC FIT-OUT COST GUIDE CBRE PROJECT MANAGEMENT
1.361.28
1.19
1.03
1.00
0.79
0.75
0.71
0.66
0.66 0.66 0.61 0.60
0.60 0.58
0.57
0.48
0.44
0.42 0.39
0.39 0.24
Tokyo Beijing
Hong Kong
Singapore
Shanghai
Seoul
Delhi
Mumbai
Brisbane
Sydney
Perth
Taipei Guangzhou
Melbourne
Jakarta
Auckland
Bangkok
Manila
Kuala Lumpur
Bangalore
Gurgaon
Hyderabad
Through collaboration and extensive data mining from our integrated services, CBRE is able to provide our clients a concise index and representation of the major cost considerations for their commercial office investment. The NPLCC provides clients with the advantage of understanding the full cost over the total lease period. This together with the labour analytics can help develop real estate strategies that support corporate objectives.
Royston TohSenior Manager, Asia PacificCBRE Project ManagementGlobal Leadership & Platform
NET PRESENT LIFECYCLE COSTING
CBRE BALTIMORE OFFICE
28 29ASIA PACIFIC FIT-OUT COST GUIDE CBRE PROJECT MANAGEMENT
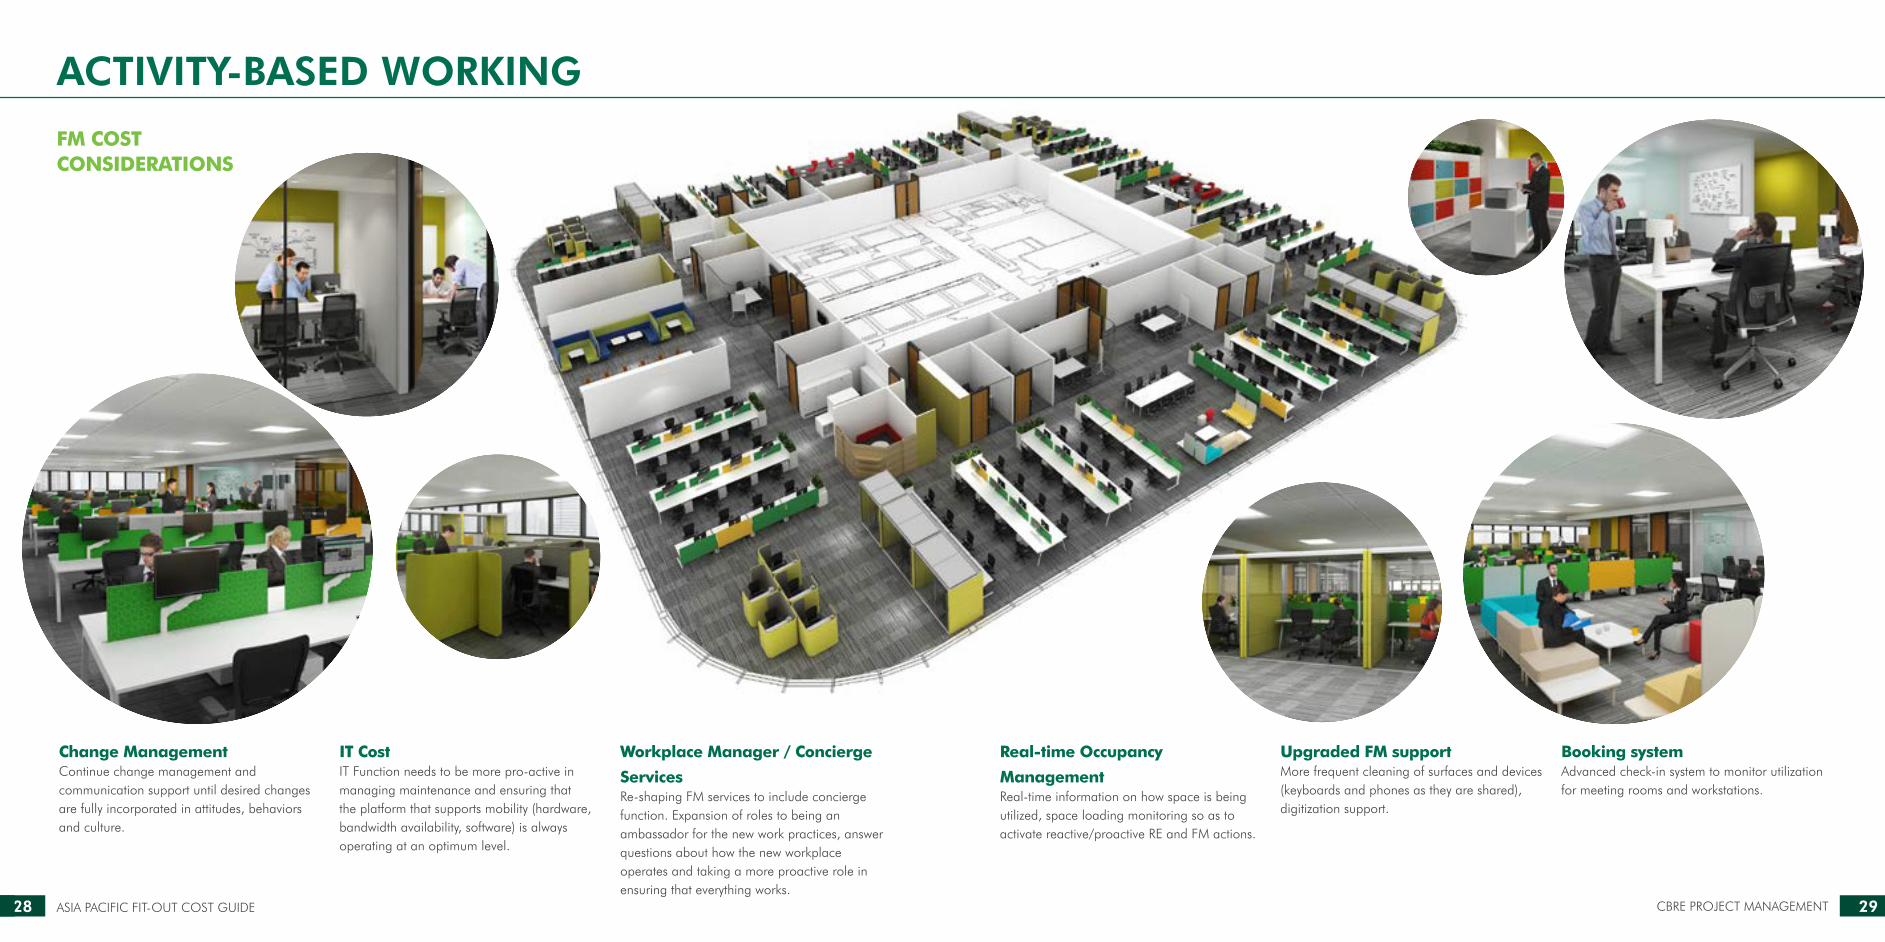
ACTIVITY-BASED WORKING
FM COST CONSIDERATIONS
Change Management Continue change management and communication support until desired changes are fully incorporated in attitudes, behaviors and culture.
Real-time Occupancy
Management Real-time information on how space is being utilized, space loading monitoring so as to activate reactive/proactive RE and FM actions.
IT Cost IT Function needs to be more pro-active in managing maintenance and ensuring that the platform that supports mobility (hardware, bandwidth availability, software) is always operating at an optimum level.
Upgraded FM support More frequent cleaning of surfaces and devices (keyboards and phones as they are shared), digitization support.
Workplace Manager / Concierge
Services Re-shaping FM services to include concierge function. Expansion of roles to being an ambassador for the new work practices, answer questions about how the new workplace operates and taking a more proactive role in ensuring that everything works.
Booking system Advanced check-in system to monitor utilization for meeting rooms and workstations.

30 31ASIA PACIFIC FIT-OUT COST GUIDE CBRE PROJECT MANAGEMENT
REGIONAL FIT-OUT COST ANALYSIS
30 31ASIA PACIFIC FIT-OUT COST GUIDE CBRE PROJECT MANAGEMENT

32 33ASIA PACIFIC FIT-OUT COST GUIDE CBRE PROJECT MANAGEMENT
JAPAN COST ANALYSIS – TOKYO TAIWAN COST ANALYSIS – TAIPEI
SOUTH KOREA COST ANALYSIS – SEOUL HONG KONG COST ANALYSIS
TOKYO Tokyo continues to see strong demand from companies looking to expand their footprint or upgrade to better buildings. However, some tenants began to delay decisions ahead of the large volume of supply due for completion from 2018 onwards. Landlords of buildings that have been less successful in letting space started to offer more flexible terms.
TAIPEIOffice investment volume surged mainly driven by solid activity from owner-occupiers. Despite the surge in total investment turnover, the number of transactions remained low, reflecting the ongoing lack of investable office assets. On the other hand, owners-occupiers continue to benefit from low interest rates after the Central Bank cut policy rates.
SEOULDemand from the co-working sector is steadily rising. More firms are considering implementing workplace strategy, partly from a cost saving and space efficiency angle. A number of firms have already implemented measures such as hot desking and smart offices.
HONG KONGServiced office and co-working space providers continued to register solid demand for space. Decentralisation activity is expected to increase as secondary space and new supply in areas such as Kowloon East provides options for occupiers currently in expensive submarkets.
Hisanao KajiuraSenior DirectorTokyo Project Management+81 3 [email protected]
Bruce LeeSenior Director South Korea Project Management+822 21705870
Basic Medium High
15% 12% 8%
45%
25%
15%
45%
23%
20%
40%
32%
20%
US$91
US$128
US$166 FurnitureM&E WorksBuilder WorksSoft Cost
seoul
mumbai
James HoSenior DirectorTaiwan Project Management+886 2 77069538
Steve PalfreySenior Director Hong Kong Project Management+852 28202996
Basic Medium High
13% 10% 8%
34%
38%
15%
33%
38%
19%
35%
36%
21%
US$84
US$125
US$200FurnitureM&E WorksBuilder WorksSoft Cost
Basic Medium High
9% 8% 7%
43%
29%
19%
44%
29%
19%
44%
30%
19%
US$65
US$86
US$113FurnitureM&E WorksBuilder WorksSoft Cost
Basic Medium High
13% 10% 8%
34%
37%
16%
33%
39%
18%
36%
39%
17%
US$84
US$126
US$168FurnitureM&E WorksBuilder WorksSoft Cost
Tokyo
shanghai

34 35ASIA PACIFIC FIT-OUT COST GUIDE CBRE PROJECT MANAGEMENT
Basic Medium High
18% 13% 10%
28%
34%
20%
29%
37%
21%
31%
40%
19%
US$75
US$105
US$156FurnitureM&E WorksBuilder WorksSoft Cost
beijing
hyderabad/kolkata/pune
CHINA COST ANALYSIS – BEIJING/GUANGZHOU
CHINA COST ANALYSIS – SHANGHAI
BEIJINGBeijing saw stronger demand from domestic companies but the general focus among multinationals continued to be on cost saving or renewals. The period saw some surrender leases and relocations to cheaper areas.
Catherine XiongSenior DirectorChina Project Management+86 10 [email protected]
FurnitureM&E WorksBuilder WorksSoft Cost
guangzhou
new delhi/bangalore/chennai
Basic Medium High
18% 11% 10%
33%
36%
13%
33%
37%
19%
34%
37%
19%
US$65
US$96
US$148
GUANGZHOU
SHANGHAIShanghai enjoyed a positive quarter as market sentiment remained positive. Solid leasing demand was recorded across a wide range of sectors but occupiers took longer to make decisions due to the introduction of the new VAT.
Bahtiyar TaySenior DirectorChina Project Management+86 21 24011403
bahtiyar.tay@ cbre.com.cn
shanghai
shanghai
Basic Medium High
17% 14% 10%
28%
35%
20%
28%
38%
20%
29%
41%
20%
US$71
US$100
US$152FurnitureM&E WorksBuilder WorksSoft Cost

36 37ASIA PACIFIC FIT-OUT COST GUIDE CBRE PROJECT MANAGEMENT
INDIA COST ANALYSIS – MUMBAI/ HYDERABAD/PUNE/KOLKATA
INDIA COST ANALYSIS – NEW DELHI/ BANGALORE/CHENNAI
MUMBAICo-working space is gaining traction, with several new openings in Bangalore and Mumbai in recent quarters. Most providers are domestic operators focusing on catering to start-ups. Among domestic firms, particularly those in the financial services sector, there is still a strong focus on acquiring properties for self-use,especially in Mumbai.
HYDERABAD/ KOLKATA/ PUNERecent quarters have seen stronger leasing activity in Hyderabad which offers lower rents and isemerging as an alternative to Bangalore. The city was the country’s original IT hub and is returning to prominence after an end to several years of political instability.
Gurjot BhatiaManaging Director India Project Management+91 1142490200
mumbai
mumbai
Basic Medium High
14% 13% 11%
28%
42%
16%
29%
44%
14%
30%
44%
15%
US$47
US$66
US$85FurnitureM&E WorksBuilder WorksSoft Cost
hyderabad/kolkata/pune
hyderabad/kolkata/pune
Basic Medium High
20% 19% 18%28%
40%
12%
28%
40%
13%
28%
41%
13%
US$40
US$55
US$70FurnitureM&E WorksBuilder WorksSoft Cost
new delhi/bangalore/chennai
new delhi/bangalore/chennai
Basic Medium High
17% 14% 12%
28%
42%
13%
29%
43%
14%
30%
44%
14%
US$43
US$60
US$78FurnitureM&E WorksBuilder WorksSoft Cost
NEW DELHI/ BANGALORE/ CHENNAINew Delhi is still registering solid demand for front office space, activities mainly focus onGurgaon, where IT companies are particularly active. Many companies in Bangalore have capped their growth as city centre rents are quite high.

38 39ASIA PACIFIC FIT-OUT COST GUIDE CBRE PROJECT MANAGEMENT
SOUTH EAST ASIA COST ANALYSIS – SINGAPORE/KUALA LUMPUR
SOUTH EAST ASIA COST ANALYSIS – VIETNAM/BANGKOK
SINGAPOREProviders of co-working space are emerging as a new driver of demand. Recent quarters have seen several major operators pre-commit to new space. Traditional serviced office providers are responding by offering similar product. Landlords are responding to weak demand by being creative to retain tenants such as by providing a capital contribution towards fit-out costs and other incentives.
HCMCThe unchanged supply in office space allowed HCMC office market to absorb the remaining space in both Grade A and B. However, by the end of 2016, there will be a new wave of supply in decentralized area, expecting the market to change in both rent and vacancy rate.
BANGKOK The current market condition of low vacancy rates and rising rents is expected to continue due to the limited future supply with reasonable level of demand in the next few years. However, after 2018, the market condition could change if all the planned office developments (1 million sq. m.) were to start at the same time.
HANOILarge-scale office buildings are being actively fitted out for launch, which will add up both grade A and B stocks. This is expected to put downward pressure on rents.
singapore
FurnitureM&E WorksBuilder WorksSoft Cost
Basic Medium High
10% 7% 6%34%
40%
16%
33%
40%
20%
36%
38%
20%
US$80
US$109
US$127
Basic Medium High
11% 9% 7%
32%
40%
17%
31%
38%
22%
32%
38%
23%
US$64
US$87
US$125
KL
FurnitureM&E WorksBuilder WorksSoft Cost
KUALA LUMPURThe coming few years will continue to be a tenants’ market with more quality office space available in the market and owners/investors may experience stiff competition in retaining existing tenants or leasing out new space. Prime rentals are expected stay stable, but may see a dip in occupancy rates with the increase competitiveness.
Basic Medium High
10% 8% 7%
30%
38%
22%
27%
37%
28%
27%
35%
31%
US$61
US$84
US$105FurnitureM&E WorksBuilder WorksSoft Cost
Garth ChapmanSenior DirectorSEA Project Management+65 62291114
Basic Medium High
12% 8% 6%
35%
38%
15%
36%
39%
17%
39%
39%
16%
US$46
US$84
US$134FurnitureM&E WorksBuilder WorksSoft Cost
40 41ASIA PACIFIC FIT-OUT COST GUIDE CBRE PROJECT MANAGEMENT
SOUTH EAST ASIA COST ANALYSIS – JAKARTA/MANILA
PACIFIC COST ANALYSIS – SYDNEY/MELBOURNE
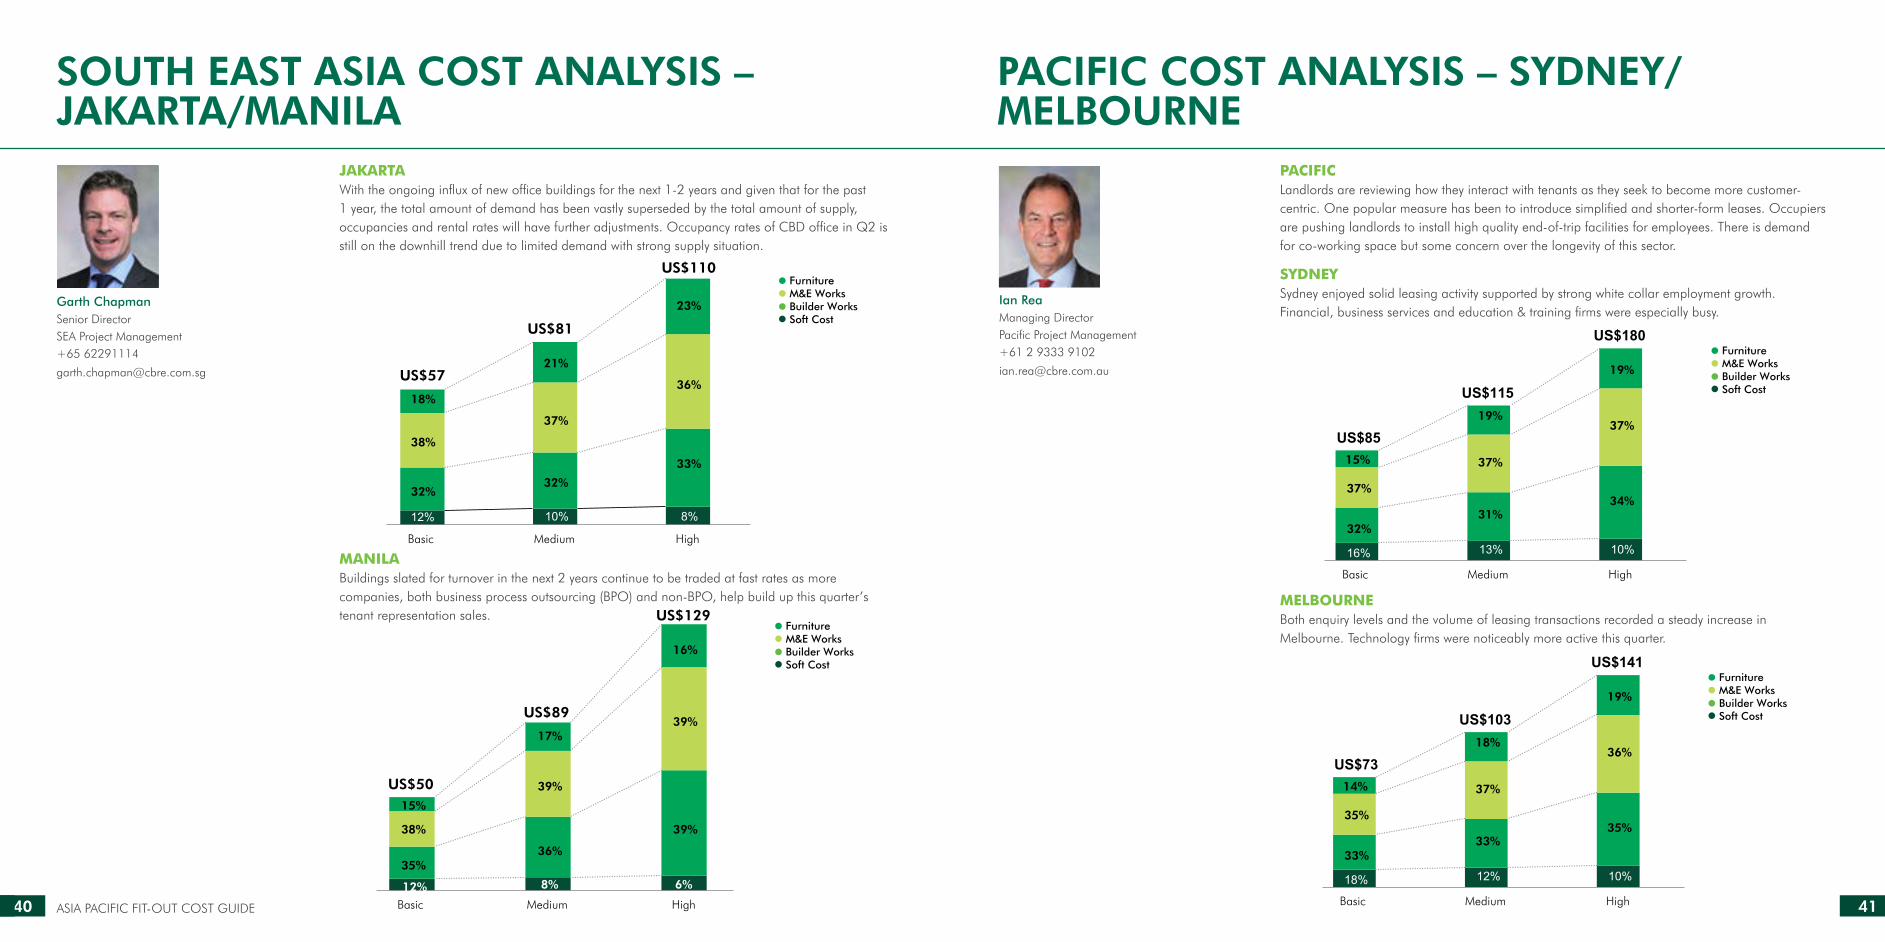
JAKARTAWith the ongoing influx of new office buildings for the next 1-2 years and given that for the past 1 year, the total amount of demand has been vastly superseded by the total amount of supply, occupancies and rental rates will have further adjustments. Occupancy rates of CBD office in Q2 is still on the downhill trend due to limited demand with strong supply situation.
MANILABuildings slated for turnover in the next 2 years continue to be traded at fast rates as more companies, both business process outsourcing (BPO) and non-BPO, help build up this quarter’s tenant representation sales.
PACIFICLandlords are reviewing how they interact with tenants as they seek to become more customer-centric. One popular measure has been to introduce simplified and shorter-form leases. Occupiers are pushing landlords to install high quality end-of-trip facilities for employees. There is demand for co-working space but some concern over the longevity of this sector.
MELBOURNEBoth enquiry levels and the volume of leasing transactions recorded a steady increase in Melbourne. Technology firms were noticeably more active this quarter.
SYDNEYSydney enjoyed solid leasing activity supported by strong white collar employment growth. Financial, business services and education & training firms were especially busy.
Basic Medium High
12% 10% 8%
32%
38%
18%
32%
37%
21%
33%
36%
23%
US$57
US$81
US$110
jakarta
FurnitureM&E WorksBuilder WorksSoft Cost
manila
Basic Medium High12% 8% 6%
35%
38%
15%
36%
39%
17%
39%
39%
16%
US$50
US$89
US$129FurnitureM&E WorksBuilder WorksSoft Cost
Ian ReaManaging DirectorPacific Project Management+61 2 9333 9102
Basic Medium High
16% 13% 10%
32%
37%
15%
31%
37%
19%
34%
37%
19%
US$85
US$115
US$180FurnitureM&E WorksBuilder WorksSoft Cost
Garth ChapmanSenior DirectorSEA Project Management+65 62291114
FurnitureM&E WorksBuilder WorksSoft Cost
Basic Medium High
18% 12% 10%
33%
35%
14%
33%
37%
18%
35%
36%
19%
US$73
US$103
US$141

42 43ASIA PACIFIC FIT-OUT COST GUIDE CBRE PROJECT MANAGEMENT
PACIFIC COST ANALYSIS – BRISBANE/PERTH PACIFIC COST ANALYSIS – AUCKLANDAUCKLAND
Ian ReaManaging DirectorPacific Project Management+61 2 9333 9102
FurnitureM&E WorksBuilder WorksSoft Cost
Basic Medium High
16% 12% 11%
33%
37%
14%
32%
36%
20%
32%
36%
21%
US$70
US$100
US$135
FurnitureM&E WorksBuilder WorksSoft Cost
Basic Medium High
17% 16% 13%
32%
34%
17%
31%
35%
18%
33%
35%
19%
US$78
US$113
US$171
FurnitureM&E WorksBuilder WorksSoft Cost
Basic Medium High
23% 20% 17%
40%
27%
10%
38%
30%
12%
36%
32%
15%
US$65
US$114
US$163
BRISBANEBrisbane continued to see a certain degree of uncertainty but the worst appears to be over. Leaseexpiries are driving deals. More companies are taking smaller spaces and/or moving to a flexibleworking environment.
PERTHIn Perth the period saw flight to quality across all sectors driven by expiring leases. Occupiers in thismarket are taking advantage of landlords’ weakness to secure attractive deals.

44 45ASIA PACIFIC FIT-OUT COST GUIDE CBRE PROJECT MANAGEMENT
2016 GLOBAL FIT-OUT COST INDEX
The 2016 edition cost guide included the global cost index to benchmark similar projects in key markets across the globe. For more detailed breakdown by cities within the region, please refer to the respective regional cost guides.
CBRE hope that this can guide corporate clients to review the cost globally but would appreciate that a CBRE professional is engaged in-location to support in producing a more specific budget estimate for any form of budgetary approval
purposes. The index wheel should not be replicated or adopted for other documentation without direct consultation with CBRE.
1.25
1.20
1.11
1.02
1.00 0.92
0.91
0.84
0.55
New York City
Frankfurt
Hong Kong
Sydney
London Los Angeles
Mexico City
Sao Paulo
Bangalore

KEY CONTACTSCBRE CONTACTS
Martin WoodsSenior Managing Director,CBRE Project Management, Asia Pacific+852 2820 [email protected]
Zac Zdravev Senior DirectorCBRE Project Management, Asia Pacific+65 6326 [email protected]
Nick LeeRegional DirectorCBRE Project Management, Asia Pacific+852 2820 [email protected]
Cameron AhrensExecutive DirectorCBRE Enterprise Facilities Management, Asia Pacific+65 6229 [email protected]
Peter Andrew Regional DirectorCBRE Workplace Strategies, Asia Pacific+65 6326 [email protected]
Rohini Saluja Executive Director, Asia PacificCBRE Advisory & Transaction+65 6326 [email protected]
ACKNOWLEDGEMENTS
Royston Toh Senior ManagerCBRE Project Management, Asia Pacific+65 6229 [email protected]
Brendan BruceManaging DirectorHaworth, South East Asia
© 2016 CBRE Group, Inc. All Rights Reserved. CBRE has taken every care in the preparation of this report. The sources of information used are believed to be accurate and reliable, but no guarantee accuracy or completeness can be given. Neither CBRE, nor any CBRE company, nor any director, representative or employee of CBRE company, accepts liability for any direct or consequential loss arising from the use of this document or its content. The information and opinions contained in this report are subject to change without notice.
No part or parts of this report may be stored in a retrieval system or reproduced or transmitted in any form or by any means electronic, mechanical, reprographics, recording or otherwise, now known or to be devised without prior consent from CBRE. Agency Licence No.: L3002163I.

www.cbre.com