asean statistical report on millennium development goals 2017 · the mdgs are defined and agreed...
TRANSCRIPT

one visionone identity
one community
ASEAN Statistical Report on Millennium Development Goals 2017

ASEAN Statistical Report on Millennium Development
Goals 2017
The ASEAN SecretariatJakarta

The Association of Southeast Asian Nations (ASEAN) was established on 8 August 1967. The Member States are Brunei Darussalam, Cambodia, Indonesia, Lao PDR, Malaysia, Myanmar, Philippines, Singapore, Thailand and Viet Nam. The ASEAN Secretariat is based in Jakarta, Indonesia.
For inquiries, contact:The ASEAN SecretariatCommunity Relations Division (CRD)70A Jalan SisingamangarajaJakarta 12110, IndonesiaPhone: (62 21) 724-3372, 726-2991Fax: (62 21) 739-8234, 724-3504E-mail: [email protected]
ASEAN: A Community of Opportunities
Catalogue-in-Publication Data
ASEAN Statistical Report on Millennium Development Goals 2017Jakarta, ASEAN Secretariat, August 2017
361.6121. ASEAN – Statistics - MDGs2. MDGs Indicators – NDGs – SDG indicators ISBN 978-602-6392-57-2
The text of this publication may be freely quoted or reprinted, provided proper acknowledgement is given and a copy containing the reprinted material is sent to the Community Relations Division (CRD) of the ASEAN Secretariat, Jakarta.
General information on ASEAN appears online at the ASEAN Website: www.asean.org
Copyright Association of Southeast Asian Nations (ASEAN) 2017.All rights reserved.
Supported by the EU-ASEAN Capacity Building Project For Monitoring Integration Progress And Statistics

3
Foreword
ASEAN Statistical Report on Millennium Development Goals 2017
Foreword
The adoption of the Joint Declaration on the Attainment of the Millennium Development Goals (MDGs) at the 14th ASEAN Summit in 2009 signified the ASEAN Leaders’ commitment to end poverty in the region. This was further reaffirmed when the Leaders put forward the ASEAN Roadmap for the Attainment of the MDGs - an action plan outlining what is needed to facilitate closer intra - and inter - sector collaboration in ASEAN toward the attainment of the MDGs. The MDGs are defined and agreed upon at the global level. As all other countries reporting the MDGs achievements, the ASEAN countries have followed and implemented the internationally agreed MDGs indicators.
This ASEAN Statistical Report on Millennium Development Goals 2017 is our final attempt to compile the 25 MDGs Indicators commonly available in the ASEAN Member States. It features the MDGs indicators of ASEAN aggregates in absolute numbers as well as information on narrowing development gaps. These two main attributes differentiate this Report on the ASEAN MDGs from other published MDGs reports.
The numbers presented in the Report clearly demonstrate what we have achieved over these 25 years and especially since the ASEAN Leaders made their promise in 2009. Overall, in many areas, ASEAN Member States have made remarkable progress in lifting millions of people out of poverty, ensuring that all families have access to safe drinking water and safe sanitation, saving the lives of infants and young children below 5 years of age and ensuring that the children at school age attend school. Likewise, the ASEAN member states have managed to ensure that girls attend on equal footing with boys. The boys are still ahead of the girls at primary school, but the girls are now moving ahead of the boys in secondary and tertiary education. However, more efforts are still needed to reduce gender inequality in the parliaments, to promote sustainable development, and to improve maternal and child health. The development gaps between the CLMV countries - Cambodia, Lao PDR, Myanmar and Viet Nam - and the other six ASEAN countries have in general been narrowed. While those four countries were lagging behind, they are now moving faster ahead than the others in almost all areas. If this commitment remains for the next years, they are now not only likely to catch up, but may even move ahead in some areas such as in primary school attendance, access to safe drinking water and basic sanitation. In other sectors like poverty and health, these four countries have shown large improvements, but are still lagging behind. As this report shows, the current commitment to narrow the gap should remain.
The second and final MDGs Statistical Report will be soon published. The report also presents a list of potential Sustainable Development Goal Indicators. Already in this report, two SDG annexes were included. First, the list of SDG indicators which are given as preliminary by at least half the ASEAN countries. The list comprises one set of SDG indicators which may well be included in the data collection by the ASEAN national statistical systems and one set which requires an extended data collection by the national statistical systems. Second, a list of the preliminary SDG indicators with some excerpts from the meta data on the definition and recommended data source. The ASEAN Working Group on the SDGs and the ASEAN statistical office are already preparing for a first ASEAN SDG Statistical Report to be published in 2018. I feel delighted to share our best practices and updated statistics. This Report shows how far we have managed to meet our aspiration for the MDGs targets along with our vision of establishing a stable and prosperous ASEAN Community by 2015. The ASEAN Secretariat welcomes your feedback as we strive to deliver our best products and services.
Our heartfelt gratitude to our Development Partners, especially to the European Union through the EU-ASEAN Capacity Building Project for Monitoring Integration Progress and Statistics (COMPASS) Programme for their support, without which the publication of this Report would not have been possible.
LE LUONG MINHSecretary-General of ASEAN

4
Table of Contents
ASEAN Statistical Report on Millennium Development Goals 2017
Table of Contents
Foreword 3
List of Abbreviations 6
List of Tables 7
List of Figures 9
Executive Summary 11
Acknowledgements 13
Introduction and Key Findings 14
Goal 1: Eradicate extreme poverty and hunger 20
1. Proportion of population below US$1.25 (PPP) per day 20
2. Proportion of population below national poverty line 21
3. Employment-to-population ratio for people 15 years of age and above 23
4. Prevalence of underweight children under-five years of age 24
Goal 2: Achieve universal primary education 26
5. Net enrolment ratio in primary education 26
6. Literacy rate of 15-24-year-olds, women and men 27
Goal 3: Promote gender equality and empower women 29
7. Ratios of girls to boys in primary 29
8. Ratio of girls to boys in secondary education 30
9. Ratio of girls to boys in tertiary education 31
10. Proportion of seats held by women in national parliament 32
Goal 4: Reduce child mortality 34
11. Under-five mortality rate 34
12. Infant mortality rate 35
13.Proportion of 1-year-old children immunised against measles 36
Goal 5: Improve maternal health 38
14. Maternal mortality ratio 38
15. Proportion of births attended by skilled health personnel 39

5
Table of Contents
ASEAN Statistical Report on Millennium Development Goals 2017
Goal 6: Combat HIV/AIDS, malaria and other diseases 41
16. Incidence and death rates associated with malaria 41
17. Incidence, prevalence and death rates associated with tuberculosis 43
Goal 7: Ensure environmental sustainability 45
18. Proportion of land area covered by forest 45
19. Proportion of population using an improved drinking water source 47
20. Proportion of population using an improved sanitation facility 48
Goal 8: Develop a global partnership for development 50
21. Fixed-telephone subscriptions per 100 inhabitants 50
22. Mobile-cellular subscriptions per 100 inhabitants 51
23. Internet users per 100 inhabitants 52
Conclusion 54
Annex 1 Roads towards the MDGs at country level 55
Brunei Darussalam 56
Cambodia 57
Indonesia 60
Malaysia 62
Myanmar 63
Singapore 64
Thailand 67
Viet Nam 68
Annex 2 Technical Notes 71
Annex 3 Country Tables 75
Annex 4 ASEAN Preliminary SDG Indicators 93
Annex 5 Preliminary SDG Indicators -- Metadata Excerpts 103

6
List of Abbreviations
ASEAN Statistical Report on Millennium Development Goals 2017
List of Abbreviations
AIDS Acquired Immunodeficiency Syndrome
AMS ASEAN Member States
ASEAN Association of Southeast Asian Nations
ASEAN-6 Brunei Darussalam, Indonesia, Malaysia, Philippines, Singapore, and Thailand
ASEANstats Statistics Division of the ASEAN Secretariat
CLMV Cambodia, Lao PDR, Myanmar, and Vietnam
COMPASS Capacity Building Project for Monitoring Integration Progress and Statistics
ESCAP Economic and Social Commission for Asia and the Pacific
EU European Union
HIV Human Immunodeficiency Virus
Lao PDR Lao People’s Democratic Republic
MDGs Millennium Development Goals
PPP Purchasing Power Parity
SDGs Sustainable Development Goals
UN United Nations

7
List of Tables
ASEAN Statistical Report on Millennium Development Goals 2017
List of Tables
Table 1.1. Percentage of population below the $1.25 (PPP) in ASEAN and ASEAN Member States, 1990-2015 20
Table 1.2. Percentage of population below the $1.25 (PPP) in CLMV and in ASEAN-6 and the ratio of CLMV over ASEAN-6 21
Table 1.3. Proportion of population below the national poverty line in ASEAN and ASEAN Member States, 1990-2015 22
Table 1.4. Percentage of population below the national poverty line in CLMV and ASEAN-6 and the ratio of CLMV to ASEAN-6 22
Table 1.5. Employment-to-population ratio in ASEAN and ASEAN Member States 1990-2015 23
Table 1.6. Employment-to-population ratio in CLMV and ASEAN-6 and the ratio of CLMV to ASEAN-6 23
Table 1.7. Prevalence of underweight children under-five years of age in ASEAN and ASEAN Member States, 1990-2015 & target 24
Table 1.8. Prevalence of underweight children under five years of age in CLMV and ASEAN-6 and the ratio of CLMV to ASEAN-6, 1990 2015 & target 25
Table 2.1. Net enrolment ratio in primary education in ASEAN and ASEAN Member States, 1990-2015 & target 27
Table 2.2. Net enrolment ratio in primary education in CLMV and ASEAN-6 and the ratio of CLMV to ASEAN-6 27
Table 2.3. Literacy rate of 15-24 year-olds in ASEAN and ASEAN Member States, 1990-2015 & target 28
Table 2.4. Literacy rate of 15-24 year-olds in CLMV and ASEAN-6 and the ratio of CLMV to ASEAN-6 28
Table 3.1. Ratio of girls to boys in primary education in ASEAN and ASEAN Member States, 1995-2015 & target 29
Table 3.2. Ratio of girls to boys in primary education in ASEAN-6 and CLMV and the ratio of CLMV to ASEAN-6, 1990-2015 & target 30
Table 3.3. Ratio of girls to boys in secondary education in ASEAN and ASEAN Member States, 1990-2015 & target 30
Table 3.4. Ratio of girls to boys in secondary school in ASEAN-6 and CLMV and the ratio of CLMV to ASEAN-6, 1990-2015 & target 30
Table 3.5. Ratio of girls to boys in tertiary education in ASEAN and ASEAN Member States, 2000-2015 & target 31
Table 3.6. Ratio of girls to boys in tertiary education in ASEAN-6 and CLMV and the ratio of CLMV to ASEAN-6, 2000-2015 & target 31
Table 3.7. Proportion of seats held by women in national parliament in ASEAN and ASEAN Member States, 1995-2015 & target 32
Table 3.8. Proportion of seats held by women in national parliament in ASEAN-6 and CLMV and the ratio of CLMV to ASEAN-6, 1995-2015 & target 32
Table 4.1. Under-five mortality rate in ASEAN and ASEAN Member States, 1990-2015 & target 35

8
List of Tables
ASEAN Statistical Report on Millennium Development Goals 2017
Table 4.2. Under-five mortality rate in ASEAN-6 and CLMV and the ratio of CLMV to ASEAN-6, 1990-2015 & target 35
Table 4.3. Infant mortality rate in ASEAN and ASEAN Member States, 1990-2015 & target 36
Table 4.4. Infant mortality rate in ASEAN-6 and CLMV and the ratio of CLMV to ASEAN-6, 1990-2015 & target 36
Table 4.5. Proportion of one-year-old children immunised against measles in ASEAN and ASEAN Member States, 1995-2015 37
Table 4.6. Proportion of one-year-old immunized against measles in ASEAN-6 and CLMV and ratio of CLMV to ASEAN-6, 1995-2015 37
Table 5.1. Maternal mortality ratio in ASEAN and ASEAN Member States, 1990-2015 & target 38
Table 5.2. Maternal mortality ratio in ASEAN-6 and CLMV and the ratio of CLMV to ASEAN-6, 1990-2015 & target 39
Table 5.3. Proportion of births attended by skilled health personnel In ASEAN and ASEAN Member States, 1995-2015 40
Table 5.4. Proportion of births attended by skilled health person-nel in ASEAN-6 and CLMV and the ratio of CLMV to ASEAN-6 40
Table 6.1. Incidence of malaria per 100,000 people in ASEAN and ASEAN Member States, 1990-2015 42
Table 6.2. Incidence of malaria per 100,000 people in ASEAN-6 and CLMV and the ratio of CLMV to ASEAN-6, 1990-2015 42
Table 6.3. Incidence of tuberculosis per 100,000 people in ASEAN and ASEAN Member States 2000-2015 43
Table 6.4. Incidence of tuberculosis per 100,000 people in ASEAN-6 and CLMV and the ratio of CLMV to ASEAN-6 43
Table 7.1. Proportion of land area covered by forest in ASEAN and ASEAN Member States, 1990-2015 46
Table 7.2. Proportion of land area covered by forest in ASEAN-6 and CLMV and the ratio of CLMV to ASEAN-6, 1990-2015 46
Table 7.3. Proportion of population using an improved drinking water source In ASEAN and ASEAN Member States, 1995-2015 47
Table 7.4. Proportion of population using an improved drinking water source In ASEAN-6 and CLMV and the ratio of CLMV to ASEAN-6 47
Table 7.5. Proportion of population with improved sanitation facility in ASEAN and ASEAN Member States, 1990-2015 48
Table 7.6. Proportion of population with improved sanitation facility in ASEAN-6 and CLMV and the ratio of CLMV to ASEAN-6 49
Table 8.1. Telephone lines per 100 population in ASEAN and ASEAN Member States, 2000-2015 50
Table 8.2. Telephone lines per 100 population in ASEAN-6 and CLMV, and the ratio of CLMV to ASEAN-6 51
Table 8.3. Cellular subscribers per 100 population in ASEAN and ASEAN Member States, 2005-2015 51
Table 8.4. Cellular subscribers per 100 population in ASEAN-6 and CLMV and the ratio of CLMV to ASEAN-6 52
Table 8.5. Internet users per 100 population in ASEAN and ASEAN Member States, 2005-2015 53
Table 8.6. Internet users per 100 population in ASEAN-6 and CLMV and the ratio of CLMV to ASEAN-6 53

9
List of Figures
ASEAN Statistical Report on Millennium Development Goals 2017
List of Figures
Figure 1.1. Percentage of population below the $1.25 (PPP) in ASEAN, 1990-2015 & target 21
Figure 1.2. Percentage of population below the $1.25 (PPP) in ASEAN and ASEAN Member States, 2015 (country and regional targets in red) 21
Figure 1.3. Proportion of population below the national poverty line in ASEAN, 1990-2015 & target 22
Figure 1.4. Proportion of population below the national poverty line in ASEAN & ASEAN Member States, 2015 (country and regional targets in red) 22
Figure 1.5. Employment-to-population ratio in ASEAN, 1990-2015 23
Figure 1.6. Employment-to-population ratio in ASEAN Member States 2015 and ASEAN 24
Figure 1.7. Prevalence of underweight children under-five years of age in ASEAN, 1990-2015 25
Figure 1.8. Prevalence of underweight children under-five years of age in ASEAN and ASEAN Member States, 2015 (country and regional targets in red) 25
Figure 2.1. Net enrolment ratio in primary education in ASEAN, 1990-2015 & target 27
Figure 2.2. Net enrolment ratio in primary education in ASEAN and ASEAN member states, 2015 27
Figure 2.3. Literacy rate of 15-24 year-olds in ASEAN, 1990-2015 & target 28
Figure 2.4. Literacy rate of 15-24 year-olds in ASEAN and ASEAN Member States, 2015 28
Figure 3.1. Ratio of girls to boys in primary education in ASEAN, 1995-2015 & target 30
Figure 3.2. Ratio of girls to boys in primary education in ASEAN and ASEAN Member States, 2015 30
Figure 3.3. Ratio of girls to boys in secondary education in ASEAN, 1990-2015 & target 31
Figure 3.4. Ratio of girls to boys in secondary education in ASEAN and ASEAN Member States, 2015 31
Figure 3.5. Ratio of girls to boys in tertiary education in ASEAN, 2000-2015 & target 32
Figure 3.6. Ratio of girls to boys in tertiary education in ASEAN and ASEAN Member States, 2015 & red target line 32
Figure 3.7. Proportion of seats held by women in national parliament in ASEAN, 1995-2015 & target 32
Figure 3.8. Proportion of seats held by women in national parliament in ASEAN and ASEAN Member States, 2015 & red target line 33
Figure 4.1. Under-five mortality rate in ASEAN, 1990-2015 & target 35
Figure 4.2. Under-five mortality rate in ASEAN and ASEAN Member States, 2015 (country and regional target in red) 35
Figure 4.3. Infant mortality rate in ASEAN, 1990-2015 & target 36
Figure 4.4. Infant mortality rate in ASEAN and ASEAN Member States, 2015 (country and regional target in red) 36
Figure 4.5. Proportion of one-year-old children immunised against measles in ASEAN, 1995-2015 37

10
List of Figures
ASEAN Statistical Report on Millennium Development Goals 2017
Figure 4.6. Proportion of one-year-old children immunised against measles in ASEAN and ASEAN Member States, 2015 & red target line 37
Figure 5.1. Maternal mortality ratio in ASEAN, 1990-2015 & target 39
Figure 5.2 Maternal mortality ratio in ASEAN and ASEAN Member States, 2015 (country and regional targets) 39
Figure 5.3. Proportion of births attended by skilled health personnel In ASEAN, 1995-2015 & target 40
Figure 5.4. Proportion of births attended by skilled health personnel In ASEAN and ASEAN Member States, 2015 and red target line 40
Figure 6.1. Incidence of malaria per 100,000 people in ASEAN 1990-2015 42
Figure 6.2. Incidence of malaria per 100,000 people in ASEAN and ASEAN Member States, 2015 and ASEAN 42
Figure 6.3. Incidence of tuberculosis per 100,000 people in ASEAN 2000-2015 43
Figure 6.4. Incidence of tuberculosis per 100,000 people in ASEAN and ASEAN Member States, 2015 43
Figure 7.1. Proportion of land area covered by forest in ASEAN, 1990-2015 46
Figure 7.2. Proportion of land area covered by forest in ASEAN and ASEAN Member States, 2015 46
Figure 7.3. Proportion of population using an improved drinking water source In ASEAN, 1995-2015 & target 47
Figure 7.4. Proportion of population using an improved drinking water source In ASEAN and ASEAN Member States, 2015 (country and regional target in red line) 48
Figure 7.5. Proportion of population with improved sanitation facility in ASEAN, 1990-2015 & target 49
Figure 7.6. Proportion of population with improved sanitation facility in ASEAN and ASEAN Member States, 2015 (country and regional target in red line) 49
Figure 8.1. Telephone lines per 100 population in ASEAN and ASEAN Member States, 2015 and ASEAN 51
Figure 8.2. Cellular subscribers per 100 population in ASEAN and ASEAN Member States, 2005-2015 52
Figure 8.3. Cellular subscribers per 100 population in ASEAN and ASEAN Member States, 2015 & ASEAN 52
Figure 8.4. Internet users per 100 population in ASEAN, 2005-2015 53
Figure 8.5. Internet users per 100 population in ASEAN and ASEAN Member States, 2015 53

11
Executive Summary
ASEAN Statistical Report on Millennium Development Goals 2017
Executive Summary
At the beginning of the new millennium, world leaders gathered at the United Nations General Assembly and unanimously agreed upon a set of Millennium Development Goals (MDGs) and targets for world development from 1990 to 2015. In 2015, the UN summarised the achievements in The Millennium Development Goals Report 2015.
The Association of Southeast Asian Nations (ASEAN), comprising of Brunei Darussalam, Cambodia, Indonesia, Lao PDR, Malaysia, Myanmar, Philippines, Singapore, Thailand and Viet Nam have likewise worked towards achieving the MDGs goals. Though diverse in social, cultural, political and economic facets, ASEAN is built on a commitment to create a region of peace, freedom, and shared prosperity. Hence, recognising the significant challenges ahead to fully achieve the MDGs the ASEAN Member States (AMS) issued a Joint Declaration on the Attainment of the MDGs on March 1, 2009. ASEAN also developed and implemented a Roadmap for the Attainment of the MDGs as a framework for collective action and established a monitoring and evaluation system including the generation of gender statistics for the attainment of MDGs in ASEAN.
Some of the AMS have already prepared their national final MDGs reports to monitor compliance and progress in meeting the MDGs targets. This report aims to inform on the progress of ASEAN as a region in the attainment of the 23 out of the 25 MDGs indicators available for ASEAN from the total 60 official MDGs indicators and to assess the narrowing of the development gap between the ASEAN-6 countries (Brunei Darussalam, Indonesia, Malaysia, Philippines, Singapore, and Thailand) and the CLMV countries (Cambodia, Lao PDR, Myanmar, and Viet Nam). Estimates for the 23 MDGs indicators are provided for every fifth year and compares the final change from 1990 to 2015 with the targets for the development over these 25 years. Estimates of at regional level are shown for indicators which are available in at least 5 countries and representing at least 50% of regional population..
The AMS have attained the MDGs target at a remarkable pace. Of the 25 MDGs targets with a clear goal, the AMS have fulfilled or passed 13 and are close to reaching another three. Two countries do not have a national poverty line, but the other eight countries have managed to reduce both the share of their populations living below the international poverty line, as well as the share below the various national poverty lines, to less than half. At the same time, the share of underweight children at the regional level have been reduced to half, just reaching the target. It is important to underscore that this development has taken place in a range of countries which started at various levels of poverty and hunger and which have implemented diverse policies, indicating that there are various ways of achieving poverty and hunger reduction.
During the time frame given, there has been a comprehensive improvement of the educational system, both in matter of net enrollment, literacy and gender equality. Literacy and net enrollment is still not yet at a 100% level, but has been steadily increasing towards these important targets.
Gender equality in education has jumped ahead in favour of girls. Even in 1990 there were more girls studying at tertiary level and over this period the development has also spread to secondary and primary school. In 2015, there was still a gender gap in primary school, but at secondary level, girls were ahead of boys. In tertiary institutions, the scale was about to tip in favour of the girls. However, this does not mean that gender equality has reached all sectors of society. The rate of women in parliaments has doubled, but was still around 18% and still quite far away from the targeted, balanced, 50% level.
The health sector targets are a mixed group. The AMS have done very well by reaching the goals for reduced infant and child mortality and fighting malaria. But the coverage of measles vaccination presents a mixed picture and on average the level was still only 86%, below the necessary minimum of 95% coverage.
A large remaining challenge is maternal mortality. Despite some improvement, the ASEAN community still has a long way to go. The process has however started and the coverage of trained mid-wives and birth attendants have increased and reached above 90% in 2015. Unfortunately, the incidence of tuberculosis is another field with low achievements; with only slight improvement occuring over 25 years.

12
Executive Summary
ASEAN Statistical Report on Millennium Development Goals 2017
Both for Goal 7 on environmental sustainability and for Goal 8 on participation in global development, the ASEAN region did well. The proportion of land covered by forest went down over the 25 years, but the pace of this reduction has slowed. Both the proportion of population having account to improved drinking water source and improved sanitation facility increased and passed the MDGs target.
The ASEAN region also improved with regard to technological improvement. While cell phones and internet use increased over this period, the usage of fixed telephone lines is reducing. The rate of internet use was however still low at around 1/4. It is the use of cell phones which have managed to further integrate the population in the region. There were more cell phone subscriptions than people in the ASEAN region in 2015.
It has been one of the main concerns of the ASEAN community to narrow the development gap among its member states to ensure the benefits of ASEAN integration are equally shared. Disparities among the countries have persisted and were more pronounced in some areas. For instance, both the better-off ASEAN countries (Indonesia, Malaysia, Philippines, and Thailand) and the less-developed CLMV countries (Cambodia, Lao PDR, Myanmar, and Viet Nam) have all achieved the MDGs target of cutting the share of the population below the international poverty line and the number of underweight of children under five years of age to less than half. However, poverty was still the highest in Cambodia and Lao PDR and the number of underweight children was still the largest in Cambodia, Lao PDR and Myanmar.
Over the long term, from 1990 to 2015, all the CLMV countries have been catching up. Viet Nam started the process first, while Cambodia, Lao PDR and then Myanmar all followed suit at similar paces.
This report highlights important areas where ASEAN has effectively managed to bridge and narrow the development gaps between the ASEAN-6 and the CLMV. In several instances, the CLMV countries have outpaced the ASEAN-6 countries, not only by the 1990 rates of progress being completed faster, but even passing the level of the ASEAN-6 countries such as in regard to lower rates of maternal mortality and their higher shares of people with improved drinking water sources.
However, as the statistics show, there has also been uneven progress across sub-regions, across countries and across the targets. Concerted efforts need to be intensified to be able to accelerate progress, particularly in areas where growth has been slow or insufficient. In addition, potential shocks, be it economic or natural disasters, need to be taken into account in designing a road map for the achievement of these remaining goals as well as the new global goals for the 2030 agenda, the Sustainable Development Goals
(SDGs).

13
Acknowledgements
ASEAN Statistical Report on Millennium Development Goals 2017
Acknowledgements
This report is based on data compiled by the following agencies in cooperation with the appropriate ministries, departments
and agencies:
• Department of Economic Planning and Development, Brunei Darussalam• National Institute of Statistics, Cambodia• BPS – Statistics Indonesia, Indonesia• Lao Statistics Bureau (LSB), Lao PDR• Department of Statistics, Malaysia• Central Statistical Organisation, Myanmar• Philippines Statistics Authority, Philippines• Department of Statistics, Singapore• National Statistical Office, Thailand• Office of National Economic and Social Development Board, Thailand• General Statistics Office, Viet Nam
And the contributions of the following individuals:
Ahmad Zafarullah Abdul Jalil, Ali Said, Anang Laksono, Anna Mae Tuazon, Bernadette B. Balamban, Binh Ngoc Nguyen, Bounmy Vilaychith, Budsara Sangaroon, Chanthapany Mahathilath, Gantjang Amanullah, Hairol Nizam Abd. Hamid, Joseph Albert Nino Bulan, Julia Puspadewi Tijaja, Justin Tai Wei Chuen, Khamkhounheuan Phimphanh, Khin Mar Aye, Khin Swe Latt, Khuyen Dinh Nguyen, Larasati Indrawagita, Lay Chhan, Lia Emalia, Maria Fransisca Dewi Widowati, Mechelle Mendoza Viernes, Mohd Shukor Mat Lazim, Ngoc Son Nguyen, Norizan Abdullah, Nur Edzalina Hj. Idris, Nyen Nyen Maw, Nyo Nyo San, Phonesaly Souksavath, Po Mao, Puguh Irawan, Riyanti Saari, Ruamporn Sirirattrakul, Samrith Chan, Satriana Yasmuarto, Sentot Bangun Widoyono, Som Bony, Trang Thi Thu Tran, Vilaysook Sisoulath, Wannapa Khlaisuan, Wee Ling Koh, Wilma A. Guillen.
Drafted by: Mr. Bjørn K Getz Wold
Finalised by: Statistics Division (ASEANstats), ASEAN Secretariat
Photo courtesy of: ASEAN Member States National Statistical Offices

14
Introduction and Key Findings
ASEAN Statistical Report on Millennium Development Goals 2017
Introduction and Key Findings
Introduction
At the beginning of the new millennium, world leaders gathered at the United Nations General Assembly and unanimously agreed upon a set of MDGs and targets for world development from 1990 to 2015. It was later agreed to measure the MDGs goals and targets with a global set of indicators. In 2015, the UN summarized the achievements in The Millennium Development Goals Report 20151.
ASEAN is composed of Brunei Darussalam, Cambodia, Indonesia, Lao PDR, Malaysia, Myanmar, Philippines, Singapore, Thailand and Viet Nam. Though diverse in social, cultural, political and economic facets, the ASEAN is built on a commitment to create a region of peace, freedom, and shared prosperity. Hence, recognizing the significant challenges ahead to fully achieve the MDGs and narrow the development gap in the ASEAN, the Member States issued a Joint Declaration on the Attainment of the MDGs on March 1, 2009. The ASEAN community developed and implemented a Roadmap for the Attainment of the MDGs as a framework for collective action and established a monitoring and evaluation system including the generation of gender statistics for the attainment of MDGs in ASEAN. The achievements are documented in this report.
This report aims to inform on the progress of ASEAN as a region in the attainment of the 25 MDGs indicators that are available for ASEAN - from the total 60 official MDGs indicators as stipulated the United Nations and to assess the narrowing of the development gap between the better off ASEAN-6 countries (Brunei Darussalam, Indonesia, Malaysia, Philippines, Singapore, and Thailand) and the less developed CLMV countries (Cambodia, Lao PDR, Myanmar, and Viet Nam). The report making it happen, Asia-Pacific Regional MDGs Report 2014/15 from the United Nations Economic and Social Commission for Asia and the Pacific (UN ESCAP), Asian Development Bank (ADB), and the United Nations Development Programme (UNDP) have reported on the MDGs status of Southeastern Asia, which includes the AMS and Timor Leste up to 2012/2013, but that report is based upon international databases. However, there has been no previous regional report or data compiled at the regional level based upon national compilation on MDGs up to the MDGs end-point in 2015 and no report dedicated to the ASEAN community since the previous ASEAN report in 2011.
This report aims to provide the information in determining the final achievements of the ASEAN Community with regards to the MDGs as well as to assess its progress in moving towards the targets. It provides estimates for 23 out of 25 MDGs indicators for selected years: 1990, 1995, 2000, 2005, 2010 and 2015 and compares the final change from 1990 to 2015 with the targets for the development over the 25-year period. An estimate of ASEAN level data for the indicators are shown if the data represents at least 5 countries and at least 50 % of the total ASEAN population.
Key Findings
The UN ESCAP classification of progress is adopted for this summary. The 17 indicators with explicit targets by 2015 are presented as follows:
Full achiever:
targets achieved in 2015 or before
Partial achiever: close to target by 2015
Slow achiever: moving in right direction, but still far from target in 2015
No progress/regressing: stagnating or slipping backwards
1http://www.undp.org/content/undp/en/home/librarypage/MDGs/the-millennium-development-goals-report-2015.html

15
Introduction and Key Findings
ASEAN Statistical Report on Millennium Development Goals 2017
ASEAN MDGs Progress Chart
Goals and Targets
Indicators for Monitoring Progress
Rates & ratios, unless specified unit value 100. Proportions in percent
Baseline TargetEstimate
2015Progress
Goal 1: Eradicate Extreme Poverty and Hunger
Target 1.A: Halve, between 1990 and 2015, the proportion of people whose income is less than one dollar a day
Proportion of population below47 23 14
$1.25 (PPP) per day
Proportion of population below the national poverty line
31 15 14
Target 1.B: Achieve full and productive employment and decent work for all, including women and young people
Growth rate of GDP per person employed
- - - -
Employment-to-population ratio 57 >>57 62
Target 1.C: Halve, between 1990 and 2015, the proportion of people who suffer from hunger
Prevalence of underweight children under-five years of age
36 18 18
Goal 2: Achieve Universal Primary Education
Target 2.A: Ensure that, by 2015, children everywhere, boys and girls alike, will be able to complete a full course of primary schooling
Net enrolment ratio in primary education
86 100 96
Literacy rate of 15-24-year-old, women and men
93 100 97
Goal 3: Promote Gender Equality and Empower Women
Target 3.A: Eliminate gender disparity in primary and secondary education, preferably by 2005, and in all levels of education no later than 2015
Ratio of girls to boys in primary education
95 100 97
Ratio of girls to boys in secondary education
91 100 104
Ratio of girls to boys in tertiary education – baseline in 2000
102 100 123
Proportion of seats held by women in national parliament – baseline in 1995*
9 50 18
For some indicators, the target is less precise, to reduce or to increase a rate. These six indicators are presented as follows for the indicative targets by 2015:
Full achiever: trending in right direction 1990 to 2015
Partial achiever: improved situation in 2015 compared with in 1990
No progress: showing hardly any change at all over the period
Off track - Regressing: trending in the wrong direction

16
Introduction and Key Findings
ASEAN Statistical Report on Millennium Development Goals 2017
Goal 4: Reduce Child Mortality
Target 4.A: Reduce by two-thirds, between 1990 and 2015, the under-five mortality rate. Rates per 1000 children
Under-five mortality rate 79 26 26
Infant mortality rate 57 19 20
Proportion of 1-year-old children immunized against measles*– baseline in 1995*
71 100 86
Goal 5: Improve Maternal Health
Target 5.A: Reduce by three quarters, between 1990 and 2015, the maternal mortality ratio. Ratio per 100,000 births
Maternal mortality ratio 286 72 197
Proportion of births attended by skilled health personnel*– baseline in 1995*
58 100 91
Goal 6: Combat HIV/AIDS, Malaria and Other Diseases
Target 6.C: Have halted by 2015 and begun to reverse the incidence of malaria and other major diseases. Incidence per 100,000 people
Incidence of malaria* 745 <745 90
Incidence of tuberculosis*– baseline in 2000*
178 <178 152
Goal 7: Ensure Environmental Sustainability
Target 7.A: Integrate the principles of sustainable development into country policies and programs and reverse the loss of environmental resources
Proportion of land area covered by forest
50Lower defore-
station45
Target 7.C: Halve, by 2015, the proportion of people without sustainable access to safe drinking water and basic sanitation
Proportion of population using an improved drinking water source
57 78 81
Proportion of population using an improved sanitation facility
37 69 78
Goal 8: Develop a Global Partnership for Development
Target 8.F: In cooperation with the private sector, make available the benefits of new technologies, especially information and communications
Telephone lines per 100 population*– baseline in 2000*
4 >4 10
Cellular subscribers per 100 population* – baseline in 2005
18 >18 131
Internet users per 100 population* – baseline in 2005
4 >4 26
Notes: Data presented are ASEANstats’ estimates based on available country data. Some of the data may include only selected countries.
Details are in the full report.
* The 1990 (baseline) figure is not available, although data for some selected years prior to 2010 are available.
In the past two decades, the ASEAN region has shown remarkable success in reducing poverty, increasing employment, reducing gender gaps in education and expanding access to information and technology. Admittedly though, further endeavor is needed to make progress in areas such as towards having more women representatives in parliaments, reduced maternal mortality and reduced incidences of major diseases.

17
Introduction and Key Findings
ASEAN Statistical Report on Millennium Development Goals 2017
Narrowing the Development Gap
It has been one of the main concerns of ASEAN to narrow the development gap among its Member States to ensure the benefits of ASEAN integration are equally shared - as disparities among the countries still persist and are more pronounced in some areas. For instance, the better-off ASEAN-6 countries and the less developed CLMV countries, have all adequately achieved the MDGs targets of cutting poverty below the international poverty line and the number of underweight children under five years of age to less than half. However, poverty was still the highest in Cambodia and Lao PDR and the underweight was still the largest in Cambodia, Lao PDR and Myanmar.
Over the long term from 1990 to 2015, all the CLMV countries have been catching well up. In fact, the time to catch up may not be that different, but Viet Nam started the process first, while Cambodia, Lao PDR and then Myanmar all had follow up.
This report will highlight important areas where the ASEAN has effectively managed to bridge and narrow the development gaps between the ASEAN-6 and the CLMV. In several instances, the CLMV countries have outpaced the ASEAN-6 countries, not only by cutting the 1990 rates faster, but even exceeding the level of the ASEAN-6 countries.
Comparison with Other Regions
The Asia-Pacific Regional MDGs Report 2014/152 notes that over the past 15 years, the Asia-Pacific region has taken dramatic strides and is expected to meet 13 of the 21 MDGs targets tracked in this report. The greatest success has been for poverty. Between 1990 and 2012, the proportion of the region’s population living on less than US$1.25 per day fell from 53% to 14%, and by 2015 it is projected to fall to 12%. The MDGs target was to halve the poverty rate, and of the countries with sufficient data, all except two are expected to meet that target.
A second notable achievement concerns access to safe drinking water. More than 2/3 of countries are expected to meet the target of halving the proportion of the population without access to safe drinking water. For the region as a whole, that proportion has fallen from 28% to 7%. The region has also met other important targets. Nearly all primary-aged children now complete school, and students at all levels of education benefit from gender parity. On the health front, the region has reduced the incidence of tuberculosis. And among the environmental targets, the region has maintained the proportion of land covered by forests.
It is also important to note that even where the targets have not been fully-reached there have often been impressive advances towards them. The rates of deaths of under-five years old and infant mortality, for example, fell short of the required 2/3 reduction, but still more than halved, with often the most rapid progress being registered in countries that started furthest behind.
2Making it happen – Technology, finance and statistics for sustainable development in Asia and the Pacific, Asia-Pacific regional MDGs report 2014/15”, prepared by UN ESCAP, ADB and UNDP in 2015.

18
Introduction and Key Findings
ASEAN Statistical Report on Millennium Development Goals 2017
Goal 1 2 3 4 5 6 7
$1.2
5 p
er d
ay p
over
ty
Un
der
wei
gh
t ch
ildre
n
Pri
mar
y en
rolm
ent
Gen
der
pri
mar
y
Gen
der
sec
on
dar
y
Gen
der
ter
tiar
y
Un
der
-5 m
ort
alit
y
Infa
nt
mo
rtal
ity
Mat
ern
al m
ort
alit
y
Ski
lled
bir
th a
tten
dan
ce
TB
inci
den
ce
Fo
rest
cov
er
Saf
e d
rin
kin
g w
ater
Bas
ic s
anit
atio
n
ASEAN � � � � � � ¾ ¾ � � ASEAN-6 � � � � ¾ � � CLMV � � � � ¾ � �Asia-Pacific � ¾ � � � ¾ ¾ ¾ ¾ � � � ¾ Excluding China and India � ¾ � � � ¾ ¾ ¾ ¾ � � � ¾South Asia � ¾ � ¾ ¾ ¾ ¾ ¾ ¾ � � � ¾Pacific Island � � � ¾ ¾ ¾ ¾ � ¾ ¾North and Central Asia � � � � � ¾ ¾ ¾ ¾ � � ¾ ¾Asia-Pacific LDCs � ¾ � � ¾ ¾ ¾ ¾ ¾ � � ¾
Early Achiever on-track Slow Regressing/No progress
Sources: ASEAN figures are based on ASEANstats’ estimates. Data, except for the ASEAN figures, were taken from “Making it happen – Technology, finance and statistics for sustainable development in Asia and the Pacific, Asia-Pacific regional MDGs report 2014/15”, prepared by UN ESCAP, ADB and UNDP in 2015.
Asia-Pacific MDGs Progress Chart
The report also shows that the Asia-Pacific region is still leaving an extensive “unfinished agenda” behind. In 2012, 569 million people were still living on less than US$1.25 per day, 21 million children were not enrolled in primary school, and more than 1/5 of under-five children − 75 million − were underweight. In addition, 1.2 billion people in rural areas, and 480 million in urban areas, still lacked access to safe sanitation.
The AMS are either ahead, or in line with, the other countries in the Asia-Pacific region on most of the MDGs goals. They are however lagging behind both in reducing the incidence of tuberculosis and in reducing deforestation. The AMS are also reducing the gender disparities in primary schools at a slower pace, but catching up in secondary and tertiary schools.
As with other countries in the region, the AMS are early achievers in reducing poverty, ahead of the rest of the broader region in reducing the prevalence of underweight children, under-five and infant mortality as well as improving access to safe drinking water and improving basic sanitation.

19
Introduction and Key Findings
ASEAN Statistical Report on Millennium Development Goals 2017
The performance of the ASEAN-6 and CLMV however are not uniform in all the indicators. The CLMV countries may still lag behind the ASEAN-6 for some of the indicators, but are in general faster in their progress towards the MDGs goals. They are ahead of the ASEAN-6 countries in reducing underweight for children and while the CLMV countries are reducing the incidence of tuberculosis, the ASEAN-6 countries are hardly improving at all. On the other hand, the ASEAN-6 have been doing better in closing the gender gaps at secondary school level.
While there has been remarkable progress in the ASEAN region in the attainment of the MDGs, there has also been uneven progress across sub-regions, across countries and across the targets. Concerted efforts need to be intensified to be able to accelerate progress, particularly in areas where growth has been slow or insufficient. In addition, potential shocks, be it economic or natural disasters, need to be taken into account in the design of a roadmap for the achievement of new global goals for the 2030-agenda, the SDGs.

20
Goal 1: Eradicate Extreme Poverty and Hunger
ASEAN Statistical Report on Millennium Development Goals 2017
Target 1.A: Halve, between 1990 and
2015, the proportion of people whose
income is less than one dollar a day
1. Proportion of population below US$1.25 (PPP) per day
In 1990, around half the population in Sub-Saharan Africa and in Asia were living on less than US$1.25 purchase power parity (PPP) per day. In 2015, the rate has been reduced to well below 20% in Asia while in Sub-Saharan Africa, it remains relatively high at around 40%.
Trends
As did other regions in Asia, ASEAN achieved remarkable progress in poverty reduction. In 1990, 47% of the population in six of the AMS where statistics on the international poverty line is available, were living below the standard poverty line of $1.25 PPP (Table 1.1). Over these 25 years the proportion of poor people has been reduced by more than 2/3. During the same period, the population increased by almost 50%. Hence, even the number of poor people has been reduced to less than half.
Viewing this from the target of reducing the proportion of poor people to half, this is a relatively remarkable achievement.
Table 1.1. Percentage of population below the $1.25 (PPP) in ASEAN and ASEAN Member States*, 1990-2015
CountryYear
Target1990 1995 2000 2005 2010 2015
Cambodia 52 48 44 36 28 24** 26
Indonesia 54 43 48 22 18 9 27
Lao PDR 57 50 41 38 35 29 29
Philippines 31 26 22 22 23 19** 16
Thailand 13 15 16 16 17 18 7
Viet Nam 68 57 45 23 14 17 34
ASEAN 47 39 38 22 19 14 23
Note: * - Not applicable to Brunei Darussalam nor Singapore, ** - imputationSource: ASEAN Secretariat
Goal 1:Eradicate Extreme Poverty and Hunger

21
Goal 1: Eradicate Extreme Poverty and Hunger
ASEAN Statistical Report on Millennium Development Goals 2017
Table 1.2. Percentage of population below the $1.25 (PPP) in CLMV and in ASEAN-6 and the ratio of CLMV over ASEAN-6
YearTarget
1990 1995 2000 2005 2010 2015
ASEAN-6a 42 34 36 21 19 13 21
CLMVb 66 55 45 26 17 19 33
Ratio of CLMV to
ASEAN-61.58 1.62 1.23 1.22 0.90 1.46
Note: a Excludes Brunei Darussalam, Malaysia and Singaporeb Excludes Myanmar
Source: ASEAN Secretariat
0
5
10
15
20
25
30
35
40
45
50
1990 1995 2000 2005 2010 2015 Target
38
2219
14
23
39
Percen
t
47
Figure 1.1. Percentage of population below the $1.25 (PPP) in ASEAN, 1990-2015 & target
Note: ASEAN level excludes Brunei Darussalam, Malaysia, Myanmar and SingaporeSource: ASEAN Secretariat
Figure 1.2. Percentage of population below the $1.25 (PPP) in ASEAN and ASEAN Member States, 2015
Note: - ASEAN level excludes Brunei Darussalam, Malaysia, Myanmar and Singapore- Country and ASEAN targets in red
Source: ASEAN Secretariat
Four out of the six countries, namely Cambodia, Indonesia, Lao PDR, and Viet Nam have managed to reach the goal of reducing the rate of the population below the international line of US$1.25 PPP to less than half over this period. These countries managed
to reduce the rate to less than half. However, the other two countries, the Philippines and Thailand, did not manage to reach the target of cutting the poverty rate to half over these 25 years.
Regional disparity
The CLMV countries have achieved larger gains than the ASEAN-6. The three CLMV countries have reduced their poverty rate to 1/4 of the 1990 level, while only one of three ASEAN-6 countries managed to reach the target. Still, the rate in the CLMV countries is higher than in the ASEAN-6 countries. This achievement was notably due to the large decrease of poverty in Viet Nam, but even Cambodia and Lao PDR made large reductions. In the case of the ASEAN-6, they have also achieved a large reduction of the population below US$1.25 PPP to less than 1/3 of the 1990 level.
It is interesting to note that while in 1990 the poverty rate in the CLMV group was 1.63 times higher in the ASEAN-6 group, in the beginning of the 21st century they have been at a more equal footing.
2. Proportion of population below national poverty line
A focus on national poverty lines allows for the inclusion of Malaysia as well. This MDGs target was also reached. The proportion of the population below the poverty line has been reduced to less than half. In 1990, 31% of the population in the AMS lived below their national poverty lines. However, 25 years later, this rate was reduced to 14%, a rate less than half the rate it was in 1990.
Trends
In all AMS with the national poverty line3, less than one in four people are living below the national poverty line. In Malaysia and Viet Nam, even less than one of ten people are living below the national poverty line.
However, it should be noted that the levels of the national poverty lines are similar, but not the same. Hence, it is the trends that are comparable across countries, and not the levels.
3Brunei Darussalam and Singapore do not have national poverty lines and are excluded from tables 1.3 and 1.4 and from figures 1.3 and 1.4.

22
Goal 1: Eradicate Extreme Poverty and Hunger
ASEAN Statistical Report on Millennium Development Goals 2017
Table 1.3. Proportion of population below the national poverty line in ASEAN and ASEAN Member States*, 1990-2015
CountryYear
Target1990 1995 2000 2005 2010 2015
Cambodia 39 36 36 33 21 14 20
Indonesia 15 18 19 16 13 11 8
Lao PDR 49 43 36 30 24 17 25
Malaysia 17 9 9 6 4 1 8
Philippines 34 32 26 26 24 22 17
Thailand 34 17 21 10 17 14** 17
Viet Nam 72 58 29 16 14 7 36
ASEAN 31 27 25 18 15 14 15
Note: * - Not applicable to Brunei nor Singapore** - Imputation
Source: ASEAN Secretariat
Table 1.4. Percentage of population below the national poverty line in CLMV and ASEAN-6 and the ratio of CLMV to ASEAN-6
YearTarget
1990 1995 2000 2005 2010 2015
ASEAN-6a 22 20 20 16 15 13 11
CLMVb 67 54 30 19 16 9 34
Ratio of CLMV to
ASEAN-63.03 2.71 1.51 1.16 1.01 0.68
Note: a Excludes Brunei Darussalam and Singaporeb Excludes Myanmar
Source: ASEAN Secretariat
Figure 1.3. Proportion of population below the national poverty line in ASEAN, 1990-2015
0
5
10
15
20
25
30
35
1990 1995 2000 2005 2010 2015 Target
25
18
15 14 15
27
Percen
t
31
Note: Excludes Brunei Darussalam, Myanmar and SingaporeSource: ASEAN Secretariat
Figure 1.4. Proportion of population below the national poverty line in ASEAN & ASEAN Member States, 2015
Note: - ASEAN level excludes Brunei Darussalam, Myanmar and Singapore- Country and ASEAN targets in red
Source: ASEAN Secretariat
Regional disparity
It is noted that the ASEAN-64 countries have made a steady but slow reduction in poverty as measured by the national poverty line. The rate has been cut by 1/3, and only 14% lived below the national poverty lines in these countries in 2015. In comparison, the share of the population below the national poverty lines in the CLMV5 group was reduced from 67% to 9%, over the 25 years.
In 2015, the CLMV group has bypassed the ASEAN-6 group and the share of the population below the national poverty line is only 2/3 of the rate in the ASEAN-6 group. This may of course hide the fact that national poverty lines are exactly that, national. While being constructed with similar approaches, the levels may be different. Hence one should be cautious when making cross-country comparisons of the level of poverty. However, the trends may be compared and it then becomes clear that the trends in poverty reduction in the CLMV countries are remarkable also based upon the trends in the national poverty lines.
4This does not include Brunei Darussalam and Singapore which do not have national poverty lines5Only includes Cambodia, Lao PDR and Viet Nam as the data for Myanmar is not available

23
Goal 1: Eradicate Extreme Poverty and Hunger
ASEAN Statistical Report on Millennium Development Goals 2017
Target 1.B: Achieve full and productive
employment and decent work for all,
including women and young people
3. Employment-to-population ratio for people 15 years of age and above
This target is not easily measured as it is comprised of three dimensions, (1) to increase the share of the population including women and youth in the labour force; (2) to increase the share with employment with reasonable productivity; and (3) to increase the share with decent work. But in this report the focus is on the employment-to-population ratio.
Trends
Indeed, the share of the population with employment has increased steadily in ASEAN over the 25-year period, from 57% to 62%.
Myanmar, Thailand and Viet Nam have managed to move from quite low employment rates of 46% (1995), 40% and 44 % to respectable levels of 64%, 59% and 58% respectively, in 2015. Cambodia showed a remarkable increase from 66% to 83%. The increased employment ratio in these countries may be an important factor behind the large poverty reduction observed during the same period.
Indonesia, Malaysia, Philippines and Singapore all had rates at 60% or above, but have only managed to increase the rates slightly over the 25-year period. As for Brunei Darussalam, the employment-to-population ratio was around 60% throughout the period.
Table 1.6. Employment-to-population ratio in CLMV and ASEAN-6 and the ratio of CLMV to ASEAN-6
Year
1990 1995 2000 2005 2010 2015
ASEAN-6 59 60 60 58 61 61
CLMVa 47 48 50 53 57 62
Ratio of CLMV to
ASEAN-60.78 0.80 0.82 0.91 0.93 1.02
Note: a Excludes Lao PDRSource: ASEAN Secretariat
Table 1.5. Employment-to-population* ratio in ASEAN and ASEAN Member States 1990-2015
CountryYear
1990 1995 2000 2005 2010 2015
Brunei
Darussalam65 59 65 63 63 61
Cambodia 66 65 69 79 84 83
Indonesia 65 64 64 59 63 62
Malaysia 64 63 63 61 62 66
Myanmar 46 47 48 50 64
Philippines 59 59 57 59 59 60
Singapore** 62 60 59 59 64 66
Thailand 40 46 52 54 57 59
Viet Nam 44 46 48 52 56 58
ASEAN 57 56 57 57 60 62
Note: * - Population 15 years and above** - Data refer to Singapore citizens and resident population
Source: ASEAN Secretariat
Figure 1.5. Employment-to-population ratio in ASEAN, 1990-2015
0
10
20
30
40
50
60
70
80
90
100
1990 1995 2000 2005 2010 2015
57 5760 62
56
Percen
t
57
Note: Excludes Lao PDRSource: ASEAN Secretariat
24
Goal 1: Eradicate Extreme Poverty and Hunger
ASEAN Statistical Report on Millennium Development Goals 2017
Regional disparity
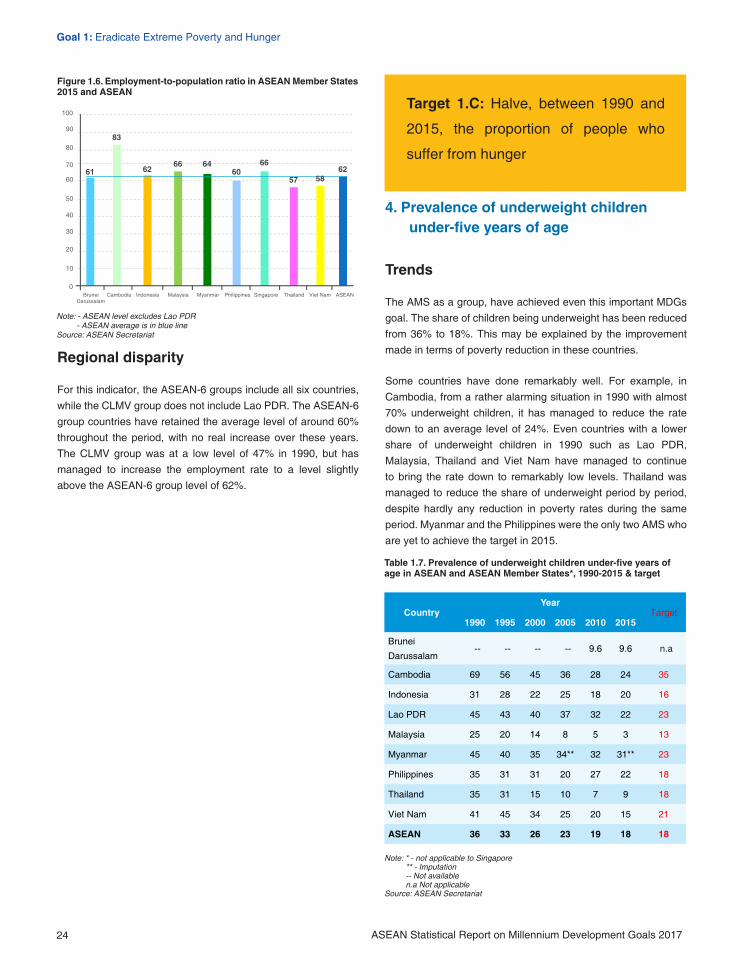
For this indicator, the ASEAN-6 groups include all six countries, while the CLMV group does not include Lao PDR. The ASEAN-6 group countries have retained the average level of around 60% throughout the period, with no real increase over these years. The CLMV group was at a low level of 47% in 1990, but has managed to increase the employment rate to a level slightly above the ASEAN-6 group level of 62%.
Target 1.C: Halve, between 1990 and
2015, the proportion of people who
suffer from hunger
4. Prevalence of underweight children under-five years of age
Trends
The AMS as a group, have achieved even this important MDGs goal. The share of children being underweight has been reduced from 36% to 18%. This may be explained by the improvement made in terms of poverty reduction in these countries.
Some countries have done remarkably well. For example, in Cambodia, from a rather alarming situation in 1990 with almost 70% underweight children, it has managed to reduce the rate down to an average level of 24%. Even countries with a lower share of underweight children in 1990 such as Lao PDR, Malaysia, Thailand and Viet Nam have managed to continue to bring the rate down to remarkably low levels. Thailand was managed to reduce the share of underweight period by period, despite hardly any reduction in poverty rates during the same period. Myanmar and the Philippines were the only two AMS who are yet to achieve the target in 2015.
Table 1.7. Prevalence of underweight children under-five years of age in ASEAN and ASEAN Member States*, 1990-2015 & target
CountryYear
Target1990 1995 2000 2005 2010 2015
Brunei
Darussalam-- -- -- -- 9.6 9.6 n.a
Cambodia 69 56 45 36 28 24 35
Indonesia 31 28 22 25 18 20 16
Lao PDR 45 43 40 37 32 22 23
Malaysia 25 20 14 8 5 3 13
Myanmar 45 40 35 34** 32 31** 23
Philippines 35 31 31 20 27 22 18
Thailand 35 31 15 10 7 9 18
Viet Nam 41 45 34 25 20 15 21
ASEAN 36 33 26 23 19 18 18
Note: * - not applicable to Singapore** - Imputation-- Not available n.a Not applicable
Source: ASEAN Secretariat
Figure 1.6. Employment-to-population ratio in ASEAN Member States 2015 and ASEAN
Note: - ASEAN level excludes Lao PDR- ASEAN average is in blue line
Source: ASEAN Secretariat

25
Goal 1: Eradicate Extreme Poverty and Hunger
ASEAN Statistical Report on Millennium Development Goals 2017
Table 1.8. Prevalence of underweight children under five years of age in CLMV and ASEAN-6 and the ratio of CLMV to ASEAN-6, 1990 2015 & target
YearTarget
1990 1995 2000 2005 2010 2015
ASEAN-6a 32 29 22 20 17 17 16
CLMV 45 44 36 29 25 20 22
Ratio of CLMV to
ASEAN-61.39 1.54 1.60 1.43 1.44 1.18
Note: a Excludes Singapore
Source: ASEANstats’ estimates based on Table 1.7.
Figure 1.7. Prevalence of underweight children under-five years of age in ASEAN, 1990-2015
0
5
10
15
20
25
30
35
40
1990 1995 2000 2005 2010 2015 Target
2623
19 18 18
33
Percen
t
36
Note: Excludes SingaporeSource: ASEAN Secretariat
Figure 1.8. Prevalence of underweight children under-five years of age in ASEAN and ASEAN Member States, 2015 (country and regional targets in red)
Note: - ASEAN level excludes Singapore- Country and ASEAN targets in red
Source: ASEAN Secretariat
Regional disparity
On average, both the ASEAN-6 and the CLMV countries have managed to reduce their share of underweight children. The ASEAN-6 started with a lower rate in 1990 and managed to reduce it by half in 2015. Nevertheless, they still fell short of reaching the target in 2015. On the other hand, the CLMV countries, have managed to cut the rate by more than half and reach the target in 2015. But the ratio between the two groups remained almost stable over the 25-year period.

26
Goal 2: Achieve Universal Primary Education
ASEAN Statistical Report on Millennium Development Goals 2017
Goal 2: Achieve Universal Primary Education
Target 2.A: Ensure that, by 2015,
children everywhere, boys and girls
alike, will be able to complete a full
course of primary schooling
5. Net enrolment ratio in primary education
For the goal of achieving universal primary education, the focus indicators used in the AMS are primary school enrolment and literacy.
Trends
As shown in table 2.1 and 2.2, the AMS have done well in ensuring and increasing full enrolment in primary school. The AMS had, on average, done relatively well in 1990 with an average enrolment rate of 83%. During the 25 years towards 2015, they managed to reduce the gap to full enrolment by 3/4 from 17% in 1990 only 4% in 2015. This achievement was mainly driven by Cambodia, Lao PDR, Myanmar and Thailand which were laying quite far behind in 1990. These four countries have been catching up during the 25 years and managed to increase their enrolment rate from around 70% or below in 1990 to 94 % or above, in 2015. The achievements in Lao PDR and Myanmar were particularly notable with net enrolment in primary education rate reaching 98-99% in 2015.
Brunei Darussalam and Singapore had already reached by 1990, almost full enrolment. Both these two countries continued to have high enrolment rates in 2015.

27
Goal 2: Achieve Universal Primary Education
ASEAN Statistical Report on Millennium Development Goals 2017
Table 2.2. Net enrolment ratio in primary education in CLMV and ASEAN-6 and the ratio of CLMV to ASEAN-6
YearTarget
1990 1995 2000 2005 2010 2015
ASEAN-6 85 88 92 92 95 96 100
CLMV 67 72 78 84 87 98 100
Ratio of CLMV to
ASEAN-60.78 0.82 0.84 0.92 0.91 1.02
Source: ASEAN Secretariat
Table 2.1. Net enrolment ratio in primary education in ASEAN and ASEAN Member States, 1990-2015 & target
CountryYear
Target1990 1995 2000 2005 2010 2015
Brunei
Darussalam105 102 100 97 97 98 100
Cambodia 72 76 84 92 95 94 100
Indonesia 89 91 92 93 95 97 100
Lao PDR 53 65 77 84 95 98 100
Malaysia n.a. n.a. 98 100 97 98 100
Myanmar 67 72 76 82 84 99 100
Philippines 85 93 97 84 96 91 100
Singapore* 96 96 96 97 100 100 100
Thailand 70 74 86 95 95 96 100
Viet Nam 87 78 93 95 98 99 100
ASEAN 83 85 91 91 95 96 100
Note: * - Singapore data refer to resident populationSource: ASEAN Secretariat
Figure 2.1. Net enrolment ratio in primary education in ASEAN, 1990-2015 & target
0
10
20
30
40
50
60
70
80
90
100
Percen
t
1990 1995 2000 2005 2010 2015 Target
91 9195 96
100
8583
Source: ASEAN Secretariat
Figure 2.2. Net enrolment ratio in primary education in ASEAN and ASEAN member states, 2015
Note: Red line is the target lineSource: ASEAN Secretariat
Regional disparity
In both the ASEAN-6 and CLMV countries, the enrolment rate increased steadily over 25 years. Both groups have managed to progress significantly towards full enrolment. In the CLMV, only Cambodia still has a way to go from the current 94% rate. In the ASEAN-6, only Philippines was still lagging behind with an enrolment rate of 91%. In 2015, on average, the rate was higher in the CLMV countries at 98% compared with 96% in the ASEAN-6.
6. Literacy rate of 15-24-year-olds, women and men
Trends
Given the high net enrolment rates for those at primary school age, one would expect the literacy rates among young adults to follow suit. In fact, the literacy rate was already at a relatively high level of 93% in 1990. It increased to 95% in 2000, and remained at the same level over the next ten years before reaching 97% in 2015. The literacy rates among the young adults in Cambodia, Lao PDR, Myanmar, Thailand and Viet Nam all have increased significantly and are now above 90%. In Brunei Darussalam, Malaysia, Philippines, and Singapore, the rates have been high throughout and remain so.

28
Goal 2: Achieve Universal Primary Education
ASEAN Statistical Report on Millennium Development Goals 2017
Table 2.3. Literacy rate of 15-24 year-olds in ASEAN and ASEAN Member States, 1990-2015 & target
CountryYear
Target1990 1995 2000 2005 2010 2015
Brunei
Darussalam98 n.a. 99 n.a. 99 100 100
Cambodia 65 79 82 81 89 92 100
Indonesia 98 98 98 91 93 100 100
Lao PDR 64 71 81 84 90 98 100
Malaysia 98 98 98 98 98 97 100
Myanmar 88 91 94 97 98 94 100
Philippines 97 97 95 98 99 98 100
Singapore* 99 n.a. 100 n.a. 100 100 100
Thailand 91 94 96 94 94 95 100
Viet Nam 87 89 90 94 94 95 100
ASEAN 93 93 95 93 95 97 100
Note: * - Singapore data refer to resident populationSource: ASEAN Secretariat
Table 2.4. Literacy rate of 15-24 year-olds in CLMV and ASEAN-6 and the ratio of CLMV to ASEAN-6
YearTarget
1990 1995 2000 2005 2010 2015
ASEAN-6 97 97 97 93 95 98 100
CLMV 85 88 91 93 95 95 100
Ratio of CLMV to
ASEAN-60.88 0.91 0.93 1.00 1.00 0.96
Source: ASEAN Secretariat
Figure 2.3. Literacy rate of 15-24 year-olds in ASEAN, 1990-2015 & target
0
10
20
30
40
50
60
70
80
90
100
Percen
t
1990 1995 2000 2005 2010 2015 Target
9593
9597
100
9393
Source: ASEAN Secretariat
Figure 2.4. Literacy rate of 15-24 year-olds in ASEAN and ASEAN Member States, 2015
Note: Red line is the targetSource: ASEAN Secretariat
Regional disparity
The literacy rates show a clear regional disparity. On average, the rates of the ASEAN-6 countries have been high throughout the period, and reach, 98%, in 2015. On the other hand, the rates of the CLMV countries was low at the beginning of the period, but showed remarkable progress, reaching 95% in 2015, which is almost the same as ASEAN-6 rates.

29
Goal 3: Promote Gender Equality and Empower Women
ASEAN Statistical Report on Millennium Development Goals 2017
Goal 3: Promote Gender Equality and Empower Women
Target 3.A: Eliminate gender disparity
in primary and secondary education,
preferably by 2005, and in all levels of
education no later than 2015
7. Ratios of girls to boys in primary
Trends
In order for girls to reach the same level of education as boys, it is essential to work towards equal enrolment from primary to tertiary education. On average, the AMS already did relatively well in 1995 with a ratio of 95 girls to 100 boys in primary education. The ratio moved even closer to equal opportunities for both genders in 2015 with 97 girls to 100 boys in school. In 1995, Cambodia, Lao PDR and Viet Nam lagged behind with respectively 75, 78 and 88 girls for each 100 boys. However, all the three countries have managed to reduce the gap to 92 girls or more for each 100 boys in 2015. In several countries, such as Cambodia, Indonesia, Malaysia, and Singapore, there are at least 100 girls per 100 boys in primary school. Unfortunately, Thailand has experienced the opposite. In 2015, there were only 90 girls per 100 boys in school.
Table 3.1. Ratio of girls to boys in primary education in ASEAN and ASEAN Member States, 1995-2015 & target
CountryYear
Target1995 2000 2005 2010 2015
Brunei
Darussalam0.90 0.90 0.92 0.93 0.94 1.00
Cambodia 0.75 0.85 0.96 0.97 1.01 1.00
Indonesia 1.00 1.00 1.00 1.00 1.00 1.00
Lao PDR 0.78 0.82 0.85 0.91 0.92 1.00
Malaysia 0.95 1.00 1.00* 1.00 1.01 1.00
Myanmar 0.94 0.97 0.99 0.98 0.96 1.00
Philippines 0.97 0.96 0.94 0.92 0.98 1.00
Singapore 0.99 0.99 0.99 1.00 1.00 1.00
Thailand 0.92 0.93 0.93 0.94 0.90 1.00
Viet Nam 0.88 0.90 0.93 0.93 0.93 1.00
ASEAN 0.95 0.96 0.97 0.97 0.97 1.00
Note: * - ImputationSource: ASEAN Secretariat

30
Goal 3: Promote Gender Equality and Empower Women
ASEAN Statistical Report on Millennium Development Goals 2017
Table 3.2. Ratio of girls to boys in primary education in ASEAN-6 and CLMV and the ratio of CLMV to ASEAN-6, 1990-2015 & target
YearTarget
1995 2000 2005 2010 2015
ASEAN-6 0.98 0.98 0.98 0.97 0.98 1.00
CLMV 0.89 0.92 0.95 0.95 0.95 1.00
Ratio of CLMV to
ASEAN-60.91 0.94 0.97 0.97 0.97
Source: ASEAN Secretariat
Source: ASEAN Secretariat
0.20
0.00
0.40
0.60
0.80
1.00
1.20
1.40
Percen
t
1995 2000 2005 2010 2015 Target
0.97 0.97 0.97 1.000.960.95
Figure 3.1. Ratio of girls to boys in primary education in ASEAN, 1995-2015 & target
Figure 3.2. Ratio of girls to boys in primary education in ASEAN and ASEAN Member States, 2015
Note: Red line is the targetSource: ASEAN Secretariat
Regional disparity
The ASEAN-6 has been close to the target of gender equality in primary education throughout the period. In 1995, the ratio of girls to boys was 0.98 and it still remained so in 2015. Meanwhile in 1995, the CLMV was 0.11 below 1.00. However, the gap has decreased continuously to 0.04 in 2005 and 0.03 in 2015.
8. Ratio of girls to boys in secondary education
Trends
In 1990, the ratio of girls to boys in secondary was 0.91, which is lower than primary school. However, this situation has improved over the 25 years. In 2015, there were on average, 104 girls to 100 boys in secondary school. This is again a remarkable
achievement. And in countries such as Indonesia, Malaysia, Myanmar, Philippines, Singapore and Thailand, there are an equal or higher number of girls than boys in secondary school. This may allow for a larger share of women in the educated segments of the labour force in the coming years and hence a larger economic development in the years to come. Brunei Darussalam, Cambodia, Lao PDR and Viet Nam however still lag behind. While Cambodia, Lao PDR and Viet Nam have been moving steadily towards a ratio of 1.0 throughout the period, the ratio in Brunei Darussalam has declined.
Table 3.3. Ratio of girls to boys in secondary education in ASEAN and ASEAN Member States, 1990-2015 & target
CountryYear
Target1990 1995 2000 2005 2010 2015
Brunei
Darussalam1.05 1.08 1.03 0.97 0.96 0.92 1.00
Cambodia 0.70 0.79 0.83 0.90 0.91 1.09 1.00
Indonesia 0.85 1.01 1.04 1.03 1.02 1.03* 1.00
Lao PDR 0.66 0.67 0.70 0.76 0.58 0.89 1.00
Malaysia 1.01 1.03 1.09 1.10 1.08 1.11 1.00
Myanmar 0.94 1.00 1.05 0.96 1.04 1.07 1.00
Philippines 1.00 1.04 1.05 1.07 1.04 1.07 1.00
Singapore 1.06 1.01 1.00 1.00 1.00 1.00 1.00
Thailand 0.97 1.02 1.06 1.09 1.06 1.10 1.00
Viet Nam 0.91 0.86 0.88 0.94 0.96 0.95 1.00
ASEAN 0.91 0.98 1.01 1.02 1.02 1.04 1.00
Note: * - ImputationSource: ASEAN Secretariat
Table 3.4. Ratio of girls to boys in secondary school in ASEAN-6 and CLMV and the ratio of CLMV to ASEAN-6, 1990-2015 & target
YearTarget
1990 1995 2000 2005 2010 2015
ASEAN-6 0.91 1.02 1.05 1.05 1.03 1.05 1.00
CLMV 0.90 0.90 0.93 0.94 0.97 1.00 1.00
0.98 0.88 0.89 0.89 0.93 0.95
Source: ASEAN Secretariat

31
Goal 3: Promote Gender Equality and Empower Women
ASEAN Statistical Report on Millennium Development Goals 2017
Figure 3.3. Ratio of girls to boys in secondary education in ASEAN, 1990-2015 & target
0.20
0.00
0.40
0.60
0.80
1.00
1.20
1.40
Percen
t
19951990 2000 2005 2010 2015 Target
1.01 1.02 1.02 1.041.00
0.980.91
Source: ASEAN Secretariat
Figure 3.4. Ratio of girls to boys in secondary education in ASEAN and ASEAN Member States, 2015
Note: Red line is the targetSource: ASEAN Secretariat
Regional disparity
The ASEAN-6 and the CLMV have experienced the same trend with regard to the ratio of girls to boys in secondary school. The ASEAN-6 showed an increasing trend, reaching 1.05 in 2000 and retaining the level of 1.05 in 2005 and 2015. Similarly, The CLMV moved in the same direction albeit with slightly lower achievement; 0.92 in 2005 and 0.99 in 2015.
9. Ratio of girls to boys in tertiary education
Trends
On average, the AMS had reached equal opportunities for girls and boys in tertiary education in the year 2000. In fact, the ratio (1.02) was slightly exceeding the target (1.00). Moreover, the ratio kept increasing and had reached 1.23 in 2015.
In 2000, the ratio of girls to boys was higher than 0.8 in all AMS except Cambodia (0.34) and Lao PDR (0.52). In the same year, the ratio in Brunei Darussalam, Malaysia, Myanmar, Philippines and Thailand exceeded the target of 1.0. Over the subsequent 15 years, the ratio had gradually increased. By 2015, eight out
of ten AMS exceeded the target. Only Cambodia and Lao PDR was below the target, with the ratio of girls to boys being 0.85 and 0.27 respectively.
While the ratio of girls to boys in tertiary education in Brunei Darussalam, Malaysia, Myanmar, Philippines and Thailand have always been above 1.0 during the period of 2000-2015, Indonesia and Singapore made gradual improvements exceeding 1.0 from the year 2010.
Table 3.5. Ratio of girls to boys in tertiary education in ASEAN and ASEAN Member States, 2000-2015 & target
CountryYear
Target2000 2005 2010 2015
Brunei Darussalam 1.25 1.36 1.27 1.48 1.00
Cambodia 0.34 0.48 0.69 0.85* 1.00
Indonesia 0.85 0.94 1.10 1.22 1.00
Lao PDR 0.52 0.66 0.30 0.27* 1.00
Malaysia 1.04 1.27 1.24 1.21 1.00
Myanmar 1.56 1.58 1.52 1.51* 1.00
Philippines 1.25 1.20 1.22 1.23 1.00
Singapore 0.91 0.98 1.08 1.11 1.00
Thailand 1.25 1.21 1.20 1.40 1.00
Viet Nam 0.88 0.97 1.14 1.15 1.00
ASEAN 1.02 1.07 1.16 1.23 1.00
Note: * - ImputationSource: ASEAN Secretariat
Table 3.6. Ratio of girls to boys in tertiary education in ASEAN-6 and CLMV and the ratio of CLMV to ASEAN-6, 2000-2015 & target
YearTarget
2000 2005 2010 2015
ASEAN-6 1.01 1.06 1.15 1.25 1.00
CLMV 1.06 1.11 1.19 1.20 1.00
Ratio of CLMV to
ASEAN-61.04 1.05 1.03 0.96
Source: ASEAN Secretariat

32
Goal 3: Promote Gender Equality and Empower Women
ASEAN Statistical Report on Millennium Development Goals 2017
Figure 3.6. Ratio of girls to boys in tertiary education in ASEAN and ASEAN Member States, 2015
Note: Red line is the targetSource: ASEAN Secretariat
Figure 3.5. Ratio of girls to boys in tertiary education in ASEAN, 2000-2015 & target
0.20
0.00
0.40
0.60
0.80
1.00
1.20
1.40
Percen
t
2000 2005 2010 2015 Target
1.071.16
1.23
1.001.02
Source: ASEAN Secretariat
Regional disparity
The ratios of girls to boys in tertiary education do not show the same regional disparities as in primary and secondary schools. Among both the ASEAN-6 and the CLMV countries, the average ratio was above 1.00 in 2000 and has continued to grow. In both groups, the ratio was well above 110 girls to 100 boys in both 2010 and in 2015.
10. Proportion of seats held by women in national parliament
Another target for the further empowerment of women is to increase their share of seats in parliaments. As this concerns empowerment of women in the political scene which relies on a host of factors, the targets may be more difficult to be reached and may take longer time to be attained.
Table 3.7. Proportion of seats held by women in national parliament in ASEAN and ASEAN Member States*, 1995-2015 & target
CountryYear
Target1995 2000 2005 2010 2015
Cambodia 6 n.a. 11 21 20 50
Indonesia 12 10 12 18 17 50
Lao PDR 9 21 23 n.a. 25 50
Malaysia 7 n.a. n.a. 8 11 50
Myanmar n.a. n.a. n.a. n.a. 5 50
Philippines 11 12 17 21 26 50
Singapore 5 7 16 25 25 50
Thailand 4 6 8 13 13 50
Viet Nam 19 26 27 26 24 50
ASEAN* 9 9 15 16 18 50
Note: * - Excludes Brunei Darussalam
n.a Not availableSource: ASEAN Secretariat
Figure 3.7. Proportion of seats held by women in national parliament in ASEAN, 1995-2015 & target
15
50
99
1618
50
1995 20000
5
10
15
20
25
30
35
40
45
50
999
Percen
t
2005 2010 2015 Target
Note: Excludes Brunei DarussalamSource: ASEAN Secretariat
Table 3.8. Proportion of seats held by women in national parliament in ASEAN-6 and CLMV and the ratio of CLMV to ASEAN-6, 1995-2015 & target
CountryYear
Target1995 2000 2005 2010 2015
ASEAN-6 7.86 8.75 13.25 17.00 18.40 50
CLMV 11.47 23.60 20.30 23.50 18.60 50
Ratio of CLMV to
ASEAN-61.46 2.70 1.53 1.38 1.01
Source: ASEAN Secretariat

33
Goal 3: Promote Gender Equality and Empower Women
ASEAN Statistical Report on Millennium Development Goals 2017
Trends
In the case of ASEAN, the share of women in national parliaments stood at 18% in 2015. This figure is twice as much compared to 1995. However, it was still far from the target (50%) and it probably needs a relatively longer time to achieve it.
This slow pace of change is seen in most AMS, with Singapore and Lao PDR as exceptions. The share of women in Singapore’s national parliament has increased from 5% in 1995 to 25% in 2015. In the same period, the figure in Lao PDR has also increased from 9% to 25%. The lowest share of women in national parliaments in 2015 was in Myanmar and Malaysia, at 5% and 11% respectively.
Considering the significant improvement in gender disparities in the field of education, it is expected that the share of women in national parliaments of the AMS will also be positively improved in the years to come.
Regional disparity
In the last two decades the CLMV countries had experienced better situation compared to the ASEAN-6 in term of woman participation in national parliaments. During the period the shares of women in the national parliaments of CLMV had always been above 10%, even reaching around 20% since year 2000. In the same period, the ASEAN-6 countries had reduced the gap by improving the figures from less than 10% in 1995 to nearly 20% in 2015.
Figure 3.8. Proportion of seats held by women in national parliament in ASEAN and ASEAN Member States, 2015
Note: - ASEAN level excludes Brunei Darussalam- Red line is the target
Source: ASEAN Secretariat

34
Goal 4: Reduce Child Mortality
ASEAN Statistical Report on Millennium Development Goals 2017
Goal 4: Reduce Child Mortality
Target 4.A: Reduce by 2/3, between
1990 and 2015, the under-five
mortality rate.
11. Under-five mortality rate
Trends
On average, the AMS have achieved a large reduction in child mortality, and could meet the MDGs target to reduce the rate by 2/3. The target was quite ambitious in its effort to not just reduce the rate by half, but by 2/3. The average of under-five mortality rate in AMS was 82 out of 1000 children born alive in 1990, and had decreased to 25 in 2015.
There was a very large variation in the under-five mortality rate across ASEAN countries, from eight to 181 of 1000 children born alive in 1990. While the rates have in fact, been reduced over the years, the variation is still very high, from three to 86 out of 1000 children having passed away before they reached their fifth birthday in 2015.
Considering the data at country level, two different phenomena can be observed. The countries with high under-five mortality rates in 1990 have all reduced the rates to just a fraction in 2015. However, among the countries with low rates in 1990, Malaysia and Singapore have managed to continue to lower the rates to less than half, while others such as Thailand and Brunei Darussalam have been progressing on a relatively slower pace.

35
Goal 4: Reduce Child Mortality
ASEAN Statistical Report on Millennium Development Goals 2017
Table 4.1. Under-five mortality rate in ASEAN and ASEAN Member States, 1990-2015 & target
CountryYear
Target1990 1995 2000 2005 2010 2015
Brunei
Darussalam10 10 10 10 7 10 3
Cambodia 181 135 124 83 54 35 60
Indonesia 97 81 55 45 42 26 32
Lao PDR 170 150 131 98 76 86 57
Malaysia 17 13 8 9 8 8 6
Myanmar 130 82 76 71 35 52 43
Philippines 80 67 49 34 36 31 27
Singapore* 8 5 4 3 3 3 3
Thailand 13 12 12 11 10 9 4
Viet Nam 58 52 45 27 24 22 19
ASEAN 79 65 49 38 33 26 26
Note: * - Singapore data refer to resident populationSource: ASEAN Secretariat
Table 4.2. Under-five mortality rate in ASEAN-6 and CLMV and the ratio of CLMV to ASEAN-6, 1990-2015 & target
YearTarget
1990 1995 2000 2005 2010 2015
ASEAN-6 73 61 43 34 33 23 24
CLMV 95 73 66 49 32 35 32
Ratio of CLMV to
ASEAN-61.30 1.19 1.53 1.43 0.98 1.53
Source: ASEAN Secretariat
Figure 4.1. Under-five mortality rate in ASEAN, 1990-2015 & target
0
10
20
30
40
50
60
70
80
90
100
Percen
t
1990 1995 2000 2005 2010 2015 Target
49
3833
26 26
65
79
Source: ASEAN Secretariat
Figure 4.2. Under-five mortality rate in ASEAN and ASEAN Member States, 2015
Note: Country and ASEAN target in redSource: ASEAN Secretariat
Regional disparity
In 1990, the ASEAN-6 countries had already achieved a relatively low level of under-five mortality rate. They continued to reduce the rate and reached the target of a 2/3 reduction.
The mortality rates were higher in the CLMV countries in 1990, but they have managed to significantly reduce the rate over the 25 years. However, it is noteworthy that even though the CLMV countries did manage to cut the rate by 2/3 in 2010, they couldn’t maintain the low rate in 2015.
12. Infant mortality rate
The target of a 2/3 reduction is also applied on the infant mortality rate. In this regard, it would require the infant mortality rate to be reduced from 57 of 1000 children in 1990 to 19 of 1000 in 2015.
Trends
The figures show that though the AMS have done relatively well on reducing the infant mortality rate, they are yet to achieve the MDGs’s target. In 2015, the AMS on average have managed to reduce the rate to 20 of 1000, which is still above the target of 19.
Similar to the case of under-five mortality, there was a large variation observed across the AMS for infant mortality. However, similar pattern of steady reduction was observed in all countries except for Brunei Darussalam and Thailand which both have already reached a low level in 1990, and have remained so.

36
Goal 4: Reduce Child Mortality
ASEAN Statistical Report on Millennium Development Goals 2017
Table 4.4. Infant mortality rate in ASEAN-6 and CLMV and the ratio of CLMV to ASEAN-6, 1990-2015 & target
YearTarget
1990 1995 2000 2005 2010 2015
ASEAN-6 52 43 34 23 23 19 17
CLMV 72 53 45 34 24 25 24
Ratio of CLMV to
ASEAN-61.40 1.21 1.31 1.48 1.02 1.36
Source: ASEAN Secretariat
Figure 4.3. Infant mortality rate in ASEAN, 1990-2015 & target
0
10
20
30
40
50
60
70
Percen
t
1990 1995 2000 2005 2010 2015 Target
36
26 2320 19
46
57
Source: ASEAN Secretariat
The figures show that the infant mortality rate has been reduced to less than half in the ASEAN-6 group, but that they missed the target of 2/3 reduction. The CLMV countries did slightly better. They managed to reduce the rate to 32% and hence managed to reach the target of a 2/3 reduction in their infant mortality rate over these 25 years.
The CLMV group started out with a substantially higher rate than the ASEAN-6 countries, but has managed to reduce the gap over these 25 years especially with large reductions in every five-year period up to 2010 before stabilising towards 2015.
13. Proportion of one-year-old children immunised against measles
There is no official target for the proportion of children being immunised against measles, but since measles is a highly contagious disease it is estimated that a coverage of around 95 percent is needed to achieve so called herd immunity6. If 95 percent or more of the children are vaccinated, a single case of the disease will not spread in the community as when the measles viruses are trying to move on to other children, they will not be able to find enough un-vaccinated children. Hence even the few children who are not vaccinated will be safe.
Trends
In 1995, the proportion of one-year-old children immunised against measles in Brunei Darussalam, Singapore6, Thailand, and Viet Nam was already relatively high at around 95% or above and remained so until 2015. The samel level was reached by Malaysia in 2015 while in Indonesia, Lao PDR, Myanmar and Philippines it was around 80%. On the other hand, in Cambodia, the rate was still relatively low at 70%.
6Singapore’s data are based on the proportion of children aged 2 years immunised against measles
Table 4.3. Infant mortality rate in ASEAN and ASEAN Member States, 1990-2015 & target
CountryYear
Target1990 1995 2000 2005 2010 2015
Brunei
Darussalam7 8 7 7 6 9 2
Cambodia 142 114 95 66 45 27 47
Indonesia 68 57 46 28 29 22 23
Lao PDR 114 104 82 70 57 57 38
Malaysia 13 10 6 7 7 7 4
Myanmar 98 55 50 47 27 39 33
Philippines 57 49 37 27 27 23 19
Singapore* 7 4 3 2 2 2 2
Thailand 8 7 6 8 7 6 3
Viet Nam 45 38 31 18 16 15 15
ASEAN 57 46 37 26 23 20 19
Note: * - Singapore data refer to resident populationSource: ASEAN Secretariat
Figure 4.4. Infant mortality rate in ASEAN and ASEAN Member States, 2015 (country and regional target in red)
Source: ASEAN Secretariat

37
Goal 4: Reduce Child Mortality
ASEAN Statistical Report on Millennium Development Goals 2017
Table 4.5. Proportion of one-year-old children immunised against measles in ASEAN and ASEAN Member States, 1995-2015
CountryYear
Target1995 2000 2005 2010 2015
Brunei
Darussalam100 99 97 94 96 100
Cambodia 22 55 77 77 70 100
Indonesia 50 50 62 75 82 100
Lao PDR 67 71 52 55 76 100
Malaysia 86 88 90 96 93 100
Myanmar 82 84 78 87 84 100
Philippines 84 86 84 71 77 100
Singapore* 97 96 96 95 95 100
Thailand 93 95 97 99 100 100
Viet Nam 95 96 97 98 97 100
ASEAN 71 73 78 83 86 100
Note: * - Singapore data refer to children below 2 years of age who are citicens or permanent residentsSource: ASEAN Secretariat
Table 4.6. Proportion of one-year-old immunized against measles in ASEAN-6 and CLMV and ratio of CLMV to ASEAN-6, 1995-2015
YearTarget
1995 2000 2005 2010 2015
ASEAN-6 67 68 75 80 85 100
CLMV 83 87 87 91 89 100
Ratio of CLMV to
ASEAN-60.78 0.83 0.87 0.83 1.05
Source: ASEAN Secretariat
Figure 4.5. Proportion of one-year-old children immunised against measles in ASEAN, 1995-2015
0
10
20
30
40
50
60
70
80
90
100
1995 2000 2005 2010 2015
7378
8386
71
Percen
t
Target
100
Source: ASEAN Secretariat
Regional disparity
In terms of regional disparity, the data shows that the ASEAN-6 presents a lower rate than the CLMV. Despite its faster progress of improvement, in 2015, the rate in the ASEAN-6 of 85% is still 4 percentage point lower when compared to CLMV.
As already referred to, the critical goal is not to reach 100% coverage, but to reach and retain a level of at least 95%. This has been achieved in countries at as different stages of economic development as Brunei Darussalam, Malaysia, Singapore, Thailand and Viet Nam.
Figure 4.6. Proportion of one-year-old children immunised against measles in ASEAN and ASEAN Member States, 2015
Note: Red line is the targetSource: ASEAN Secretariat

38
Goal 5: Improve Maternal Health
ASEAN Statistical Report on Millennium Development Goals 2017
Goal 5: Improve Maternal Health
Target 5.A: Reduce by three quarters,
between 1990 and 2015, the maternal
mortality ratio
14. Maternal mortality ratio
The global goal for reduction of the maternal mortality ratio was a challenging one— a reduction by 3/4 from the 1990 level. Not all ASEAN countries had proper maternal mortality statistics in 1990 and therefore, the calculations at the starting point may not be very accurate. Generally, the rate was reduced to almost half the initial level in 2015, hence there is still a long way to go. In order to reach the original goal, the rate has again to be reduced by half.
Trends
The trend for maternal mortality varies substantially within ASEAN countries. Brunei Darussalam, Malaysia, Singapore and Thailand all have reasonably low rates, but none of the countries can document a clear reduction. The Philippines, and especially Indonesia, have experienced high mortality throughout the period. The achievement of Cambodia, Myanmar and Viet Nam are notable where the ratios have been reduced to less than half over the 25 years. However, it is only in Viet Nam where the achievement is close to the goal of a reduction of 3/4.
Table 5.1. Maternal mortality ratio in ASEAN and ASEAN Member States, 1990-2015 & target
CountryYear
Target1990 1995 2000 2005 2010 2015
Brunei
Darussalam0 0 27 14 16 60 0
Cambodia 367 402 437 472 206 170 92
Indonesia 390 353 320 268 228 305 98
Lao PDR 680 605 530 405 280 357 170
Malaysia 19 19 24 27 26 24 5
Myanmar 420 350 152 117 142 180 105
Philippines* 164 170 176 144 129 221 41
Singapore* 2 4 17 13 3 7 1
Thailand 25 11 13 12 10 25 6
Viet Nam 233 182 131 80 69 69 58
ASEAN 286 245 206 170 145 197 72
Note: * - Per 100,000 live and still births- Maternal deaths per 100,000 live births
Source: ASEAN Secretariat

39
Goal 5: Improve Maternal Health
ASEAN Statistical Report on Millennium Development Goals 2017
Table 5.2. Maternal mortality ratio in ASEAN-6 and CLMV and the ratio of CLMV to ASEAN-6, 1990-2015 & target
YearTarget
1990 1995 2000 2005 2010 2015
ASEAN-6 272 234 217 182 157 222 68
CLMV 322 274 179 140 113 125 80
Ratio of CLMV to
ASEAN-61.18 1.17 0.83 0.77 0.72 0.56
Note: Maternal deaths per 100,000 live birthsSource: ASEAN Secretariat
Figure 5.1. Maternal mortality ratio in ASEAN, 1990-2015 & target
50
0
100
150
200
250
300
350
Percen
t
19951990 2000 2005 2010 2015 Target
206
170145
197
72
245
286
Source: ASEAN Secretariat
Regional disparity
During the period of 1990-2015, the CLMV seemed to move faster than the ASEAN-6 in reducing the rate of maternal mortality. On average, the CLMV has reduced the rate by more than 60% compared to only by around 20% in the ASEAN-6. However, a greater effort is needed to achieve the targeted goal for both groups.
15. Proportion of births attended by skilled health personnel
One of the main instruments to reduce maternal mortality is to ensure that births are attended by skilled health personnel. Hence this is not an end-goal, but rather an instrumental goal which would help towards achieving reduced maternal mortality rates.
Trends
In 1995, the proportion of births attended by skilled health personnel in Brunei Darussalam, Malaysia, Singapore, Thailand and Viet Nam was as high as 88% to 100%. Unfortunately, the figures of the remaining countries were far below 70%. On average, the rate of ASEAN countries was just slightly above 50%. During the following two decades, the indicator has remarkably improved. In 2015, in nine out of ten AMS, over 85% of births were attended by skilled health personnel. Lao PDR is the only country to have low level of skilled health personnel attendance in births (42% in 2010 and 37% in 2015). The rate has increased steadily in Cambodia, Indonesia, Myanmar and the Philippines, where the rate varied from 77% to 90%.
Figure 5.2 Maternal mortality ratio in ASEAN and ASEAN Member States, 2015 (country and regional targets)
Source: ASEAN Secretariat

40
Goal 5: Improve Maternal Health
ASEAN Statistical Report on Millennium Development Goals 2017
Table 5.3. Proportion of births attended by skilled health personnel In ASEAN and ASEAN Member States, 1995-2015
CountryYear
Target1995 2000 2005 2010 2015
Brunei
Darussalam99 100 100 100 100 100
Cambodia 20 32 44 71 89 100
Indonesia 46 63 70 80 92 100
Lao PDR 15 14 23 42 37* 100
Malaysia 95 97 98 99 99 100
Myanmar 11 33 58 62 77 100
Philippines 63 69 68 76 87 100
Singapore 100 100 100 100 100 100
Thailand 91 99 98 98 100 100
Viet Nam 88 95 96 97 98 100
ASEAN 58 71 76 83 91 100
Note: * - ImputationSource: ASEAN Secretariat
Table 5.4. Proportion of births attended by skilled health person-nel in ASEAN-6 and CLMV and the ratio of CLMV to ASEAN-6
YearTarget
1995 2000 2005 2010 2015
ASEAN-6 61 73 76 83 93 100
CLMV 53 65 76 81 88 100
Ratio of CLMV to
ASEAN-60.87 0.89 1.00 0.98 0.95
Source: ASEAN Secretariat
Figure 5.3. Proportion of births attended by skilled health personnel In ASEAN, 1995-2015
7671
58
8391
100
1995 20000
20
40
60
80
100
120
Percen
t
2005 2010 2015 Target
Source: ASEAN Secretariat
Figure 5.4. Proportion of births attended by skilled health personnel In ASEAN and ASEAN Member States, 2015
Note: Red line is the targetSource: ASEAN Secretariat
Regional disparity
Two decades ago, there was a clear disparity between the ASEAN-6 and the CLMV in the rates of births attended by skilled health personnel. In 1995, the rate in ASEAN-6 was 61%, as compared to 53% in CLMV.
Up until 2005, the regional disparity was eliminated. But despite both groups of countries moving towards a higher rate of skilled birth attendance, the ASEAN-6 have moved faster and remains well ahead of the CLMV countries.

41
Goal 6: Combat HIV/AIDS, Malaria and Other Diseases
ASEAN Statistical Report on Millennium Development Goals 2017
Goal 6: Combat HIV/AIDS, Malaria and Other Diseases
Target 6.C: Have halted by 2015, and
begun to reverse, the incidence of
malaria and other major diseases
16. Incidence and death rates associated with malaria
This MDGs goal had a broad scope of reducing some of the major global diseases. The main goals are to reduce the incidence, prevalence and death rates for all these diseases. The AMS embarked upon large programmes to reduce incidence and death rates of malaria, and have succeeded.
Trends
On average, the incidence of malaria in ASEAN was 745 per 100,000 population in 1990, and decreased sharply to only 90 per 100,000 population in 2015.
During the period of 1990-2015, Brunei Darussalam and Singapore, which had already a very low incidence, were always able to maintain the rate to almost zero. Viet Nam is probably the most progressive country in this regard by reducing the rate from 1357 in 1990, to close to zero in 2015. During the same period, Malaysia, the Philippines and Thailand have also progressed by reducing the incidence to below 10 per 100,000 population. But two countries, Cambodia and especially Myanmar, are still struggling in combating malaria.

42
Goal 6: Combat HIV/AIDS, Malaria and Other Diseases
ASEAN Statistical Report on Millennium Development Goals 2017
Table 6.2. Incidence of malaria per 100,000 people in ASEAN-6 and CLMV and the ratio of CLMV to ASEAN-6, 1990-2015
Year
1990 1995 2000 2005 2010 2015
ASEAN-6 395 222 240 243 119 51
CLMVa 1707 1120 670 498 388 203
Ratio of CLMV to
ASEAN-64.32 5.04 2.79 2.05 3.27 3.98
Note: a Excludes Lao PDR
Source: ASEAN Secretariat
Table 6.1. Incidence of malaria per 100,000 people in ASEAN and ASEAN Member States, 1990-2015
Country
Year
1990 1995 2000 2005 2010 2015
Brunei
Darussalam15 12 9 4 4 0*
Cambodia 2783 1881 1103 550 407 152
Indonesia 468 283 362 410 196 85
Malaysia 289 286 55 21 24 8
Myanmar 2046 1249 1011 1121 943 574*
Philippines 119 89 67 43 13 8
Singapore** 7 9 7 4 4 1
Thailand 520 171 136 46 40 9
Viet Nam 1357 915 377 121 62 35
ASEAN 745 468 357 311 188 90
Note: * - Imputation ** - Singapore data refer to total population
Source: ASEAN Secretariat
Figure 6.1. Incidence of malaria per 100,000 people in ASEAN, 1990-2015
0
100
200
300
400
500
600
700
800
Percen
t
1990 1995 2000 2005 2010 2015
357 311
188
90
486
745
Note: Excludes Lao PDRSource: ASEAN Secretariat
Figure 6.2. Incidence of malaria per 100,000 people in ASEAN and ASEAN Member States, 2015
0
100
200
300
400
500
600
700
0
15285
8
574
8 1 035
90
Note: - ASEAN level excludes Lao PDR
- ASEAN average in blue line
Source: ASEAN Secretariat
Regional disparity
The regional disparities between CLMV and ASEAN-6 are significant for the incidence of malaria. The incidence rates were four times higher in the CLMV countries in 1990 and is still four times higher in 2015. Incidences had been greatly reduced in both groups of countries by 1995. For the CLMV countries, the reduced incidence continued, but slowed down for a period in the ASEAN-6. Hence the gap between the two country-groups was substantially reduced. However, since 2005, the ASEAN-6 have again picked up their efforts and the average rate in 2015 was only around 1/8 of the rate it was in 1990, in both the ASEAN-6 and the CLMV countries.
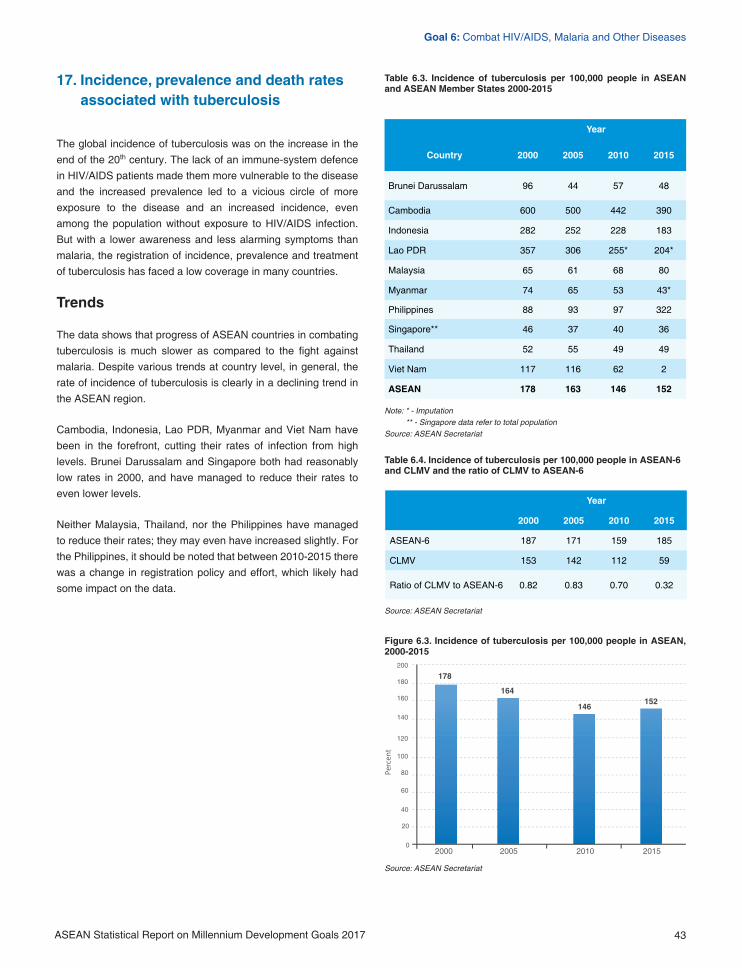
43
Goal 6: Combat HIV/AIDS, Malaria and Other Diseases
ASEAN Statistical Report on Millennium Development Goals 2017
17. Incidence, prevalence and death rates associated with tuberculosis
The global incidence of tuberculosis was on the increase in the end of the 20th century. The lack of an immune-system defence in HIV/AIDS patients made them more vulnerable to the disease and the increased prevalence led to a vicious circle of more exposure to the disease and an increased incidence, even among the population without exposure to HIV/AIDS infection. But with a lower awareness and less alarming symptoms than malaria, the registration of incidence, prevalence and treatment of tuberculosis has faced a low coverage in many countries.
Trends
The data shows that progress of ASEAN countries in combating tuberculosis is much slower as compared to the fight against malaria. Despite various trends at country level, in general, the rate of incidence of tuberculosis is clearly in a declining trend in the ASEAN region.
Cambodia, Indonesia, Lao PDR, Myanmar and Viet Nam have been in the forefront, cutting their rates of infection from high levels. Brunei Darussalam and Singapore both had reasonably low rates in 2000, and have managed to reduce their rates to even lower levels.
Neither Malaysia, Thailand, nor the Philippines have managed to reduce their rates; they may even have increased slightly. For the Philippines, it should be noted that between 2010-2015 there was a change in registration policy and effort, which likely had some impact on the data.
Table 6.3. Incidence of tuberculosis per 100,000 people in ASEAN and ASEAN Member States 2000-2015
Year
Country 2000 2005 2010 2015
Brunei Darussalam 96 44 57 48
Cambodia 600 500 442 390
Indonesia 282 252 228 183
Lao PDR 357 306 255* 204*
Malaysia 65 61 68 80
Myanmar 74 65 53 43*
Philippines 88 93 97 322
Singapore** 46 37 40 36
Thailand 52 55 49 49
Viet Nam 117 116 62 2
ASEAN 178 163 146 152
Note: * - Imputation ** - Singapore data refer to total population
Source: ASEAN Secretariat
Table 6.4. Incidence of tuberculosis per 100,000 people in ASEAN-6 and CLMV and the ratio of CLMV to ASEAN-6
Year
2000 2005 2010 2015
ASEAN-6 187 171 159 185
CLMV 153 142 112 59
Ratio of CLMV to ASEAN-6 0.82 0.83 0.70 0.32
Source: ASEAN Secretariat
Figure 6.3. Incidence of tuberculosis per 100,000 people in ASEAN, 2000-2015
20000
20
40
60
80
100
120
140
160
180
200
Percen
t
2005 2010 2015
164
178
146152
Source: ASEAN Secretariat
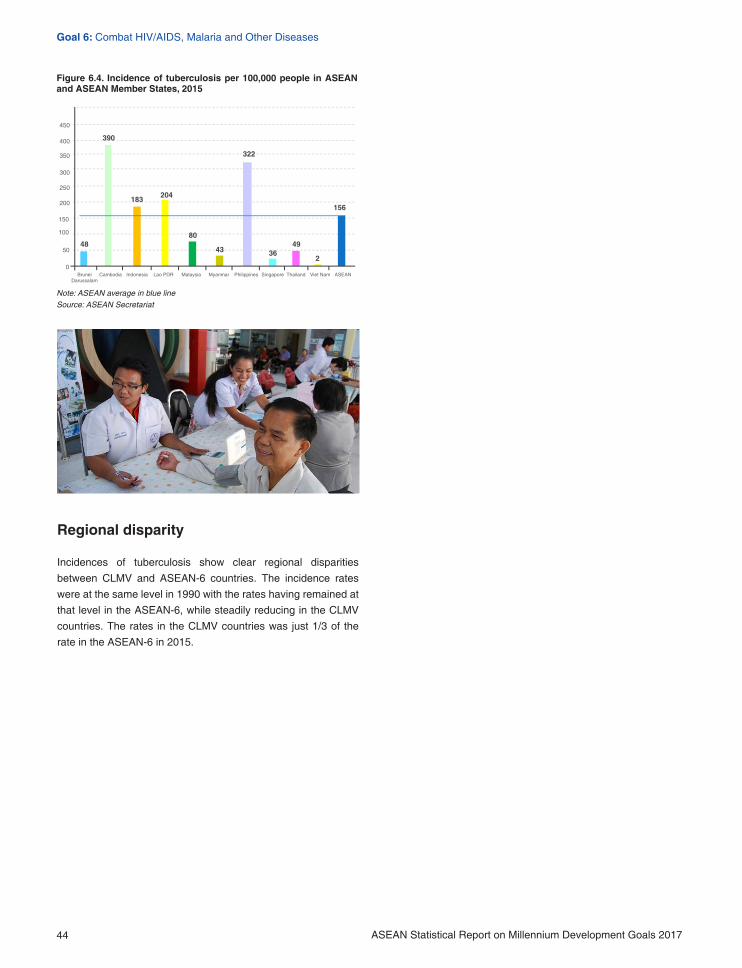
44
Goal 6: Combat HIV/AIDS, Malaria and Other Diseases
ASEAN Statistical Report on Millennium Development Goals 2017
Regional disparity
Incidences of tuberculosis show clear regional disparities between CLMV and ASEAN-6 countries. The incidence rates were at the same level in 1990 with the rates having remained at that level in the ASEAN-6, while steadily reducing in the CLMV countries. The rates in the CLMV countries was just 1/3 of the rate in the ASEAN-6 in 2015.
Figure 6.4. Incidence of tuberculosis per 100,000 people in ASEAN and ASEAN Member States, 2015
Note: ASEAN average in blue lineSource: ASEAN Secretariat

45
Goal 7: Ensure Environmental Sustainability
ASEAN Statistical Report on Millennium Development Goals 2017
Goal 7: Ensure Environmental Sustainability
Target 7.B: Reduce biodiversity
loss, achieving by 2010, a significant
reduction in the rate of loss
18. Proportion of land area covered by forest
The ASEAN region has large areas of rain forest and other forest types containing high levels of biodiversity. The aim of MDGs goal 7 addresses the goal of reducing the rate of which forests are converted for other (commercial) uses.
Trends
To demonstrate the trend in the region, the proportion of forested land area was calculated for the broader region as well as for the ASEAN-6 and CLMV countries. For all other MDGs-indicators, the regional averages are calculated for the more than 630 million people who were living in the ASEAN countries up to 2015. However, for this indicator of forest coverage, the averages are calculated for the more than 430 million hectares of land in the ASEAN countries as measured in 2015.
It may be misleading to conclude that this goal has been achieved by ASEAN. However, the fact that the rate of deforestation has been somewhat reduced and has remained stable since 2005, is nonetheless notable.
On average, the proportion of land area covered by forest in the region has remained at approximately 45% since 2005. In fact, Indonesia, Malaysia, Thailand, and Viet Nam have shown an increase in forest cover through reforestation efforts.

46
Goal 7: Ensure Environmental Sustainability
ASEAN Statistical Report on Millennium Development Goals 2017
Table 7.1. Proportion of land area covered by forest in ASEAN and ASEAN Member States, 1990-2015
Year
1990 1995 2000 2005 2010 2015
Brunei
Darussalam80 79 78 76 75 75
Cambodia 60 59 61 59 57 49
Indonesia 60 57 53 50 48 51
Lao PDR 47 47 42 42 42 42*
Malaysia 59 58 57 56 54 55
Myanmar 60 55 52 49 47 43
Philippines 21 19 27 24 23 23
Singapore 26** 25** 24 23 23 23
Thailand 28 26 33 32 33 32
Viet Nam 28 28 33 37 40 41
ASEAN 50 48 47 45 44 45
Note: * - Imputation ** - Imputation based upon forest cover area in 2011 and land area records for 1990 & 1995
Source: ASEAN Secretariat
Table 7.2. Proportion of land area covered by forest in ASEAN-6 and CLMV and the ratio of CLMV to ASEAN-6, 1990-2015
Year
1990 1995 2000 2005 2010 2015
ASEAN-6 50 48 47 45 44 45
CLMV 51 48 47 46 46 43
Ratio of CLMV to
ASEAN-61.00 1.00 1.00 1.03 1.05 0.96
Source: ASEAN Secretariat
Figure 7.1. Proportion of land area covered by forest in ASEAN, 1990-2015
47 4548
50
45 44
50
19951990 20000
5
10
15
20
25
30
35
40
45
50 48
55
2005 2010 2015
Percen
t
Source: ASEAN Secretariat
0
10
20
30
40
50
60
70
80 75
4951
42
55
43
23 23
3741
45
Figure 7.2. Proportion of land area covered by forest in ASEAN and ASEAN Member States, 2015
Note: ASEAN average in blue lineSource: ASEAN Secretariat
Regional disparity
It is hard to measure the disparity in the rate of reduction of forested areas between the ASEAN-6 and the CLMV. During the period 1990-2015 however, the difference in the proportion of land area covered by forest between the two groups is about 2 percentage point at the maximum.

47
Goal 7: Ensure Environmental Sustainability
ASEAN Statistical Report on Millennium Development Goals 2017
Table 7.3. Proportion of population using an improved drinking water source In ASEAN and ASEAN Member States, 1995-2015
CountryYear
Target1995 2000 2005 2010 2015
Brunei
Darussalam100 100 100 100 100 100
Cambodia 26 48 51 48 59 63
Indonesia 38 38 48 63 71 69
Lao PDR 40 52 67 70 76 70
Malaysia 85 89 93 93 95 92
Philippines 76 79 81 86 86 88
Singapore 100 100 100 100 100 100
Thailand 91 94 95 94 97 96
Viet Nam 74* 78 85 91 93 89
ASEAN 57 62 69 77 81 78
Note: * - ImputationSource: ASEAN Secretariat
Table 7.4. Proportion of population using an improved drinking water source In ASEAN-6 and CLMV and the ratio of CLMV to ASEAN-6
YearTarget
1995 2000 2005 2010 2015
ASEAN-6 58 60 66 75 80 79
CLMVa 66 73 79 84 87 83
Ratio of CLMV to
ASEAN-61.13 1.22 1.20 1.12 1.09
Note: a Excludes Myanmar
Source: ASEAN Secretariat
Figure 7.3. Proportion of population using an improved drinking water source In ASEAN, 1995-2015 & target
0
10
20
30
40
50
60
70
80
90
100
1995 2000 2005 2010 2015
6268
77
81
57
Percen
t
Target
78
Note: Excludes MyanmarSource: ASEAN Secretariat
Target 7.C: Halve, by 2015, the
proportion of people without sustainable
access to safe drinking water and basic
sanitation.
19. Proportion of population using an improved drinking water source
This target focuses on reducing the share of people without proper access to safe drinking water. In the ASEAN region, 44% of the population did not have access to an improved drinking water source in 1990. The target was to reduce this rate to 22% by 2015.
Trends
Overall, the people of the ASEAN region have improved access to cleaner water. The proportion of the region’s population having access to improved drinking water has reached 81% in 2015 (3 above the target). Since 1990, Brunei Darussalam and Singapore have enabled their respective populations to access improved drinking water. In Cambodia however, only 26% of its population has access to improved drinking water (the lowest in the region).
Over the 20 years from 1995-2015, all of the remaining eight ASEAN countries have managed to further close the gap between its people and clean water, as have Brunei Darussalam and Singapore. Malaysia, the Philippines, Thailand and Viet Nam have managed to enable a significant proportion of their populations to access improved drinking water—close to 90%. In Lao PDR and Indonesia, the rate has increased to around 70% and in Cambodia, the rate is around 60%.

48
Goal 7: Ensure Environmental Sustainability
ASEAN Statistical Report on Millennium Development Goals 2017
Regional disparity
The regional indicator for the CLMV countries in 1995 was only based upon Cambodia and Lao PDR and were very low at 30%. However, if the value for Viet Nam is included as in the table, the rate could be 66%, well above the ASEAN-6 level.
While both groups have shown a solid and steady improvement over the 20-year period, it is remarkable that the CLMV has managed to develop ahead of the ASEAN-6 throughout the period. Both the ASEAN-6 countries and the CLMV have reached the goal of reducing the rate without access to an improved drinking water source to less than half over the 20 years.
Table 7.5. Proportion of population with improved sanitation facility in ASEAN and ASEAN Member States, 1990-2015
CountryYear
Target1990 1995 2000 2005 2010 2015
Brunei
Darussalam65 69 70 80 80 87* 83
Cambodia 9 17 18 25 40 62 55
Indonesia 16 22 33 37 51 62 58
Lao PDR 11 29 37 45 57 71 56
Malaysia n.a. 94 96 98 98 100 97
Philippines 68 76 79 87 90 94 84
Singapore 100 100 100 100 100 100 100
Thailand 91 95 99 99 99 100 96
Viet Nam 10 18 44 61 76 84 55
ASEAN 37 44 55 61 70 78 69
Note: * - ImputationSource: ASEAN Secretariat
Figure 7.4. Proportion of population using an improved drinking water source In ASEAN and ASEAN Member States, 2015
Note: - ASEAN level excludes Myanmar- Country and ASEAN target in red
Source: ASEAN Secretariat
20. Proportion of population using an improved sanitation facility
Trends
In 1990, the share of the population with access to improved sanitation was only 37%. In fact, the figures in Cambodia, Indonesia, Lao PDR and Viet Nam were all below 20%. Meanwhile, Brunei Darussalam and the Philippines had better situations, in that almost 70% of their respective populations had access to improved sanitation. Malaysia, Singapore and Thailand were considered to be the best in that period with rates above 90%.
The situation has improved dramatically over the 25 years. In 2015, all AMS had met the target. Viet Nam had made the most progress by increasing the proportion of its population having access to improved sanitation by up to 84%. However, Cambodia, Lao PDR and Indonesia were still facing a greater challenge since their rates stood at about 70% or less.
There has been remarkable development in Cambodia, Indonesia, Lao PDR and Viet Nam, where the share of the population without access has been reduced from 84% or more, to 45% or less. The countries with almost complete coverage being Malaysia, Thailand and Singapore, which all have managed to retain their levels. Even countries in the mid-range have managed to improve coverage to around 90%.

49
Goal 7: Ensure Environmental Sustainability
ASEAN Statistical Report on Millennium Development Goals 2017
Table 7.6. Proportion of population with improved sanitation facility in ASEAN-6 and CLMV and the ratio of CLMV to ASEAN-6
YearTarget
1990 1995 2000 2005 2010 2015
ASEAN-6 41 50 58 62 71 77 71
CLMVa 10 18 40 55 70 80 55
Ratio of CLMV to
ASEAN-60.24 0.37 0.69 0.89 0.99 1.04
Notes: Excludes MyanmarSource: ASEAN Secretariat
Figure 7.5. Proportion of population with improved sanitation facility in ASEAN, 1990-2015 & target
0
10
20
30
40
50
60
70
80
90
100
Percen
t
1990 1995 2000 2005 2010 2015 Target
5561
7078
69
44
37
Note: Excludes MyanmarSource: ASEAN Secretariat
Regional disparity
Both the ASEAN-6 and the CLMV countries have fulfilled the target of reducing their share of populations without access to improved sanitation to less than half. The ASEAN-6 countries have managed to reduce the rate without access from 59% in 1990, to 23% in 2015.
The CLMV countries have managed to reduce their proportion of population not having access to improved sanitation from 90% in 1990, to only 20% in 2015.
Figure 7.6. Proportion of population with improved sanitation facility in ASEAN and ASEAN Member States, 2015
Note: - ASEAN level excludes Myanmar- Country and ASEAN target in red
Source: ASEAN Secretariat

50
Goal 8: Develop a Global Partnership for Development
ASEAN Statistical Report on Millennium Development Goals 2017
Goal 8: Develop a Global Partnership for Development
Target 8.F: In cooperation with the
private sector, make available the
benefits of new technologies, especially
information and communications
21. Fixed-telephone subscriptions per 100 population
For the MDGs targets regarding information and communication, there are no specific goals but an aim to make technology available in all countries.
When the MDGs were agreed upon, there was still a high demand for fixed line telephones with such services readily available by public companies at subsidized rates in many countries.
Trends
In the AMS, fixed telephone lines were only for relatively few subscribers. The exception was Singapore where the majority had a fixed line in 2000 and to a certain degree Malaysia and Brunei Darussalam. In these three countries, the ‘subscription peak’ was reached in 2000 and the decline occurred in 2015.
In Indonesia, Thailand and Viet Nam, the share of the population with fixed telephone lines continued to increase up to 2005 and 2010, but then it started to decline in those countries.
Table 8.1. Telephone lines per 100 population in ASEAN and ASEAN Member States, 2000-2015
CountryYear
2000 2005 2010 2015
Brunei Darussalam 25 23 21 18
Cambodia 1 8 3 2
Indonesia 1 10 10 5
Lao PDR 1 8 2 5*
Malaysia 20 17 16 15
Myanmar 1 1 3 48
Philippines 4 4 4 3
Singapore** 59 43 40 36
Thailand 9 11 10 8
Viet Nam 3 9 18 7
ASEAN 4 9 10 10
Note: * - Imputation ** - In 2000: per 100 residents, from 2005: per 100 total population
Source: ASEAN Secretariat

51
Goal 8: Develop a Global Partnership for Development
ASEAN Statistical Report on Millennium Development Goals 2017
22. Mobile-cellular subscriptions per 100 population
Cellular or mobile telephones are supposed to make a substantial contribution to economic development. However, statistics on cellular phone subscribers is only available from 2005.
Trends
The statistics on cellular phone subscribers in ASEAN shows the fast-growing adoption of the technology.
In 2005, there were only 18 cellular phone subscriptions per 100 population in the ASEAN countries. Just a decade later, the number had increased rapidly to become more than 100 subscriptions per 100 people. This clearly shows the rapid spread of the technology in ASEAN.
There are only two countries, namely Lao PDR and Myanmar, with less than 100 cellular subscribers per 100 population in 2015. Lao PDR had however, close to 90 subscriptions per 100 population. Only Myanmar still had less than 50 subscribers per 100 population. The statistics on cellular phone subscribers in ASEAN shows how new technology which addresses a user’s needs, may be easily and quickly adopted.
Table 8.2. Telephone lines per 100 population in ASEAN-6 and CLMV, and the ratio of CLMV to ASEAN-6
Year
2000 2005 2010 2015
ASEAN-6 5 10 9 6
CLMV 2 6 11 19
Ratio of CLMV to
ASEAN-60.43 0.65 1.18 3.17
Source: ASEAN Secretariat
Figure 8.1. Telephone lines per 100 population in ASEAN and ASEAN Member States, 2015
Note: ASEAN average in blue lineSource: ASEAN Secretariat
Regional disparity
Fixed telephone lines never became common in neither the ASEAN-6 nor the CLMV. There was however a clear regional disparity. The rate in the ASEAN-6 group remained at least as double that of the rate in the CLMV towards its peak in 2005. After that, the figure decreased, probably due to the use of mobile phones.
The high rate in Myanmar in 2015 may be due to a revised registration entity and policy.
Table 8.3. Cellular subscribers per 100 population in ASEAN and ASEAN Member States, 2005-2015
CountryYear
2005 2010 2015
Brunei Darussalam 62 107 111
Cambodia 7 75 138
Indonesia 11 89 146
Lao PDR 11 66 87
Malaysia 74 119 144
Myanmar 0 2 47
Philippines 40 89 118
Singapore** 100 144 148
Thailand 12 108 126
Viet Nam 11 130 150
ASEAN 18 91 131
Note: * - Imputation ** - Mobile population penetration rate per 100 residents
Source: ASEAN Secretariat

52
Goal 8: Develop a Global Partnership for Development
ASEAN Statistical Report on Millennium Development Goals 2017
Table 8.4. Cellular subscribers per 100 population in ASEAN-6 and CLMV and the ratio of CLMV to ASEAN-6
Year
2005 2010 2015
ASEAN-6 22 95 137
CLMV 7 82 114
Ratio of CLMV to ASEAN-6 0.32 0.86 0.83
Source: ASEAN Secretariat
Figure 8.2. Cellular subscribers per 100 population in ASEAN and ASEAN Member States, 2005-2015
18
91
0
20
40
60
80
100
120
140
160
180
200
Percen
t
2005 2010 2015
131
Source: ASEAN Secretariat
Figure 8.3. Cellular subscribers per 100 population in ASEAN and ASEAN Member States, 2015 & ASEAN
0
20
40
60
80
100
120
140
160
111
138146
87
144
47
118
148
126
150
131
Note: ASEAN average in blue lineSource: ASEAN Secretariat
Regional disparity
In 2005, the rate of cellular phone usage in the ASEAN-6 was 22 subscribers per 100 within the population. It increased rapidly to 95 in 2005 and then to 137 in 2015. The CLMV was far behind in 2005 with only 7 subscribers per 100 of the population. Then it increased rapidly in the next ten years to 114 subscribers, far exceeding the rate in the ASEAN-6, and reaching almost the same level as the AEAN-6 in 2015.
23. Internet users per 100 population
When the MDGs were agreed upon in 2000, the internet was seen as the great opportunity for less- developed countries to join the new technological era. Over the last decade, the smartphone may have proved to serve as a more important contribution to global technological development, but the internet is still a large facilitator of and for development for both small firms and private households. Similar ot the cas of cell phones, statistics on internet use is only available from 2005.
Trends
In order to be classified as an internet user, a person should have used the internet at least once a month, or be a subscriber to an internet service. In 2005, only 4% of the population in ASEAN countries could be categorised as internet users, but this increased to 26% in 2015.
The rates of internet subscribers in Malaysia and Singapore are above 70 per 100 population and in Brunei Darussalam above 80 per 100 population, well ahead of others. At the opposite end, Lao PDR and Viet Nam are the ASEAN countries with the lowest number of internet subscribers, with less than 10 subscribers/frequent users per 100 population.
The internet may be a demanding technology. One needs either access to a computer at home, at work, or other places, and then one needs the skills to operate the computer with internet access. It is difficult to say which of these barriers are the greatest, but the internet’s popularity and usage has obviously soared in some countries and less so in others.
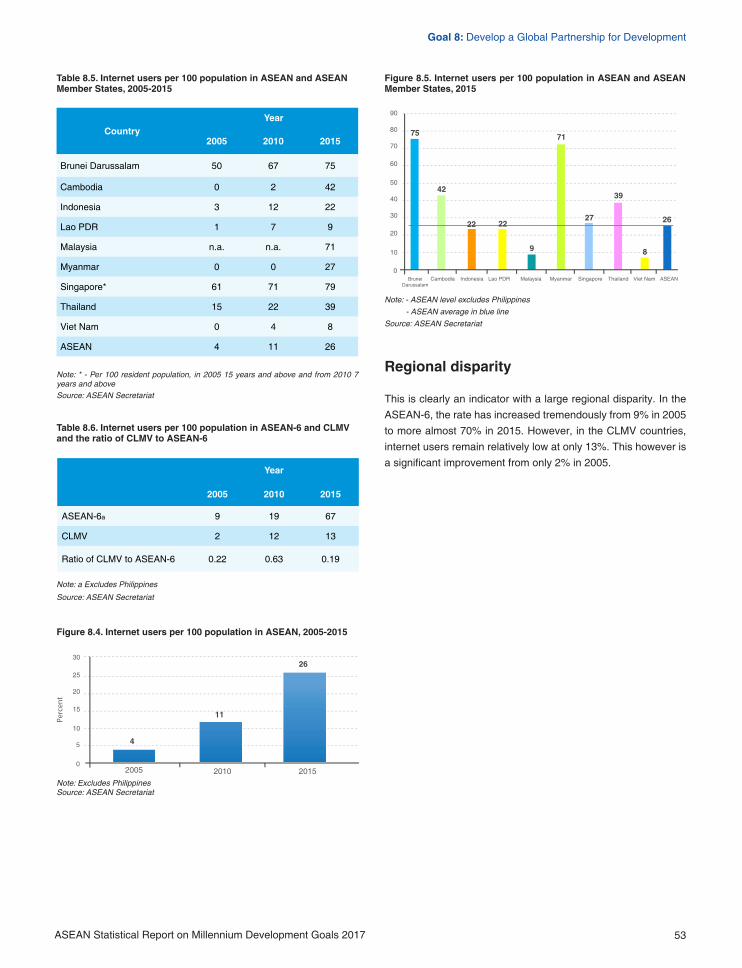
53
Goal 8: Develop a Global Partnership for Development
ASEAN Statistical Report on Millennium Development Goals 2017
Table 8.5. Internet users per 100 population in ASEAN and ASEAN Member States, 2005-2015
CountryYear
2005 2010 2015
Brunei Darussalam 50 67 75
Cambodia 0 2 42
Indonesia 3 12 22
Lao PDR 1 7 9
Malaysia n.a. n.a. 71
Myanmar 0 0 27
Singapore* 61 71 79
Thailand 15 22 39
Viet Nam 0 4 8
ASEAN 4 11 26
Note: * - Per 100 resident population, in 2005 15 years and above and from 2010 7 years and aboveSource: ASEAN Secretariat
Table 8.6. Internet users per 100 population in ASEAN-6 and CLMV and the ratio of CLMV to ASEAN-6
Year
2005 2010 2015
ASEAN-6a 9 19 67
CLMV 2 12 13
Ratio of CLMV to ASEAN-6 0.22 0.63 0.19
Note: a Excludes Philippines
Source: ASEAN Secretariat
4
11
0
5
10
15
20
25
30
Percen
t
2005 2010 2015
26
Figure 8.4. Internet users per 100 population in ASEAN, 2005-2015
Note: Excludes PhilippinesSource: ASEAN Secretariat
Regional disparity
This is clearly an indicator with a large regional disparity. In the ASEAN-6, the rate has increased tremendously from 9% in 2005 to more almost 70% in 2015. However, in the CLMV countries, internet users remain relatively low at only 13%. This however is a significant improvement from only 2% in 2005.
Figure 8.5. Internet users per 100 population in ASEAN and ASEAN Member States, 2015
Note: - ASEAN level excludes Philippines
- ASEAN average in blue line
Source: ASEAN Secretariat
54
Conclusion
ASEAN Statistical Report on Millennium Development Goals 2017
Conclusion
Significant achievements have been made on the MDGs targets in ASEAN countries during the period of 1990-2015. The AMS have met and, in some cases, exceeded, 13 of 23 MDGs targets, and are close to reach another three. However challenges still remain in the region for the remaining targets.
The region has successfully achieved the target of improving the poverty situation. The AMS have reduced the share of population living below poverty line (national and international) to less than half. The prevalence of underweight children has been reduced to half as well.
Achievements of the region in pursuing universal primary education are also remarkable. The AMS have made significant improvements on literacy rate and net enrolment in primary education. The progress made in those indicators in the CLMV is at par with the ASEAN-6.
The goals of promoting gender equality in education have been achieved at the primary, secondary, and tertiary level. Unfortunately, in the political sector the share of women in the seats of national parliament in the region is only 18% in 2015, which is less than half compared to the target.
The AMS have managed to reduce child mortality in the region. The ASEAN-6 and the CLMV have successfully met the target of a 2/3 reduction in infant mortality rate and under-five mortality rate. However, it is found that 14% of one-year-old are not immunized against measles in 2015.
The biggest challenge would be in improving maternal health. Maternal mortality rate is still far from the target, both in the ASEAN-6 and the CLMV. Despite good achievements in increasing proportion of births attended by skilled health personnel, great efforts are still needed to further improve the situation.
The AMS have also succeeded in reducing incidence and death rate associated with malaria, and the gap between the ASEAN-6 and the CLMV are reducing also. However, in the case of incidence of tuberculosis, the progress, though commendable, has been relatively much slower.
In ensuring environmental sustainability, the ASEAN countries also have made notable achievements. Though the land area covered by forest continues to decline, but its pace is slowing down. Meanwhile, the proportion of population using improved drinking water source and improved sanitation facility has been increased, both in the ASEAN-6 and the CLMV.
In conclusion, during the period of 1990-2015, although some challenges still exist and great efforts are still required, the AMS have made great progress in meeting the MDGs targets, as well as in narrowing the development gaps among the AMS. Nevertheless, concrete efforts are required in order to accelerate progress where growth has been slow or insufficient.

55
Annex 1 Roads Towards the MDGs at Country Level
ASEAN Statistical Report on Millennium Development Goals 2017
Annex 1
Roads Towards the MDGs at Country Level

56
Annex 1 Roads Towards the MDGs at Country Level
ASEAN Statistical Report on Millennium Development Goals 2017
ASEAN’s achievement in attaining the MDGs goals are mainly due to the various initiatives and measures undertaken by the AMS at the national level. This annex provides an overview of these initiatives and measures.
Brunei Darussalam
Goal 1: Eradicate extreme poverty and hunger
There was no absolute poverty in Brunei Darussalam in 2000. Its social safety net programmes which provide free medicine and health facilities; education from primary to tertiary levels; pensions and allowances for its older citizens; and with special attention to its disabled and to its young ensures its population remain poverty-free.
Income inequality in Brunei Darussalam has remained consistently stable. The Gini Coefficient* in 2010/11 was 0.372 although this was a slight increase from 2005. This is an indication of Brunei Darussalam’s determination to provide a high quality of life to all its citizens with the share of the lowest 40% of households witnessing an increase while the top 20% experienced a fall in their share of consumption. The result was an increase in the proportion of consumption of the middle 40%, which form the core of Brunei Darussalam’s growing middle class.
Goal 2: Achieve universal primary education
Brunei Darussalam has also fully met targets related to Goal 2. The National Education Policy provides free education for one year of pre-school, six years of primary school, four to five years of secondary school and four to five years of upper-secondary/vocational training school. The Compulsory Education Order 2007 makes it mandatory for all children to attend at least nine years of formal schooling. These legal provisions are buttressed by a series of incentives covering food, transport and housing facilities for lower income groups.
Goal 3: Promote gender equality and empower women
The officially-designated indicators for this goal are the ratio of boys to girls at all levels of schooling including tertiary education; and the ratio of literacy among men and women over 15 years old, which Brunei Darussalam has met. In addition, Brunei Darussalam also shows an increasing proportion of women
in senior positions in the civil service that reflects female empowerment.
Not only is there no discernible difference between the ratio of boys to girls in primary and secondary schooling, the ratio of girls to boys in tertiary education is 1.74 to 1.0. This fact might itself partially explain the dominance of women in the civil service. Brunei Darussalam meets all the three indicators for the reduction of gender disparity and women’s empowerment.
Goal 4: Reduce child mortality
Health care in Brunei Darussalam has always been considered a priority and the government has managed to create a healthcare system that emphasises excellence in creating and promoting a healthy lifestyle.
Brunei Darussalam’s under-five mortality rate was dramatically reduced between 1976 and 2014 from around 30 per 1,000 livebirths to around ten, a 2/3 fall as targeted by the MDGs. The reduction is less pronounced if the reference period is moved to 1990. This is taking into consideration that Brunei Darussalam adopts a strict pro-life policy whereby abortion is only legal when it will save a woman’s life. Brunei Darussalam has greatly reduced both under-five and infant mortality during the post-independence period by over 2/3, as the MDGs recommend.
Goal 5: Improve maternal health
Brunei Darussalam does well in maternal health. In fact, Brunei Darussalam ranks highly in the lowest incidence of maternal mortality. The most important reason for Brunei Darussalam’s success in lowering maternal mortality to record levels since independence is that almost 100% of deliveries take place in hospitals with highly trained medical staff. Moreover, the Maternal and Child Health (MCH) programme that provides universal coverage of prenatal care, has ensured universal healthcare access to its people.
Goal 6: Combat HIV/AIDS, malaria and other diseases
Brunei Darussalam has been successful in reversing the trend for HIV/AIDS and malaria and other diseases. The achievements of Brunei Darussalam are internationally recognised by the World Health Organization (WHO) that certified Brunei Darussalam a Malaria-free country in 1987 and poliomyelitis-free in 2000. It also provides universal free treatment for HIV/AIDS and has the second lowest incidence of Tuberculosis in Southeast Asia.
* a statistical measure of the degree of variation or inequality represented in a set of values, used especially in analysing income inequality.

57
Annex 1 Roads Towards the MDGs at Country Level
ASEAN Statistical Report on Millennium Development Goals 2017
Cambodia
The Royal Government of Cambodia (RGC) is deeply committed to achieving the Millennium Development Goals. For doing this, it has been pursuing inclusive economic growth through planned development in a market framework. Such an approach is reiterated in the Rectangular Strategy Phase III, covering the period 2013-2018. RGC is also striving to fully integrate the country into the ASEAN and benefit from it. Finally, pulling the country out of its Least Developed Country Status is among the high priorities that the government is pursuing.
There are nine Cambodia-Millennium Development Goals (CMDG). Under each of these, there are a number of targets and indicators. The following presents the progress in achieving CMDG targets.
CMDG1: Eradicate extreme poverty and hunger
Targets in reducing poverty rates have been achieved. The country has also succeeded in continuously reducing inequality in consumption expenditure. While it is true that more children compared to the set target are yet underweight and malnourished, indicators like height and weight of children are incremental and do not change in the short term. There is positive progress in this regard, which is noteworthy. Finally, the target of more people consuming iodized salt has been achieved.
Notwithstanding the achievements in nutrition, the government recognizes that the task is as yet, incomplete. Also, the incidence of anemia among both women and children still remains higher compared to the targets set. Finally, child labor is also prevalent in proportions higher than the stated target.
The RGC attaches high priority to reducing poverty and bringing about greater equity and aims at reducing the poverty rate by at least one percentage point each year. The Rectangular Strategy emphasizes on achieving inclusive growth and job creation, which are key drivers of poverty reduction. Additionally, the strategy has placed emphasis on improving nutrition within its thrust area: ‘Capacity Building and Human Resource Development’.
CMDG2: Achieve universal primary education
Cambodia is on the threshold of achieving the MDGs target on universal literacy in the age group 15-24 years old. Both enrolment and completion rates at the primary school level are
Goal 7: Ensure environmental sustainability
Despite its high dependence on non-renewable energy sources such as oil and gas, Brunei Darussalam continues to preserve its forest cover and maintain a generally pristine environment by pursuing legal and administrative measures.
Brunei Darussalam managed, at the beginning of the MDGs period, to achieve the stated target with 100% of its people using improved drinking water supplies (treated in compliance with WHO standards). This proportion has been maintained for the past 15 years.
Goal 8: Develop a global partnership for development
Brunei Darussalam is committed to an open trading and investment system and also its contributions to scholarships and technical assistance wherever possible to other developing countries.
It has actively engaged in Free Trade Agreements through its membership in ASEAN as well as on a bilateral or multilateral basis such as the Brunei-Japan Economic Partnership Agreement or the Trans-Pacific Strategic Economic Partnership (P4) Agreement. Its openness to the outside world and its interest in promoting foreign direct investment (FDI) and human capital in the country is also evidenced by a sharp rise in the number of cellular phone subscribers in the population as well as the rise of internet users.

58
Annex 1 Roads Towards the MDGs at Country Level
ASEAN Statistical Report on Millennium Development Goals 2017
slowly moving towards their targets. In addition, gender parity targets in enrolments too have been attained and maintained at both primary school and lower-secondary school levels.
Despite an impressive reduction in the poverty rate, the standards of living are yet to rise to levels where households can effectively afford to send their children to school.
The country’s education sectoral development plan sets out a ten-point programme towards improving education and human capital formation. It includes strengthening education towards raising the stock of human capital for greater competitiveness, improving the knowledge base and training in science and technology, arranging for easier access to education (at all levels), institutional capacity building within the education and skill-impartation sectors, improving the quality and effectiveness of education, and finally, strengthening technical and vocational education.
CMDG3: Promote gender equality and empower women
Cambodia is on its way to achieving gender equity in education at the primary, secondary and tertiary levels. There is gender parity in wage employment and the number of women acting as public representatives, is on the rise. Additionally, increasing numbers of women are becoming aware that violence against them is a crime. In this regard, the target has been met.
The overall rate of participation of girls and boys in education at this level remains low when viewed within the larger developmental context and beyond the MDGs. Interprovincial gaps also exist. Sparse availability of educational facilities beyond the primary school level is an important reason for low participation. Looking beyond MDGs, the proportion of women engaged as ‘unpaid family workers’ is large, which constrains their growth in the labor market.
The RGC is fully committed to attaining gender parity in the development process in the country. The Government Rectangular Strategy - as mentioned earlier - attaches high priority to inclusive growth. At the same time, the government has developed the Neary Rattanak Strategic Plan, aimed at women’s empowerment through skill enhancement, opportunities in self- and wage-employment, and increasing their share in civil service and public offices. It has also developed an MDGs Acceleration Framework to promote the gender cause. The RGC has implemented the ‘Law Against Domestic Violence and Victim Protection’, the ‘Law Against Human Trafficking and Sexual Exploitation’, and the ‘First National Action Plan on Preventing Violence Against Women’.
CMDG4: Reduce child mortality
Cambodia has achieved all its CMDG targets in regard to child health: the infant mortality rate, U5MR, child vaccination and exclusive breast-feeding.
However, there are inter-provincial differences in child health indicators, which is a reflection of unequal standard of living and unequal spread of public services.
The Rectangular Strategy of the RGC puts forth a ten-point programme on health, which has an explicit mention of infant and child health. It states that infant/children health, including their nutrition status, will be improved through enhancing the quality and effectiveness of reproductive, maternal, infant and children healthcare services. This will be done by focusing on: expanded coverage of child delivery by professional mid-wives and physicians, maternal emergency and new-born baby care services and consultation services on birth spacing options; increasing the coverage of children’s vaccination, especially vaccinations against measles and tetanus; and providing mineral supplements and proteins to infants during the initial 1,000 days after birth and special care services for those with severe malnutrition.
CMDG5: Improve maternal health
Cambodia has achieved the MDGs targets on maternal mortality ratio and total fertility rate much in advance. It has also made significant progress on CMDG targets related to skilled birth attendants assisting in delivery, and pregnant women making antenatal care (ANC) visits to health centers. The country is well on its way to achieving these targets by 2015. Targets in contraceptive use in most likelihood will not be met, since its use would require a behavioral change. This is a slow, incremental process.
As stated earlier, the Rectangular Strategy has put forth a ten-point programme on health, which has an explicit mention of maternal health and care. To reiterate, effort will be made to improve reproductive, maternal and infant/children health including their nutrition status through enhancing the quality and effectiveness of reproductive, maternal, infant and children healthcare services. This will be accomplished by focusing on expanded coverage of child delivery by professional mid-wives and physicians, and maternal emergency and new-born baby care services, and consultation services on birth-spacing options.

59
Annex 1 Roads Towards the MDGs at Country Level
ASEAN Statistical Report on Millennium Development Goals 2017
CMDG6: Combat HIV/AIDS, malaria and other diseases
Cambodia has achieved the target on malaria and is well on its way to achieve targets on tuberculosis and HIV/AIDS.
There are no remaining challenges per se. It should be noted however, that an efficient surveillance system and adequate resources on a continued basis, are real needs.
The RGC also has an explicit emphasis of further reducing morbidity and mortality rates caused by major communicable diseases such as HIV/AIDS, TB, malaria, dengue, and other poorly-treated tropical diseases including newly emerged transmitted diseases and other re-emerged diseases, particularly exerting more efforts to completely eliminate malaria by 2025.
CMDG7: Ensure environmental sustainability
Cambodia has achieved, or is well on its way to achieving, CMDG targets on reversing environmental losses (including forests and fisheries) and on potable water and sanitation.
Notwithstanding the success, a strong monitoring and evaluation system for forestry and economic land concessions, the early demarcation of the forest areas, improving the quality of human resources deployed for conservation, improving technologies of conservation, and protecting the rights of the forest-dependent people, are all critical to sustaining the achievements.
As stated in the rectangular strategy, its aims are to strengthen laws, develop institutional frameworks and build institutional and human capacities. Key elements include: (i) Forest: RGC will promote the national forest programme 2010-2029; (ii) Fisheries: strategic planning framework for fisheries sector 2010-2019; (iii) Land: pursue a 9-point programme, which includes preparing the law on land management and urbanization and law on agricultural land; and accelerating land registration and issuance of land titles including for state lands, private lands, and indigenous community lands; (iv) Water and sanitation: expand the coverage of clean water supply to the rural and urban areas through implementing the national strategy for rural water supply and sanitation 2011-2025, including formulation of an action plan, and encouraging participation from the private sector.
CMDG8: Forging a global partnership for development
Cambodia has regularly received international assistance in the last five to six years from diverse sources suggesting that its
partnership strategy is effective. It has also set up institutions and processes to follow up on the Paris Declaration and the Accra Declaration on aid effectiveness, which have shown maturity over time. Finally, the success of mobile telephony and internet access has transformed the connectivity scene.
Cambodia, however, will face challenges that will accompany its greater integration into the ASEAN community. Some of these could affect industry and employment and some the budget revenues. Additionally, Cambodia currently has moved out of its ‘least developed country’ to ‘lower middle-income country’ status. An implication of this would be a reduction in grants, which would be replaced by loans.
The RGC will continue to focus on attracting investments both from domestic or foreign sources in order to further diversify its production base; on promoting transport connectivity and logistics systems; on improving the regulatory framework and strengthening institutional mechanisms; and on enhancing capacities to ensure a favorable environment for development. It will need to commit itself to effectively fulfilling its role in regional and international affairs; introduce the ‘Industrial Development Policy’ to move the country to a higher value chain in the regional and global economy; and further improve the regulatory framework aimed at improving the business, trade and investment environment.
CMDG9: De-mining, removing explosive remnants of war, and victim assistance
Cambodia included a ninth goal to the list of MDGs, De-mining, removing explosive remnants of war, and victim assistance. A baseline survey was completed in a majority of Cambodia’s provinces where known landmine contamination was previously reported, by end-2012. It came to be known that about 191,482 ha of landmine and explosive remnants of war (ERW)-contaminated lands remain to be cleared.
Large areas contaminated by ERW are yet to be surveyed systematically. People living in the vicinity of mine-cleared areas live in fear of the mines exploding. Occasional incidents of people injured/maimed/killed, have fueled this fear.
The RGC has a standing policy, mentioned in the Rectangular Strategy, on stepping-up the implementation of the ‘National Mine Action Strategy 2010-2019’, especially the clearance of the remaining mines and ERW to expand arable land, secure safety of infrastructure development, and further reduce mines and ERW explosion accidents.

60
Annex 1 Roads Towards the MDGs at Country Level
ASEAN Statistical Report on Millennium Development Goals 2017
Indonesia
The commitment of the Indonesian government towards the achievement of the Millennium Development Goals (MDGs) was reflected in the integration of the MDGs into National Long Term Development Plan (RPJPN 2005-2025), National Medium Term Development Plan (RPJMN 2005-2009 and RPJMN 2010-2014), the National Annual Development Plan (RKP), and the State Budget (APBN) Documents. The government of Indonesia, coordinated by the Ministry of National Development Planning (BAPPENAS) and the special envoy for the achievement of the MDGs, had taken a whole of government approach to coordinate resources and delegate authority to achieve the MDGs targets by 2015. The MDGs guided the 2010-2014 National Development plan and the actions of the responsible ministries such as health, education and the environment.
Roadmap of acceleration
The year 2010 was a very important moment, as Presidential Instruction No.3/2010 about Equitable Development Programs stipulated priority objectives of equitable development in favor of the MDGs achievement. This instruction served as a strong basis for planning, implementation, monitoring, evaluation and reporting of MDGs implementation both at national and sub-national levels. This instruction gave the direction towards accelerating the MDGs achievement during the five years of 2010-2014 National Medium Term Development Plan.
The Ministry of National Development Planning / Bappenas played a coordinating role in the preparation of the Roadmap of MDGs achievement and together with BAPPEDA (Regional Development Planning Agency) to facilitate the acceleration of MDGs achievement. Steps to accelerate the achievement of the MDGs as mandated by Presidential Instruction No. 3 of 2010 concerning Equitable Development Programming include the following:
• The distribution of the Roadmap to Accelerate Achievement document of the MDGs to stakeholders as a reference in their work to speed up attaining the MDGs throughout Indonesia.
• The preparation of “Regional Action Plans to Accelerate the Achievement of the MDGs” document by the province governments as a reference in improving planning and coordination of efforts to reduce poverty and improve people’s welfare.
• Supporting the intensification and expansion of programmes to achieve the MDGs through increasing allocation of funds by the central, provincial and district governments, as well as preparing a funding mechanism to provide incentives to local governments that perform well in achieving the MDGs.
• The increasing support for the expansion of social services in disadvantaged areas and remote areas.
• Developing partnerships between the Government and private enterprises (Public – Private Partnerships or PPP) in the social sectors, especially education and health, to expand sources of funding to support achievement of the MDGs.
• Strengthening mechanisms to expand Corporate Social Responsibility (CSR) initiatives to support the achievement of the MDGs.
• Pursuing the enhanced cooperation with creditor countries for the conversion of debt (debt swap) for achieving the MDGs.
At the implementation process of Regional Action Plan (RAP) and to operationalize the RAP, the MDGs Acceleration Framework (MAF) was established in several provinces to address certain MDGs targets. The MAF process was led by the provincial planning authority (BAPPEDA) working closely with the National Planning Agency (BAPPENAS) with a support from international agencies, domestic NGOs, professional associations and academia. In the MAF process, the following several aspects had been taken:
• Reviewing existing policies and interventions of relevance to MDGs targets
• Identifying gaps in existing policies and interventions
• Identifying bottlenecks in policy and planning, budget and financing, service delivery, service utilization, and cross-cutting areas to the successful implementation of key interventions.
• Identifying cost-effective and cross-sectoral solutions that could accelerate progress on MDGs targets
• Helping to understand the reasons behind geoFigureical differentials in the progress of MDGs achievement and addressing them through tailored efforts.

61
Annex 1 Roads Towards the MDGs at Country Level
ASEAN Statistical Report on Millennium Development Goals 2017
Government efforts for each MDGs goal
Along with the acceleration process to meet MDGs targets, a number of government efforts can be summarized for each MDGs goal as follows:
• MDGs Goal 1. One strategic effort in this goal was that the development of Integrated Data Base (BDT) of Poor Households to defining and sharpening the programme targets. BDT includes a unique number of household identification, name of the household head, name of household-spouse head, family card number, and social economics characteristics.
• MDGs Goal 2. Alleviation of illiteracy for the adults was conducted, among others, through the Basic Literacy Education, targeting the population aged 15 and older who have low literacy skills or are illiterate. These efforts are intended to allow students to have basic skills of reading, writing, arithmetic, and communicating in Indonesian, as well as basic knowledge that can be utilized in the life of family and society. To improve access, quality and equity of primary education, various efforts were constantly made in order to ensure the fulfilment of people’s right to receive quality education services.
• MDGs Goal 3. Efforts to promote gender equality and women empowerment has been committed by the government for a long time. Indonesia has ratified the results of the Convention on the Elimination of All Forms of Discrimination against Women and the Universal Declaration of Human Rights. The important aspect in achieving this goal was that the government always put gender mainstreaming in National Development Planning and Budgeting.
• MDGs Goal 4. Various strategic efforts to achieve MDGs4 targets were implemented with increased coverage and outreach of programme intervention. In addition, the Government also made improvement on health infrastructure through improving the number, health centres network and quality, health personnel quality and quantity and strategic programme interventions. To guarantee the entire population access to health care, in 2011, the Government launched Birth Delivery Guarantee programme (Jampersal) to finance antenatal care, birth delivery care, postpartum care, postpartum family planning services.
• MDGs Goal 5. Policies to improve maternal health in Indonesia are in line with international policies regarding priorities of women’s health and maternal rescue efforts,
including the integrated efforts to save the mother into reproductive health efforts. The three key messages in the effort to accelerate the reduction in maternal mortality and newborn baby include (i) every childbirth is assisted by skilled health personnel; (ii) every obstetric and neonatal complications receives adequate assistance; and (iii) every woman of childbearing age has access to prevention of unwanted pregnancies and to handling of post-abortion complications.
• MDGs Goal 6. The government, through across sectors and various community groups develops policy, design and implements programmes and activities to control HIV and AIDS and other non-communicable diseases. These efforts are also supported by several international development partners through cooperation in the form of technical assistance and funding in the response to HIV and AIDS prevention efforts. In order to achieve the elimination of malaria, one of the main implemented strategies is through increased promotion and preventive efforts, including the prevention of new cases of malaria. To reduce TB morbidity, the government took a number of initiatives.
• MDGs 7. The government continues to improve forest governance through a variety of policies to reduce deforestation and forest degradation. With the support of the UNDP, the government, from 2009 to late March 2015 through the Ministry of Forestry, has implemented a programme to strengthen community-based forest management and watershed to reduce the degradation of forest areas and improve ecosystem functions and services. A total of 56 community organizations in various parts of Indonesia had received reinforcement, such as the preparation of management plans, training and tree planting. With respect to increasing access to drinking water and proper sanitation, the construction of drinking water and sanitation have been undertaken in an integrated manner, through national policies on Community-Based Water Supply and Sanitation (AMPL).
• MDGs Goal 8. The government, through Bank Indonesia in 2014, launched Digital Financial Services (LKD) in order to improve people’s access to banking services. Programmes using electronic technology devices allows people to conduct financial transactions, including payments and transfers. To maintain fiscal sustainability, the government seeks to control the growth of debt and manage the debt by prioritizing the principle of prudence, accountability, efficiency, and effectiveness. Furthermore, to improve cooperation of international development, Indonesia tried to play an active role in international

62
Annex 1 Roads Towards the MDGs at Country Level
ASEAN Statistical Report on Millennium Development Goals 2017
Malaysia
Malaysia has achieved most of the goals and targets, and that benefits of development have been felt at the national, regional, state and in many cases, community and individual levels:
Goal 1: Eradicate extreme poverty and hunger
As the MDGs era closes for Malaysia in 2015, the government can take pride in having done extremely well on the “super goal”, especially the poverty targets under MDGs1. As was seen, poverty eradication was attained largely through employment generation has contributed to this outcome.
Goal 2: Achieve universal primary education
Malaysia surpassed the MDGs 2 goal of providing universal primary education for boys and girls even before 2000. During the MDGs period, free education became available until the upper secondary level.
Goal 3: Promote gender equality and empower women
Malaysia has done well to advance the development of women in a scope that runs beyond the three indicators under MDGs3. Strictly speaking, Malaysia has achieved two out of the three MDGs indicators with the exception being female political representation.
Goal 4: Reduce child mortality
Malaysia has done well to reduce child mortality and has made good progress to achieve MDGs 4. Even with relatively low mortality rates in 1990, Malaysia has managed to further reduce under-five, infant and neonatal mortality rates by more than half the 1990 levels.
Goal 5: Improve maternal health
Malaysia has made much progress to improve maternal health. The maternal mortality rate (MMR) declined dramatically, while the proportions of safe deliveries and antenatal coverage increased substantially.
development cooperation. Finally, in the area of ICT, ICT development was carried out in all regions to reduce high inequality in ICT distribution.
MDGs achievement, challenges and lessons learned
The MDGs acceleration programme in Indonesia resulted in significant progress in most MDGs targets. A substantial improvement was recorded in the access to primary and secondary education, gender equality and women empowerment, reducing child mortality, combating malaria and other communicable diseases, and environmental conservation. Several MDGs targets that were not achieved include the proportion of population living below the national poverty line and the proportion of population who suffer from hunger, and the maternal mortality rate. Despite the unmet target regarding the maternal mortality rate, other indicators in the maternal health target showed significant progress, namely the proportion of births attended by skilled health personnel and the access to reproductive health.
Despite significant progress in most MDGs targets, Indonesia is still facing challenges that could be used as lessons learned in the implementation of SDGs. There were at least three main challenges in the MDGs implementation. First, there was a high variation among regions in the achievement of MDGs targets. Although the MDGs targets were achieved at the national level, a huge variation in the achievement between regions means that the progress was not enjoyed by all regions. Second, a lack of data availability to support MDGs implementation especially at district level hampered the achievement of some MDGs targets and created the inequality in the achievement level between regions. Finally, the implementation of MDGs was hampered by limited resources from the government. This would be a good lesson for SDGs implementation. With a limited government capacity, involvement of other stakeholders especially business and private sectors are encouraged to support the implementation process.

63
Annex 1 Roads Towards the MDGs at Country Level
ASEAN Statistical Report on Millennium Development Goals 2017
Goal 6: Combat HIV/AIDS, malaria and other disease
Malaysia has done well to halt and reverse the spread of HIV/AIDS and reduced the number of malaria cases in the nation. Despite the increase in the number of cases TB, Malaysia has done well to increase case detection of TB, maintain relatively high treatment adherence and cure rates as well as low mortality rates, especially in recent years.
Goal 7: Ensure environmental sustainability
Malaysia has made significant efforts to achieve the goals of MDGs7. On integrating the principles of sustainability into policies and even established governing institution to perform needed functions. The country has also successfully phased out certain ozone-depleting substances and made numerous efforts to stem and the loss of biodiversity. On providing clean water and improved sanitation, Malaysia has also proven successful in reaching even rural communities, which has also been reflected in good health outcomes.
Goal 8: Development a global partnership for development
Malaysia has demonstrated that strong collaborations in the public and private sectors can foster better development outcome such as that achieved by the Malaysian Technical Cooperation Programme (MTCP) in the public sector as well as the Malaysian South-South Corporation Berhad (MASSCORP) model in the private sector.
Myanmar
Myanmar has begun accelerating progress towards achieving MDGs in 2015, however, gaps still remain and some indicators are required to achieve the target.
Goal 1: Eradicate extreme poverty and hunger
Myanmar reduced poverty levels between 2010 to 2015. According to survey to survey computation and Myanmar Living Condition Survey (MLCS) have shown a decreasing trend in poverty levels. Both methods indicate a 39% decrease in poverty incidence. The result has not officially published yet. In addition, employment-to-population ratio increased from 57.1 to 59.9. The prevalence of underweight children under-five years of age has been slow, only a 1% decrease between 2010 and 2015.
The government has oriented its people-centered development approach and focused on inclusive development. The disparity has been reduced; however, the inaccessible areas have remained due to conflict.
Goal 2: Achieve universal primary education
Myanmar has been making gains in basic education over the years. However, progress towards achieving universal primary education has been slow. Net enrolment ratio in primary education is over 99% in 2015.The literacy rate of the population aged 15 to 24-year-old is over 94%.
In addition, the Comprehensive Education Sector review has provided an opportunity an opportunity to develop a comprehensive and inclusive education policy that is a holistic righted based, equality focused and responsive to disparities in education access, quality, management and institutional arrangements.
Goal 3: Promote gender equality and empower women
The MDGs target of eliminating gender disparity in primary, secondary and territory education has been met. The labor force participation in women is 51.6% while male participation is 80.2%. The differences are still quite high, however the proportion of seats held by women in national parliament is 4.75 in 2015.

64
Annex 1 Roads Towards the MDGs at Country Level
ASEAN Statistical Report on Millennium Development Goals 2017
Goal 4: Reduce child mortality
The under-five mortality rate is still high in Myanmar. The Central Statistical Organization (CSO) has estimated under-five mortality rate (U5MR) at 52 per 1000 live births, and the infant mortality rate (IMR) at 39 per 1000 live births. The target has therefore not been met and there is need for concerted efforts to achieve the target. Interventions to address U5MR have been reinforced in states and in regions.
Goal 5: Improve maternal health
Although the maternal mortality ratio per 100,000 live births decreased 420 in 1990 to 180 in 2015, Myanmar still deals with high rates of maternal mortality. The proportion of births attended by skilled health personnel has increased however, to 80%.
Goal 6: Combat HIV/AIDS, malaria and other diseases
In Myanmar, incidences of malaria per 100,000 population has decreased remarkably during 1990 to 2015. However, incidences of tuberculosis per 100,000 population has slightly increased. Multi-drug resistant tuberculosis remains an important issue and highly drug resistant TB has been detected.
Goal 7: Ensure environmental sustainability
The proportion of land area covered by forest is decreasing. The government has not allowed the export of teak and wood and teak production remain within the annual allowance to be cut. There has been a gradual increase in overall access to improved drinking water sources and the proportion of the population using an improved sanitation facility has also increased.
Goal 8: Develop a global partnership for development
Due to the easing of sanction and restriction, overseas development assistance (ODA) flows to Myanmar have gradually increased. Foreign operators have been allowed into the telecom sector. Tele-density has been notably increased, with telephone lines per 100 people having reached 100%. Cellular subscribers per 100 of the population has reached over 8%. Internet users have also increased but the frequency and quality has still needed to improve.
Singapore
Singapore supports the MDGs and has met almost all the targets for the relevant MDGs indicators. In general, Singapore has done well in achieving practically all of the MDGs goals:
• Goal 1: Eradicate extreme poverty and hunger
• Goal 2: Achieve universal primary education
• Goal 3: Promote gender equality and empower women
• Goal 4: Reduce child mortality
• Goal 5: Improve maternal health
• Goal 6: Combat HIV/AIDS, malaria and other diseases
• Goal 7: Ensure environmental sustainability
• Goal 8: Develop a global partnership for development
In particular, we wish to highlight some of Singapore’s achievements for MDGs 2, 4, 5 and 8.
Goal 2: Achieve universal primary education
Singapore’s education system aims to bring out the best in every child by enabling students to discover their talents, realise their full potential, and develop a passion for life-long learning. Education in Singapore seeks to nurture the whole child, and help them develop an enduring core of competencies, values and character, to ensure that they have the capabilities and dispositions to thrive in the 21st century.
The Ministry of Education (MOE) recognises that the early years are crucial for children’s holistic development. In recent years, the MOE has introduced various initiatives targeted at improving the quality of pre-school education by developing curriculum resources to support early childhood educators in creating and delivering quality learning experiences, providing quality and affordable pre-school education through the MOE kindergartens, and sharing curriculum resources and other good practices across the pre-school sector.
With the introduction of compulsory education in 2003, all Singaporean children receive six years of primary education that builds a strong foundation in education and helps them develop holistically. The cost of education at the primary and secondary level is heavily subsidised to ensure that education is affordable for everyone, with additional financial assistance provided to support needy children. Recognising that every child differs in

65
Annex 1 Roads Towards the MDGs at Country Level
ASEAN Statistical Report on Millennium Development Goals 2017
their strengths, interests and pace of development, there are multiple pathways and curricular options to support students in completing ten years of general education, and progressing further to post-secondary education. For instance, Specialised Schools were established to provide customised programmes focusing on hands-on and practical learning for learners at risk of prematurely leaving the education system. This initiative received an honourable commendation from the 2016 UNESCO Wenhui Award for Educational Innovations.
These initiatives have contributed significantly to Singapore’s achievement of universal primary education and 100% literacy rate in its youth population (aged 15-24 years). Today, almost all students complete ten years of general education, with only less than 1% of students in each cohort who did not complete secondary education. Further, more than 95% of each cohort progress on to post-secondary education, an improvement from 91% ten years ago.
Goal 4: Reduce child mortality and Goal 5: Improve maternal health
Over the years, Singapore has made significant progress in maternal and child health. Singapore has one of the lowest under-five mortality rate in the WHO Western Pacific Region (WPRO) at 2.6 per 1,000 live births in 2015, a significant reduction from 7.5 per 1,000 live births in 1990. Similarly, the infant mortality rate has decreased from 2.2 per thousand resident live births in 2009 to 1.7 in 2015. Singapore also has one of the lowest maternal mortality ratios (MMR) in WPRO, ranging from 2 to 7 per 100,000 live births and still births in the last 3 years. Based on the WHO’s World Health Statistics 20157, Singapore ranked 3rd for infant mortality rate, 4th for under-five mortality rate and 5th for MMR.
The improvements in maternal and child health are reflected in the increasing female life expectancy and low maternal and infant mortality rates. The State of the World’s Mothers Report 2014, which is based on maternal health, education and economic status8, ranked Singapore 15th out of 178 countries and the best place in Asia to be a mother.
Emphasis on quality and accessible prenatal and pediatric care, safe delivery practices, medical advancement, childhood screening programmes and childhood immunisation programmes have contributed to the overall improvement in maternal and child health over the years. Some of the national programs and initiatives are outlined below.
Clinical services and screening
Hospitals in Singapore continuously strive to provide high standards in clinical care for both mother and child, through
continuous efforts to update and train appropriate healthcare professionals to equip them with the knowledge and skills to manage the entire spectrum of pregnancies and deliveries. As a result, it has achieved virtually 100% skilled-attendant delivery coverage. Specialist services for newborns (e.g. neonatal intensive care units) also ensure high quality care for newborns requiring intensive support and care. Continuity of care is provided for all mothers and infants post-delivery, including outpatient early interventional programmes and rehabilitation for high-risk infants.
Promotion of breastfeeding
Efforts to create a supportive environment for mothers to care for their infants’ health are seen in the engagement of key maternity hospitals the Health Promotion Board (HPB) and the Association for Breastfeeding Advocacy (Singapore) (ABAS) to implement the World Health Organization’s Baby Friendly Hospital Initiative (BFHI), which aims to create a supportive environment for mothers to care for their infants’ health.
The HPB also collaborates with ABAS to encourage and advise employers on the establishment of breastfeeding-friendly workplace policies in support of the WHO’s recommendation for partial breastfeeding of infants until 24 months of age.
Childhood immunization
Singapore’s National Childhood Immunization Program (NCIP) has substantially reduced mortality and morbidity from many vaccine-preventable diseases such as poliomyelitis, diphtheria and measles. Coverage for the recommended vaccines under the NCIP are consistently at over 90%9. This has been achieved through regular review and implementation of national vaccination policies and introduction of financing schemes to ensure continuing affordability and accessibility of childhood vaccinations. Full subsides are provided at public primary healthcare clinics for Measles, Mumps and Rubella (MMR) and DTaP-IPV-Hib (5-in-1 combination vaccine).
School health programmes
Children’s growth and development is monitored well into their school-going years. The HPB’s School Health Service (SHS) conducts age-appropriate health screening for students in schools.
7Based on 2013 data in WHO’s World Health Statistics, http://www.who.int/gho/publications/world_health_statistics/2015/en/8This report is published by Save the Children, a non-governmental organization that promotes children’s rights. It is now in its 15th edition.9Immunization coverage for measles vaccination (first dose) has been consistently kept at 95% over the years.

66
Annex 1 Roads Towards the MDGs at Country Level
ASEAN Statistical Report on Millennium Development Goals 2017
Health screening includes growth and development assessment (i.e. height and weight measurement), nutritional status assessment, vision (including color vision and stereopsis) and audiometry screening, as well as scoliosis screening, and pubertal assessment and medical examination. Students with abnormal screening results or who are obese are referred to the Student Health Centre for further evaluation and management. The School Dental Service (SDS) and School Dental Centre provide oral health screening and treatment and dental health promotion and education to children and youth aged 3 to 19 years.
Through the “Healthy Meals in Childcare Centers Program” and “Healthy Meals in Schools Program”, canteen vendors follow established guidelines to serve healthy set meals with appropriate portions of carbohydrates, meat, vegetables and fruits. The programme also includes hands-on training for cooks and canteen operators on how to prepare healthy food that is tasty.
Resources for parents and caregivers
Workshops for parents and caregivers conducted at pre-school, workplaces and community settings are supported by toolkits presented to parents during pregnancy, at birth and when their children enter pre-school. For example, the Healthier Child, Brighter Future (HCBF) programme empowers parents-to-be and parents with educational material on good health practices from the prenatal to primary stages in life. The ‘Healthy Head Start’ programme also ensures equitable access to care by providing financial support for parents/caregivers from low income families in raising their children, and focuses on improving parental knowledge and attitudes towards health promotion for their preschoolers.
Goal 8: Develop a global partnership for development
Singapore firmly believes that human resource development is critical to nation-building. As such, Singapore’s development assistance focus is on contributing towards the human resource development and training in other countries.
The Singapore Cooperation Programme (SCP) was established in 1992 to serve as Singapore’s main platform for technical assistance, premised on the belief that investment in human resource and capacity building is critical to long-term sustainable development. Since its establishment, we have conducted more than 5,000 capacity building courses in MDGs-related areas such as education, gender equality, health, and sustainable development. We also partner over 40 countries and international
organisations to conduct Third Country Training Programmes (TCTPs). For example, we have annual programmes with the United States, Japan, South Korea, the UN Development Programme, UN Conference on Trade and Development, Asian Development Bank and World Bank. We also promote South-South Cooperation through these partnerships in support of the MDGs.
The majority of our SCP alumni, close to 70,000 strong, are from ASEAN. Under the Initiative for ASEAN Integration (IAI), Simgapore established four training centres in Cambodia, Laos, Myanmar and Viet Nam in 2001 to facilitate the sharing of knowledge and expertise with government officials in these countries. In partnership with the government of Myanmar, it also set up the Singapore-Myanmar Vocational Training Institute (SMVTI) in Yangon to help Myanmar train and upgrade its workforce. Apart from ASEAN, it has also established training centres in Qatar, Oman, and Jordan.
The SCP has also created a special assistance package for Small Island Developing States (SIDS) that provides maritime and civil aviation fellowships, customised courses and priority placements for our SCP programmes.
The SCP welcomed its 100,000th participant in 2015 since inception. To date, more than 114,000 participants from over 170 countries have participated in our programmes.

67
Annex 1 Roads Towards the MDGs at Country Level
ASEAN Statistical Report on Millennium Development Goals 2017
Thailand
Thailand implemented the MDGs after the United Nations announcement in 2000. With significant policy design and close monitoring, Thailand has achieved nearly all of the MDGs goals. Therefore, Thailand has proposed MDGs+ as its extra goals. The following presents the situations and challenges with regard to the MDGs in the Thai context.
Goal 1: Eradicate poverty and hunger
Although Thailand has halved incidences of poverty since 2004, it has been unsuccessful in achieving its MDGs+ target of reducing the proportion of its population living in poverty to less than 4%. The number of people living in poverty in Thailand has been declining since 1990 when up to 36.1 million people or 57.97 % were living in poverty to 7.06 million people or 10.53 % in 2014. However, minors (age 0-14) make up the majority of those living in poverty. Most poor people in the country have low education levels. Poverty is concentrated in agricultural-based families which own inadequate agricultural land with inefficient irrigation systems. High-visibility issues around poverty include malnourished and underweight children.
Although Thailand has successfully reached a high labour participation rate, informal labour numbers remain high. Significant issues waiting to be resolved including the aging society and upgrading education quality for better addressing the needed increase in the skills of the labor force.
Goal 2: Achieve universal primary education
Even though Thailand has seen development in promoting youth literacy, the country has been unable to achieve universal primary education for every child because of net enrollment rates. When considered in terms of MDGs+, Thailand was unable to achieve the target of universal lower secondary education by 2006 and universal higher secondary education by 2014. Important and challenging issues in the MDGs include the fact that Thailand has many children outside the compulsory education system. The achievements remain low although budgets given have been high. Education inequality among urban and rural schools as well as education management issues remain of concern.
Goal 3: Promote gender equality and empower women
Thailand successfully achieved the goal of eliminating gender inequality at every level of education in 2015. Therefore, income equality has been achieved as the occupational roles and wages of women are quite similar to men. The challenging issue is violence against women., in most part caused by negative attitude towards women in parts of Thai society. Women are perceived as the primary caregiver in charge of household tasks and men are considered to have better decision-making abilities than women do.
Goal 4: Reduce child mortality
Thailand was expected to achieve the goal to reduce the under-five mortality rate by 2/3 in 1990-2015 or from approximately 8.5 per hundred thousand people to 4.3 per hundred thousand people. However, the mortality rate in the highlands is an impediment to this achievement. Moreover, unplanned pregnancy remains an important factor because many adolescent mothers have no self-care knowledge during pregnancy.
Goal 5: Improve maternal health
Thailand was unable to achieve the goal of reducing the maternal mortality ratio by 3/4 during 1990 – 2015 (MDGs 5A) or approximately 31.5 per one hundred thousand births and Thailand was unable to achieve MDGs+ to reduce mortality rates among mothers to 18 per one hundred thousand births. Thailand had opportunities to achieve the goal of access to reproductive health services in certain aspects, especially family planning. However, the situation of family planning currently facing Thailand is due to the issue of low fertility, or replacement rates.
Goal 6: Combat HIV/AIDS, malaria and other diseases
Thailand has achieved the goal of promoting full coverage for HIV/AIDS patients in 2015. Moreover, the malaria situation in Thailand is improving with statistically significant downward morbidity and mortality trends over the past 20 years. Nevertheless, Thailand continues to have a level of tuberculosis prevalency while non-communicable diseases cause increasing disability and mortality with upward trends and negative future impacts. Challenging issues that should be addressed are improved opportunities for child development in order for a child to reach its fullest potential health wise, and exclusive breastfeeding for six consecutive months to facilitate full development among infants and children. Access to public health and other services should also be made available to fragile or marginalised groups of Thai society.

68
Annex 1 Roads Towards the MDGs at Country Level
ASEAN Statistical Report on Millennium Development Goals 2017
Goal 7: Ensure environmental sustainability
Thailand has set policies and a national development plan for sustainable development to minimize biodiversity loss and depletion of natural resources and degradation of the environment. However, Thailand was unable to reduce biodiversity loss by 2010, particularly in Thailand’s forested areas and critically deteriorated marine and coastal resources, areas in which both spheres saw continually declining trends in the amount of marine and freshwater animals as well as endangered vertebrates and plants. Also, greenhouse gas emissions have continued to increase. Legal mechanisms and policies combined with a lack of unity, make solving environmental problems extremely difficult.
Goal 8: Develop a partnership for global development
Thailand achieved MDGs 8A for developing free trade and finance systems based on regulations. Thailand places importance on least developed countries, landlocked countries and developing small island states in MDGs 8B- 8C. Thailand was able to achieve provided to least developed countries.
Viet Nam
Viet Nam has completed a number of MDGs and targets such as (i) eradicate extreme poverty and hunger, (ii) achieve universal primary education, and (iii) promote gender equality in education. It has achieved certain health-related indicators such as reducing the maternal mortality ratio and the child mortality ratio. The country also achieved the target for malaria and tuberculosis control as well as combating its HIV/AIDS prevalence rate. Viet Nam is on the way towards reaching the targets for universal access to reproductive health services and improving maternal health. Regulations designed to enhance sustainable environmental practices have been integrated into national development policies; the forest coverage rate has increased to ensure the ongoing sustainability of the environment. While Viet Nam has achieved significant progress in building a Global Partnership for Development, stronger efforts are also required to fully realize specific targets such as ensuring debt sustainability, enhancing access to affordable essential drugs and development of a non-discriminatory trading and financial system.
Goal 1: Eradicate extreme poverty and hunger
Viet Nam is one of the best-performing nations with regard to poverty reduction. In fact, the country has attained the MDGs target on poverty reduction ahead its schedule. Remarkable poverty reduction is the outcome of powerful economic growth, trade liberalization and poverty reduction policies targeted directly at the disadvantaged groups. During 1993-2008, expenditure-based poverty rate fell from 58.1 % to 14.5 %, lifting millions of people out of poverty. In the following period, poverty using the new national poverty line 2011-2015, declined from 14.2 % in 2010 to 9.8 % in 2013. General living standards have improved significantly; households’ ownership of durable goods increased considerably. The hunger rate dropped dramatically over the past fifteen years and chronic hunger as a phenomenon has been eradicated in most provinces in Viet Nam. However, seasonal hunger caused by natural disasters exists at remote and mountainous areas of the country. By 2008, Viet Nam had secured the target “to reduce malnutrition rate of children aged below five.
Despite impressive achievements in poverty reduction, the country faces a number of challenges. The rate of poverty reduction varies across different ethnic groups and geoFigureical regions. Poverty and low living standards are still prevalent in remote and mountainous areas and ethnic minority communities. Multidimensional poverty has become more apparent due to pressure from urbanization and migration.

69
Annex 1 Roads Towards the MDGs at Country Level
ASEAN Statistical Report on Millennium Development Goals 2017
Goal 2: Achieve universal primary education
Viet Nam has achieved universal primary education and the country is moving towards universal lower secondary education. By 2014, the net enrolment rate of primary education reached an all-time high of 99.0%; and net enrolment rate at lower-secondary education was 87.2 % in 2012. Throughout the last few decades, the Government had shown solid commitment, and enjoyed some success in reforming and renovating the national educational system. These efforts have resulted in significant enhancements in learning and teaching quality as well as improvements in school facilities and the learning environment.
Viet Nam still needs to rigorously upgrade the quality of education to strengthen its human capital and meet the demands of a growing economy. The speed of improvement the educational sector has not been able to keep pace with Viet Nam’s fast-changing economy and society. Inequality in educational access and quality persists among different ethnic and socio-economic groups and disparate geoFigureical regions. Advanced education, including technical and vocational training has not strongly reflected the demands of job market at both national and international levels. Educational reform to improve teaching and learning quality as well as school facilities are therefore essential.
Goal 3: Promote gender equality and empower women
Viet Nam has been successful on MDGs 3 with all measured indicators being fully achieved. By 2014, there was no significant difference between literacy rate and education attainment across all educational levels between males and females. Women have also showed their growing roles in education. In higher education (university and colleges), where male lecturers were dominant in the early 2000s, the percentage of male and female lecturers are now close to equal. With regard to employment, women’s participation in non-farm activities has surged, especially in rural areas. ratio of wages (the wage gap) between male and female workers in non-farm sector has been narrowed to 106.7% in 2014 (100 would indicate full equality).
Nevertheless, Viet Nam is encountering several challenges in ensuring gender equality and empowering women. Women experience more barriers than their male counterparts in employment. Wages are still lower for female workers than males, even with identical levels of education. Women’s representation in governance and management is far from the targets given in the National Strategy on Gender Equality 2011–2020. Gender
bias, especially against women continues to be a major concern in less developed areas and gender-based violence has become more pervasive.
Goal 4: Reduce child mortality
Viet Nam has made exceptional progress in reducing child mortality. The Under-five Mortality Rate halved between 1990 and 2004 while the Infant Mortality Ratio (IMR) fell rapidly by 2.5 times over the same period. The favorable outcomes of the extended programme on vaccination and policies to shield women’s health contributed to this progress. Viet Nam is on track to achieve MDGs4 on the IMR indicator. However, these indicators have showed sluggish progress recently but the Under 5 Mortality Ratio (U5MR) is close to achievement.
Goal 5: Improve maternal health
Viet Nam has achieved significant progress in the reduction of the maternal mortality ratio, and is now approaching the target in 2015. Reproductive health of maternal women has also been paid special attention; the contraceptive prevalence rate reached 75.7% nationwide and the adolescent birth rate also fell to 45 cases per 1000 women in 2014. Most women during pregnancy have access to antenatal care service with 95.8% having at least 1 visit and 73.7% having at least four visits by 2014. However, challenges persist in specific regions where ethnic minorities reside and socio-economic conditions are less developed such as the Northern midlands and mountainous areas, and the Central Highlands. Knowledge about birth and reproductive health among the youth are rather limited. Hence, tougher policies and actions aimed at these challenges should be targeted on these groups with a general objective of comprehensive and nationwide MDGs achievement.
Goal 6: Combat HIV/AIDS, malaria and other diseases
Viet Nam has shown promising progress towards halting the spread of HIV/AIDS. Viet Nam has reduced HIV prevalence to under 0.3% of the population. The quantity and quality of HIV/AIDS treatment, care and support services have been improved, especially the remarkable scale-up of antiretroviral therapy coverage that reached 67.6% against current eligibility criteria per national guidelines in 2013, showing an increase of almost 34 times the figure in 2005.
Viet Nam has achieved the goal for controlling malaria since 2011 with the proportion of malaria-related deaths standing at only 0.01 per 100,000 people in 2012. Viet Nam also surpassed

70
Annex 1 Roads Towards the MDGs at Country Level
ASEAN Statistical Report on Millennium Development Goals 2017
the global target regarding TB control when it successfully reduced the number of new cases and deaths by 62% from 1990 levels. To sustain its achievements and make steady progress towards the SDGs in coming years, Viet Nam has to overcome several challenges, especially shortage of financial resources for supporting activities.
Goal 7: Ensure environmental sustainability
Appreciating environmental resilience as one key pillar of sustainable development. Viet Nam has progressively incorporated sustainability principles into its policies and programmes, as well as honored international commitments. Results in such areas as in improving access to clean water and providing basic sanitation and safe housing which reaches the majority of the population and targeted disadvantaged groups, are promising. The country has also made impressive efforts to fulfill its responsibilities in curtailing GHGs and ODSs, and has increased the natural carbon sink with its reforestation programmes. However, Viet Nam still faces a series of pressures as a rapidly developing economy with a large population: biodiversity loss, environmental pollution and violations, as well as inadequate attention to sustainability in favor of economic growth.
Goal 8: Develop a global partnership for development
Viet Nam has achieved solid results in developing a global partnership for development. The past years have witnessed rapid liberalization of trade; a number of major Free Trade Agreements have been signed, with the more recent ones driving the deeper integration of Viet Nam within the global economy. Thanks to trade liberalization, import-export activities have increased tremendously. However, there remains several difficulties including a higher trade deficit, and non-tariff barriers created by foreign trade partners, alongside insufficient barriers to protect young and newly-developed, domestic industries. The low value-added characteristics of export products and services together with the high dependency on a number of markets have become major obstacles. Moreover, ODA has been one of the main investment capital resources for Viet Nam’s socio-economic development. In order to effectively utilize ODA during the post-MDGs period, the government has made efforts to improve public investment management and been prepared to address risks associated with borrowed funds, including repayment capacity. Public debt has increased rapidly since 2000 and remained at 55% in 2014, though this is regarded as a ‘safe’ level.
Lessons learnt and good practices
The two main lessons learned for implementation of the Millennium Development Goals in Viet Nam are as follows:
• First, a strong political will of the population and government is effective for the MDGs implementation
• Second, a comprehensive growth model combining pro-poor, social economic development with environmental protection is essential for a successful implementation of the MDGs.

71
Annex 2 Technical Notes
ASEAN Statistical Report on Millennium Development Goals 2017
Annex 2
Technical Notes

72
Annex 2 Technical Notes
ASEAN Statistical Report on Millennium Development Goals 2017
A. Data sources:
• Submissions of ASEAN Member States (AMSs)
• National MDGs Reports of AMSs
• US$1.25 a day poverty line computations using PPP estimates from ICP
• Where there is no data complete from AMS, the data is estimated by ASEAN Secretariat
B. Methodology for generating country group level data (G) for ASEAN, ASEAN-6 and CLMV countries from the country data. The formulas for how to calculate the country group level rates based upon absolute numbers at country level are shown below. For most variables, the absolute number of each target group is only known at census time. Hence, in order to ensure consistent calculations, the total population in-country is used for the calculation of average rates at coun-try group level. An exception is made for the forest coverage. For this variable, the total land area is used for the country group calculations.
1. Proportion of population below $1.25 (PPP)10 in %
Required data:
Ai = Share of people with income below $1.25 (PPP) per day in country i
Bi = Total population in country i
Formula for country group level indicator:
G = (∑ Ai x Bi / ∑ Bi ) x 100
2. Proportion of population below the national poverty line11 in %
Required data:
Ai = Share of people with income below national poverty line in country i
Bi = Total population in country i
Formula for country group level indicator:
G = ( ∑ Ai x Bi / ∑ Bi ) x 100
3. Share of poorest quintile in national consumption in %
Required data:
Bi = Total population in country i
Ci = Total consumption (or income) of the poorest quintile in local currency in current prices in country i
Di = Total consumption (or income) of the poorest quintile expressed in US dollars (PPP) in country i
Ei = Total consumption (or income) of the entire population in country i
Fi = Total consumption (or income) of the entire population expressed in US dollars (PPP) in country i
Formula for country group level indicator:
G = ( ∑ ((Di / Fi) x Bi) / ∑ Bi ) x 100
4. Growth rate of GDP per person employed in country i
Required data:
Ci = GDP in current prices in country i
Di = GDP expressed in US dollars (PPP) in country i
Ei = Total employment in country i
Formula for the indicator for each country:
F (GDP per person) = ( Di / Ei ) Growth rate = (F t / F t-1 - 1 ) x 100
5. Employment-to-population ratio
Required data:
Bi = Total population in country i
Ci = total number of employed people aged 15 and over in country i
Di = total population aged 15 and over in country i
Formula for country group level indicator:
G = ( ∑ ((Ci / Di) x Bi) / ∑ Bi ) x 100
6. Prevalence of underweight children under-five years of age
Required data:
Bi = Total population in country i
Ci = total number of underweight children under 5 years of age in country i
Di = total population under 5 years of age in country i
Formula for country group level indicator:
G = ( ∑ ((Ci / Di) x Bi) / ∑ Bi ) x 100
7. Net enrolment ratio in primary education
Required data:
Bi = Total population in country i
Ci = total number of children of official school age enrolled in primary education in country i
Di = total population of official school age (as determined by the country) in country i
Formula for country group level indicator:
G = ( ∑ ((Ci / Di) x Bi) / ∑ Bi ) x 100
10The World Bank presented a one-dollar-a-day poverty line for their 1990 World Development Report on Poverty. This poverty line tells the cost of basic calorie requirements and the common share of non-food expenditures for a poor household. At that time, this was also the average of country level poverty lines. As the global prices have increased, some of the rounds of the International comparison programme have considered adjusting the poverty line, first to US$1.25 (PPP) in 2000 and to US$1.90 (PPP) in 2015. 11The national poverty lines are usually calculated with a similar method as the international poverty line, but may be set to cover a slightly different calorie requirement or share of non-food expenditures, hence reflecting a slightly different level.

73
Annex 2 Technical Notes
ASEAN Statistical Report on Millennium Development Goals 2017
8. Literacy rate of population aged 15 and over
Required data:
Bi = Total population in country i
Ci = number of people aged 15-24 years old who are literate in country i
Di = total population aged 15-24 years old in country i
Formula for country group level indicator:
G = ( ∑ ((Ci / Di) x Bi) / ∑ Bi ) x 100
9. Ratio of girls to boys in primary education
Required data:
Bi = Total population in country i
Ci = number of girls who are enrolled in primary school in country i
Di = number of boys who are enrolled in primary school in country i
Formula for country group level indicator:
G = ( ∑ ((Ci / Di) x Bi) / ∑ Bi ) x 100
10. Ratio of girls to boys in secondary education
Required data:
Bi = Total population in country i
Ci = number of girls who are enrolled in secondary school in country i
Di = number of boys who are enrolled in secondary school in country i
Formula for country group level indicator:
G = ( ∑ ((Ci / Di) x Bi) / ∑ Bi ) x 100
11. Ratio of girls to boys in tertiary education
Required data:
Bi = Total population in country i
Ci = number of girls who are enrolled in tertiary education in country i
Di = number of boys of who are enrolled in tertiary education in country i
Formula for country group level indicator:
G = ( ∑ ((Ci / Di) x Bi) / ∑ Bi ) x 100
12. Proportion of seats held by women in national parliament
Required data:
Bi = Total population in country i
Ci = number of seats held by women in the national parliament in country i
Di = number of seats in the national parliament in country i
Formula for country group level indicator:
G = ( ∑ ((Ci / Di) x Bi) / ∑ Bi ) x 100
13. Under-five mortality rate (U5MR)
Required data:
Bi = Total population in country i
U5MRi = under five mortality rate in country i
Formula for country group level indicator:
G = ( ∑ (U5MRi x Bi) / ∑ Bi ) x 1000
14. Infant mortality rate (IMR)
Required data:
Bi = Total population in country i
IMRi = under five mortality rate in country i
Formula for country group level indicator:
G = ( ∑ (IMRi x Bi) / ∑ Bi ) x 1000
15. Proportion of 1 year-old children immunized against mea-sles
Required data:
Bi = Total population in country i
Mi = number of children aged 1 year old or younger who have been immunized against measles in country i
Pi = number of children aged 1 year old or younger in country i
Formula for country group level indicator:
G = ( ∑ ((Mi / Pi) x Bi) / ∑ Bi ) x 1000
16. Maternal mortality ratio per 100,000 live births
Required data:
Bi = Total population in country i
Mi = number of maternity- related deaths in country i
Pi = number of livebirths in country i
Formula for country group level indicator:
G = ( ∑ ((Mi / Pi) x Bi) / ∑ Bi ) x 100,000
17. Proportion of births attended by skilled health personnel
Required data:
Bi = Total population in country i
Ci = number of births attended by skilled health personnel in country i
Di = number of births in country i
Formula for country group level indicator:
G = ( ∑ ((Ci / Di) x Bi) / ∑ Bi ) x 100

74
Annex 2 Technical Notes
ASEAN Statistical Report on Millennium Development Goals 2017
18. Incidence of malaria per 100,000 population
Required data:
Bi = population in country i
Ci = number of new cases of malaria in country i
Formula for country group level indicator:
G = ( ∑ ((Ci / Bi) x Bi) / ∑ Bi ) x 100,000
19. Incidence of tuberculosis per 100,000 population
Required data:
Bi = population in country i
Ci = number of new cases of tuberculosis in country i
Formula for country group level indicator:
G = ( ∑ ((Ci / Bi) x Bi) / ∑ Bi ) x 100,000
20. Proportion of land area covered by forest
Required data:
Ai = land area covered by forest in country i
Ci = total land area of country i
Formula for country group level indicator:
G = ( ∑ ((Ai / Ci) x Ci) / ∑ Ci ) x 100
21. Proportion of population using an improved drinking water source
Required data:
Bi = total population in country i
Ci = population using an improved drinking water source in country i
Formula for country group level indicator:
G = ( ∑ ((Ci / Bi) x Bi) / ∑ Bi ) x 100
22. Proportion of population using an improved sanitation facility
Required data:
Bi = total population in country i
Ci = population using an improved sanitation facility in country i
Formula for country group level indicator:
G = ( ∑ ((Ci / Bi) x Bi) / ∑ Bi ) x 100
23. Telephone lines per 100 population
Required data:
Bi = total population in country i
Ci = population with telephone line in country i
Formula for country group level indicator:
G = ( ∑ ((Ci / Bi) x Bi) / ∑ Bi ) x 100
24. Cellular subscribers per 100 population
Required data:
Bi = total population in country i
Ci = number of cellphone subscribers in country
Formula for country group level indicator:
G = ( ∑ ((Ci / Bi) x Bi) / ∑ Bi ) x 100
25. Internet users per 100 population
Required data:
Bi = total population in country i
Ci = number of internet users in country i
Formula for country group level indicator:
G = ( ∑ ((Ci / Bi) x Bi) / ∑ Bi ) x 100
C. Methodology for imputations:
Estimates are needed for 1990, 1995, 2000, 2005, 2010 and 2015. When the 1990 data is not available, targets that require a baseline use the 1995 data as the baseline.
In cases where data from the countries are not available on the selected years, the data from the year before or after are presented. If data are available from both the previous and the next year, a simple arithmetic average is imputed. If data are only available from 2 years ahead or after the year of presentation, the data are presented with a footnote indicating the year of observation with two digit, i.e. (-07) for 2007.
If no data are available within that range, the data are estimated using simple linear regression with the TRENDS function in Excel for all years with available data. Hence, if no data are available for 2015, data from 1990, 1995, 2000, 2005 and 2010 are used to impute data for 2015.
Data at group levels are calculated and presented if data are available for at least 50% of the countries, i.e. two or more of the CLMV countries, three or more of the ASEAN-6 countries and 5 or more of the ASEAN countries.
D. Definitions of indicators are derived from the United Nations Statistics Division’s concepts of the Millennium Development Goals indicators.

75
Annex 3 Country Tables
ASEAN Statistical Report on Millennium Development Goals 2017
Annex 3
Country Tables

76
Annex 3 Country Tables
ASEAN Statistical Report on Millennium Development Goals 2017
DATA OF 25 INDICATORS OF MDGs IN BRUNEI DARUSSALAM
Goal Indicators of Brunei Darussalam Unit 1990 1995 2000 2005 2010 2015 Source
Goal 1: Eradicate extreme poverty and hunger
1. Proportion of population below $ 1.25 (PPP) per day % n.a. n.a. n.a. n.a. n.a. n.a.
2. Proportion of population below the national poverty line % n.a. n.a. n.a. n.a. n.a. n.a.
3. Prevalence of 20% poorest population in national consumption % n.a. n.a. n.a. n.a. n.a. n.a.
4. Growth rate of GDP per person employed at current prices % n.a. n.a. n.a. n.a. n.a. n.a. JPKE (DOS)
5. Employment-to-population ratio % 64.7 59.1 64.7 62.8 62.5 60.6 JPKE (DOS)
- Labour
force survey
1995, 2014,
Population
census
1991,2001,
2011
6. Prevalence of underweight children under-five years of age % n.a. n.a. n.a. n.a. 9.6 9.6 MOH
Goal 2: Achieve universal primary education
7. Net enrolment ratio in primary education % 104.9 102.3 99.8 97.4 97.4 97.7 MOE
8. Literacy rate of population aged 15 and 24 year olds % 98.1 n.a. 98.9 n.a. 99.4 99.6 JPKE (DOS)
- Population
census
1991,2001,
2011. 2015
data are
provisional
Goal 3: Promote gender equality and empower women
9. Ratio of girls in primary education % 90.5 89.9 90.0 91.9 93.4 94.1 MOE
10. Ratio of girls in secondary education % 105.5 107.6 102.7 97.3 95.9 91.9 MOE
11. Ratio of girls in tertiary education % 91.4 98.5 124.7 136.1 127.2 148.2 MOE
12. Proportion of seats held by women in national parliament % n.a. n.a. n.a. n.a. n.a. n.a.
Goal 4: Reduce child mortality
13. Under-five mortality rate % 10.3 9.8 10.3 9.5 7.3 10.3 MOH
14. Infant mortality rate % 7.4 7.9 7.4 7.4 6.1 8.8 MOH
15. Proportion of 1 year-old children immunised against measles % 108.0 99.5 99.0 97.4 94.4 96.0 MOH
Goal 5: Improve maternal health
16. Maternal mortality ratio per 100,000 live births 0.0 0.0 26.7 14.4 15.6 59.7 MOH
17. Proportion of births attended by skilled health personnel % 97.8 98.6 99.6 99.7 99.8 100.0 MOH
Goal 6: Combat HIV/AIDS, malaria and other diseases
18. Incidence of malaria per 100,000 population cases 15.4 11.8 8.9 4.1 4.1 0.86* MOH
19. Incidence of tuberculosis per 100,000 population cases n.a. 47.7 95.8 44.0 57.2 48.0 MOH
Goal 7: Ensure environmental sustainability
20. Proportion of land area covered by forest % 80 79 78 76 75 73.33* MIPR
21.Proportion of population using an improved drinking water
source
% 100 100 100 100 100 100* MOD
22. Proportion of population using an improved sanitation facility % 65 69 70 80 80 86.67* MOD
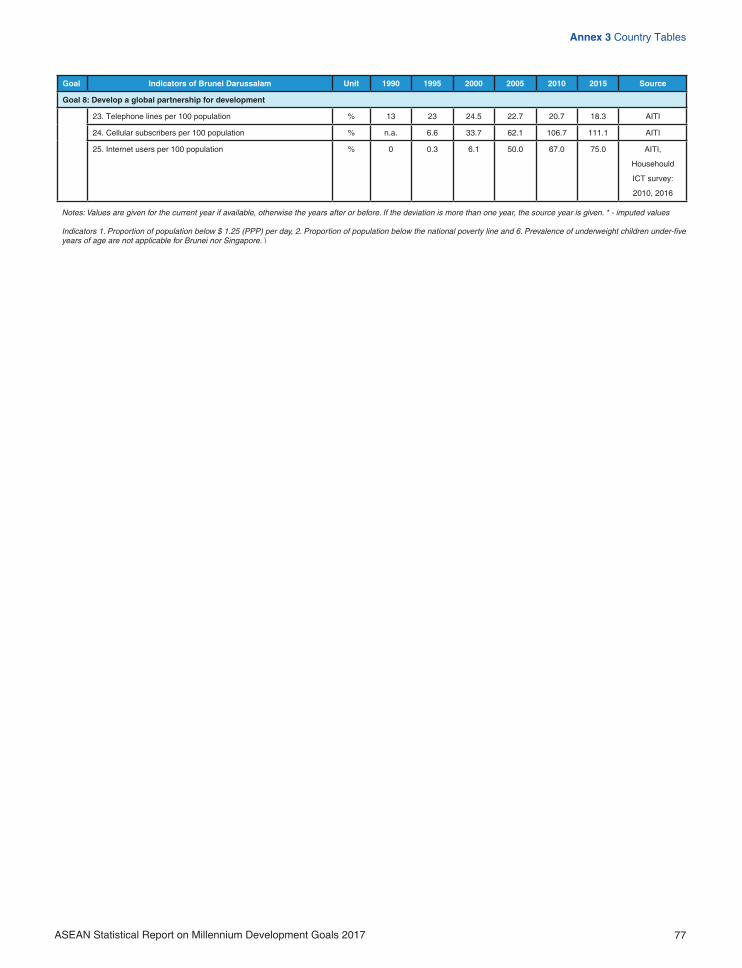
77
Annex 3 Country Tables
ASEAN Statistical Report on Millennium Development Goals 2017
Goal Indicators of Brunei Darussalam Unit 1990 1995 2000 2005 2010 2015 Source
Goal 8: Develop a global partnership for development
23. Telephone lines per 100 population % 13 23 24.5 22.7 20.7 18.3 AITI
24. Cellular subscribers per 100 population % n.a. 6.6 33.7 62.1 106.7 111.1 AITI
25. Internet users per 100 population % 0 0.3 6.1 50.0 67.0 75.0 AITI,
Househould
ICT survey:
2010, 2016
Notes: Values are given for the current year if available, otherwise the years after or before. If the deviation is more than one year, the source year is given. * - imputed values
Indicators 1. Proportion of population below $ 1.25 (PPP) per day, 2. Proportion of population below the national poverty line and 6. Prevalence of underweight children under-five years of age are not applicable for Brunei nor Singapore. \

78
Annex 3 Country Tables
ASEAN Statistical Report on Millennium Development Goals 2017
DATA OF 25 INDICATORS OF MDGs IN CAMBODIA
Goal Indicators of Cambodia Unit 1990 1995 2000 2005 2010 2015 Source
Goal 1: Eradicate extreme poverty and hunger
1. Proportion of population below $ 1.25 (PPP) per day % n.a n.a n.a n.a n.a n.a
2. Proportion of population below the national poverty line % 39 36.1 35.9 34.7 21.1 13.5 MOP
3. Prevalence of 20% poorest population in national consumption % n.a n.a 5.8 6.9 8.3 9.3 MOP
4. Growth rate of GDP per person employed at current prices % n.a n.a n.a n.a n.a n.a
5. Employment-to-population ratio % 66 65 69 79 84 83 MOP
6. Prevalence of underweight children under-five years of age % 69 56 45 36 28 24 MOP/MOH
Goal 2: Achieve universal primary education
7. Net enrolment ratio in primary education % 72.0 76.0 83.8 91.3 95.2 93.9 MOEYS
8. Literacy rate of population aged 15 and 24 year olds % 65.3 79.2 81.8 80.4 88.8 92.2 NIS
Goal 3: Promote gender equality and empower women
9. Ratio of girls in primary education 0.61 0.75 0.85 0.96 0.97 1.01 MOEYS
10. Ratio of girls in secondary education 0.70 0.79 0.83 0.90 0.91 1.09 MOEYS
11. Ratio of girls in tertiary education n.a n.a 0.34 0.48 0.69 0.85* MOEYS
12. Proportion of seats held by women in national parliament % n.a 6 10 16 22 20 National
Election
Committee
Goal 4: Reduce child mortality
13. Under-five mortality rate per 1,000 live births 181 146 124 83 54 35 MOP/MOH
14. Infant mortality rate per 1,000 live births 142 114 95 66 45 27 MOP/MOH
15. Proportion of 1 year-old children immunised against measles % n.a 22 33 70 77 70 MOP/MOH
Goal 5: Improve maternal health
16. Maternal mortality ratio per 100,000 live births 367 402 437 472 206 170 MOP/MOH
17. Proportion of births attended by skilled health personnel % n.a 20 32 44 71 89 MOP/MOH
Goal 6: Combat HIV/AIDS, malaria and other diseases
18. Incidence of malaria per 100,000 population 2783 1881 1103 550 407 274 MOH
19. Incidence of tuberculosis per 100,000 population n.a n.a 600 500 442 390 MOH
Goal 7: Ensure environmental sustainability
20. Proportion of land area covered by forest % 60.0 58.6 61.2 59.1 57.1 49.5 MAFF
21. Proportion of population using an improved drinking water
source
% 5.8 26.4 47.5 51.2 48.2 59.2 NIS
22. Proportion of population using an improved sanitation facility % 8.6 17.4 18.4 25.0 40.0 61.8 NIS
Goal 8: Develop a global partnership for development
23. Telephone lines per 100 population % n.a n.a 1.1 8.0 2.9 1.7 MPTC
24. Cellular subscribers per 100 population % n.a n.a 1.4 6.5 75.1 137.5 MPTC
25. Internet users per 100 population % n.a n.a n.a 0.1 2.3 41.8 MPTC
Notes: Values are given for the current year if available, otherwise the years after or before. If the deviation is more than one year, the source year is given. * - imputed values

79
Annex 3 Country Tables
ASEAN Statistical Report on Millennium Development Goals 2017
DATA OF 25 INDICATORS OF MDGs IN INDONESIA
Goal Indicators of Indonesia Unit 1990 1995 2000 2005 2010 2015 Source
Goal 1: Eradicate extreme poverty and hunger
1. Proportion of population below $ 1 (PPP) per day
2. Poverty rate % 15.1 11.3 19.14 15.97 13.33 11.22 BPS,Susenas
3. Prevalence of 20% poorest population in national consumption %
4. Growth rate of GDP per person employed at current prices % 3.52 3.31 BPS
5. Employment-to-population ratio % 64.64 63.72 63.64 59.28 62.89 61.7 BPS,Sakernas
August
6. Prevalence of underweight children under-five years of age % 31 28 22 28 18 19.6(-
13)
BPS, Susenas;
*MoH
Riskesdas
Goal 2: Achieve universal primary education
7. Net enrolment ratio in primary education % 88.7(-
92)
91 92 93 95 96.7 BPS, Susenas
8. Literacy rate of population aged 15 and 24 year olds % 96.6 97.5 98.4 90.9 92.9 99.67 BPS, Susenas
Goal 3: Promote gender equality and empower women
9. Ratio of girls in primary education % 100.17 100.34 99.86 99.86 100.33 BPS, Susenas
10. Ratio of girls in secondary education % 101.06 104.23 103.31 102.02 103.2* BPS, Susenas
11. Ratio of girls in tertiary education % 85 94 110 122.14 BPS, Susenas
12. Proportion of seats held by women in national parliament % 12 9.9 11.6 17.9 17.32 BPS, Susenas
Goal 4: Reduce child mortality
13. Under-five mortality rate % 97 81 55 45 42 26.29 BPS, SDKI,
*SUPAS
14. Infant mortality rate % 68 57 46 28.2 29.3 22.23 BPS, SDKI
15. Proportion of 1 year-old children immunised against measles % 44.5 67(-07) 74.5 82.36 BPS, Susenas
Goal 5: Improve maternal health
16. Maternal mortality ratio per 100,000 live births 390 353 320 268 228(-07) 305 BPS, SDKI,
*SUPAS
17. Proportion of births attended by skilled health personnel % 46 63.5 70.5 79.8 91.51 BPS, Susenas
Goal 6: Combat HIV/AIDS, malaria and other diseases
18. Incidence of malaria per 100,000 population Cases 468 283 362 410 196 85 Ministry of
Health
19. Incidence of tuberculosis per 100,000 population Cases 343 228 183(-13) TB Global
Report 2009,
WHO
Goal 7: Ensure environmental sustainability
20. Proportion of land area covered by forest % 60 50 51 Ministry of
Environment
and Forestry
21. Proportion of population using an improved drinking water
source
% 38 38 48 44 70.97 BPS
22. Proportion of population using an improved sanitation facility % 16 22 33 37 51 62.14 BPS
Goal 8: Develop a global partnership for development
23. Telephone lines per 100 population % 1.0 10.0 9.5 4.5 BPS,Ministry of
Communication
and Information
24. Cellular subscribers per 100 population % 11 89 146 BPS,Ministry of
Communication
and Information
25. Internet users per 100 population % 3.0 12.3 22.0 BPS, Susenas
Notes: Values are given for the current year if available, otherwise the years after or before. If the deviation is more than one year, the source year is given. * - imputed values

80
Annex 3 Country Tables
ASEAN Statistical Report on Millennium Development Goals 2017
DATA OF 25 INDICATORS OF MDGs IN LAO PDR
Goal Indicators of Lao PDR Unit 1990 1995 2000 2005 2010 2015 Source
Goal 1: Eradicate extreme poverty and hunger
1. Proportion of population below $ 1 (PPP) per day % 56.9(-
92)
49.5(-
97)
41.4(-
02)
37.5* 34.9(-
07)
28.8
(-12)
LSB, DoS, MPI,
LECS
2. Proportion of population below the national poverty line % 46(-92) 31.9(-
97)
33.5(-
02)
27.6(-
07)
23.2(-
12)
24 LSB, DoS, MPI,
LECS
3. Prevalence of 20% poorest population in national consumption % 8.8 (-92) 7.7 (-97) 8.5(-02) 7.9(-07) LSB, DoS, MPI,
LECS
4. Growth rate of GDP per person employed at current prices % 3.8 5.9 5.9
5. Employment-to-population ratio % 84.9 80.4 77.7 69.1 LSB, DoS, MPI,
LFS, Census
6. Prevalence of underweight children under-five years of age % 44(-92) 40 40 37 32.3 22 LSB, DoS, MPI,
LSIS I
Goal 2: Achieve universal primary education
7. Net enrolment ratio in primary education % 58.8(-
92)
65.2 77.3 84.0 95.2(-
12)
98 Lao_MOE_
Annual Report
8. Literacy rate of population aged 15 and 24 year olds % 71.1 80.6 83.9 73.1 79.5* LSB, DoS, MPI
(Census)
Goal 3: Promote gender equality and empower women
9. Ratio of girls in primary education % 79 81 85 88 91(-12) 92.3 Lao_MOE_
Annual Report
10. Ratio of girls in upper secondary education % 67(-98) 66.8 71 78 83(-12) 89.3 Lao_MOE_
Annual Report
11. Ratio of girls in tertiary education % 42 52 70 71 77(-12) 89.1* Lao_MOE_
Annual Report
12. Proportion of seats held by women in national parliament % 6.3 9.4(-97) 21.2 22.9 25(-12) 25 Lao_NA_
Annual report
Goal 4: Reduce child mortality
13. Under-five mortality rate % 170(-93) 150(-97) 131(-03) 106(-07) 79 86 Lao_DoS_
MPI_Census
DHS.LSIS
14. Infant mortality rate % 114(-93) 118(-97) 104(-03) 70 68 57 Lao_DoS_
MPI_Census
15. Proportion of 1 year-old children immunised against measles % 67(-93) 71(-97) 52(-08) 55 76 Lao_MOH_
Immunization
center
Goal 5: Improve maternal health
15. Maternal mortality ratio per 100,000 live births 796 530 405 357 206 Lao_DoS_
MPI_LRHS
& LSIS I and
Census2015
16. Proportion of births attended by skilled health personnel % 14 23 42 37* Lao_DoS_
MPI_LRHS
& LSIS I and
Census2015
Goal 6: Combat HIV/AIDS, malaria and other diseases
17. Incidence of malaria per 1000 population Cases 8.1 2.4 2.7 0.6
18. Incidence of tuberculosis per 100,000 population Cases 492 403 330 270 213 134.3* Lao_MOH_
NTBC

81
Annex 3 Country Tables
ASEAN Statistical Report on Millennium Development Goals 2017
Goal Indicators of Lao PDR Unit 1990 1995 2000 2005 2010 2015 Source
Goal 7: Ensure environmental sustainability
19. Proportion of land area covered by forest % 47.2(-
92)
41.5(-
02)
40.3 48.1 Lao_MOAF_
DoF_NRS & FS
20. Proportion of population using an improved drinking water
source
% 28 39 45 57 70 61.4 LSB_ MPI_
LRHS & LSIS I
and Census
21. Proportion of population using an improved sanitation facility % 11 17 26 45 56.7 73.2 LSB_ MPI_
LRHS & LSIS I
and Census
Goal 8: Develop a global partnership for development
23. Telephone lines per 100 population % 0 0 1 8.4 1.7 1.8* LAO_MDGs
report
24. Cellular subscribers per 100 population % n.a. n.a. 0.2 11 66 87.1 LAO_MDGs
report
25. Internet users per 100 population % n.a. n.a. 0.1 1 7 9 LAO_MDGs
report
Notes: Values are given for the current year if available, otherwise the years after or before. If the deviation is more than one year, the source year is given. * - imputed values

82
Annex 3 Country Tables
ASEAN Statistical Report on Millennium Development Goals 2017
DATA OF 25 INDICATORS OF MDGs IN MALAYSIA
Goal Indicators of Malaysia Unit 1990 1995 2000 2005 2010 2015 Source
Goal 1: Eradicate extreme poverty and hunger
1. Incidence of poverty % 16.5 8.7 8.5 5.7 3.8 0.6 Department
of Statistics
Malaysia
2. Share of poorest bottom 40% in national income % 14.5 13.7 14 13.2 14.3 16.8 Department
of Statistics
Malaysia
3. Growth rate of GDP per person employed % n.a. n.a. n.a. n.a. n.a. n.a.
4. Employment-to-population ratio (working age 15-64 years) % 63.5 62.7 63.4 61.0 61.6 65.8 Department
of Statistics
Malaysia
5. (a) Children under-five with moderate malnutrition % 24.5 19.5 13.0 7.5 4.3 2.2 Ministry of
Health
(b) Children under-five with severe malnutrition % 0.5 0.6 1.0 0.6 0.4 0.3 Ministry of
Health
Goal 2: Achieve universal primary education
6. (a) Net enrolment ratio in primary education % n.a. n.a. 97.8 99.9 96.6 98.1 Ministry of
Education
(b) Net enrolment ratio in secondary education % n.a. n.a. 66.0 68.4 66.4 68.5 Ministry of
Education
7. Literacy rate of population aged 15 - 24 year-olds % 98.0 98.1 98.3 98.4 97.9 96.9 Department
of Statistics
Malaysia
Goal 3: Promote gender equality and empower women
8. Ratio of girls in primary education % n.a. n.a. 1.000 n.a. 1.003 1.005 Ministry of
Education
9. Ratio of girls in secondary education % n.a. n.a. 1.093 1.102 1.080 1.112 Ministry of
Education
10. Ratio of girls in tertiary education % n.a. n.a. 1.041 1.274 1.237 1.205 MOHE,
Department
of Statistics
Malaysia
11. Proportion of seats held by women in national parliament % 5.3 7.3 n.a. n.a. 8.1 11.3 Parliament
Goal 4: Reduce child mortality
12. Under-five mortality rate % 16.8 13.2 7.9 8.6 8.4 8.4 Department
of Statistics
Malaysia
13. Infant mortality rate % 13.1 10.3 6.0 6.7 6.7 6.9 Department
of Statistics
Malaysia
14. Proportion of 1 year-old children immunised against MMR % 70.1 85.5 88.4 89.9 96.1 93.1 Ministry of
Health

83
Annex 3 Country Tables
ASEAN Statistical Report on Millennium Development Goals 2017
Goal Indicators of Malaysia Unit 1990 1995 2000 2005 2010 2015 Source
Goal 5: Improve maternal health
15. Maternal mortality ratio per 100,000 live births % 18.6 19.3 24.4 27.4 26.1 23.8 Department
of Statistics
Malaysia
16. Proportion of births attended by skilled health personnel % 92.9 94.9 96.6 98.0 98.6 99.4 Ministry of
Health
Goal 6: Combat HIV/AIDS, malaria and other diseases
17. Incidence of malaria per 100,000 population ratio 289.4 286.2 54.6 21.3 23.5 7.6 Ministry of
Health
18. Incidence of tuberculosis per 100,000 population ratio 61.2 56.9 64.7 61.2 68.3 79.5 Ministry of
Health
Goal 7: Ensure environmental sustainability
19. Proportion of land area covered by forest % 59.1 57.7 56.6 55.8 54.3 55.2 Ministry
of Natural
Resources and
Environment
(NRE)
20. Proportion of population using an improved drinking water
source 1
% * 84.6 88.5 92.5 92.9 95.1 Department
of Statistics
Malaysia
21. Proportion of population using an improved sanitation facility % * 93.5 96.3 97.6 98.4 99.5 Department
of Statistics
Malaysia
Goal 8: Develop a global partnership for development
22. Number of telephone (fixed) subscriptions per 100 inhabitants % - - 19.8 16.9 16.3 14.6 International
23. Cellular subscriptions per 100 inhabitants % - 4.2 21.8 74.1 119.2 143.8 Malaysian
Communications
and Multimedia
Commission
24. Internet users per 100 population % n.a. n.a. n.a. n.a. n.a. 71.1 Department
of Statistics
Malaysia
Notes: Values are given for the current year if available, otherwise the years after or before. If the deviation is more than one year, the source year is given. * - Survey not con-ducted in 1990

84
Annex 3 Country Tables
ASEAN Statistical Report on Millennium Development Goals 2017
DATA OF 25 INDICATORS OF MDGs IN MYANMAR
Goal Indicators of Myanmar Unit 1990 1995 2000 2005 2010 2015 Source
Goal 1: Eradicate extreme poverty and hunger
1. Proportion of population below $ 1.25 (PPP) per day %
2. Proportion of population below the national poverty line %
3. Prevalence of 20% poorest population in national consumption % 32.1 25.6 IHLCA Survey
Estimate
4. Growth rate of GDP per person employed at curent prices %
Growth rate of GDP per person employed by PPP %
5. Employment-to-population ratio % 45.9 47.5 48.3 49.7 64.2 Departmetn of
Labor
6. Prevalence of underweight children under-five years of age % 35 33* 32 31* MOH
Goal 2: Achieve universal primary education
7. Net enrolment ratio in primary education % 76 82 84 99 MOE
8. Literacy rate of population aged 15 and 24 year olds % 94 97 98 94 MOE
Goal 3: Promote gender equality and empower women
9. Ratio of girls in primary education % 93 94 97 99 98 96 MOE
10. Ratio of girls in secondary education % 94 100 105 96 105 108 MOE
11. Ratio of girls in tertiary education % 156 158 152 151* MOE
12. Proportion of seats held by women in national parliament % 4.75 Union Payment
Office
Goal 4: Reduce child mortality
13. Under-five mortality rate % 130 82 76 71 35 52 (p) CSO
14. Infant mortality rate % 98 55 50 47 27 39 (p) CSO
15. Proportion of 1 year-old children immunised against measles % 68 82 84 78 87 84 MOH
Goal 5: Improve maternal health
16. Maternal mortality ratio per 100,000 live births 420 350 152 117 142 180 (p) CSO
17. Proportion of births attended by skilled health personnel % 11 33 58 62 77 MOH
Goal 6: Combat HIV/AIDS, malaria and other diseases
18. Incidence of malaria per 100,000 population cases 2046 1249 1011 1121 943 574 MOH
19. Incidence of tuberculosis per 100,000 population cases 74 65 53 43* MOH
Goal 7: Ensure environmental sustainability
20. Proportion of land area covered by forest % 60 55 52 49 47 43 MOF
21. Proportion of population using an improved drinking water
source
% 72 63 69 80(p)
22. Proportion of population using an improved sanitation facility % 84 67 79 80(p)
Goal 8: Develop a global partnership for development
23. Telephone lines per 100 population % 1 1 1 1 MOCPT
24. Cellular subscribers per 100 population % 0.1 0.3 1.6 83 MOCPT
25. Internet users per 100 population % 0.0 0.1 0.0 0.1
Notes: Values are given for the current year if available, otherwise the years after or before. If the deviation is more than one year, the source year is given. * - imputed values.
(p) - preliminary figures

85
Annex 3 Country Tables
ASEAN Statistical Report on Millennium Development Goals 2017
DATA OF 25 INDICATORS OF MDGs IN PHILIPPINES
Goal Indicators of Philippines Unit 1990 1995 2000 2005 2010 2015 Source
Goal 1: Eradicate extreme poverty and hunger
1. Proportion of population below $ 1 (PPP) per day %
2. Proportion of population below the national poverty line % 34 32* 26* 27 26 22 Official Poverty
Statistics, Philippine
Statistics Authority
(PSA)
3. Prevalence of 20% poorest population in national consumption % 6 8 5 6 6 9 Family Income and
Expenditure Survey
(FIES), PSA
4. Growth rate of GDP per person employed at current prices % 2 2 7 3 4 5 Philippine National
Accounts and Labor
Force Survey (LFS),
PSA
5. Employment-to-population ratio % 59 60 57 59 59 60 Labor Force Survey
(LFS), PSA
6. Prevalence of underweight children under-five years of age % 27
(-92)
24 23 20 20 22 National Nutrition
Survey, Food and
Nutrition Research
Institute
Goal 2: Achieve universal primary education
7. Net enrolment ratio in primary education % 85 93 97 84 96 91 Basic Education
Information System
(BEIS), DepEd
8. Literacy rate of population aged 15 and 24 year olds % 97 97 95 98
(-03)
99
(-08)
98
(-13)
Functional Literacy,
Education and
Mass Media Survey
(FLEMMS), PSA
Goal 3: Promote gender equality and empower women
9. Ratio of girls in primary education % 102* 97 96 94 92 98 BEIS, DepEd
10. Ratio of girls in secondary education % 100* 104 105 107 104 107 BEIS, DepEd
11. Ratio of girls in tertiary education % 130
(-93)
130 125 120 123 123 Commission on
Higher Education
(CHED)
12. Proportion of seats held by women in national parliament % 11
(-92)
11 12
(-98)
18 21 26
(-13)
Commission on
Elections (COMELEC)
Goal 4: Reduce child mortality
13. Under-five mortality rate % 80 67 49
(-03)
34
(-08)
36 31
(-13)
National
DemoFigureic and
Health Survey
(NDHS), PSA
2011 data is from
FHS, PSA
14. Infant mortality rate % 57 49 37
(-03)
27
(-08)
27 23
(-13)
NDHS, PSA
2011 data is from
FHS, PSA
15. Proportion of 1 year-old children immunised against measles % 78 84 86 84 71 77 Field Health
Surveillance
Information System
(FHSIS), DOH

86
Annex 3 Country Tables
ASEAN Statistical Report on Millennium Development Goals 2017
Goal Indicators of Philippines Unit 1990 1995 2000 2005 2010 2015 Source
Goal 5: Improve maternal health
16. Maternal mortality ratio per 100,000 live births 164 170 176 144 129 221 1990 - 2010: PMDF
estimates of the
Technical Working
Group on Mortality
Statistcis, 2015:
Family Health Survey
17. Proportion of births attended by skilled health personnel % 59 63 69 68 76 87 FHSIS, DOH
Goal 6: Combat HIV/AIDS, malaria and other diseases
18. Incidence of malaria per 100,000 population Cases 119 89 67 43 13
(-08)
8 FHSIS, DOH
19. Incidence of tuberculosis of 100,000 population Cases 246 190 170 159 147 203 FHSIS, DOH
Goal 7: Ensure environmental sustainability
20. Proportion of land area covered by forest % 21 19 27* 24
(-03)
23* 23* 1990, 1995, 2005:
Department of
Environ-K294ment
and Natural
Resources (DENR),
2000, 2010 and 2015:
imputed - 1
21. Proportion of population using an improved drinking water
source
% 73 76 79 81 85 86 Annual Poverty
Indicators Survey
(APIS) and FIES
22. Proportion of population using an improved sanitation facility % 68 76 79 87 93 94 APIS and FIES
Goal 8: Develop a global partnership for development
23. Telephone lines per 100 population % 2 2 4 4 4 3 National
Telecommunciations
Commission (NTC)
24. Cellular subscribers per 100 population % n.a. 1 9 40 89 118 NTC
25. Internet users per 100 population % n.a. n.a. n.a. n.a. n.a. n.a.
Notes: Values are given for the current year if available, otherwise the years after or before. If the deviation is more than one year, the source year is given. * - imputed valuesNotes: PSA - Philippine Statistics Authority, FIES- Family Income and Expenditure Survey, APIS- Annual Poverty Indicators Survey, LFS- Labor Force Survey,1 - Special computations made by the ASEANstats using the data on proportion of land area covered by forest of the DENR

87
Annex 3 Country Tables
ASEAN Statistical Report on Millennium Development Goals 2017
DATA OF 25 INDICATORS OF MDGs IN SINGAPORE
Goal Indicators of Singapore Unit 1990 1995 2000 2005 2010 2015 Source
Goal 1: Eradicate extreme poverty and hunger - 1
1. Proportion of population below $ 1.25 (PPP) per day 1 %
2. Proportion of population below the national poverty line 1 %
3. Share of poorest quintile in national consumption 2 % n.a. n.a. 6.1 5.3 5.1 5.0 Singapore
Department of
Statistics
4. Growth rate of GDP per person employed 3 % 5.0 2.0 4.6 3.0 11.6 -0.2 Singapore
Department of
Statistics
5. Employment-to-population ratio 4 % 62.0 60.0 59.4 59.5 63.5 65.7 Singapore
Department
of Statistics
and Ministry of
Manpower
6. Prevalence of underweight children under-five years of age 1 %
Goal 2: Achieve universal primary education
7. Net enrolment ratio in primary education 5 % 96.1 96.4 95.7 97.3 100.0 100.0 Ministry of
Education
8. Literacy rate of population aged 15-24 year olds, women and
men 6
% 99.0 n.a. 99.5 n.a. 99.8 99.8 Singapore
Department of
Statistics
Goal 3: Promote gender equality and empower women
9. Ratio of girls to boys in primary education 7 0.99 0.99 0.99 0.99 1.00 1.00 Ministry of
Education
10. Ratio of girls to boys in secondary education 7 1.06 1.01 1.00 1.00 1.00 1.00 Ministry of
Education
11. Ratio of girls to boys in tertiary education 7 0.77 0.86 0.91 0.98 1.08 1.11 Ministry of
Education
12. Proportion of seats held by women in national parliament 8 % 4.8 4.6 6.7 16.0 24.5 25.3 Parliament of
Singapore
Goal 4: Reduce child mortality
13. Under-five mortality rate 9 7.5 5.0 3.8 2.9 2.9 2.6 Singapore
Department of
Statistics
14. Infant mortality rate 10 6.6 3.8 2.5 2.1 2.0 1.7 Singapore
Department of
Statistics
15. Percentage of measles immunization coverage for children
at 2 years of age, with at least one dose 11
% n.a. 97 96 96 95 95 Ministry of Health
Goal 5: Improve maternal health
16. Maternal mortality ratio per 100,000 live births and still-births 1.9 4.1 17.0 13.3 2.6 7.1 Immigration and
Checkpoints
Authority
17. Proportion of births attended by skilled health personnel % 99.7 99.8 99.8 99.8 99.8 99.7 Ministry of Health
Goal 6: Combat HIV/AIDS, malaria and other diseases
18. Incidence of malaria (new cases including imported cases)
per 100,000 total population 12
7.1 9.0 6.6 3.9 3.7 0.8 Ministry of Health
19. Incidence of tuberculosis (new cases) per 100,000 total
population 12
49.9 51.9 46.4 37.2 39.9 36.1 Ministry of Health

88
Annex 3 Country Tables
ASEAN Statistical Report on Millennium Development Goals 2017
Goal Indicators of Singapore Unit 1990 1995 2000 2005 2010 2015 Source
Goal 7: Ensure environmental sustainability
20. Proportion of land area covered by forest 13 % 25.83 25.25 23.95 23.43 22.95 22.74 National Parks
Board
21. Proportion of population using an improved drinking water
source
% 100 100 100 100 100 100 Ministry of
Environment and
Water Resources
22. Proportion of population using an improved sanitation facility % 100 100 100 100 100 100 Ministry of
Environment and
Water Resources
Goal 8: Develop a global partnership for development
23. Fixed Line Population Penetration Rate 14 % 21.3 24.3 59.3 43.3 39.8 36.4 Info-
communications
Media
Development
Authority
24. Mobile Population Penetration Rate 14 % 1.5 8.3 74.8 99.8 143.6 148.4 Info-
communications
Media
Development
Authority
25. Internet users per 100 resident population 15 n.a. n.a. 36.0 61.0 71.0 79.0 Info-
communications
Media
Development
Authority
Notes Values are given for the current year if available, otherwise the years after or before. If the deviation is more than one year, the source year is given.
1. Not applicable to Singapore.
2. Based on lowest quintile’s share in monthly household income from work. Income quintile is based on the ranking of all employed households by their monthly household
income from work per household member. Household income from work includes employer Central Provident Fund (CPF) contributions.
3. Based on GDP at 2010 market prices.
4. Data refer to resident population (i.e. Singapore citizens and permanent residents) aged 15 years and over in June of reference year.
5. Data refer to resident population (i.e. Singapore citizens and permanent residents).
6. Data pertain to resident population (i.e. Singapore citizens and permanent residents) aged 15-24 years. Before 2011, data are only available during Census years. Data
from 2011-2014 exclude those whose literacy is unknown.
7. Derived by dividing the female enrolment rate by male enrolment rate.
8. Please note that the computation is based on Term of Parliament. 7th Parliament is from 1988 to 1991; 8th Parliament is from 1991 to 1996; 9th Parliament is from 1997 to
2001; 10th Parliament is from 2002 to 2005; 11th Parliament is from 2006 to 2010; and 12th Parliament is from 2011 to 2015.
9. The rate refers to the probability of a new-born baby in a specified reference period dying before reaching the age of 5, if subject to age-specific mortality rates of that
reference period. We follow the MDGs definition where the data are computed from the life table using the formula : (1-I5/1000,000)*1,000, where I5 is the number of
survivors at exact age 5 years. It is expressed as the number of deaths per 1,000 live-births. Data pertain to resident population (i.e. Singapore citizens and permanent
residents).
10. The rate refers to the number of deaths of children under one year of age per 1,000 live-births. Data pertain to resident population (i.e. Singapore citizens and permanent
residents).
11. Refers to immunisation given to children who are Singapore citizens and permanent residents.
12. Refers to incidence rate per 100k total population.
13. Data have been extrapolated based on Singapore’s forest cover area as of year 2011 and land area records for the respective years.
14. With effect from Jan 2001, we have begun to use total population instead of total resident population as a population base for the calculation of penetration rates for
telecom services. Population Penetration Rate = [Total number of subscriptions/Total Population]. All figures for penetration rates are rounded to the nearest one decimal
point.
15. The number of Internet users is estimated using household survey data. From 2008, the base is residents aged 7 years and above. Prior to 2008, base is residents aged
15 years and above. The data source is “IDA’s Annual Suvey on Infocomm Usage in Households and by Individuals, 2000-2014”.
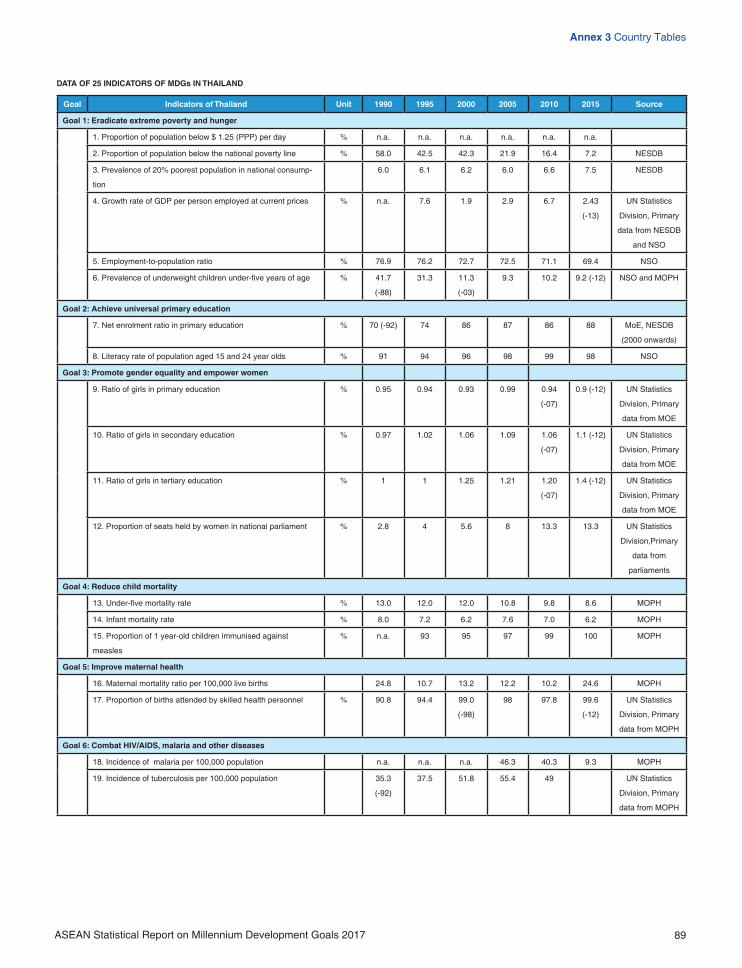
89
Annex 3 Country Tables
ASEAN Statistical Report on Millennium Development Goals 2017
DATA OF 25 INDICATORS OF MDGs IN THAILAND
Goal Indicators of Thailand Unit 1990 1995 2000 2005 2010 2015 Source
Goal 1: Eradicate extreme poverty and hunger
1. Proportion of population below $ 1.25 (PPP) per day % n.a. n.a. n.a. n.a. n.a. n.a.
2. Proportion of population below the national poverty line % 58.0 42.5 42.3 21.9 16.4 7.2 NESDB
3. Prevalence of 20% poorest population in national consump-
tion
6.0 6.1 6.2 6.0 6.6 7.5 NESDB
4. Growth rate of GDP per person employed at current prices % n.a. 7.6 1.9 2.9 6.7 2.43
(-13)
UN Statistics
Division, Primary
data from NESDB
and NSO
5. Employment-to-population ratio % 76.9 76.2 72.7 72.5 71.1 69.4 NSO
6. Prevalence of underweight children under-five years of age % 41.7
(-88)
31.3 11.3
(-03)
9.3 10.2 9.2 (-12) NSO and MOPH
Goal 2: Achieve universal primary education
7. Net enrolment ratio in primary education % 70 (-92) 74 86 87 86 88 MoE, NESDB
(2000 onwards)
8. Literacy rate of population aged 15 and 24 year olds % 91 94 96 98 99 98 NSO
Goal 3: Promote gender equality and empower women
9. Ratio of girls in primary education % 0.95 0.94 0.93 0.99 0.94
(-07)
0.9 (-12) UN Statistics
Division, Primary
data from MOE
10. Ratio of girls in secondary education % 0.97 1.02 1.06 1.09 1.06
(-07)
1.1 (-12) UN Statistics
Division, Primary
data from MOE
11. Ratio of girls in tertiary education % 1 1 1.25 1.21 1.20
(-07)
1.4 (-12) UN Statistics
Division, Primary
data from MOE
12. Proportion of seats held by women in national parliament % 2.8 4 5.6 8 13.3 13.3 UN Statistics
Division,Primary
data from
parliaments
Goal 4: Reduce child mortality
13. Under-five mortality rate % 13.0 12.0 12.0 10.8 9.8 8.6 MOPH
14. Infant mortality rate % 8.0 7.2 6.2 7.6 7.0 6.2 MOPH
15. Proportion of 1 year-old children immunised against
measles
% n.a. 93 95 97 99 100 MOPH
Goal 5: Improve maternal health
16. Maternal mortality ratio per 100,000 live births 24.8 10.7 13.2 12.2 10.2 24.6 MOPH
17. Proportion of births attended by skilled health personnel % 90.8 94.4 99.0
(-98)
98 97.8 99.6
(-12)
UN Statistics
Division, Primary
data from MOPH
Goal 6: Combat HIV/AIDS, malaria and other diseases
18. Incidence of malaria per 100,000 population n.a. n.a. n.a. 46.3 40.3 9.3 MOPH
19. Incidence of tuberculosis per 100,000 population 35.3
(-92)
37.5 51.8 55.4 49 UN Statistics
Division, Primary
data from MOPH

90
Annex 3 Country Tables
ASEAN Statistical Report on Millennium Development Goals 2017
Goal Indicators of Thailand Unit 1990 1995 2000 2005 2010 2015 Source
Goal 7: Ensure environmental sustainability
20. Proportion of land area covered by forest % 28 26 33 32 33 31.6 NESDB
21. Proportion of population using an improved drinking water
source
% 86 91 94 95 94 97 (-12) NSO
22. Proportion of population using an improved sanitation facility % 91 95 99 99 99 100 NSO
23. Telephone lines per 100 population % n.a. n.a. 9.0 10.7 10.3 7.9 NSO
24. Cellular subscribers per 100 population % n.a. n.a. 4.9 46.5 108.0 125.8 NSO
25. Internet users per 100 population % n.a. n.a. 3.7 15.0 22.4 39.3 NSO
Notes: Values are given for the current year if available, otherwise the years after or before. If the deviation is more than one year, the source year is given. * - imputed values

91
Annex 3 Country Tables
ASEAN Statistical Report on Millennium Development Goals 2017
DATA OF 25 INDICATORS OF MDGs IN VIET NAM
Goal Indicators of Viet Nam Unit 1990 1995 2000 2005 2010 2015 Source
Goal 1: Eradicate extreme poverty and hunger
1. Proportion of population below $ 1.25 (PPP) per day % n.a. 58.1(-
93)
28.9(-
02)
16 20.7 17.2 GSO: Household
Living Standard
Survey
2. Proportion of population below the national poverty line % n.a. 58.1(-
93)
28.9(-
02)
16 14.2 7.0 GSO: Household
Living Standard
Survey
3. Prevalence of 20% poorest population in national consump-
tion
% n.a. n.a. 9.2(-02) 7.2 7.3(-08) 4.6+I387 GSO: Household
Living Standard
Survey
4. Growth rate of GDP per person employed at current prices % 78.4 25.4 7.15 13.9 16.43 6.29 GSO:calculations
based on data
sources
5. Employment-to-population ratio % 44.41 45.88 47.76 51.9 56.4 57.6 GSO: Labor and
Employment
survey
6. Prevalence of underweight children under-five years of age % 41 44.9 33.8 25.2 17.5 14.1 GSO, National
Institute of
Nutrition - Ministry
of Health: survey
Goal 2: Achieve universal primary education
7. Net enrolment ratio in primary education % 87 78 (-93) 93 (-98) 95 98 99 GSO, Ministry of
Education and
Training: report
8. Literacy rate of population aged 15 and 24 year olds % 86.8 n.a. 90.3 93.6 93.7 94.9 GSO:Population
and Housing
Census; Labor
and Employment
survey
Goal 3: Promote gender equality and empower women
9. Ratio of girls to boys in primary education % 93 88 90 93.2 92.9 92.1 GSO, Ministry of
Education and
Training: report
10. Ratio of girls to boys in secondary education % 91.1 85.8 87.8 94.4 95.6 95.2 GSO, Ministry of
Education and
Training: report
11. Ratio of girls to boys in tertiary education % 89.5 81.5 87.9 97.4 114.3 115.2 GSO, Ministry of
Education and
Training: report
12. Proportion of seats held by women in national parliament % 17.8 18.5 26.2 27.3 25.8 24.4 Ministry of Home
Affairs ofThe
Socialist Republic
of Viet Nam:
report
Goal 4: Reduce child mortality
13. Under-five mortality rate % 58 n.a. 45.3 26.8 23.8 22.1 GSO: survey
14. Infant mortality rate % 45.9 n.a. 29.5 17.8 15.8 14.7 GSO: survey
15. Proportion of 1 year-old children immunised against
measles
% 93.3 95.4 95.7 97.1 98 97.4 GSO, Ministry of
Health: report

92
Annex 3 Country Tables
ASEAN Statistical Report on Millennium Development Goals 2017
Goal Indicators of Viet Nam Unit 1990 1995 2000 2005 2010 2015 Source
Goal 5: Improve maternal health
16. Maternal mortality ratio per 100,000 live births 233 n.a. n.a. 80 69 GSO; Ministry of
Health: report
17. Proportion of births attended by skilled health personnel % 88(-93) 88 95 96.1 96 97.5 Ministry of Health:
survey
Goal 6: Combat HIV/AIDS, malaria and other diseases
Number of malaria patients in 100.000 persons 899
(-92)
659 293 99 54 35
18. Incidence of malaria per 100,000 population 1313.4 915.6 377.4 119.5 62.5 0 GSO, Ministry of
Health: survey
Number of tuberculosis Cases 98374(-
93)
95165 90754 95970 54297 1911
19. Incidence of tuberculosis per 100,000 population 141.3 132.2 116.9 116.5 62.4 2.1 GSO; Ministry of
Health: report
Goal 7: Ensure environmental sustainability
20. Proportion of land area covered by forest % 27.8 28.2 33.2 37.0 39.5 40.8 Ministry of
Agriculture
and Rural
Development
21. Proportion of population using an improved drinking water
source
% n.a. n.a. 78.1 84.9 90.5 93.0 GSO: survey:
calculations
based on data of
Household Living
Standard Survey
22. Proportion of rural population using an improved sanitation
facility
% 10.3
(-93)
17.5* 44.1
(-02)
60.5 75.7 83.6 GSO: survey:
calculations
based on data of
Household Living
Standard Survey
Goal 8: Develop a global partnership for development
23. Telephone lines per 100 population % n.a. 1 3.2 8.7 14.6 6.4 GSO:calculations
based on data
sources
24. Cellular subscribers per 100 population % n.a. n.a. 1 11 128 131 GSO:calculations
based on data
sources
25. Internet users per 100 population % n.a. n.a. n.a. 12.9 31 35 GSO:calculations
based on data
sources
Notes: Values are given for the current year if available, otherwise the years after or before. If the deviation is more than one year, the source year is given. * - imputed values

93
Annex 4 Preliminary ASEAN SDG Indicators
ASEAN Statistical Report on Millennium Development Goals 2017
Annex 4
Preliminary ASEAN SDG Indicators
94
Annex 4 Preliminary ASEAN SDG Indicators
ASEAN Statistical Report on Millennium Development Goals 2017
The National Statistical Systems (NSSs) and the National Statistical Offices (NSOs) in all ASEAN countries have reviewed the Sustainable Development Goal (SDG) indicators which were discussed and agreed upon at the United Nations Statistical Commission 48th Session in New York in March 2017.
The ASEAN NSSs and NSOs have identified a preliminary set of priority SDG indicators for further discussion. The list comprises indicators which have been given priority by at least half the ASEAN countries. First, the list comprises SDG indicators which are given priority at the policy or political level and deemed ready for data collection within the current statistical system in each country. Second, the list comprises SDG indicators which are given priority at the policy or political level, but may require an improved or extended system for data collection and statistical compilation before being realized at the regional level.
1 NOPOVERTY
6 CLEAN WATERAND SANITATION 7 AFFORDABLE AND
CLEAN ENERGY 8 DECENT WORK ANDECONOMIC GROWTH 9 INDUSTRY INNOVATION
AND INFRASTRUCTURE 10 REDUCEINEQUALITIES 11 SUSTANABLE CITIES
AND COMMUNITIES
12 RESPONSIBLECONSUMPTIONAND PRODUCTION
13 CLIMATEACTION 14 LIFE
BELOW WATER 15 LIFEON LAND 16 PEACE, JUSTICE
AND STRONGINSTITUTIONS
17 PARTNERSHIPSFOR THE GOALS
2 ZEROHUNGER 3 GOOD HEALTH
AND WELL-BEING 4 QUALITYEDUCATION 5 GENDER
EQUALITY
TRANSFORMING OURWORLD
THE 2030 AGENDA FORSUSTAiNABLE
DEVELOPMENT

95
Annex 4 Preliminary ASEAN SDG Indicators
ASEAN Statistical Report on Millennium Development Goals 2017
Table 1. ASEAN SDG Political and Policy Priority Indicators supported by Statistical Capacity in a Majority of ASEAN Countries
Target Indicator
1.1 By 2030, eradicate extreme poverty for all people everywhere, currently measured
as people living on less than $1.25 a day
1.1.1 Proportion of population below the international poverty line, by sex, age,
employment status and geoFigureical location (urban/rural)
1.2 By 2030, reduce at least by half the proportion of men, women and children of all
ages living in poverty in all its dimensions according to national definitions
1.2.1 Proportion of population living below the national poverty line, by sex and age
1.2.2 Proportion of men, women and children of all ages living in poverty in all its
dimensions according to national definitions
1.5 By 2030, build the resilience of the poor and those in vulnerable situations and
reduce their exposure and vulnerability to climate-related extreme events and other
economic, social and environmental shocks and disasters
1.5.1 Number of deaths, missing persons and directly affected persons affected
attributed to disaster per 100,000 population+B24
2.2 By 2030, end all forms of malnutrition, including achieving, by 2025, the interna-
tionally agreed targets on stunting and wasting in children under 5 years of age, and
address the nutritional needs of adolescent girls, pregnant and lactating women and
older persons
2.2.1 Prevalence of stunting (height for age <-2 standard deviation from the median
of the World Health Organization (WHO) Child Growth Standards) among children
under 5 years of age
2.2.2 Prevalence of malnutrition (weight for height >+2 or <-2 standard deviation
from the median of the WHO Child Growth Standards) among children under 5
years of age, by type (wasting and overweight)
3.1 By 2030, reduce the global maternal mortality ratio to less than 70 per 100,000 live
births
3.1.1 Maternal mortality ratio
3.1.2 Proportion of births attended by skilled health personnel
3.2 By 2030, end preventable deaths of newborns and children under 5 years of age,
with all countries aiming to reduce neonatal mortality to at least as low as 12 per 1,000
live births and under-5 mortality to at least as low as 25 per 1,000 live births
3.2.1 Under-five mortality rate
3.2.2 Neonatal mortality rate
3.3 By 2030, end the epidemics of AIDS, tuberculosis, malaria and neglected tropical
diseases and combat hepatitis, water-borne diseases and other communicable
diseases
3.3.1 Number of new HIV infections per 1,000 uninfected population, by sex, age
and key populations
3.3.2 Tuberculosis incidence per 100,000 population
3.3.3 Malaria incidence per 1,000 population
3.6 By 2020, halve the number of global deaths and injuries from road traffic accidents 3.6.1 Death rate due to road traffic injuries
3.7 By 2030, ensure universal access to sexual and reproductive health-care services,
including for family planning, information and education, and the integration of repro-
ductive health into national strategies and programmes
3.7.1 Proportion of women of reproductive age (aged 15-49 years) who have their
need for family planning satisfied with modern methods
3.7.2 Adolescent birth rate (aged 10-14 years; aged 15-19 years) per 1,000 women
in that age group
3.a Strengthen the implementation of the World Health Organization Framework Con-
vention on Tobacco Control in all countries, as appropriate
3.a.1 Age-standardized prevalence of current tobacco use among persons aged 15
years and older
4.1 By 2030, ensure that all girls and boys complete free, equitable and quality primary
and secondary education leading to relevant and effective learning outcomes
4.1.1 Proportion of children and young people: (a) in grades 2/3 (b) at the end of
primary; and (c) at the end of lower secondary achieving at least a minimum profi-
ciency level in (i) reading and (ii) mathematics, by sex
4.2 By 2030, ensure that all girls and boys have access to quality early childhood devel-
opment, care and pre-primary education so that they are ready for primary education
4.2.2 Participation rate in organized learning (one year before the official primary
entry age), by sex
4.5 By 2030, eliminate gender disparities in education and ensure equal access to all
levels of education and vocational training for the vulnerable, including persons with
disabilities, indigenous peoples and children in vulnerable situations
4.5.1 Parity indices (female/male, rural/urban, bottom/top wealth quintile and others
such as disability status, indigenous peoples and conflict-affected, as data become
available) for all education indicators on this list that can be disaggregated
4.6 By 2030, ensure that all youth and a substantial proportion of adults, both men and
women, achieve literacy and numeracy
4.6.1. Percentage of population in a given age group achieving at least a fixed level
of proficiency in functional (a) literacy and (b) numeracy skills, by sex
4.a Build and upgrade education facilities that are child, disability and gender sensitive
and provide safe, non-violent, inclusive and effective learning environments for all
4.a.1 Proportion of schools with access to: (a) electricity; (b) the Internet for
pedagogical purposes; (c) computers for pedagogical purposes; (d) adapted
infrastructure and materials for students with disabilities; (e) basic drinking water; (f)
single-sex basic sanitation facilities; and (g) basic handwashing facilities (as per the
WASH indicator definitions)
4.c By 2030, substantially increase the supply of qualified teachers, including through
international cooperation for teacher training in developing countries, especially least
developed countries and small island developing States
4.c.1 Proportion of teachers in: (a) pre- primary; (b) primary; (c) lower secondary;
and (d) upper secondary education who have received at least the minimum orga-
nized teacher training (e.g. pedagogical training) pre-service or in- service required
for teaching at the relevant level in a given country

96
Annex 4 Preliminary ASEAN SDG Indicators
ASEAN Statistical Report on Millennium Development Goals 2017
Target Indicator
5.3 Eliminate all harmful practices, such as child, early and forced marriage and female
genital mutilation
5.3.1 Proportion of women aged 20-24 years who were married or in a union before
age 15 and before age 18
5.5 Ensure women’s full and effective participation and equal opportunities for leader-
ship at all levels of decision-making in political, economic and public life
5.5.1 Proportion of seats held by women in national parliaments and local
governments
5.5.2 Proportion of women in managerial positions
5.b Enhance the use of enabling technology, in particular information and communica-
tions technology, to promote the empowerment of women
5.b.1 Proportion of individuals who own a mobile telephone, by sex
6.1 By 2030, achieve universal and equitable access to safe and affordable drinking
water for all
6.1.1 Proportion of population using safely managed drinking water services
6.2 By 2030, achieve access to adequate and
equitable sanitation and hygiene for all and end open defecation, paying special atten-
tion to the needs of women and girls and those in vulnerable situations
6.2.1 Proportion of population using safely managed sanitation services, including a
hand-washing facility with soap and water
7.1 By 2030, ensure universal access to affordable, reliable and modern energy
services
7.1.1 Proportion of population with access to electricity
7.2 By 2030, increase substantially the share of renewable energy in the global energy
mix
7.2.1 Renewable energy share in the total final energy consumption
7.3 By 2030, double the global rate of improvement in energy efficiency 7.3.1 Energy intensity measured in terms of primary energy and GDP
8.1 Sustain per capita economic growth in accordance with national circumstances and,
in particular, at least 7 per cent gross domestic product growth per annum in the least
developed countries
8.1.1 Annual growth rate of real GDP per capita
8.2 Achieve higher levels of economic productivity through diversification, technolog-
ical upgrading and innovation, including through a focus on high- value added and
labour-intensive sectors
8.2.1 Annual growth rate of real GDP per employed person
8.3 Promote development-oriented policies that support productive activities, decent job
creation, entrepreneurship, creativity and innovation, and encourage the formalization
and growth of micro-, small- and medium-sized enterprises, including through access to
financial services
8.3.1 Proportion of informal employment in non-agriculture employment, by sex
8.5 By 2030, achieve full and productive employment and decent work for all women
and men, including for young people and persons with disabilities, and equal pay for
work of equal value
8.5.2 Unemployment rate, by sex, age and persons with disabilities
8.6 By 2020, substantially reduce the proportion of youth not in employment, education
or training
8.6.1 Proportion of youth (aged 15-24 years) not in education, employment or
training
8.10 Strengthen the capacity of domestic financial institutions to encourage and expand
access to banking, insurance and financial services for all
8.10.1 (a) Number of commercial bank branches per 100,000 adults and (b) number
of automated teller machines (ATMs) per 100,000 adults
8.10.2 Proportion of adults (15 years and older) with an account at a bank or other
financial institution or with a mobile- money-service provider
9.1 Develop quality, reliable, sustainable and resilient infrastructure, including regional
and trans- border infrastructure, to support economic development and human well-be-
ing, with a focus on affordable and equitable access for all
9.1.2 Passenger and freight volumes, by mode of transport
9.2 Promote inclusive and sustainable industrialization and, by 2030, significantly
raise industry’s share of employment and gross domestic product, in line with national
circumstances, and double its share in least developed countries
9.2.1 Manufacturing value added as a proportion of GDP and per capita
9.2.2 Manufacturing employment as a proportion of total employment
9.c Significantly increase access to information and communications technology and
strive to provide universal and affordable access to the Internet in least developed
countries by 2020
9.c.1 Proportion of population covered by a mobile network, by technology
10.1 By 2030, progressively achieve and sustain income growth of the bottom 40 per
cent of the population at a rate higher than the national average
10.1.1 Growth rates of household expenditure or income per capita among the
bottom 40 per cent of the population and the total population
13.1 Strengthen resilience and adaptive capacity to climate-related hazards and natural
disasters in all countries
13.1.1 Number of deaths, missing persons and directly affected persons affected
attributed to disaster per 100,000 population
14.5 By 2020, conserve at least 10 per cent of coastal and marine areas, consistent
with national and international law and based on the best available scientific information
14.5.1 Coverage of protected areas in relation to marine areas

97
Annex 4 Preliminary ASEAN SDG Indicators
ASEAN Statistical Report on Millennium Development Goals 2017
Target Indicator
15.1 By 2020, ensure the conservation, restoration and sustainable use of terrestrial
and inland freshwater ecosystems and their services, in particular forests, wetlands,
mountains and drylands, in line with obligations under international agreements
15.1.1 Forest area as a proportion of total land area
15.5 Take urgent and significant action to reduce the degradation of natural habitats,
halt the loss of biodiversity and, by 2020, protect and prevent the extinction of threat-
ened species
15.5.1 Red List Index
15.a Mobilize and significantly increase financial resources from all sources to conserve
and sustainably use biodiversity and ecosystems
15.a.1 Official development assistance and public expenditure on conservation and
sustainable use of biodiversity and ecosystems
15.b Mobilize significant resources from all sources and at all levels to finance sustain-
able forest management and provide adequate incentives to developing countries to
advance such management, including for conservation and reforestation
15.b.1 Official development assistance and public expenditure on conservation and
sustainable use of biodiversity and ecosystems
16.3 Promote the rule of law at the national and international levels and ensure equal
access to justice for all
16.3.2 Unsentenced detainees as a proportion of overall prison population
16.6 Develop effective, accountable and transparent institutions at all levels 16.6.1 Primary government expenditures as a proportion of original approved bud-
get, by sector (or by budget codes or similar)
16.9 By 2030, provide legal identity for all, including birth registration 16.9.1 Proportion of children under 5 years of age whose births have been regis-
tered with a civil authority, by age
17.1 Strengthen domestic resource mobilization, including through international support
to developing countries, to improve domestic capacity for tax and other revenue
collection
17.1.1 Total government revenue as a proportion of GDP, by source
17.1.2 Proportion of domestic budget funded by domestic taxes
17.6 Enhance North-South, South-South and triangular regional and international
cooperation on and access to science, technology and innovation and enhance
knowledge-sharing on mutually agreed terms, including through improved coordination
among existing mechanisms, in particular at the United Nations level, and through a
global technology facilitation mechanism
17.6.2 Fixed Internet broadband subscriptions per 100 inhabitants, by speed
17.8 Fully operationalize the technology bank and science, technology and innovation
capacity- building mechanism for least developed countries by 2017 and enhance the
use of enabling technology, in particular information and communications technology
17.8.1 Proportion of individuals using the Internet
17.18 By 2020, enhance capacity-building support to developing countries, including for
least developed countries and small island developing States, to increase significant-
ly the availability of high-quality, timely and reliable data disaggregated by income,
gender, age, race, ethnicity, migratory status, disability, geoFigureic location and other
characteristics relevant in national contexts
17.18.3 Number of countries with a national statistical plan that is fully funded and
under implementation, by source of funding
17.19 By 2030, build on existing initiatives to develop measurements of progress on
sustainable development that complement gross domestic product, and support statisti-
cal capacity-building in developing countries
17.19.2 Proportion of countries that (a) have conducted at least one population
and housing census in the last 10 years; and (b) have achieved 100 per cent birth
registration and 80 per cent death registration

98
Annex 4 Preliminary ASEAN SDG Indicators
ASEAN Statistical Report on Millennium Development Goals 2017
Table 2. ASEAN SDG Political and Policy Priority Indicators supported by limited Statistical Capacity in a Majority of ASEAN Countries
Target Indicator
1.3 Implement nationally appropriate social protection systems and measures for all, in-
cluding floors, and by 2030 achieve substantial coverage of the poor and the vulnerable
1.3.1 Proportion of population covered by social protection floors/systems, by
sex, distinguishing children, unemployed persons, older persons, persons with
disabilities, pregnant women, newborns, work-injury victims and the poor and the
vulnerable
1.5 By 2030, build the resilience of the poor and those in vulnerable situations and
reduce their exposure and vulnerability to climate-related extreme events and other
economic, social and environmental shocks and disasters
1.5.2 Direct disaster economic loss attributed to disasters in relation to global gross
domestic product (GDP)a
1.5.3 Number of countries that adopt and implement national disaster risk reduction
strategies in line with the Sendai Framework for Disaster Risk Reduction 2015-2030
1.5.4 Proportion of local governments that adopt and implement local disaster risk
reduction strategies in line with national disaster risk reduction strategies
1.a Ensure significant mobilization of resources from a variety of sources, includ-
ing through enhanced development cooperation, in order to provide adequate and
predictable means for developing countries, in particular least developed countries, to
implement programmes and policies to end poverty in all its dimensions
1.a.2 Proportion of total government spending on essential services (education,
health and social protection)
2.1 By 2030, end hunger and ensure access by all people, in particular the poor and
people in vulnerable situations, including infants, to safe, nutritious and sufficient food
all year round
2.1.1 Prevalence of undernourishment
2.1.2 Prevalence of moderate or severe food insecurity in the population, based on
the Food Insecurity Experience Scale (FIES)
2.5 By 2020, maintain the genetic diversity of seeds, cultivated plants and farmed and
domesticated animals and their related wild species, including through soundly man-
aged and diversified seed and plant banks at the national, regional and international
levels, and promote access to and fair and equitable sharing of benefits arising from the
utilization of genetic resources and associated traditional knowledge, as internationally
agreed
2.5.1 Number of plant and animal genetic resources for food and agriculture secured
in either medium or long-term conservation facilities
2.5.2 Proportion of local breeds classified as being at risk, not-at-risk or at unknown
level of risk of extinction
2.a Increase investment, including through enhanced international cooperation, in rural
infrastructure, agricultural research and extension services, technology development
and plant and livestock gene banks in order to enhance agricultural productive capacity
in developing countries, in particular least developed countries
2.a.1 The agriculture orientation index for government expenditures
2.a.2 Total official flows (official development assistance plus other official flows) to
the agriculture sector
2.b Correct and prevent trade restrictions and distortions in world agricultural markets,
including through the parallel elimination of all forms of agricultural export subsidies and
all export measures with equivalent effect, in accordance with the mandate of the Doha
Development Round
2.b.2 Agricultural export subsidies
3.3 By 2030, end the epidemics of AIDS, tuberculosis, malaria and neglected tropical
diseases and combat hepatitis, water-borne diseases and other communicable
diseases
3.3.1 Number of new HIV infections per 1,000 uninfected population, by sex, age
and key populations
3.3 By 2030, end the epidemics of AIDS, tuberculosis, malaria and neglected tropical
diseases and combat hepatitis, water-borne diseases and other communicable
diseases
3.3.4 Hepatitis B incidence per 100,000 population
3.3.5 Number of people requiring
interventions against neglected tropical diseases
3.4 By 2030, reduce by one third premature mortality from non-communicable diseases
through prevention and treatment and promote mental health and well-being
3.4.1 Mortality rate attributed to cardiovascular disease, cancer, diabetes or chronic
respiratory disease
3.5 Strengthen the prevention and treatment of substance abuse, including narcotic
drug abuse and harmful use of alcohol
3.5.2 Harmful use of alcohol, defined according to the national context as alcohol
per capita consumption (aged 15 years and older) within a calendar year in litres of
pure alcohol
3.9 By 2030, substantially reduce the number of deaths and illnesses from hazardous
chemicals and air, water and soil pollution and contamination
3.9.1 Mortality rate attributed to household and ambient air pollution
3.9.2 Mortality rate attributed to unsafe
water, unsafe sanitation and lack of hygiene (exposure to unsafe Water, Sanitation
and Hygiene for All (WASH) services)
3.c Substantially increase health financing and the recruitment, development, training
and retention of the health workforce in developing countries, especially in least devel-
oped countries and small island developing States
3.c.1 Health worker density and distribution

99
Annex 4 Preliminary ASEAN SDG Indicators
ASEAN Statistical Report on Millennium Development Goals 2017
Target Indicator
3.d Strengthen the capacity of all countries, in particular developing countries, for early
warning, risk reduction and management of national and global health risks
3.d.1 International Health Regulations (IHR) capacity and health emergency
preparedness
4.3 By 2030, ensure equal access for all women and men to affordable and quality
technical, vocational and tertiary education, including university
4.3.1 Participation rate of youth and adults in formal and non-formal education and
training in the previous 12 months, by sex
4.4 By 2030, substantially increase the number of youth and adults who have relevant
skills, including technical and vocational skills, for employment, decent jobs and
entrepreneurship
4.4.1 Proportion of youth and adults with information and communications technolo-
gy (ICT) skills, by type of skill
5.2 Eliminate all forms of violence against all women and girls in the public and private
spheres, including trafficking and sexual and other types of exploitation
5.2.1 Proportion of ever-partnered women and girls aged 15 years and older sub-
jected to physical, sexual or psychological violence by a current or former intimate
partner in the previous 12 months, by form of violence and by age
5.2.2 Proportion of women and girls aged 15 years and older subjected to sexual
violence by persons other than an intimate partner in the previous 12 months, by
age and place of occurrence
5.4 Recognize and value unpaid care and domestic work through the provision of public
services, infrastructure and social protection policies and the promotion of shared
responsibility within the household and the family as nationally appropriate
5.4.1 Proportion of time spent on unpaid domestic and care work, by sex, age and
location
5.6 Ensure universal access to sexual and reproductive health and reproductive rights
as agreed in accordance with the Programme of Action of the International Conference
on Population and Development and the Beijing Platform for Action and the outcome
documents of their review conferences
5.6.1 Proportion of women aged 15-49
years who make their own informed decisions regarding sexual relations, contracep-
tive use and reproductive health care
6.5 By 2030, implement integrated water resources management at all levels, including
through transboundary cooperation as appropriate
6.5.1 Degree of integrated water resources management implementation (0- 100)
6.a By 2030, expand international cooperation and capacity-building support to devel-
oping countries in water- and sanitation-related activities and programmes, including
water harvesting, desalination, water efficiency, wastewater treatment, recycling and
reuse technologies
6.a.1 Amount of water- and sanitation- related official development assistance that
is part of a government-coordinated spending plan
7.1 By 2030, ensure universal access to affordable, reliable and modern energy
services
7.1.2 Proportion of population with primary reliance on clean fuels and technology
8.4 Improve progressively, through 2030, global resource efficiency in consumption
and production and endeavour to decouple economic growth from environmental deg-
radation, in accordance with the 10-Year Framework of Programmes on Sustainable
Consumption and Production, with developed countries taking the lead
8.4.2 Domestic material consumption, domestic material consumption per capita,
and domestic material consumption per GDP
8.5 By 2030, achieve full and productive employment and decent work for all women
and men, including for young people and persons with disabilities, and equal pay for
work of equal value
8.5.1 Average hourly earnings of female and male employees, by occupation, age
and persons with disabilities
8.7 Take immediate and effective measures to eradicate forced labour, end modern
slavery and human trafficking and secure the prohibition and elimination of the worst
forms of child labour, including recruitment and use of child soldiers, and by 2025 end
child labour in all its forms
8.7.1 Proportion and number of children aged 5-17 years engaged in child labour,
by sex and age
8.8 Protect labour rights and promote safe and secure working environments for all
workers, including migrant workers, in particular women migrants, and those in precar-
ious employment
8.8.1 Frequency rates of fatal and non-
fatal occupational injuries, by sex and migrant status
8.9 By 2030, devise and implement policies to promote sustainable tourism that creates
jobs and promotes local culture and products
8.9.1 Tourism direct GDP as a proportion of total GDP and in growth rate
8.9.2 Proportion of jobs in sustainable tourism industries out of total tourism jobs
9.4 By 2030, upgrade infrastructure and retrofit industries to make them sustainable,
with increased resource-use efficiency and greater adoption of clean and environmen-
tally sound technologies and industrial processes, with all countries taking action in
accordance with their respective capabilities
9.4.1 CO2 emission per unit of value added
9.5 Enhance scientific research, upgrade the technological capabilities of industrial sec-
tors in all countries, in particular developing countries, including, by 2030, encouraging
innovation and substantially increasing the number of research and development work-
ers per 1 million people and public and private research and development spending
9.5.1 Research and development expenditure as a proportion of GDP
9.5.2 Researchers (in full-time equivalent) per million inhabitants

100
Annex 4 Preliminary ASEAN SDG Indicators
ASEAN Statistical Report on Millennium Development Goals 2017
Target Indicator
9.a Facilitate sustainable and resilient infrastructure development in developing
countries through enhanced financial, technological and technical support to African
countries, least developed countries, landlocked developing countries and small island
developing States
9.a.1 Total official international support (official development assistance plus other
official flows) to infrastructure
9.b Support domestic technology development, research and innovation in developing
countries, including by ensuring a conducive policy environment for, inter alia, industrial
diversification and value addition to commodities
9.b.1 Proportion of medium and high- tech industry value added in total value added
10.4 Adopt policies, especially fiscal, wage &
social protection policies, and progressively achieve greater equality
10.4.1 Labour share of GDP, comprising wages and social protection transfers
10.6 Ensure enhanced representation and voice for developing countries in deci-
sion-making in global international economic and financial institutions in order to deliver
more effective, credible, accountable and legitimate institutions
10.6.1 Proportion of members and voting rights of developing countries in interna-
tional organizations
10.a Implement the principle of special and differential treatment for developing
countries, in particular least developed countries, in accordance with World Trade
Organization agreements
10.a.1 Proportion of tariff lines applied to imports from least developed countries and
developing countries with zero-tariff
10.b Encourage official development assistance and financial flows, including foreign
direct investment, to States where the need is greatest, in particular least developed
countries, African countries, small island developing States and landlocked developing
countries, in accordance with their national plans and programmes
10.b.1 Total resource flows for development, by recipient and donor countries and
type of flow (e.g. official development assistance, foreign direct investment and other
flows)
11.1 By 2030, ensure access for all to adequate, safe and affordable housing and basic
services and upgrade slums
11.1.1 Proportion of urban population living in slums, informal settlements or
inadequate housing
11.2 By 2030, provide access to safe, affordable, accessible and sustainable transport
systems for all, improving road safety, notably by expanding public transport, with spe-
cial attention to the needs of those in vulnerable situations, women, children, persons
with disabilities and older persons
11.2.1 Proportion of population that has convenient access to public transport, by
sex, age and persons with disabilities
11.3 By 2030, enhance inclusive and sustainable urbanization and capacity for partic-
ipatory, integrated and sustainable human settlement planning and management in all
countries
11.3.1 Ratio of land consumption rate to population growth rate
11.5 By 2030, significantly reduce the number of deaths and the number of people
affected and substantially decrease the direct economic losses relative to global gross
domestic product caused by disasters, including water-related disasters, with a focus
on protecting the poor and people in vulnerable situations
11.5.1 Number of deaths, missing persons and directly affected persons affected
attributed to disaster per 100,000 population
11.5.2 Direct economic loss in relation to global GDP, including disaster damage
to critical infrastructure and number of disruptions to basic services, attributed to
disasters
11.6 By 2030, reduce the adverse per capita environmental impact of cities, including
by paying special attention to air quality and municipal and other waste management
11.6.1 Proportion of urban solid waste regularly collected and with adequate final
discharge out of total urban solid waste generated, by cities
11.6.2 Annual mean levels of fine particulate matter (e.g. PM2.5 and PM10) in cities
(population weighted)
12.2 By 2030, achieve the sustainable management and efficient use of natural
resources
12.2.2 Domestic material consumption, domestic material consumption per capita,
and domestic material consumption per GDP
12.4 By 2020, achieve the environmentally sound management of chemicals and all
wastes throughout their life cycle, in accordance with agreed international frameworks,
and significantly reduce their release to air, water and soil in order to minimize their
adverse impacts on human health and the environment
12.4.1 Number of parties to international multilateral environmental agreements on
hazardous waste, and other chemicals that meet their commitments and obligations
in transmitting information as required by each relevant agreement
13.1 Strengthen resilience and adaptive capacity to climate-related hazards and natural
disasters in all countries
13.1.2: Number of countries with national disaster risk reduction strategies in line
with the Sendai Framework for Disaster Risk Reduction 2015-2030
14.4 By 2020, effectively regulate harvesting and end overfishing, illegal, unreported
and unregulated fishing and destructive fishing practices and implement science-based
management plans, in order to restore fish stocks in the shortest time feasible, at least
to levels that can produce maximum sustainable yield as determined by their biological
characteristics
14.4.1 Proportion of fish stocks within biologically sustainable levels

101
Annex 4 Preliminary ASEAN SDG Indicators
ASEAN Statistical Report on Millennium Development Goals 2017
Target Indicator
15.1 By 2020, ensure the conservation, restoration and sustainable use of terrestrial
and inland freshwater ecosystems and their services, in particular forests, wetlands,
mountains and drylands, in line with obligations under international agreements
15.1.2 Proportion of important sites for terrestrial and freshwater biodiversity that
are covered by protected areas, by ecosystem type
15.2 By 2020, promote the implementation of sustainable management of all types of
forests, halt deforestation, restore degraded forests and substantially increase affor-
estation and reforestation globally
15.2.1 Progress towards sustainable forest management
15.4 By 2030, ensure the conservation of mountain ecosystems, including their
biodiversity, in order to enhance their capacity to provide benefits that are essential for
sustainable development
15.4.1 Coverage by protected areas of important sites for mountain biodiversity
15.4.2 Mountain Green Cover Index
15.7 Take urgent action to end poaching and trafficking of protected species of flora
and fauna and address both demand and supply of illegal wildlife products
15.7.1 Proportion of traded wildlife that was poached or illicitly trafficked
15.c Enhance global support for efforts to combat poaching and trafficking of protected
species, including by increasing the capacity of local communities to pursue sustainable
livelihood opportunities
15.c.1 Proportion of traded wildlife that was poached or illicitly trafficked
16.1 Significantly reduce all forms of violence and related death rates everywhere 16.1.1 Number of victims of intentional homicide per 100,000 population, by sex
and age
16.1 Significantly reduce all forms of violence and related death rates everywhere 16.1.3 Proportion of population subjected to physical, psychological or sexual
violence in the previous 12 months
16.1.4 Proportion of population that feel safe walking alone around the area they
live
16.2 End abuse, exploitation, trafficking and all forms of violence against and torture of
children
16.2.1 Proportion of children aged 1-17 years who experienced any physical pun-
ishment and/or psychological aggression by caregivers in the past month
16.2.2 Number of victims of human trafficking per 100,000 population, by sex, age
and form of exploitation
16.2.3 Proportion of young women and men aged 18-29 years who experienced
sexual violence by age 18
16.3 Promote the rule of law at the national and international levels and ensure equal
access to justice for all
16.3.1 Proportion of victims of violence in the previous 12 months who reported
their victimization to competent authorities or other officially recognized conflict
resolution mechanisms
16.5 Substantially reduce corruption and bribery in all their forms 16.5.1 Proportion of persons who had at least one contact with a public official
and who paid a bribe to a public official, or were asked for a bribe by those public
officials, during the previous 12 months
16.5.2 Proportion of businesses that had at least one contact with a public official
and that paid a bribe to a public official, or were asked for a bribe by those public
officials during the previous 12 months
16.8 Broaden and strengthen the participation of developing countries in the institutions
of global governance
16.8.1 Proportion of members and voting rights of developing countries in interna-
tional organizations
16.10 Ensure public access to information and protect fundamental freedoms, in accor-
dance with national legislation and international agreements
16.10.2 Number of countries that adopt and implement constitutional, statutory and/
or policy guarantees for public access to information
16.a Strengthen relevant national institutions, including through international coopera-
tion, for building capacity at all levels, in particular in developing countries, to prevent
violence and combat terrorism and crime
16.a.1 Existence of independent national human rights institutions in compliance
with the Paris Principles
17.3 Mobilize additional financial resources for developing countries from multiple
sources
17.3.1 Foreign direct investments (FDI), official development assistance and South-
South Cooperation as a proportion of total domestic budget
17.3.2 Volume of remittances (in United
States dollars) as a proportion of total GDP
17.4 Assist developing countries in attaining long- term debt sustainability through
coordinated policies aimed at fostering debt financing, debt relief and debt restructur-
ing, as appropriate, and address the external debt of highly indebted poor countries to
reduce debt distress
17.4.1 Debt service as a proportion of exports of goods and services

102
Annex 4 Preliminary ASEAN SDG Indicators
ASEAN Statistical Report on Millennium Development Goals 2017
Target Indicator
17.9 Enhance international support for
implementing effective and targeted capacity- building in developing countries to
support national plans to implement all the Sustainable Development Goals, including
through North-South, South-South and triangular cooperation
17.9.1 Dollar value of financial and technical assistance (including through North-
South, South-South and triangular cooperation) committed to developing countries
17.10 Promote a universal, rules-based, open, non-discriminatory and equitable
multilateral trading system under the World Trade Organization, including through the
conclusion of negotiations under its Doha Development Agenda
17.10.1 Worldwide weighted tariff- average
17.11 Significantly increase the exports of
developing countries, in particular with a view to doubling the least developed countries’
share of global exports by 2020
17.11.1 Developing countries’ and least developed countries’ share of global exports
17.12 Realize timely implementation of duty-free and quota-free market access on a
lasting basis for all least developed countries, consistent with World Trade Organization
decisions, including by ensuring that preferential rules of origin applicable to imports
from least developed countries are transparent and simple, and contribute to facilitating
market access
17.12.1 Average tariffs faced by developing countries, least developed countries and
small island developing States
17.15 Respect each country’s policy space and leadership to establish and implement
policies for poverty eradication and sustainable development
17.15.1 Extent of use of country-owned results frameworks and planning tools by
providers of development cooperation
17.16 Enhance the Global Partnership for Sustainable Development, complemented by
multi- stakeholder partnerships that mobilize and share knowledge, expertise, technolo-
gy and financial resources, to support the achievement of the Sustainable Development
Goals in all countries, in particular developing countries
17.16.1 Number of countries reporting progress in multi-stakeholder development ef-
fectiveness monitoring frameworks that support the achievement of the sustainable
development goals
17.19 By 2030, build on existing initiatives to develop measurements of progress on
sustainable development that complement gross domestic product, and support statisti-
cal capacity-building in developing countries
17.19.1 Dollar value of all resources made available to strengthen statistical capacity
in developing countries

103
Annex 5 Preliminary SDG Indicators -- Metadata Excerpts
ASEAN Statistical Report on Millennium Development Goals 2017
Annex 5
Preliminary SDG Indicators -- Metadata
Excerpts

104
Annex 5 Preliminary SDG Indicators -- Metadata Excerpts
ASEAN Statistical Report on Millennium Development Goals 2017
As referred, the United Nations Statistical Commission met in New York in their 48th Session in March 2017 to review the set of potential SDG indicators as identified by the Inter-Agency Expert Group on the SDG indicators. These were classified in three tiers. Tier I comprised indicators which were already well defined and being collected by a large number of countries. Tier II comprised indicators which were already well defined, but only being collected by a limited number of countries. Tier III comprised indicators which had been agreed upon the IAEG-SDG, but for which no metadata had been developed, tested and agreed upon.
The current annex comprises all indicators given priority by the ASEANstats, the ASEAN NSSs and the ASEAN NSOs. For most of the tier I and II SDG indicators, excerpts of the definition and recommended data source as approved by the UN Statistical Commission and published by 27 April 2017 are included. It is expected that the metadata for the remaining tier I and II, will be made available and published at in the SDG Metadata repository https://unstats.un.org/sdgs/metadata/
Table 1. ASEAN SDG Political and Policy Priority Indicators supported by Statistical Capacity in a Majority of ASEAN Countries
Sustainable Development Goal indicators should be disaggregated, where relevant, by income, sex, age, race, ethnicity, migratory status, disability and geoFigureic location, or
other characteristics, in accordance with the Fundamental Principles of Official Statistics (General Assembly resolution 68/261).
Goals and targets
(from the 2030
Agenda)
Indicators Excerpts from definition Excerpts from data source
Goal 1. End poverty in all its forms everywhere
1.1 By 2030, eradicate
extreme poverty for all
people everywhere,
currently measured as
people living on less
than $1.25 a day
1.1.1 Proportion of population be-
low the international poverty line,
by sex, age, employment status
and geoFigureical location (urban/
rural)
The indicator Proportion of population below the inter-
national poverty line is defined as the percentage of the
population living on less than $1.90 a day at 2011 inter-
national prices. The ‘international poverty line’ is current-
ly set at $1.90 a day at 2011 international prices.
Household income and expenditure surveys
1.2 By 2030, reduce at
least by half the pro-
portion of men, women
and children of all ages
living in poverty in all its
dimensions according
to national definitions
1.2.1 Proportion of population living
below the national poverty line, by
sex and age
The national poverty rate is the percentage of the total
population living below the national poverty line.
Household income and expenditure surveys
1.2.2 Proportion of men, women
and children of all ages living in
poverty in all its dimensions ac-
cording to national definitions
1.5 By 2030, build the
resilience of the poor
and those in vulner-
able situations and
reduce their exposure
and vulnerability to cli-
mate-related extreme
events and other eco-
nomic, social and envi-
ronmental shocks and
disasters
1.5.1 Number of deaths, missing
persons and directly affected per-
sons attributed to disasters per
100,000 population
Death: The number of people who died during the di-
saster, or directly after, as a direct result of the haz-
ardous event. Missing: The number of people whose
whereabouts is unknown since the hazardous event. It
includes people who are presumed dead although there
is no physical evidence. The data on number of deaths
and number of missing are mutually exclusive. Affected:
People who are affected, either directly or indirectly, by
a hazardous event. Directly affected: People who have
suffered injury, illness or other health effects; who were
evacuated, displaced, relocated or have suffered direct
damage to their livelihoods, economic, physical, social,
cultural and environmental assets.
National disaster loss database, reported to UNIS-
DR

105
Annex 5 Preliminary SDG Indicators -- Metadata Excerpts
ASEAN Statistical Report on Millennium Development Goals 2017
Goals and targets
(from the 2030
Agenda)
Indicators Excerpts from definition Excerpts from data source
Goal 2. End hunger, achieve food security and improved nutrition and promote sustainable agriculture
2.2 By 2030, end all
forms of malnutrition,
including achieving, by
2025, the internation-
ally agreed targets on
stunting and wasting in
children under 5 years
of age, and address
the nutritional needs
of adolescent girls,
pregnant and lactating
women and older per-
sons
2.2.1 Prevalence of stunting (height
for age <-2 standard deviation from
the median of the World Health
Organization (WHO) Child Growth
Standards) among children under 5
years of age
Prevalence of stunting (height-for-age <-2 standard devi-
ation from the median of the World Health. Organization
(WHO) Child Growth Standards) among children under
5 years of age.
For the majority of countries, nationally representa-
tive household surveys constitute the data source.
For a limited number of countries data from surveil-
lance systems is used if sufficient population cov-
erage is documented (about 80%). For both data
sources, the child’s height and weight measure-
ments have to be collected following recommended
standard measuring techniques (WHO 2008).
2.2.2 Prevalence of malnutrition
(weight for height >+2 or <-2 stan-
dard deviation from the median of
the WHO Child Growth Standards)
among children under 5 years of
age, by type (wasting and over-
weight)
Prevalence of overweight (weight for height >+2 stan-
dard deviation from the median of the World Health Or-
ganization (WHO) Child Growth Standards) among chil-
dren under 5 years of age. Prevalence of wasting (weight
for height <-2 standard deviation from the median of the
World Health Organization (WHO) Child Growth Stan-
dards) among children under 5 years of age.
For the majority of countries, nationally representa-
tive household surveys constitute the data source.
For a limited number of countries data from surveil-
lance systems is used if sufficient population cov-
erage is documented (about 80%). For both data
sources, the child’s height and weight measure-
ments have to be collected following recommended
standard measuring techniques (WHO 2008).
Goal 3. Ensure healthy lives and promote well-being for all at all ages
3.1 By 2030, reduce
the global maternal
mortality ratio to less
than 70 per 100,000
live births
3.1.1 Maternal mortality ratio The maternal mortality ratio (MMR) is defined as the
number of maternal deaths during a given time period
per 100,000 live births during the same time period. It
depicts the risk of maternal death relative to the number
of live births and essentially captures the risk of death in
a single pregnancy or a single live birth. Maternal deaths:
The annual number of female deaths from any cause re-
lated to or aggravated by pregnancy or its management
(excluding accidental or incidental causes) during preg-
nancy and childbirth or within 42 days of termination of
pregnancy, irrespective of the duration and site of the
pregnancy, expressed per 100,000 live births, for a spec-
ified time period.
CRVS systems are the primary (and generally pre-
ferred) source of data on maternal mortality. How-
ever, many countries lack such a system, or have
one that is not nationally representative. In such
situations, other data sources can provide valuable
information. These alternate data sources include
specialized studies on maternal mortality, popu-
lation-based surveys and miscellaneous studies.
Please see page 5 of the report, Trends in Maternal
Mortality: 1990 to 2015 Estimates
3.1.2 Proportion of births attended
by skilled health personnel
The proportion of births attended by skilled health per-
sonnel as defined as the percentage of live births attend-
ed by skilled health personnel during a specified time
period, generally up to the past five years.
Data sources for measuring this indicator are nation-
ally representative household surveys and health
facility records. Nationally representative household
surveys include surveys such as the UNICEF-sup-
ported Multiple Indicator Cluster Surveys (MICS,
mics.unicef.org) and the USAID-funded DemoFig-
ureic and Health Surveys (DHS, dhsprogram.com).
These surveys use nationally representative sam-
ples based on a two-stage cluster sampling, gener-
ally using a population census frame of enumeration
areas. Final sample size includes several thousand
households. Interviews are carried out with head of
households, all women of reproductive age (gen-
erally 15-49) and, in the case of MICS, mothers/
caretakers of children under-five. Data from health
facility records are reliable only in countries where
almost all deliveries occur in health facilities, result-
ing in generally very high level of births attended by
skilled health personnel.

106
Annex 5 Preliminary SDG Indicators -- Metadata Excerpts
ASEAN Statistical Report on Millennium Development Goals 2017
Goals and targets
(from the 2030
Agenda)
Indicators Excerpts from definition Excerpts from data source
3.2 By 2030, end pre-
ventable deaths of
newborns and children
under 5 years of age,
with all countries aim-
ing to reduce neonatal
mortality to at least as
low as 12 per 1,000
live births and under-5
mortality to at least as
low as 25 per 1,000 live
births
3.2.1 Under-five mortality rate Under-five mortality is the probability of a child born in a
specific year or period dying before reaching the age of
5 years, if subject to age specific mortality rates of that
period, expressed per 1000 live births.
Nationally-representative estimates of child mortali-
ty can be derived from a number of different sourc-
es, including civil registration and sample surveys.
The preferred source of data is a civil registration
system which records births and deaths on a contin-
uous basis. If registration is complete and the sys-
tem functions efficiently, the resulting estimates will
be accurate and timely. However, many countries
do not have well-functioning vital registration sys-
tems. In such cases household surveys, such as the
UNICEF-supported Multiple Indicator Cluster Sur-
veys (MICS), the USAID-supported DemoFigureic
and Health Surveys (DHS) and periodic population
censuses have become the primary source of data
on under-five mortality.
3.2.2 Neonatal mortality rate The neonatal mortality rate is the probability that a child
born in a specific year or period will die during the first 28
completed days of life if subject to age-specific mortality
rates of that period, expressed per 1000 live births. Neo-
natal deaths (deaths among live births during the first
28 completed days of life) may be subdivided into early
neonatal deaths, occurring during the first 7 days of life,
and late neonatal deaths, occurring after the 7th day but
before the 28th completed day of life.
Refer to indicator 3.2.1.D32
3.3 By 2030, end the
epidemics of AIDS,
tuberculosis, malaria
and neglected tropical
diseases and combat
hepatitis, water-borne
diseases and other
communicable dis-
eases
3.3.1 Number of new HIV infections
per 1,000 uninfected population, by
sex, age and key populations
The number of new HIV infections per 1,000 uninfected
population, by sex, age and key populations as defined
as the number of new HIV infections per 1000 per-
son-years among the uninfected population.
Spectrum modelling, household or key population
surveys with HIV incidence-testing, Other possible
data sources: Regular surveillance system among
key populations.
3.3.2 Tuberculosis incidence per
100,000 population
The tuberculosis incidence per 100,000 population as
defined as the estimated number of new and relapse TB
cases (all forms of TB, including cases in people living
with HIV) arising in a given year, expressed as a rate per
100 000 population.
Details about data sources and methods are
available in the following publicly available paper:
Methods used by WHO to estimate the Global
burden of TB disease https://arxiv.org/ftp/arxiv/pa-
pers/1603/1603.00278.pdf
3.3.3 Malaria incidence per 1,000
population
3.6 By 2020, halve
the number of global
deaths and injuries
from road traffic acci-
dents
3.6.1 Death rate due to road traffic
injuries
Death rate due to road traffic injuries as defined as the
number of road traffic fatal injury deaths per 100,000
population
For the road traffic deaths we have two sources of
data. Data from Global Status Report on Road Safe-
ty survey and Vital registration or certificate deaths
data that WHO receive every year from member
states (ministries of health). For the population, we
used data from the United Nations / Department of
Economic and Social Affairs/ Population division.

107
Annex 5 Preliminary SDG Indicators -- Metadata Excerpts
ASEAN Statistical Report on Millennium Development Goals 2017
Goals and targets
(from the 2030
Agenda)
Indicators Excerpts from definition Excerpts from data source
3.7 By 2030, ensure
universal access to
sexual and repro-
ductive health-care
services, including for
family planning, infor-
mation and education,
and the integration of
reproductive health
into national strategies
and programmes
3.7.1 Proportion of women of re-
productive age (aged 15-49 years)
who have their need for family plan-
ning satisfied with modern methods
The percentage of women of reproductive age (15-49
years) who desire either to have no (additional) children
or to postpone the next child and who are currently using
a modern contraceptive method.
This indicator is calculated from nationally-represen-
tative household survey data. Multi-country survey
programmes that include relevant data for this indi-
cator are: Contraceptive Prevalence Surveys (CPS),
DemoFigureic and Health Surveys (DHS), Fertility
and Family Surveys (FFS), Reproductive Health
Surveys (RHS), Multiple Indicator Cluster Surveys
(MICS), Performance Monitoring and Accountability
2020 surveys (PMA), World Fertility Surveys (WFS),
other international survey programmes and national
surveys. For information on the source of each esti-
mate, see United Nations, Department of Economic
and Social Affairs, Population Division (2016). World
Contraceptive Use 2016 (POP/DB/CP/Rev2016).
3.7.2 Adolescent birth rate (aged
10-14 years; aged 15-19 years) per
1,000 women in that age group
Annual number of births to females aged 10-14 or 15-
19 years per 1,000 females in the respective age group.
Civil registration is the preferred data source. Cen-
sus and household survey are alternate sources
when there is no reliable civil registration. Data on
births by age of mother are obtained from civil reg-
istration systems covering 90 per cent or more of
all live births, supplemented eventually by census or
survey estimates for periods when registration data
are not available. For the numerator, the figures re-
ported by National Statistical Offices to the United
Nations Statistics Division have first priority. For
the denominator, first priority is given to the latest
revision of World Population Prospects produced by
the Population Division, Department of Economic
and Social Affairs, United Nations. When either the
numerator or denominator is missing, the direct esti-
mate of the rate produced by the National Statistics
Office is used.
3.a Strengthen the
implementation of the
World Health Orga-
nization Framework
Convention on Tobac-
co Control in all coun-
tries, as appropriate
3.a.1 Age-standardized prevalence
of current tobacco use among per-
sons aged 15 years and older

108
Annex 5 Preliminary SDG Indicators -- Metadata Excerpts
ASEAN Statistical Report on Millennium Development Goals 2017
Goals and targets
(from the 2030
Agenda)
Indicators Excerpts from definition Excerpts from data source
Goal 4. Ensure inclusive and equitable quality education and promote lifelong learning opportunities for all
4.1 By 2030, ensure
that all girls and boys
complete free, equita-
ble and quality primary
and secondary educa-
tion leading to relevant
and effective learning
outcomes
4.1.1 Proportion of children and
young people: (a) in grades 2/3; (b)
at the end of primary; and (c) at the
end of lower secondary achieving
at least a minimum proficiency level
in (i) reading and (ii) mathematics,
by sex
Percentage of children and young people in Grade 2 or 3
of primary education, at the end of primary education and
the end of lower secondary education achieving at least
a minimum proficiency level in (a) reading and (b) math-
ematics. The minimum proficiency level will be measured
relative to new common reading and mathematics scales
currently in development.
Various cross-national learning assessments includ-
ing: Programme d’analyse des systèmes éducatifs
de la CONFEMEN (PASEC), Progress in Interna-
tional Reading Literacy Study (PIRLS), Programme
for International Student Assessment (PISA), South-
ern and Eastern Africa Consortium for Monitoring
Educational Quality (SACMEQ), Tercer Estudio
Regional Comparativo y Explicativo (TERCE) and
Trends in International Mathematics and Science
Study (TIMSS). (a) Short-term strategy: Use nation-
al large-scale representative assessment data from
cross-national assessments even though the perfor-
mance levels may not be directly comparable. (b)
Medium-term strategy: Use a global reporting scale
based on either a new test or the statistical linking of
national, regional and cross-national assessments.
4.2 By 2030, ensure
that all girls and boys
have access to quality
early childhood de-
velopment, care and
pre-primary education
so that they are ready
for primary education
4.2.2 Participation rate in organized
learning (one year before the offi-
cial primary entry age), by sex
The participation rate in organized learning (one year
before the official primary entry age), by sex as defined
as the percentage of children in the given age range
who participate in one or more organized learning pro-
gramme, including programmes which offer a combina-
tion of education and care. Participation in early child-
hood and in primary education are both included. The
age range will vary by country depending on the official
age for entry to primary education.
Administrative data from schools and other centres
of organized learning or from household surveys on
enrolment by single year of age in early learning
programmes; population censuses and surveys for
population estimates by single year of age (if using
administrative data on enrolment); administrative
data from ministries of education on the official en-
trance age to primary education.
4.5 By 2030, eliminate
gender disparities in
education and ensure
equal access to all
levels of education
and vocational train-
ing for the vulnerable,
including persons with
disabilities, indigenous
peoples and children
in vulnerable situations
4.5.1 Parity indices (female/male,
rural/urban, bottom/top wealth
quintile and others such as disabil-
ity status, indigenous peoples and
conflict-affected, as data become
available) for all education indica-
tors on this list that can be disag-
gregated
Parity indices require data for the specific groups of in-
terest. They represent the ratio of the indicator value for
one group to that of the other. Typically, the likely more
disadvantaged group is placed in the numerator. A value
of exactly 1 indicates parity between the two groups.
The sources are the same as for the underlying in-
dicators for this goal
4.6 By 2030, ensure
that all youth and a
substantial proportion
of adults, both men
and women, achieve
literacy and numeracy
4.6.1 Proportion of population in a
given age group achieving at least
a fixed level of proficiency in func-
tional (a) literacy and (b) numeracy
skills, by sex
The percentage of youth (aged 15-24 years) and of
adults (aged 15 years and above) have achieved or ex-
ceeded a given level of proficiency in (a) literacy and (b)
numeracy. The minimum proficiency level will be mea-
sured relative to new common literacy and numeracy
scales currently in development.
This indicator is collected via skills’ assessment
surveys of the adult population (e.g., PIAAC, STEP,
LAMP, RAMAA) and national adult literacy surveys.

109
Annex 5 Preliminary SDG Indicators -- Metadata Excerpts
ASEAN Statistical Report on Millennium Development Goals 2017
Goals and targets
(from the 2030
Agenda)
Indicators Excerpts from definition Excerpts from data source
4.a Build and upgrade
education facilities that
are child, disability and
gender sensitive and
provide safe, non-vi-
olent, inclusive and
effective learning envi-
ronments for all
4.a.1 Proportion of schools with
access to: (a) electricity; (b) the
Internet for pedagogical purposes;
(c) computers for pedagogical pur-
poses; (d) adapted infrastructure
and materials for students with dis-
abilities; (e) basic drinking water;
(f) single-sex basic sanitation facili-
ties; and (g) basic handwashing fa-
cilities (as per the WASH indicator
definitions)
The percentage of schools by level of education (primary
education) with access to the given facility or service.
Administrative data from schools and other provid-
ers of education or training.
4.c By 2030, sub-
stantially increase the
supply of qualified
teachers, including
through international
cooperation for teacher
training in developing
countries, especially
least developed coun-
tries and small island
developing States
4.c.1 Proportion of teachers in: (a)
pre-primary; (b) primary; (c) lower
secondary; and (d) upper second-
ary education who have received
at least the minimum organized
teacher training (e.g. pedagogical
training) pre-service or in-service
required for teaching at the relevant
level in a given country
The percentage of teachers by level of education taught
(pre-primary, primary, lower secondary and upper sec-
ondary education) who have received at least the mini-
mum organized pedagogical teacher training pre-service
and in-service required for teaching at the relevant level
in a given country
Administrative data from schools and other orga-
nized learning centres.
Goal 5. Achieve gender equality and empower all women and girls
5.3 Eliminate all harm-
ful practices, such as
child, early and forced
marriage and female
genital mutilation
5.3.1 Proportion of women aged
20-24 years who were married or in
a union before age 15 and before
age 18
Proportion of women aged 20-24 years who were mar-
ried or in a union before age 15 and before age 18
Household surveys such as UNICEF-supported
MICS and DHS have been collecting data on this
indicator in low- and middle-income countries since
around the late 1980s. In some countries, such data
are also collected through national censuses or oth-
er national household surveys.
5.5 Ensure women’s
full and effective par-
ticipation and equal
opportunities for lead-
ership at all levels of
decision-making in
political, economic and
public life
5.5.1 Proportion of seats held by
women in (a) national parliaments
and (b) local governments
5.5.2 Proportion of women in man-
agerial positions
This indicator refers to the proportion of females in the
total number of persons employed in senior and middle
management. For the purposes of this indicator, senior
and middle management correspond to major group
1 in both ISCO-08 and ISCO-88 minus category 14 in
ISCO-08 (hospitality, retail and other services managers)
and minus category 13 in ISCO-88 (general managers),
since these comprise mainly managers of small enter-
prises. If statistics are not disaggregated at the sub-ma-
jor level, then major group 1 of ISCO-88 and ISCO-08
could be used as a proxy.
The recommended source for this indicator is a la-
bour force survey or, if not available, other similar
types of household surveys, including a module on
employment. In the absence of any labour-related
household survey, establishment surveys or admin-
istrative records may be used to gather information
on the female share of employment by the required
ISCO groups. In cases where establishment surveys
or administrative records are used, the coverage is
likely to be limited to formal enterprises or enterpris-
es of a certain size. Information on the enterprises
covered should be provided with the figures. When
comparing figures across years, any changes in the
versions of ISCO that are used should be taken into
account.

110
Annex 5 Preliminary SDG Indicators -- Metadata Excerpts
ASEAN Statistical Report on Millennium Development Goals 2017
Goals and targets
(from the 2030
Agenda)
Indicators Excerpts from definition Excerpts from data source
5.b Enhance the use of
enabling technology, in
particular information
and communications
technology, to promote
the empowerment of
women
5.b.1 Proportion of individuals who
own a mobile telephone, by sex
The proportion of individuals who own a mobile tele-
phone, by sex is defined as the ‘proportion of individuals
who own a mobile telephone, by sex’.
This indicator is a newly developed ITU indicator
that was approved by the World Telecommunica-
tion/ICT Indicators Symposium (WTIS) 2014. The
indicator’s definition and methodology were devel-
oped under the coordination of ITU, through its Ex-
pert Groups and following an extensive consultation
process with countries. Data for the proportion of in-
dividuals owning a mobile phone were first collected
in 2015, through an annual questionnaire that ITU
sends to national statistical offices (NSO).
Goal 6. Ensure availability and sustainable management of water and sanitation for all
6.1 By 2030, achieve
universal and equitable
access to safe and af-
fordable drinking water
for all
6.1.1 Proportion of population us-
ing safely managed drinking water
services
Proportion of population using safely managed drinking
water services is currently being measured by the pro-
portion of population using an improved basic drinking
water source which is located on premises and available
when needed and free of faecal (and priority chemical)
contamination. ‘Improved’ source defined the same as
used for MDGs monitoring i.e. piped water into dwell-
ing, yard or plot; public taps or standpipes; boreholes
or tubewells; protected dug wells; protected springs and
rainwater.
Access to water and sanitation are considered core
socio-economic and health indicators, and key de-
terminants of child survival, maternal, and children’s
health, family wellbeing, and economic productivity.
Drinking water and sanitation facilities are also used
in constructing wealth quintiles used by many inte-
grated household surveys to analyse inequalities
between rich and poor. Access to drinking water
and sanitation is therefore a core indicator for most
household surveys. In high-income countries where
household surveys or censuses do not usually
collect information on basic access, estimates are
drawn from administrative records.
6.2 By 2030, achieve
access to adequate
and equitable sanita-
tion and hygiene for
all and end open def-
ecation, paying special
attention to the needs
of women and girls and
those in vulnerable sit-
uations
6.2.1 Proportion of population
using safely managed sanitation
services, including a hand-washing
facility with soap and water
The Proportion of population using safely managed
sanitation services, including a hand-washing facility
with soap and water is currently being measured by
the proportion of the population using an improved ba-
sic sanitation facility at the household level which is not
shared with other households and where excreta is safe-
ly disposed in situ or treated off-site. ‘Improved’ source
defined the same as used for MDGs monitoring i.e. flush
or pour flush toilets to sewer systems, septic tanks or pit
latrines, ventilated improved pit latrines, pit latrines with
a slab, and composting toilets. Population with a hand-
washing facility: a device to contain, transport or regulate
the flow of water to facilitate handwashing with soap and
water in the household.
Access to water and sanitation are considered core
socio-economic and health indicators, and key de-
terminants of child survival, maternal, and children’s
health, family wellbeing, and economic productivity.
Drinking water and sanitation facilities are also used
in constructing wealth quintiles used by many inte-
grated household surveys to analyse inequalities
between rich and poor. Access to sanitation is there-
fore a core indicator for most household surveys. In
high-income countries where household surveys or
censuses do not usually collect information on basic
access, estimates are drawn from administrative
records.
Goal 7. Ensure access to affordable, reliable, sustainable and modern energy for all
7.1 By 2030, ensure
universal access to
affordable, reliable
and modern energy
services
7.1.1 Proportion of population with
access to electricity
Proportion of population with access to electricity is the
percentage of population with access to electricity.
Data for access to electricity are collected entirely
from household surveys (and occasionally census-
es), tapping into a wide number of different house-
hold survey types including: DemoFigureic and
Health Surveys (DHS) and Living Standards Mea-
surement Surveys (LSMS), Multi-Indicator Cluster
Surveys (MICS), the World Health Survey (WHS),
other nationally developed and implemented sur-
veys, including those by various government agen-
cies (for example, ministries of energy and utilities).

111
Annex 5 Preliminary SDG Indicators -- Metadata Excerpts
ASEAN Statistical Report on Millennium Development Goals 2017
Goals and targets
(from the 2030
Agenda)
Indicators Excerpts from definition Excerpts from data source
7.2 By 2030, increase
substantially the share
of renewable energy in
the global energy mix
7.2.1 Renewable energy share in
the total final energy consumption
The renewable energy share in total final consumption
is the percentage of final consumption of energy that is
derived from renewable resources.
Data on renewable energy consumption are avail-
able through national Energy Balances produced by
the International Energy Agency and the United Na-
tions Statistics Division (UNSD) for more than 180
countries. The energy balances make it possible to
trace all the different sources and uses of energy at
the national level.
7.3 By 2030, double
the global rate of im-
provement in energy
efficiency
7.3.1 Energy intensity measured in
terms of primary energy and GDP
Energy intensity is defined as the energy supplied to the
economy pet unit value of economic output
IEA and UN energy balances combined provide total
energy supply data for all countries on an annual
basis. GDP data is available for all countries on an
annual basis.
Goal 8. Promote sustained, inclusive and sustainable economic growth, full and productive employment and decent work for all
8.1 Sustain per capita
economic growth in ac-
cordance with national
circumstances and,
in particular, at least
7 per cent gross do-
mestic product growth
per annum in the least
developed countries
8.1.1 Annual growth rate of real
GDP per capita
Annual growth rate of real Gross Domestic Product
(GDP) per capita is calculated as the percentage change
in the real GDP per capita between two consecutive
years. Real GDP per capita is calculated by dividing
GDP at constant prices by the population of a country
or area. The data for real GDP are measured in constant
US dollars to facilitate the calculation of country growth
rates and aggregation of the country data
The underlying annual GDP estimates in domestic
currency are collected from countries or areas an-
nually through a national accounts questionnaire
(NAQ), while the underlying population estimates
are obtained from the UN Population Division on
https://esa.un.org/unpd/wpp/Download/Standard/
Population/
8.2 Achieve higher
levels of economic pro-
ductivity through diver-
sification, technological
upgrading and innova-
tion, including through
a focus on high-value
added and labour-in-
tensive sectors
8.2.1 Annual growth rate of real
GDP per employed person
Annual growth rate of real GDP per employed person
conveys the annual percentage change in real Gross
Domestic Product per employed person.
Output measures used in the nominator of this indi-
cator (Gross Domestic Product) are best obtained
from the production side of national accounts and
represent, as much as possible, GDP at market
prices for the aggregate economy (adjusted for in-
flation, in constant prices). Employment data used in
the denominator are preferably derived from labour
force or other household surveys with an employ-
ment module. In the absence of a household sur-
vey, establishment surveys, administrative records
or official estimates based on reliable sources can
be used as well as population censuses.
8.3 Promote develop-
ment-oriented policies
that support produc-
tive activities, decent
job creation, entre-
preneurship, creativity
and innovation, and
encourage the formal-
ization and growth of
micro-, small- and me-
dium-sized enterpris-
es, including through
access to financial
services
8.3.1 Proportion of informal em-
ployment in non-agriculture em-
ployment, by sex

112
Annex 5 Preliminary SDG Indicators -- Metadata Excerpts
ASEAN Statistical Report on Millennium Development Goals 2017
Goals and targets
(from the 2030
Agenda)
Indicators Excerpts from definition Excerpts from data source
8.5 By 2030, achieve
full and productive em-
ployment and decent
work for all women
and men, including for
young people and per-
sons with disabilities,
and equal pay for work
of equal value
8.5.2 Unemployment rate, by sex,
age and persons with disabilities
The unemployment rate conveys the percentage of per-
sons in the labour force who are unemployed
The preferred official national data source for this
indicator is a household-based labour force survey.
The population census and/or other household sur-
veys with an appropriate employment module may
also be used to obtain the required data. Unemploy-
ment registers can serve as instruments to collect
data on unemployment levels, and used to supple-
ment the information obtained in household surveys.
8.6 By 2020, substan-
tially reduce the pro-
portion of youth not in
employment, educa-
tion or training
8.6.1 Proportion of youth (aged 15-
24 years) not in education, employ-
ment or training
This proportion of youth (aged 15-24 years) not in edu-
cation, employment or training, also known as “the NEET
rate”, conveys the number of young persons not in edu-
cation, employment or training as a percentage of the
total youth population
The preferred official national data source for this
indicator is a household-based labour force survey.
The population census and/or other household sur-
veys with an appropriate employment module can
also be used to obtain the required data.
8.10 Strengthen the
capacity of domestic
financial institutions to
encourage and expand
access to banking, in-
surance and financial
services for all
8.10.1 (a) Number of commercial
bank branches per 100,000 adults
and (b) number of automated tell-
er machines (ATMs) per 100,000
adults
8.10.2 Proportion of adults (15
years and older) with an account at
a bank or other financial institution
or with a mobile-money-service
provider
The percentage of adults (ages 15+) who report having
an account (by themselves or together with someone
else) at a bank or another type of financial institution or
personally using a mobile money service in the past 12
months.
The indicators in the 2014 Global Financial Inclusion
(Global Findex) database are drawn from survey
data covering almost 150,000 people in more than
140 economies—representing more than 97 percent
of the world’s population. The survey was carried
out over the 2014 calendar year by Gallup, Inc. as
part of its Gallup World Poll. The target population
is the entire civilian, noninstitutionalized pop. age 15
and above.
Goal 9. Build resilient infrastructure, promote inclusive and sustainable industrialization and foster innovation
9.1 Develop quality,
reliable, sustainable
and resilient infrastruc-
ture, including regional
and trans-border infra-
structure, to support
economic development
and human well-being,
with a focus on afford-
able and equitable ac-
cess for all
9.1.2 Passenger and freight vol-
umes, by mode of transport
Passenger and freight volumes is the sum of the pas-
senger and freight volumes reported for the air carriers
in terms of number of people and metric tonnes of cargo
respectively.
ICAO Air Transport Reporting Forms approved
by the Statistics Division of ICAO and its Member
States has been used to define standards, method-
ologies and to collect aviation data since the 1950’s.
ICAO definitions and metadata is also used by the
Aviation Industry as the basis of collecting data and
conducting analysis.

113
Annex 5 Preliminary SDG Indicators -- Metadata Excerpts
ASEAN Statistical Report on Millennium Development Goals 2017
Goals and targets
(from the 2030
Agenda)
Indicators Excerpts from definition Excerpts from data source
9.2 Promote inclu-
sive and sustainable
industrialization and,
by 2030, significantly
raise industry’s share
of employment and
gross domestic prod-
uct, in line with national
circumstances, and
double its share in
least developed coun-
tries
9.2.1 Manufacturing value added
as a proportion of GDP and per
capita
Manufacturing value added (MVA) as a proportion of
Gross Domestic Product (GDP) and per capita is the to-
tal value of goods and services net of intermediate con-
sumption. It is generally compiled as the sum of the value
added of all manufacturing activity units in operation in
the reference period. For the purpose on comparabili-
ty over time and across countries MVA is estimated in
terms of constant prices in USD. The current series are
given at constant prices of 2010.
UNIDO maintains MVA database which is updated
every year. Figures for updates are obtained from
national account estimates produced by NSOs and
MVA data in USD are also taken from UN Statistics
Division. National currency data are converted to
USD by using IMF exchange rates
9.2.2 Manufacturing employment
as a proportion of total employment
Employment is defined as a work performed for pay or
profit. The value is obtained by summing up the number
of employed in all manufacturing activities. The manu-
facturing employment indicator is presented in absolute
terms as well as relative to total employment.
Employment in manufacturing is reported in annual
industrial surveys. Total employment data is ob-
tained from the census and employment surveys
including household surveys.
9.c Significantly in-
crease access to infor-
mation and communi-
cations technology and
strive to provide univer-
sal and affordable ac-
cess to the Internet in
least developed coun-
tries by 2020
9.c.1 Proportion of population
covered by a mobile network, by
technology
Proportion of population covered by a mobile network,
broken down by technology, refers to the percentage of
inhabitants living within range of a mobile-cellular signal,
irrespective of whether or not they are mobile phone sub-
scribers or users. This is calculated by dividing the num-
ber of inhabitants within range of a mobile-cellular signal
by the total population and multiplying by 100
This indicator is based on an internationally agreed
definition and methodology, which have been de-
veloped under the coordination of ITU, through its
Expert Groups and following an extensive consulta-
tion process with countries. It is also a core indicator
of the Partnership on Measuring ICT for Develop-
ment’s Core List of Indicators, which has been en-
dorsed by the UN Statistical Commission (last time
in 2014). ITU collects data for this indicator through
an annual questionnaire from national regulatory
authorities or Information and Communication Tech-
nology Ministries, who collect the data from Internet
service providers.
Goal 10. Reduce inequality within and among countries
10.1 By 2030, progres-
sively achieve and sus-
tain income growth of
the bottom 40 per cent
of the population at a
rate higher than the
national average
10.1.1 Growth rates of household
expenditure or income per capita
among the bottom 40 per cent of
the population and the total popu-
lation
The growth rate in the welfare aggregate of bottom 40%
is computed as the annualized average growth rate in
per capita real consumption or income of the bottom 40%
of the income distribution in a country from household
surveys over a roughly 5-year period. The national av-
erage growth rate in the welfare aggregate is computed
as the annualized average growth rate in per capita real
consumption or income of the total population in a coun-
try from household surveys over a roughly 5-year period.
The Global Database of Shared Prosperity was pre-
pared by the Global Poverty Working Group, which
comprises poverty measurement specialists of dif-
ferent departments of the World Bank Group. The
database’s primary source of data is the World Bank
Group’s PovcalNet database, an interactive compu-
tational tool that allows users to replicate the World
Bank Group’s official poverty estimates measured at
international poverty lines ($1.90 or $3.10 per day
per capita). The choice of consumption or income
to measure shared prosperity for a country is con-
sistent with the welfare aggregate used to estimate
extreme poverty rates in PovcalNet, unless there
are strong arguments for using a different welfare
aggregate. The practice adopted by the World Bank
Group for estimating global and regional poverty
rates is, in principle, to use per capita consumption
expenditure as the welfare measure wherever avail-
able and to use income as the welfare measure for
countries for which consumption data are unavail-
able.
Goal 11. Make cities and human settlements inclusive, safe, resilient and sustainable
Goal 12. Ensure sustainable consumption and production patterns

114
Annex 5 Preliminary SDG Indicators -- Metadata Excerpts
ASEAN Statistical Report on Millennium Development Goals 2017
Goals and targets
(from the 2030
Agenda)
Indicators Excerpts from definition Excerpts from data source
Goal 13. Take urgent action to combat climate change and its impactsa
13.1 Strengthen re-
silience and adaptive
capacity to climate-re-
lated hazards and
natural disasters in all
countries
13.1.1 Number of deaths, miss-
ing persons and directly affected
persons attributed to disasters per
100,000 population
NA [a] An open-ended intergovernmental expert working
group on indicators and terminology relating to disaster
risk reduction established by the General Assembly (res-
olution 69/284) is developing a set of indicators to mea-
sure global progress in the implementation of the Sendai
Framework. These indicators will eventually reflect the
agreements on the Sendai Framework indicators.
National Progress Report of the Sendai Monitor, re-
ported to UNISDR
Goal 14. Conserve and sustainably use the oceans, seas and marine resources for sustainable development
14.5 By 2020, con-
serve at least 10 per
cent of coastal and ma-
rine areas, consistent
with national and inter-
national law and based
on the best available
scientific information
14.5.1 Coverage of protected areas
in relation to marine areas
The indicator Coverage of protected areas in relation to
marine areas shows temporal trends in the percentage
of important sites for marine biodiversity (i.e., those that
contribute significantly to the global persistence of biodi-
versity) that are wholly covered by designated protected
areas.
Protected area data are compiled by ministries of
environment and other ministries responsible for the
designation and maintenance of protected areas.
Protected Areas data for sites designated under
the Ramsar Convention and the UNESCO World
Heritage Convention are collected through the rele-
vant convention international secretariats. Protected
area data are aggregated globally into the World
Database on Protected Areas by the UNEP World
Conservation Monitoring Centre, according to the
mandate for production of the United Nations List of
Protected Areas (Deguignet et al. 2014). They are
disseminated through Protected Planet http://www.
protectedplanet.net/, which is jointly managed by
UNEP-WCMC and IUCN and its World Commission
on Protected Areas (Juffe-Bignoli et al. 2014).
Goal 15. Protect, restore and promote sustainable use of terrestrial ecosystems, sustainably manage forests, combat desertification, and halt and reverse land deg-
radation and halt biodiversity loss
15.1 By 2020, ensure
the conservation, res-
toration and sustain-
able use of terrestrial
and inland freshwater
ecosystems and their
services, in particu-
lar forests, wetlands,
mountains and dry-
lands, in line with obli-
gations under interna-
tional agreements
15.1.1 Forest area as a proportion
of total land area
Forest area as a proportion of total land area FAO has been collecting and analyzing data on for-
est area since 1946. FRA 2015 contains information
for 234 countries and territories on more than 100
variables related to the extent of forests, their condi-
tions, uses and values for three points in time: 1990,
2000, 2005, 2010 and 2015. All data are provided to
FAO by countries in the form of a country report fol-
lowing a standard format, which includes the original
data and reference sources and descriptions of how
these have been used to estimate the forest area for
different points in time. For the remaining countries
and territories where no information is provided, a
report is prepared by FAO using existing information
and a literature search.

115
Annex 5 Preliminary SDG Indicators -- Metadata Excerpts
ASEAN Statistical Report on Millennium Development Goals 2017
Goals and targets
(from the 2030
Agenda)
Indicators Excerpts from definition Excerpts from data source
15.5 Take urgent and
significant action to
reduce the degradation
of natural habitats, halt
the loss of biodiversity
and, by 2020, protect
and prevent the ex-
tinction of threatened
species
15.5.1 Red List Index The Red List Index measures change in aggregate ex-
tinction risk across groups of species. It is based on gen-
uine changes in the number of species in each category
of extinction risk on The IUCN Red List of Threatened
Species (IUCN 2015) is expressed as changes in an in-
dex ranging from 0 to 1 .
National agencies producing relevant data include
government, non-governmental organisations
(NGOs), and academic institutions working jointly
and separately. Data are gathered from published
and unpublished sources, species experts, scien-
tists, and conservationists through correspondence,
workshops, and electronic fora. Data are submit-
ted by national agencies to IUCN, or are gathered
through initiatives of the Red List Partnership. From
2013–6, the Red List Partnership encompassed:
BirdLife International; Botanic Gardens Conserva-
tion International; Conservation International; Mic-
rosoft; NatureServe; Royal Botanic Gardens, Kew;
Sapienza University of Rome; Texas A&M Univer-
sity; Wildscreen; and Zoological Society of London.
15.a Mobilize and sig-
nificantly increase fi-
nancial resources from
all sources to conserve
and sustainably use
biodiversity and eco-
systems
15.a.1 Official development assis-
tance and public expenditure on
conservation and sustainable use
of biodiversity and ecosystems
The indicator Official development assistance and public
expenditure on conservation and sustainable use of bio-
diversity and ecosystems is defined as Gross disburse-
ments of total ODA from all donors for biodiversity.
The OECD/DAC has been collecting data on official
and private resource flows from 1960 at an aggre-
gate level and 1973 at an activity level through the
Creditor Reporting System (CRS data are consid-
ered complete from 1995 for commitments at an ac-
tivity level and 2002 for disbursements). The biodi-
versity marker was introduced in 2002. The data are
reported by donors according to the same standards
and methodologies (see here: http://www.oecd.org/
dac/stats/methodology.htm). Data are reported on
an annual calendar year basis by statistical report-
ers in national administrations (aid agencies, Minis-
tries of Foreign Affairs or Finance, etc.
15.b Mobilize signifi-
cant resources from
all sources and at all
levels to finance sus-
tainable forest man-
agement and provide
adequate incentives to
developing countries
to advance such man-
agement, including for
conservation and refor-
estation
15.b.1 Official development assis-
tance and public expenditure on
conservation and sustainable use
of biodiversity and ecosystems

116
Annex 5 Preliminary SDG Indicators -- Metadata Excerpts
ASEAN Statistical Report on Millennium Development Goals 2017
Goals and targets
(from the 2030
Agenda)
Indicators Excerpts from definition Excerpts from data source
Goal 16. Promote peaceful and inclusive societies for sustainable development, provide access to justice for all and build effective, accountable and inclusive insti-
tutions at all levels
16.3 Promote the rule
of law at the national
and international lev-
els and ensure equal
access to justice for all
16.3.2 Unsentenced detainees as
a proportion of overall prison pop-
ulation
The total number of persons held in detention who have
not yet been sentenced, as a percentage of the total
number of persons held in detention, on a specified date.
UNODC collects data on prisons through its annu-
al data collection (UN-CTS). The data collection
through the UN-CTS is facilitated by a network of
over 130 national Focal Points appointed by re-
sponsible authorities. Data on unsentenced and
total detainees from the UN-CTS are available for
114 countries. The country coverage can improve if
other sources (research institutions and NGOs) are
included (data for additional 60 countries are avail-
able, bringing the total for the period 2012-2014 to
174 countries).
16.6 Develop effective,
accountable and trans-
parent institutions at all
levels
16.6.1 Primary government expen-
ditures as a proportion of original
approved budget, by sector (or by
budget codes or similar)
Primary government expenditures as a proportion of
original approved budget This indicator measures the
extent to which aggregate budget expenditure outturn
reflects the amount originally approved, as defined in
government budget documentation and fiscal reports.
The coverage is budgetary central government (BCG)
and the time period covered is the last three completed
fiscal years.
The Budget Laws of countries is the usual source of
the approved budget of countries. The end-of-year
fiscal reports (/budget execution reports) are the
sources of the actual spending. This data is typically
obtained from websites of the Ministry of Finance
(MoF) or the national Parliament, or data are collect-
ed through communication with the MoF.
16.9 By 2030, provide
legal identity for all,
including birth regis-
tration
16.9.1 Proportion of children under
5 years of age whose births have
been registered with a civil author-
ity, by age
Proportion of children under 5 years of age whose births
have been registered with a civil authority.
Censuses, household surveys such as MICS and
DHS and national vital registration systems
Goal 17. Strengthen the means of implementation and revitalize the Global Partnership for Sustainable Development
Finance
17.1 Strengthen do-
mestic resource mo-
bilization, including
through international
support to developing
countries, to improve
domestic capacity for
tax and other revenue
collection
17.1.1 Total government revenue
as a proportion of GDP, by source
17.1.2 Proportion of domestic bud-
get funded by domestic taxes

117
Annex 5 Preliminary SDG Indicators -- Metadata Excerpts
ASEAN Statistical Report on Millennium Development Goals 2017
Goals and targets
(from the 2030
Agenda)
Indicators Excerpts from definition Excerpts from data source
Technology
17.6 Enhance North-
South, South-South
and triangular region-
al and international
cooperation on and
access to science,
technology and inno-
vation and enhance
knowledge-sharing on
mutually agreed terms,
including through im-
proved coordination
among existing mech-
anisms, in particular at
the United Nations lev-
el, and through a global
technology facilitation
mechanism
17.6.2 Fixed Internet broadband
subscriptions per 100 inhabitants,
by speed
The indicator fixed Internet broadband subscriptions, by
speed, refers to the number of fixed-broadband subscrip-
tions to the public Internet, split by advertised download
speed. The indicator is currently broken down by the
following subscription speeds: - less than 2 Mbit/s sub-
scriptions, - 2 Mbit/s to less than 10 Mbit/s subscriptions,
Equal to or above 10 Mbit/s subscriptions. Refers to all
fixed -broadband Internet subscriptions with advertised
downstream speeds equal to, or greater than, 10 Mbit/s.
Since data for this indicator are based on admin-
istrative data from operators, no information on in-
dividual subscribers is available and therefore the
data cannot be broken down by any individual char-
acteristics. Data could in theory be broken down by
geoFigureic location and urban/rural, but ITU does
not collect this information.
17.8 Fully operation-
alize the technology
bank and science,
technology and innova-
tion capacity-building
mechanism for least
developed countries by
2017 and enhance the
use of enabling tech-
nology, in particular in-
formation and commu-
nications technology
17.8.1 Proportion of individuals us-
ing the Internet
The indicator proportion of individuals using the Internet
is defined as the proportion of individuals who used the
Internet from any location in the last three months.
Data on individuals using the Internet are collected
through an annual questionnaire that ITU sends to
national statistical offices (NSO). In this question-
naire ITU collects absolute values. The percentages
are calculated a-posteriori. The survey methodology
is verified to ensure that it meets adequate statis-
tical standards. The data are verified to ensure
consistency with previous years’ data and situation
of the country for other related indicators (ICT and
economic). For most developed and an increasing
number of developing countries, percentage of indi-
viduals using the Internet data are based on meth-
odologically sound household surveys conducted
by national statistical agencies. If the NSO has not
collected Internet user statistics, then ITU estimates
the percentage of individuals using the Internet.

118
Annex 5 Preliminary SDG Indicators -- Metadata Excerpts
ASEAN Statistical Report on Millennium Development Goals 2017
Goals and targets
(from the 2030
Agenda)
Indicators Excerpts from definition Excerpts from data source
Systemic issues: Data, monitoring and accountability
17.18 By 2020, en-
hance capacity-build-
ing support to develop-
ing countries, including
for least developed
countries and small
island developing
States, to increase
significantly the avail-
ability of high-quality,
timely and reliable
data disaggregated by
income, gender, age,
race, ethnicity, migra-
tory status, disability,
geoFigureic location
and other characteris-
tics relevant in national
contexts
17.18.3 Number of countries with a
national statistical plan that is fully
funded and under implementation,
by source of funding
The indicator Number of countries with a national statis-
tical plan that is fully funded and under implementation
is based on the annual Status Report on National Strat-
egies for the Development of Statistics (NSDS). In col-
laboration with its partners, PARIS21 reports on country
progress in designing and implementing national statis-
tical plans. The indicator is a count of countries that are
either (i) implementing a strategy, (ii) designing one or
(iii) awaiting adoption of the strategy in the current year.
Data is provided by the National Statistical Offices.
The information is collected annually and verified by
direct email correspondence with the national focal
point for the country’s NSDS (National Strategy for
Development of Statistics).
17.19 By 2030, build
on existing initiatives
to develop measure-
ments of progress on
sustainable develop-
ment that complement
gross domestic prod-
uct, and support statis-
tical capacity-building
in developing countries
17.19.2 Proportion of countries
that (a) have conducted at least
one population and housing cen-
sus in the last 10 years; and (b)
have achieved 100 per cent birth
registration and 80 per cent death
registration
The indicator tracks the proportion of countries that have
conducted at least one population and housing census
in the last 10 years. This also includes countries which
compile their detailed population and housing statistics
from population registers, administrative records, sam-
ple surveys or other sources or a combination of those
sources.
ECOSOC resolution E/RES/2015/10 establishing
the 2020 World Population and Housing Census
Programme requests the Secretary-General to
“monitor and regularly report to the Statistical Com-
mission on the implementation of the Programme”.
In response to this request UNSD regularly monitors
the progress of implementation of population and
housing censuses across Member States.

119
Annex 5 Preliminary SDG Indicators -- Metadata Excerpts
ASEAN Statistical Report on Millennium Development Goals 2017
Table 2. ASEAN SDG Political and Policy Priority Incicators supported by limited Statistical Capacity in a Majority of ASEAN Countries
Sustainable Development Goal indicators should be disaggregated, where relevant, by income, sex, age, race, ethnicity, migratory status, disability and geoFigureic location, or
other characteristics, in accordance with the Fundamental Principles of Official Statistics (General Assembly resolution 68/261).
Goals and targets
(from the 2030
Agenda)
Indicators Excerpts from definition Excerpts from data source
Goal 1. End poverty in all its forms everywhere
1.3 Implement nation-
ally appropriate social
protection systems and
measures for all, includ-
ing floors, and by 2030
achieve substantial
coverage of the poor
and the vulnerable
1.3.1 Proportion of population
covered by social protection
floors/systems, by sex, distin-
guishing children, unemployed
persons, older persons, persons
with disabilities, pregnant women,
newborns, work-injury victims and
the poor and the vulnerable
This indicator reflects the proportion of the population
covered by social protection floors or systems and
includes the component proportion of unemployed
who receive unemployment benefits which is defined
as the number of unemployed persons receiving
unemployment benefits divided by the total number of
unemployment persons times 100.
The administrative data on social security schemes
are often the most current and provide comprehen-
sive information for the numerator of this indicator.
In the absence of reliable administrative records,
data from household surveys (household budget
surveys or labour force surveys) can be used.
Data from a household survey may also be used to
estimate the denominator of the indicator.
1.5 By 2030, build the
resilience of the poor
and those in vulner-
able situations and
reduce their exposure
and vulnerability to
climate-related extreme
events and other
economic, social and
environmental shocks
and disasters
1.5.2 Direct economic loss
attributed to disasters in relation
to global gross domestic product
(GDP)
Direct economic loss: the monetary value of total or
partial destruction of physical assets existing in the af-
fected area. Direct economic loss is nearly equivalent to
physical damage. [a] An open-ended intergovernmental
expert working group on indicators and terminology
relating to disaster risk reduction established by the
General Assembly (resolution 69/284) is developing
a set of indicators to measure global progress in the
implementation of the Sendai Framework. These
indicators will eventually reflect the agreements on the
Sendai Framework indicators.
National disaster loss database, reported to
UNISDR
1.5.3 Number of countries that
adopt and implement national
disaster risk reduction strategies
in line with the Sendai Framework
for Disaster Risk Reduction
2015-2030
An open-ended intergovernmental expert working
group on indicators and terminology relating to disaster
risk reduction established by the General Assembly
(resolution 69/284) is developing a set of indicators to
measure global progress in the implementation of the
Sendai Framework. These indicators will eventually
reflect the agreements on the Sendai Framework
indicators.
National Progress Report of the Sendai Monitor,
reported to UNISDR
1.5.4 Proportion of local govern-
ments that adopt and implement
local disaster risk reduction strat-
egies in line with national disaster
risk reduction strategies

120
Annex 5 Preliminary SDG Indicators -- Metadata Excerpts
ASEAN Statistical Report on Millennium Development Goals 2017
Goals and targets
(from the 2030
Agenda)
Indicators Excerpts from definition Excerpts from data source
1.a Ensure signifi-
cant mobilization of
resources from a variety
of sources, including
through enhanced de-
velopment cooperation,
in order to provide ad-
equate and predictable
means for developing
countries, in particular
least developed coun-
tries, to implement pro-
grammes and policies
to end poverty in all its
dimensions
1.a.2 Proportion of total gov-
ernment spending on essential
services (education, health and
social protection)
Goal 2. End hunger, achieve food security and improved nutrition and promote sustainable agriculture
2.1 By 2030, end
hunger and ensure
access by all people, in
particular the poor and
people in vulnerable
situations, including in-
fants, to safe, nutritious
and sufficient food all
year round
2.1.1 Prevalence of undernour-
ishment
The prevalence of undernourishment (PoU) (French:
pourcentage de sous-alimentation; Spanish: porcentaje
de sub-alimentación; Italian: prevalenza di sotto-al-
imentazione) is an estimate of the proportion of
the population whose habitual food consumption is
insufficient to provide the dietary energy levels that are
required to maintain a normal active and healthy life. It
is expressed as a percentage.
The ideal source of data to estimate the PoU would
be a carefully designed and skilfully conducted
individual dietary intake survey, in which actual
daily food consumption, together with heights
and weights for each surveyed individual, are
repeatedly measured on a sample that is repre-
sentative of the target population. Due to their
cost, however, such surveys are rare.. In principle,
a well-designed household survey that collects
information on food acquisitions might be sufficient
to inform a reliable estimate of the Prevalence of
Undernourishment in a population, at a reasonable
cost and with the necessary periodicity to inform
the SDG monitoring process, provided that the
necessary requirements are fullfilled. Examples of
surveys that could be considered for this purpose
include surveys conducted to compute economic
statistics and conduct poverty assessments, such
as Household Income and Expenditure Surveys,
Household Budget Surveys and Living Standard
Measurement Surveys.
2.1.2 Prevalence of moderate
or severe food insecurity in the
population, based on the Food In-
security Experience Scale (FIES)
The indicator measures the percentage of individuals in
the population who have experienced food insecurity at
moderate or severe levels during the reference period.
The severity of food insecurity, defined as a latent
trait, is measured on the Food Insecurity Experience
Scale global reference scale, a measurement standard
established by FAO through the application of the Food
Insecurity Experience Scale in more than 140 countries
worldwide, starting in 2014.
Data can be collected using the Food Insecurity
Experience Scale survey module (FIES-SM)
developed by FAO, or any other experience-based
food security scale questionnaires. Two versions
of the FIES-SM are available for use in surveys
of individuals or households respectively, and
the difference stands in whether respondents
are asked to report only on their individual expe-
riences, or also on that of other member of the
household. The current FIES-SM module include
eight questions. The FIES-SM can be included in
virtually any telephone-based or personal interview
based survey of the population, though face to face
interview is preferred.

121
Annex 5 Preliminary SDG Indicators -- Metadata Excerpts
ASEAN Statistical Report on Millennium Development Goals 2017
Goals and targets
(from the 2030
Agenda)
Indicators Excerpts from definition Excerpts from data source
2.5 By 2020, maintain
the genetic diversity of
seeds, cultivated plants
and farmed and domes-
ticated animals and their
related wild species, in-
cluding through soundly
managed and diversified
seed and plant banks
at the national, regional
and international levels,
and promote access to
and fair and equitable
sharing of benefits aris-
ing from the utilization of
genetic resources and
associated traditional
knowledge, as interna-
tionally agreed
2.5.1 Number of plant and animal
genetic resources for food and
agriculture secured in either
medium or long-term conservation
facilities
2.5.2 Proportion of local breeds
classified as being at risk, not-at-
risk or at unknown level of risk of
extinction
The indicator presents the percentage of livestock
breeds classified as being at risk, not at risk or of
unknown risk of extinctions at a certain moment in time,
as well as the trends for those percentages.
The Global Databank for Animal Genetic Resourc-
es currently contains data from 182 countries and
38 species. The total number of national breed
populations recorded in the Global Databank has
increased dramatically since 1993 (from 2,716
national breed populations to 14,915 and from 131
countries to 182). The total number of mammalian
national breed populations recorded in February
2016 was 11,116. The total number of avian
national breed populations recorded in 2016 was
3,799. List: Global Databank for Animal Genetic
Resources
2.a Increase investment,
including through
enhanced interna-
tional cooperation, in
rural infrastructure,
agricultural research
and extension services,
technology development
and plant and livestock
gene banks in order to
enhance agricultural
productive capacity in
developing countries, in
particular least devel-
oped countries
2.a.1 The agriculture orientation
index for government expendi-
tures
The Agriculture Orientation Index (AOI) for Government
Expenditures is defined as the Agriculture Share of
Government Expenditures, divided by the Agriculture
Share of GDP, where Agriculture refers to the agricul-
ture, forestry, fishing and hunting sector. The measure
in a currency-free index, calculated as the ratio of these
two shares. National governments are requested to
compile Government Expenditures according to the
international Classification of Functions of Government
(COFOC), and Agriculture Share of GDP according to
the System of National Accounts (SNA).
Data on government expenditures is collected
from countries using an annual questionnaire
administered by FAO. Since countries typically
compile government expenditure data based on
their financial systems, and is administrative data
covering the entirely of government expenditures,
particularly at the central government level, there
is no sampling issue and no possibility of sampling
error. For some countries that do not report such
data to FAO, data may be obtained from the IMF
(which collects similar data but covering more
sectors, and with less disaggregation of ISIC Rev
4 Division A) or from official national governmental
websites.
2.a.2 Total official flows (official
development assistance plus
other official flows) to the agricul-
ture sector
Total official flows (official development assistance plus
other official flows) to the agriculture sector is defined
as Gross disbursements of total ODA and other official
flows from all donors to the agriculture sector.
The OECD/DAC has been collecting data on offi-
cial and private resource flows from 1960 at an ag-
gregate level and 1973 at an activity level through
the Creditor Reporting System (CRS data are
considered complete from 1995 for commitments
at an activity level and 2002 for disbursements).
The data are reported by donors according to the
same standards and methodologies (see here:
http://www.oecd.org/dac/stats/methodology.htm).
Data are reported on an annual calendar year
basis by statistical reporters in national administra-
tions (aid agencies, Ministries of Foreign Affairs or
Finance, etc.

122
Annex 5 Preliminary SDG Indicators -- Metadata Excerpts
ASEAN Statistical Report on Millennium Development Goals 2017
Goals and targets
(from the 2030
Agenda)
Indicators Excerpts from definition Excerpts from data source
2.b Correct and prevent
trade restrictions and
distortions in world
agricultural markets,
including through the
parallel elimination of
all forms of agricultural
export subsidies and
all export measures
with equivalent effect,
in accordance with the
mandate of the Doha
Development Round
2.b.1 Agricultural export subsidies Producer Support Estimate (PSE): The annual
monetary value of gross transfers from consumers and
taxpayers to agricultural producers, measured at the
farm-gate level, arising from policy measures that sup-
port agriculture, regardless of their nature, objectives or
impacts on farm production or income. Percentage PSE
(%PSE): PSE as a share of gross farm receipts (includ-
ing support). Agricultural export subsidies are defined
as export subsidies budgetary outlays and quantities as
notified by WTO Members in Tables ES:1 and support-
ing Tables ES:2 (following templates in document G/
AG/2 dated 30 June 1995). Data cover: • Notifications
by WTO Members with export subsidy reduction
commitments included in part IV of their Schedules; •
Notifications of export subsidies by developing country
Members pursuant to the provisions of article 9.4 of the
Agreement on Agriculture.
Annual data; original data is collected by the
OECD secretariat in collaboration with capitals.
Goal 3. Ensure healthy lives and promote well-being for all at all ages
3.3 By 2030, end the
epidemics of AIDS,
tuberculosis, malaria
and neglected tropical
diseases and combat
hepatitis, water-borne
diseases and other
communicable diseases
3.3.1 Number of new HIV
infections per 1,000 uninfected
population, by sex, age and key
populations
The number of new HIV infections per 1,000 uninfected
population, by sex, age and key populations as defined
as the number of new HIV infections per 1000 per-
son-years among the uninfected population.
Spectrum modelling, household or key population
surveys with HIV incidence-testing, Other possible
data sources: Regular surveillance system among
key populations.
3.3.4 Hepatitis B incidence per
100,000 population
3.3.5 Number of people requiring
interventions against neglected
tropical diseases
Number of people requiring treatment and care for any
one of the neglected tropical diseases (NTDs) targeted
by the WHO NTD Roadmap and World Health Assem-
bly resolutions and reported to WHO.
The number of people requiring treatment and care
for NTDs is measured by existing country systems,
and reported through joint request and reporting
forms for donated medicines, the integrated NTD
database, and other reports to WHO. http://www.
who.int/neglected_diseases/preventive_chemo-
therapy/reporting/en/ http://www.who.int/neglect-
ed_diseases/data/ntddatabase/en/
3.4 By 2030, reduce
by one third premature
mortality from non-com-
municable diseases
through prevention and
treatment and promote
mental health and
well-being
3.4.1 Mortality rate attributed to
cardiovascular disease, cancer,
diabetes or chronic respiratory
disease
Mortality rate attributed to cardiovascular disease, can-
cer, diabetes or chronic respiratory disease. Probability
of dying between the ages of 30 and 70 years from
cardiovascular diseases, cancer, diabetes or chronic re-
spiratory diseases, defined as the per cent of 30-year-
old-people who would die before their 70th birthday
from cardiovascular disease, cancer, diabetes, or
chronic respiratory disease, assuming that s/he would
experience current mortality rates at every age and s/
he would not die from any other cause of death (e.g.,
injuries or HIV/AIDS). This indicator is calculated using
life table methods (see further details in section 3.3).
The preferred data source is death registration sys-
tems with complete coverage and medical certifica-
tion of cause of death. Other possible data sources
include household surveys with verbal autopsy,
and sample or sentinel registration systems.

123
Annex 5 Preliminary SDG Indicators -- Metadata Excerpts
ASEAN Statistical Report on Millennium Development Goals 2017
Goals and targets
(from the 2030
Agenda)
Indicators Excerpts from definition Excerpts from data source
3.5 Strengthen the pre-
vention and treatment
of substance abuse,
including narcotic drug
abuse and harmful use
of alcohol
3.5.2 Harmful use of alcohol,
defined according to the national
context as alcohol per capita
consumption (aged 15 years and
older) within a calendar year in
litres of pure alcohol
Harmful use of alcohol, defined according to the nation-
al context as alcohol per capita consumption (aged 15
years and older) within a calendar year in litres of pure
alcohol Total alcohol per capita consumption (APC) is
defined as the total (sum of recorded APC three-year
average and unrecorded APC) amount of alcohol
consumed per adult (15+ years) over a calendar year,
in litres of pure alcohol. Recorded alcohol consumption
refers to official statistics at country level (production,
import, export, and sales or taxation data), while the
unrecorded alcohol consumption refers to alcohol which
is not taxed and is outside the usual system of govern-
mental control, such as home or informally produced
alcohol (legal or illegal), smuggled alcohol, surrogate
alcohol (which is alcohol not intended for human
consumption), or alcohol obtained through cross-border
shopping (which is recorded in a different jurisdiction).
Recorded: Government statistics or, alternatively,
alcohol industry statistics in the public domain,
FAOSTAT; Unrecorded: Nationally representative
empirical data or, alternatively, specific empirical
investigations, expert opinion.
3.9 By 2030, substan-
tially reduce the number
of deaths and illnesses
from hazardous
chemicals and air, water
and soil pollution and
contamination
3.9.1 Mortality rate attributed
to household and ambient air
pollution
The mortality attributable to the joint effects of
household and ambient air pollution can be expressed
as: Number of deaths, Death rate. Death rates are
calculated by dividing the number of deaths by the total
population (or indicated if a different population group
is used, e.g. children under 5 years). Evidence from
epidemiological studies have shown that exposure to
air pollution is linked, among others, to the important
diseases taken into account in this estimate: - Acute re-
spiratory infections in young children (estimated under
5 years of age); - Cerebro-vascular diseases (stroke)
in adults (estimated above 25 years); - Ischaemic heart
diseases (IHD) in adults (estimated above 25 years);
- Chronic obstructive pulmonary disease (COPD) in
adults (estimated above 25 years); and - Lung cancer
in adults (estimated above 25 years).
Exposure: Indicator 7.1.2 was used as exposure
indicator for household air pollution. Annual mean
concentration of particulate matter of less than 2.5
um was used as exposure indicator for ambient air
pollution. The data is modelled according to meth-
ods described for Indicator 11.6.2. Exposure-risk
function: The integrated exposure-response func-
tions (IER) developed for the GBD 2010 (Burnett
et al, 2014) and further updated for the GBD 2013
study (Forouzanfar et al, 2015) were used. Health
data: The total number of deaths by disease,
country, sex and age group have been developed
by the World Health Organization (WHO 2014b).
3.9.2 Mortality rate attributed to
unsafe water, unsafe sanitation
and lack of hygiene (exposure
to unsafe Water, Sanitation and
Hygiene for All (WASH) services)
The mortality rate attributed to unsafe water, unsafe
sanitation and lack of hygiene (exposure to unsafe
Water, Sanitation and Hygiene for All (WASH) services)
as defined as the number of deaths from unsafe water,
unsafe sanitation and lack of hygiene (exposure to
unsafe WASH services) in a year, divided by the popu-
lation, and multiplied by 100,000.
Data is compiled mainly from country and other
databases directly. To maximize the data for robust
estimates, as well as to reduce duplication of data
collection to avoid further data reporting burden
on countries, complementary data are used from
various databases.
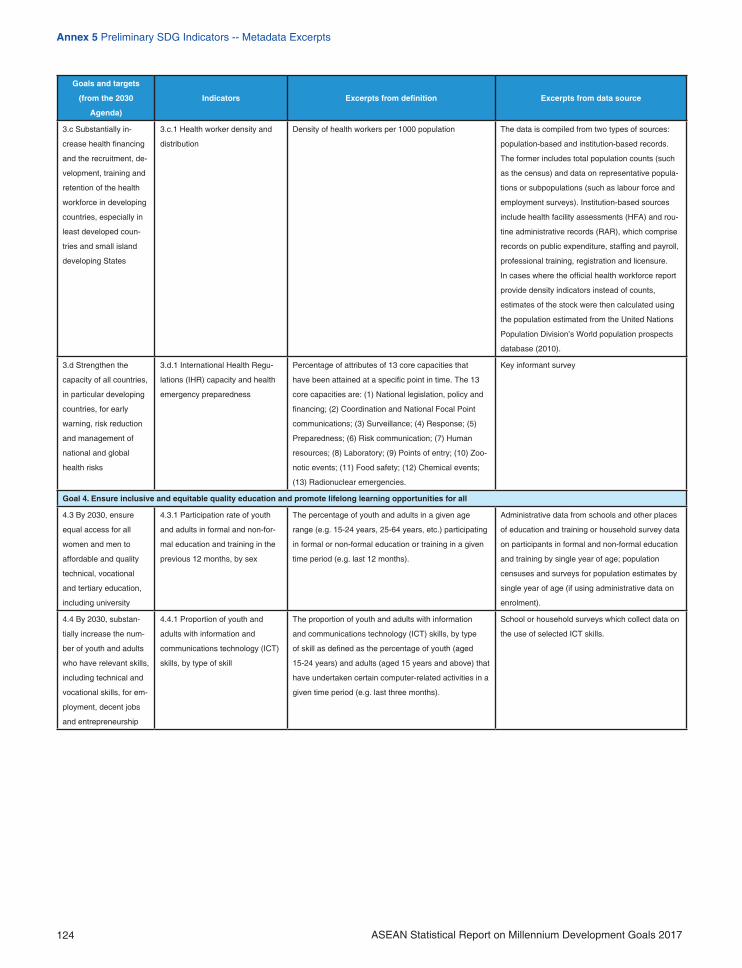
124
Annex 5 Preliminary SDG Indicators -- Metadata Excerpts
ASEAN Statistical Report on Millennium Development Goals 2017
Goals and targets
(from the 2030
Agenda)
Indicators Excerpts from definition Excerpts from data source
3.c Substantially in-
crease health financing
and the recruitment, de-
velopment, training and
retention of the health
workforce in developing
countries, especially in
least developed coun-
tries and small island
developing States
3.c.1 Health worker density and
distribution
Density of health workers per 1000 population The data is compiled from two types of sources:
population-based and institution-based records.
The former includes total population counts (such
as the census) and data on representative popula-
tions or subpopulations (such as labour force and
employment surveys). Institution-based sources
include health facility assessments (HFA) and rou-
tine administrative records (RAR), which comprise
records on public expenditure, staffing and payroll,
professional training, registration and licensure.
In cases where the official health workforce report
provide density indicators instead of counts,
estimates of the stock were then calculated using
the population estimated from the United Nations
Population Division’s World population prospects
database (2010).
3.d Strengthen the
capacity of all countries,
in particular developing
countries, for early
warning, risk reduction
and management of
national and global
health risks
3.d.1 International Health Regu-
lations (IHR) capacity and health
emergency preparedness
Percentage of attributes of 13 core capacities that
have been attained at a specific point in time. The 13
core capacities are: (1) National legislation, policy and
financing; (2) Coordination and National Focal Point
communications; (3) Surveillance; (4) Response; (5)
Preparedness; (6) Risk communication; (7) Human
resources; (8) Laboratory; (9) Points of entry; (10) Zoo-
notic events; (11) Food safety; (12) Chemical events;
(13) Radionuclear emergencies.
Key informant survey
Goal 4. Ensure inclusive and equitable quality education and promote lifelong learning opportunities for all
4.3 By 2030, ensure
equal access for all
women and men to
affordable and quality
technical, vocational
and tertiary education,
including university
4.3.1 Participation rate of youth
and adults in formal and non-for-
mal education and training in the
previous 12 months, by sex
The percentage of youth and adults in a given age
range (e.g. 15-24 years, 25-64 years, etc.) participating
in formal or non-formal education or training in a given
time period (e.g. last 12 months).
Administrative data from schools and other places
of education and training or household survey data
on participants in formal and non-formal education
and training by single year of age; population
censuses and surveys for population estimates by
single year of age (if using administrative data on
enrolment).
4.4 By 2030, substan-
tially increase the num-
ber of youth and adults
who have relevant skills,
including technical and
vocational skills, for em-
ployment, decent jobs
and entrepreneurship
4.4.1 Proportion of youth and
adults with information and
communications technology (ICT)
skills, by type of skill
The proportion of youth and adults with information
and communications technology (ICT) skills, by type
of skill as defined as the percentage of youth (aged
15-24 years) and adults (aged 15 years and above) that
have undertaken certain computer-related activities in a
given time period (e.g. last three months).
School or household surveys which collect data on
the use of selected ICT skills.

125
Annex 5 Preliminary SDG Indicators -- Metadata Excerpts
ASEAN Statistical Report on Millennium Development Goals 2017
Goals and targets
(from the 2030
Agenda)
Indicators Excerpts from definition Excerpts from data source
Goal 5. Achieve gender equality and empower all women and girls
5.2 Eliminate all forms
of violence against all
women and girls in
the public and private
spheres, including
trafficking and sexual
and other types of
exploitation
5.2.1 Proportion of ever-partnered
women and girls aged 15 years
and older subjected to physical,
sexual or psychological violence
by a current or former intimate
partner in the previous 12 months,
by form of violence and by age
5.2.2 Proportion of women and
girls aged 15 years and older
subjected to sexual violence by
persons other than an intimate
partner in the previous 12 months,
by age and place of occurrence
5.4 Recognize and
value unpaid care and
domestic work through
the provision of public
services, infrastructure
and social protec-
tion policies and the
promotion of shared
responsibility within
the household and the
family as nationally
appropriate
5.4.1 Proportion of time spent on
unpaid domestic and care work,
by sex, age and location
Time spent on unpaid domestic and care work refers to
the average time women and men spend on household
provision of services for own consumption. Domestic
and care work includes food preparation, dishwashing,
cleaning and upkeep of a dwelling, laundry, ironing,
gardening, caring for pets, shopping, installation,
servicing and repair of personal and household goods,
childcare, and care of the sick, elderly or disabled
household members, among others. Time spent on un-
paid domestic and care work as well as on community
or volunteer work constitutes the overall time spent on
“unpaid work”. Activities included in unpaid work are not
included within the SNA production boundary but are
part of the SNA General Production Boundary.
Data on time use are collected through dedicated
time use surveys or from time-use modules
integrated in multi-purpose household surveys,
conducted at national level. Data on time-use can
be collected through a 24-hour diary (light diary) or
stylized questionnaire. With diaries, respondents
are asked to report on what activity they were
performing when they started the day, what activity
followed, and the time that activity began and
ended, and so forth through the 24 hours of the
day. Stylized time-use questions ask respondents
to recall the amount of time they allocated to a
certain activity over a specified period, such as a
day or week. Often, stylized time-use questions are
attached as a module to a multipurpose household
survey. The 24-hour diary method yields better
results than the stylized method but is a more
expensive mode of data collection.
5.6 Ensure universal
access to sexual and
reproductive health and
reproductive rights as
agreed in accordance
with the Programme of
Action of the Internation-
al Conference on Popu-
lation and Development
and the Beijing Platform
for Action and the
outcome documents of
their review conferences
5.6.1 Proportion of women aged
15-49 years who make their own
informed decisions regarding sex-
ual relations, contraceptive use
and reproductive health care

126
Annex 5 Preliminary SDG Indicators -- Metadata Excerpts
ASEAN Statistical Report on Millennium Development Goals 2017
Goals and targets
(from the 2030
Agenda)
Indicators Excerpts from definition Excerpts from data source
Goal 6. Ensure availability and sustainable management of water and sanitation for all
6.5 By 2030, implement
integrated water
resources management
at all levels, including
through transbound-
ary cooperation as
appropriate
6.5.1 Degree of integrated water
resources management imple-
mentation (0-100)
The indicator degree of implementation of Integrated
Water Resources Management (IWRM), measured in
per cent (%) from 0 (implementation not yet started) to
100 (fully implemented) is currently being measured in
terms of different stages of development and implemen-
tation of Integrated Water Resources Management
(IWRM).
Monitoring progress on meeting SDG 6.5 is
owned by and is the responsibility of the national
government. The government will assign a ministry
with the primary responsibility for overseeing
this survey, which will be asked to take on the
responsibility of coordinating the national IWRM
monitoring and reporting process. As water issues,
and water management issues in particular, cut
across a wide number of sectors, often overseen
by different ministries and other administrative
bodies at national or other levels, the process
should be inclusive. Major stakeholders should be
involved in order to contribute to well informed and
objective answers to the questionnaire. The UN will
provide support where needed and possible.
6.a By 2030, expand in-
ternational cooperation
and capacity-building
support to developing
countries in water- and
sanitation-related activ-
ities and programmes,
including water harvest-
ing, desalination, water
efficiency, wastewater
treatment, recycling and
reuse technologies
6.a.1 Amount of water- and sani-
tation-related official development
assistance that is part of a govern-
ment-coordinated spending plan
Amount of water- and sanitation-related official devel-
opment assistance that is part of a government-coor-
dinated spending plan is defined as the proportion of
total water and sanitation-related Official Development
Assistance (ODA) disbursements that are included in
the government budget.
The UN-Water Global Analysis and Assessment of
Sanitation and Drinking-Water (GLAAS) provides
information on governance, monitoring, human
resources, and financing in the water, sanitation,
and hygiene (WASH) sector. The scope of the
question on external funding has been expanded
beyond WASH for the 2016-17 GLAAS cycle
to include wastewater and water quality, water
efficiency, water resource management, and
the status of water-related ecosystems. National
governments participating in the GLAAS survey
fill out the questionnaire, preferably supported by
a multi-stakeholder review. Although one ministry
leads the process, it is often the case that many
different ministries and departments must be
involved in the process in order to obtain the data
required to complete the questionnaire.
Goal 7. Ensure access to affordable, reliable, sustainable and modern energy for all
7.1 By 2030, ensure
universal access to
affordable, reliable and
modern energy services
7.1.2 Proportion of population with
primary reliance on clean fuels
and technology
Proportion of population with primary reliance on clean
fuels and technology is calculated as the number of
people using clean fuels and technologies for cooking,
heating and lighting divided by total population report-
ing that any cooking, heating or lighting, expressed as
percentage. “Clean” is defined by the emission rate
targets and specific fuel recommendations (i.e. against
unprocessed coal and kerosene) included in the nor-
mative guidance WHO guidelines for indoor air quality:
household fuel combustion.
Primary household fuels and technologies,
particularly for cooking, is routinely collected at the
national levels in most countries using censuses
and surveys. Household surveys used include:
United States Agency for International Develop-
ment (USAID)-supported DemoFigureic and Health
Surveys (DHS); United Nations Children’s Fund
(UNICEF)-supported Multiple Indicator Cluster
Surveys (MICS); WHO-supported World Health
Surveys (WHS); and other reliable and nationally
representative country surveys.

127
Annex 5 Preliminary SDG Indicators -- Metadata Excerpts
ASEAN Statistical Report on Millennium Development Goals 2017
Goals and targets
(from the 2030
Agenda)
Indicators Excerpts from definition Excerpts from data source
Goal 8. Promote sustained, inclusive and sustainable economic growth, full and productive employment and decent work for all
8.4 Improve progres-
sively, through 2030,
global resource effi-
ciency in consumption
and production and
endeavour to decouple
economic growth from
environmental degrada-
tion, in accordance with
the 10-Year Framework
of Programmes on Sus-
tainable Consumption
and Production, with
developed countries
taking the lead
8.4.2 Domestic material consump-
tion, domestic material consump-
tion per capita, and domestic
material consumption per GDP
Domestic Material Consumption (DMC) is a standard
material flow accounting (MFA) indicator and reports
the apparent consumption of materials in a national
economy.
The global material flows database is based on
country material flow accounts from the European
Union and Japan and estimated data for the rest
of the world. Estimated data is produced on the
bases of data available from different national or
international datasets in the domain of agriculture,
forestry, fisheries, mining and energy statistics.
International statistical sources for DMC and MF
include the IEA, USGS, FAO and COMTRADE
databases
8.5 By 2030, achieve
full and productive
employment and decent
work for all women and
men, including for young
people and persons with
disabilities, and equal
pay for work of equal
value
8.5.1 Average hourly earnings of
female and male employees, by
occupation, age and persons with
disabilities
8.7 Take immediate and
effective measures to
eradicate forced labour,
end modern slavery and
human trafficking and
secure the prohibition
and elimination of
the worst forms of
child labour, including
recruitment and use of
child soldiers, and by
2025 end child labour in
all its forms
8.7.1 Proportion and number of
children aged 5-17 years engaged
in child labour, by sex and age
Proportion (and number) of children aged 5-17 years
engaged in child labour is the number of children aged
5-17 years who are reported to have been engaged
in child labour in the past week divided by the total
number of children aged 5-17 in the population
Household surveys such as UNICEF-support-
ed Multiple Indicator Cluster Survey (MICS),
DemoFigureic and Health Survey (DHS) and
ILO-supported Statistical Information and Monitor-
ing Programme on Child Labour (SIMPOC) have
been collecting data on this indicator in low- and
middle-income countries since around 2000. Many
countries also produce national labour estimates
and reports that often include data on child labour
and/or employment among children.
8.8 Protect labour rights
and promote safe and
secure working environ-
ments for all workers,
including migrant work-
ers, in particular women
migrants, and those in
precarious employment
8.8.1 Frequency rates of fatal and
non-fatal occupational injuries, by
sex and migrant status
The frequency rates of fatal and non-fatal occupational
injuries provide information on the number of cases of
fatal and non-fatal occupational injury per hours worked
by the concerned population during the reference
period. It is a measure of the risk of having a fatal or a
non-fatal occupational injury based on the duration of
exposure to adverse work-related factors.
The recommended data sources are different
types of administrative records, such as records of
national systems for the notification of occupational
injuries (labour inspection records and annual
reports; insurance and compensation records,
death registers), supplemented by household
surveys (especially in order to cover informal
sector enterprises and the self-employed) and/or
establishment surveys.

128
Annex 5 Preliminary SDG Indicators -- Metadata Excerpts
ASEAN Statistical Report on Millennium Development Goals 2017
Goals and targets
(from the 2030
Agenda)
Indicators Excerpts from definition Excerpts from data source
8.9 By 2030, devise
and implement policies
to promote sustainable
tourism that creates
jobs and promotes local
culture and products
8.9.1 Tourism direct GDP as a
proportion of total GDP and in
growth rate
8.9.2 Proportion of jobs in sustain-
able tourism industries out of total
tourism jobs
Goal 9. Build resilient infrastructure, promote inclusive and sustainable industrialization and foster innovation
9.4 By 2030, upgrade
infrastructure and retrofit
industries to make them
sustainable, with
increased resource-use
efficiency and greater
adoption of clean and
environmentally sound
technologies and indus-
trial processes, with all
countries taking action
in accordance with their
respective capabilities
9.4.1 CO2 emission per unit of
value added
Carbon dioxide (CO2) emission per unit of value added
is a ratio indicator between carbon dioxide emissions
and value added. The indicator CO2 emission per unit
of value added is currently being measured by CO2
emission per GDP PPP.
Energy consumption and value added data are
available for more than 150 countries from UNIDO
database and UNSD energy database as well
as International Energy Agency (IEA) database.
Emission data are directly reported by NSOs in
many cases.
9.5 Enhance scientific
research, upgrade
the technological
capabilities of industrial
sectors in all countries,
in particular developing
countries, including,
by 2030, encouraging
innovation and sub-
stantially increasing the
number of research and
development workers
per 1 million people
and public and private
research and develop-
ment spending
9.5.1 Research and development
expenditure as a proportion of
GDP
Research and development (R&D) expenditure as a
proportion of Gross Domestic Product (GDP) is the
amount of R&D expenditure divided by the total output
of the economy.
Data are collected through national Research and
development (R&D) surveys, either by the national
statistical office or a line ministry (such as the
Ministry for Science and Technology).
9.5.2 Researchers (in full-time
equivalent) per million inhabitants
The researchers (in full-time equivalent) per million in-
habitants is a direct measure of the number of research
and development workers per 1 million people
Data are collected through national R&D surveys,
either by the national statistical office or a line
ministry (such as the Ministry for Science and
Technology).
9.a Facilitate sustain-
able and resilient infra-
structure development
in developing countries
through enhanced
financial, technological
and technical support to
African countries, least
developed countries,
landlocked developing
countries and small
island developing States
9.a.1 Total official international
support (official development as-
sistance plus other official flows)
to infrastructure
Total official international support (official development
assistance plus other official flows) to infrastructure is
the gross disbursements of total Official Development
Assistance (ODA) and other official flows (OOF) from
all donors in support of infrastructure.
The OECD/DAC has been collecting data on offi-
cial and private resource flows from 1960 at an ag-
gregate level and 1973 at an activity level through
the Creditor Reporting System (CRS data are con-
sidered complete from 1995 for commitments at
an activity level and 2002 for disbursements). The
data are reported by donors according to the same
standards and methodologies. Data are reported
on an annual calendar year basis by statistical
reporters in national administrations (aid agencies,
Ministries of Foreign Affairs or Finance, etc.

129
Annex 5 Preliminary SDG Indicators -- Metadata Excerpts
ASEAN Statistical Report on Millennium Development Goals 2017
Goals and targets
(from the 2030
Agenda)
Indicators Excerpts from definition Excerpts from data source
9.b Support domestic
technology develop-
ment, research and
innovation in developing
countries, including by
ensuring a conducive
policy environment for,
inter alia, industrial
diversification and value
addition to commodities
9.b.1 Proportion of medium and
high-tech industry value added in
total value added
Proportion of medium and high-tech industry value add-
ed in total value added shows the level of technological
intensity of manufacturing in an economy. It is based
on classification of industry into high, high-medium,
low-medium and low technology sectors. Designation
of an industry to high or medium level of technology
is determined by Research and Development (R&D)
intake in manufacturing value added. Ahigher the share
of R&D expenditure means a higher level of technolog-
ical intensity.
Data are obtained from NSOs collected by them
through annual industrial surveys
Goal 10. Reduce inequality within and among countries
10.4 Adopt policies,
especially fiscal, wage
and social protection
policies, and progres-
sively achieve greater
equality
10.4.1 Labour share of GDP,
comprising wages and social
protection transfers
Labour share of Gross Domestic Product (GDP) is the
total compensation of employees given as a percent
of GDP, which is a measure of total output. It provides
information about the relative share of output which is
paid as compensation to employees as compared with
the share paid to capital in the production process for a
given reference period.
The recommended primary data sources for this in-
dicator are the national accounts estimates of GDP
and compensation of employees. The periodicity
of this indicator will hence depend on the national
accounts data produced in the given country
10.6 Ensure enhanced
representation and
voice for developing
countries in deci-
sion-making in global
international economic
and financial institutions
in order to deliver more
effective, credible, ac-
countable and legitimate
institutions
10.6.1 Proportion of members and
voting rights of developing coun-
tries in international organizations
The proportion of members and voting rights of
developing countries in international organizations has
two components, the developing country proportion
of voting rights and the developing country proportion
of membership in international organisations. In some
institutions these two components are identical.
Annual reports, as presented on the website of the
institution in question, are used as sources of data.
Sources of information by institution
10.a Implement the
principle of special and
differential treatment for
developing countries,
in particular least
developed countries, in
accordance with World
Trade Organization
agreements
10.a.1 Proportion of tariff lines
applied to imports from least de-
veloped countries and developing
countries with zero-tariff
Proportion of total number of tariff lines (in per cent)
applied to products imported from least developed
countries and developing countries corresponding to a
0% tariff rate in HS chapter 01-97.
The main information used to calculate indicators
10.a.1 is import tariff data. Information on import
tariffs might be retrieved by contacting directly
National statistical offices, permanent country
missions to the UN, regional organizations or focal
points within the customs, ministries in charge of
customs revenues (Ministry of economy/finance
and related revenue authorities) or, alternatively,
the Ministry of trade. When available, data are
downloaded from national or regional official
websites. In some cases, data are purchased from
private companies. Import tariff data included in the
WTO (IDB) database are sourced from official no-
tifications of WTO members. Import tariff included
in the UNCTAD (TRAINS) database are collected
from official sources, including official country or
regional organizations websites

130
Annex 5 Preliminary SDG Indicators -- Metadata Excerpts
ASEAN Statistical Report on Millennium Development Goals 2017
Goals and targets
(from the 2030
Agenda)
Indicators Excerpts from definition Excerpts from data source
10.b Encourage official
development assistance
and financial flows,
including foreign direct
investment, to States
where the need is
greatest, in particular
least developed coun-
tries, African countries,
small island developing
States and landlocked
developing countries,
in accordance with
their national plans and
programmes
10.b.1 Total resource flows for
development, by recipient and
donor countries and type of flow
(e.g. official development assis-
tance, foreign direct investment
and other flows)
Total resource flows for development, by recipient and
donor countries and type of flow comprises of Official
Development Assistance (ODA), other official flows
(OOF) and private flows.
The OECD Development Assistance Committee
(DAC) has been collecting data on official and
private resource flows from 1960 at an aggregate
level. The data are reported by donors according to
the same standards and methodologies (see here:
http://www.oecd.org/dac/stats/methodology.htm).
Data are reported on an annual calendar year
basis by statistical reporters in national administra-
tions (aid agencies, Ministries of Foreign Affairs or
Finance, etc.
Goal 11. Make cities and human settlements inclusive, safe, resilient and sustainable
11.1 By 2030, ensure
access for all to
adequate, safe and
affordable housing
and basic services and
upgrade slums
11.1.1 Proportion of urban
population living in slums, informal
settlements or inadequate housing
Methodology – This indicator integrates the compo-
nent of the population living in slums that has been
monitored for the last 15 years by UN-Habitat in
mostly developing countries with two new components
– people living in inadequate housing and informal
settlements - that aim at broadening the spectrum of
inadequate living conditions to capture realities also
present in more developed countries and wealthier
urban contexts. By integrating these three components,
the indicator is now universal and can be monitored in
both developing and developed regions. This indicator
will focus on documenting the limitations manifested in
realizing the right to adequate housing for all as mea-
sured through the proportion of the population that live
in slums, informal settlements or inadequate housing.
The below definitions and concepts are important for
reporting on this indicator.
Data for the slum and informal settlement com-
ponents of the indicator can be computed from
Census and national household surveys, including
DHS and MICS. Data for the inadequate housing
component can be computed by using income
and expenditure household surveys that capture
household expenditures. UN-Habitat will continue
to provide technical support on the estimation of
this indicator and its recent integration of spatial
and risk analysis and the disaggregation of the
information at city level will be further expanded for
this indicator. So far, UN-Habitat collects informa-
tion related to slums and improved shelter as part
of the City Prosperity Initiative (CPI) including sev-
eral other related indicators, such as: i) improved
shelter; ii) access to improved water; iii) access to
improved sanitation; and iv) overcrowding. Data
is being collected for nearly 1000 cities around
the world.
11.2 By 2030, provide
access to safe, afford-
able, accessible and
sustainable transport
systems for all, improv-
ing road safety, notably
by expanding public
transport, with special
attention to the needs of
those in vulnerable situ-
ations, women, children,
persons with disabilities
and older persons
11.2.1 Proportion of population
that has convenient access to
public transport, by sex, age and
persons with disabilities
This indicator will be monitored by the proportion of
the population that has convenient access to public
transport. The access to public transport is considered
convenient when an officially recognized stop is
accessible within a distance of 0.5 km from a reference
point such as a home, school, work place, market,
etc. Additional criteria for defining public transport that
is convenient include: a. Public transport accessible
to all special-needs customers, including those who
are physically, visually, and/or hearing-impaired, as
well as those with temporary disabilities, the elderly,
children and other people in vulnerable situations. b.
Public transport with frequent service during peak travel
times c. Stops present a safe and comfortable station
environment
The actual and recommended data sources for this
indicator are the following: - Data on location of
public transport stops in city: city administration or
service providers, GIS data - Dwelling units within
500m of public transport stops: Census, GIS data
- Number of residents per dwellings unit: Census/
household survey - Household surveys that collect
information on the proportion of households that
declare they have access to public means of
transport within 0.5 km. These surveys can also
collect information about the quality of the service.
Due to its spatial nature, the use of the urban ag-
glomeration is a precondition for the measurement
and comparability of this indicator.

131
Annex 5 Preliminary SDG Indicators -- Metadata Excerpts
ASEAN Statistical Report on Millennium Development Goals 2017
Goals and targets
(from the 2030
Agenda)
Indicators Excerpts from definition Excerpts from data source
11.3 By 2030, enhance
inclusive and sus-
tainable urbanization
and capacity for
participatory, integrated
and sustainable human
settlement planning
and management in all
countries
11.3.1 Ratio of land consumption
rate to population growth rate
The indicator is defined as the ratio of land consump-
tion rate to population growth rate. Computing the pop-
ulation growth rate is more straightforward and more
readily available, while land consumption rate is slightly
challenging, and requires the use of new techniques.
In estimating the land consumption rate, one needs
to define what constitutes “consumption” of land since
this may cover aspects of “consumed” or “preserved”
or available for “development” for cases such as land
occupied by wetlands. Secondly, there is not one
unequivocal measure of whether land that is being
developed is truly “newly-developed” (or vacant) land,
or if it is at least partially “redeveloped”. As a result, the
percentage of current total urban land that was newly
developed (consumed) will be used as a measure of
the land consumption rate. The fully developed area is
also sometimes referred to as built up area.
Data for this indicator is available for all cities and
countries (UN DESA population data) and satellite
images from open sources. Several sources of
information are required for this computation:
Satellite imagery from open sources or the exact
measurements in km squared of the built up areas
or the land that is fully developed in Km squared,
annual urban population data for the reference
years of analysis. Data for the size of the city
land that is currently considered as developed is
usually available from the urban planning units of
the cities. New options using remote sensing tech-
niques have also been developed to estimate the
land that is currently developed or considered as
built up areas out of the total city land. This option
also accurately extracts land that is considered as
wetlands and hence unlikely to be occupied now or
in the future. When the spatial measurement option
is used, the use of the urban agglomeration (built-
up area) is a precondition for the measurement
and comparability of this indicator. Data for this
indicator can be easily availed using global and
local sources.
11.5 By 2030,
significantly reduce
the number of deaths
and the number of
people affected and
substantially decrease
the direct economic
losses relative to global
gross domestic product
caused by disasters,
including water-related
disasters, with a focus
on protecting the poor
and people in vulnerable
situations
11.5.1 Number of deaths, missing
persons and directly affected
persons attributed to disasters per
100,000 population
Death: The number of people who died during the
disaster, or directly after, as a direct result of the haz-
ardous event. Missing: The number of people whose
whereabouts is unknown since the hazardous event. It
includes people who are presumed dead although there
is no physical evidence. The data on number of deaths
and number of missing are mutually exclusive. Affected:
People who are affected, either directly or indirectly, by
a hazardous event. Directly affected: People who have
suffered injury, illness or other health effects; who were
evacuated, displaced, relocated or have suffered direct
damage to their livelihoods, economic, physical, social,
cultural and environmental assets.
National disaster loss database, reported to
UNISDR

132
Annex 5 Preliminary SDG Indicators -- Metadata Excerpts
ASEAN Statistical Report on Millennium Development Goals 2017
Goals and targets
(from the 2030
Agenda)
Indicators Excerpts from definition Excerpts from data source
11.5 By 2030,
significantly reduce
the number of deaths
and the number of
people affected and
substantially decrease
the direct economic
losses relative to global
gross domestic product
caused by disasters,
including water-related
disasters, with a focus
on protecting the poor
and people in vulnerable
situations
11.5.2 Direct economic loss in
relation to global GDP, damage to
critical infrastructure and number
of disruptions to basic services,
attributed to disasters
Direct economic loss: the monetary value of total or
partial destruction of physical assets existing in the af-
fected area. Direct economic loss is nearly equivalent to
physical damage. [a] An open-ended intergovernmental
expert working group on indicators and terminology
relating to disaster risk reduction established by the
General Assembly (resolution 69/284) is developing
a set of indicators to measure global progress in the
implementation of the Sendai Framework.
National disaster loss database, reported to
UNISDR
11.6 By 2030, reduce
the adverse per capita
environmental impact
of cities, including by
paying special attention
to air quality and mu-
nicipal and other waste
management
11.6.1 Proportion of urban solid
waste regularly collected and with
adequate final discharge out of
total urban solid waste generated,
by cities
Proportion of urban solid waste regularly collected and
with adequate final discharge out of total urban solid
waste generated The goal of this indicator aims to
generate the proportion of urban solid waste regularly
collected and that is adequately discharged out of all
the total urban waste generated by the city.
UN-Habitat is collecting information on this
indicator in more than 400 cities that are part of
the City Prosperity Initiative. Data for this indicator
is available and can be disaggregated at the city
and town levels. Information can be from municipal
records, service providers, community profiles and
household surveys. However, in many cities, solid
waste collection and recycling data are currently
incomplete or not available. The development of
adequate data collection systems may require a
significant effort in some jurisdictions
11.6.2 Annual mean levels of fine
particulate matter (e.g. PM2.5
and PM10) in cities (population
weighted)
The mean annual concentration of fine suspended
particles of less than 2.5 microns in diameters (PM2.5)
is a common measure of air pollution. The mean is a
population-weighted average for urban population in
a country.
Sources of data include ground measurements
from monitoring networks, collected for 3,000 cities
and localities (WHO 2016a) around the world,
satellite remote sensing, population estimates,
topoFigurey, information on local monitoring
networks and measures of specific contributors of
air pollution.
Goal 12. Ensure sustainable consumption and production patterns
12.2 By 2030, achieve
the sustainable man-
agement and efficient
use of natural resources
12.2.2 Domestic material con-
sumption, domestic material con-
sumption per capita, and domestic
material consumption per GDP
Domestic Material Consumption (DMC) is a standard
material flow accounting (MFA) indicator and reports
the apparent consumption of materials in a national
economy.
The global material flows database is based on
country material flow accounts from the European
Union and Japan and estimated data for the rest
of the world. Estimated data is produced on the
bases of data available from different national or
international datasets in the domain of agriculture,
forestry, fisheries, mining and energy statistics.
International statistical sources for DMC and MF
include the IEA, USGS, FAO and COMTRADE
databases. The IRP Global Material Flows and
Resource Productivity working group compiles the
data from countries and from other sources.
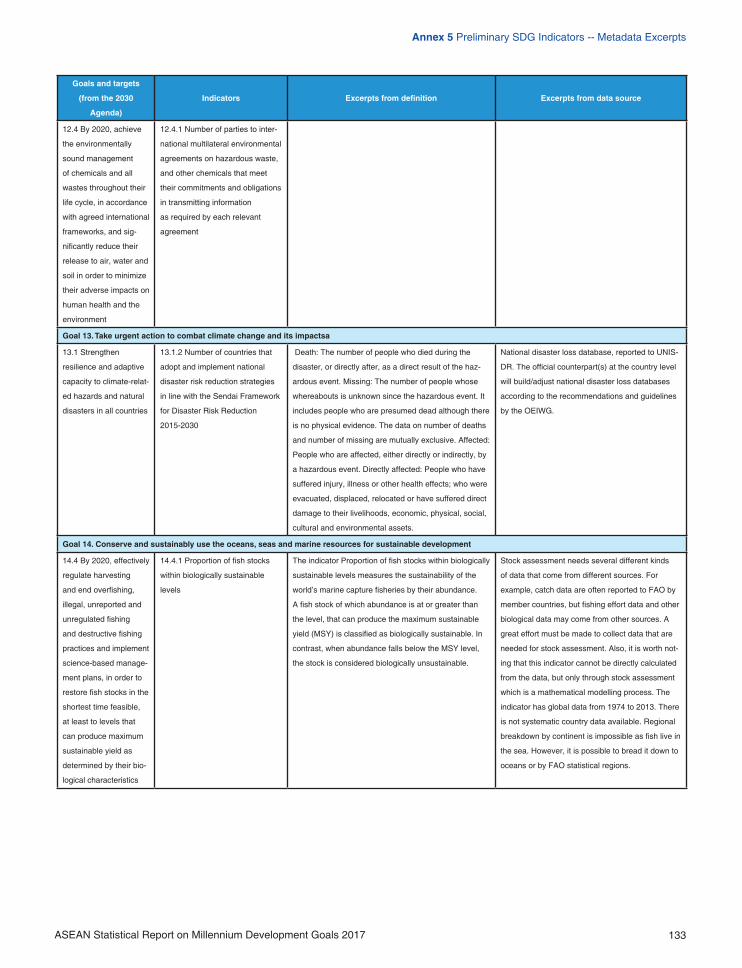
133
Annex 5 Preliminary SDG Indicators -- Metadata Excerpts
ASEAN Statistical Report on Millennium Development Goals 2017
Goals and targets
(from the 2030
Agenda)
Indicators Excerpts from definition Excerpts from data source
12.4 By 2020, achieve
the environmentally
sound management
of chemicals and all
wastes throughout their
life cycle, in accordance
with agreed international
frameworks, and sig-
nificantly reduce their
release to air, water and
soil in order to minimize
their adverse impacts on
human health and the
environment
12.4.1 Number of parties to inter-
national multilateral environmental
agreements on hazardous waste,
and other chemicals that meet
their commitments and obligations
in transmitting information
as required by each relevant
agreement
Goal 13. Take urgent action to combat climate change and its impactsa
13.1 Strengthen
resilience and adaptive
capacity to climate-relat-
ed hazards and natural
disasters in all countries
13.1.2 Number of countries that
adopt and implement national
disaster risk reduction strategies
in line with the Sendai Framework
for Disaster Risk Reduction
2015-2030
Death: The number of people who died during the
disaster, or directly after, as a direct result of the haz-
ardous event. Missing: The number of people whose
whereabouts is unknown since the hazardous event. It
includes people who are presumed dead although there
is no physical evidence. The data on number of deaths
and number of missing are mutually exclusive. Affected:
People who are affected, either directly or indirectly, by
a hazardous event. Directly affected: People who have
suffered injury, illness or other health effects; who were
evacuated, displaced, relocated or have suffered direct
damage to their livelihoods, economic, physical, social,
cultural and environmental assets.
National disaster loss database, reported to UNIS-
DR. The official counterpart(s) at the country level
will build/adjust national disaster loss databases
according to the recommendations and guidelines
by the OEIWG.
Goal 14. Conserve and sustainably use the oceans, seas and marine resources for sustainable development
14.4 By 2020, effectively
regulate harvesting
and end overfishing,
illegal, unreported and
unregulated fishing
and destructive fishing
practices and implement
science-based manage-
ment plans, in order to
restore fish stocks in the
shortest time feasible,
at least to levels that
can produce maximum
sustainable yield as
determined by their bio-
logical characteristics
14.4.1 Proportion of fish stocks
within biologically sustainable
levels
The indicator Proportion of fish stocks within biologically
sustainable levels measures the sustainability of the
world’s marine capture fisheries by their abundance.
A fish stock of which abundance is at or greater than
the level, that can produce the maximum sustainable
yield (MSY) is classified as biologically sustainable. In
contrast, when abundance falls below the MSY level,
the stock is considered biologically unsustainable.
Stock assessment needs several different kinds
of data that come from different sources. For
example, catch data are often reported to FAO by
member countries, but fishing effort data and other
biological data may come from other sources. A
great effort must be made to collect data that are
needed for stock assessment. Also, it is worth not-
ing that this indicator cannot be directly calculated
from the data, but only through stock assessment
which is a mathematical modelling process. The
indicator has global data from 1974 to 2013. There
is not systematic country data available. Regional
breakdown by continent is impossible as fish live in
the sea. However, it is possible to bread it down to
oceans or by FAO statistical regions.

134
Annex 5 Preliminary SDG Indicators -- Metadata Excerpts
ASEAN Statistical Report on Millennium Development Goals 2017
Goals and targets
(from the 2030
Agenda)
Indicators Excerpts from definition Excerpts from data source
Goal 15. Protect, restore and promote sustainable use of terrestrial ecosystems, sustainably manage forests, combat desertification, and halt and reverse land
degradation and halt biodiversity loss
15.1 By 2020, ensure
the conservation,
restoration and sustain-
able use of terrestrial
and inland freshwater
ecosystems and their
services, in particular
forests, wetlands,
mountains and drylands,
in line with obligations
under international
agreements
15.1.2 Proportion of important
sites for terrestrial and freshwater
biodiversity that are covered by
protected areas, by ecosystem
type
This indicator Proportion of important sites for terrestrial
and freshwater biodiversity that are covered by protect-
ed areas shows temporal trends in the percentage of
important sites for terrestrial and freshwater biodiversity
(i.e., those that contribute significantly to the global
persistence of biodiversity) that are wholly covered by
designated protected areas.
Protected area data are compiled by ministries
of environment and other ministries responsible
for the designation and maintenance of protected
areas. Protected Areas data for sites designated
under the Ramsar Convention and the UNESCO
World Heritage Convention are collected through
the relevant convention international secretariats.
Protected area data are aggregated globally into
the World Database on Protected Areas by the
UNEP World Conservation Monitoring Centre,
according to the mandate for production of the
United Nations List of Protected Areas (Deguignet
et al. 2014).
15.2 By 2020, promote
the implementation of
sustainable manage-
ment of all types of for-
ests, halt deforestation,
restore degraded forests
and substantially in-
crease afforestation and
reforestation globally
15.2.1 Progress towards sustain-
able forest management
15.4 By 2030, ensure
the conservation of
mountain ecosystems,
including their biodiver-
sity, in order to enhance
their capacity to
provide benefits that are
essential for sustainable
development
15.4.1 Coverage by protected
areas of important sites for moun-
tain biodiversity
This indicator Coverage by protected areas of important
sites for mountain biodiversity shows temporal trends in
the percentage of important sites for mountain biodiver-
sity (i.e., those that contribute significantly to the global
persistence of biodiversity) that are wholly covered by
designated protected areas.
Protected area data are compiled by ministries
of environment and other ministries responsible
for the designation and maintenance of protected
areas. Protected Areas data for sites designated
under the Ramsar Convention and the UNESCO
World Heritage Convention are collected through
the relevant convention international secretariats.
Protected area data are aggregated globally into
the World Database on Protected Areas by the
UNEP World Conservation Monitoring Centre,
according to the mandate for production of the
United Nations List of Protected Areas (Deguignet
et al. 2014).
15.4.2 Mountain Green Cover
Index
The Green Cover Index is meant to measure the
changes of the green vegetation in mountain areas -
i.e. forest, shrubs, trees, pasture land, crop land, etc.
– in order to monitor progress on the mountain target.
The index, will provide information on the changes
in the vegetation cover and, as such, will provide an
indication of the status of the conservation of mountain
environments.
The source of data is FAO Collect Earth.

135
Annex 5 Preliminary SDG Indicators -- Metadata Excerpts
ASEAN Statistical Report on Millennium Development Goals 2017
Goals and targets
(from the 2030
Agenda)
Indicators Excerpts from definition Excerpts from data source
15.7 Take urgent action
to end poaching and
trafficking of protected
species of flora and
fauna and address both
demand and supply of
illegal wildlife products
15.7.1 Proportion of traded
wildlife that was poached or illicitly
trafficked
The share of all trade in wildlife detected as being
illegal
The legal trade data are reported annually by
Parties to CITES and stored in the CITES Trade
Database, managed by the UNEP World Conser-
vation Monitoring Centre in Cambridge. The de-
tected illegal trade data have been gathered from
a number of sources and combined in a UNODC
database called “World WISE”. This database will
be filled, from 2017, with data from the new annual
CITES Illegal Trade reporting requirement. The US
LEMIS price data for CITES-listed species are also
provided to UNEP-WCMC within the U.S. annual
report to CITES.
15.c Enhance global
support for efforts to
combat poaching and
trafficking of protected
species, including by
increasing the capacity
of local communities
to pursue sustainable
livelihood opportunities
15.c.1 Proportion of traded
wildlife that was poached or illicitly
trafficked

136
Annex 5 Preliminary SDG Indicators -- Metadata Excerpts
ASEAN Statistical Report on Millennium Development Goals 2017
Goals and targets
(from the 2030
Agenda)
Indicators Excerpts from definition Excerpts from data source
Goal 16. Promote peaceful and inclusive societies for sustainable development, provide access to justice for all and build effective, accountable and inclusive
institutions at all levels
16.1 Significantly reduce
all forms of violence
and related death rates
everywhere
16.1.1 Number of victims of
intentional homicide per 100,000
population, by sex and age
The indicator is defined as the total count of victims
of intentional homicide divided by the total population,
expressed per 100,000 population. Intentional homicide
is defined as the unlawful death inflicted upon a person
with the intent to cause death or serious injury (Source:
International Classification of Crime for Statistical Pur-
poses, ICCS 2015); population refers to total resident
population in a given country in a given year.
Two separate sources exist at country level: a)
criminal justice system; b) public health/civil regis-
tration. UNODC collects and publishes data from
criminal justice systems through its long-lasting
annual data collection mandated by the UN Gener-
al Assembly (UN Crime Trends Survey, UN-CTS);
WHO collects and publishes data produced by
public health/civil registration. The data collection
through the UN-CTS is facilitated by a network
of over 130 national Focal Points appointed by
responsible authorities.
16.1.3 Proportion of population
subjected to physical, psycho-
logical or sexual violence in the
previous 12 months
The total number of persons who have been victim of
physical, psychological or sexual violence in the previ-
ous 12 months, as a share of the total population
This indicator is derived from surveys on crime vic-
timization or from other household surveys with a
module on crime victimization. The indicator refers
to individual experience of the respondent, who
is randomly selected among the household mem-
bers, while experience of other members is not to
be included. Experience of violent victimization is
collected through a series of questions on concrete
acts of violence suffered by the respondent. The
data collection through the UN-CTS is facilitated
by a network of over 130 national Focal Points
appointed by responsible authorities.
16.1.4 Proportion of population
that feel safe walking alone
around the area they live
This indicator refers to the proportion of the population
(adults) who feel safe walking alone in their neighbour-
hood.
Data are collected through sample surveys among
the general population, most often through crime
victimization surveys. UNODC collects data on
crime and criminal justice through its annual data
collection (UN-CTS). The data collection through
the UN-CTS is facilitated by a network of over 130
national Focal Points appointed by responsible
authorities. Data on ‘fear of crime’ are not yet col-
lected in the UN-CTS, however, it is expected that
data collection on this indicator can be included
in the next major revision of the UN-CTS planned
for 2017.
16.2 End abuse,
exploitation, trafficking
and all forms of violence
against and torture of
children
16.2.1 Proportion of children
aged 1-17 years who experienced
any physical punishment and/
or psychological aggression by
caregivers in the past month
Proportion of children aged 1-17 years who experi-
enced any physical punishment and/or psychological
aggression by caregivers in the past month is currently
being measured by the Proportion of children aged
1-14 years who experienced any physical punishment
and/or psychological aggression by caregivers in the
past month.
Household surveys such as UNICEF-supported
MICS and DHS that have been collecting data on
this indicator in low- and middle-income countries
since around 2005. In some countries, such data
are also collected through other national household
surveys.

137
Annex 5 Preliminary SDG Indicators -- Metadata Excerpts
ASEAN Statistical Report on Millennium Development Goals 2017
Goals and targets
(from the 2030
Agenda)
Indicators Excerpts from definition Excerpts from data source
16.2.2 Number of victims of
human trafficking per 100,000
population, by sex, age and form
of exploitation
The indicator is defined as the ratio between the total
number of victims of trafficking in persons detected or
living in a country and the population resident in the
country, expressed per 100,000 populations. According
to Article 3, paraFigure (a) of the UN Trafficking in
Persons Protocol, trafficking in persons is defined as
“the recruitment, transportation, transfer, harbouring
or receipt of persons, by means of the threat or use of
force or other forms of coercion, of abduction, of fraud,
of deception, of the abuse of power or of a position of
vulnerability or of the giving or receiving of payments
or benefits to achieve the consent of a person having
control over another person, for the purpose of ex-
ploitation. Exploitation shall include, at a minimum, the
exploitation of the prostitution of others or other forms
of sexual exploitation, forced labour or services, slavery
or practices similar to slavery, servitude or the removal
of organs”.
Data on detected victims of trafficking are typically
provided by national authorities competent in
detecting trafficking victims, law enforcement
institutions, or services assisting the victims. Data
are collected by UNODC through a questionnaire
sent to national authorities through their Perma-
nent Missions to the United Nations in Vienna (or
any other competent authority designated by the
Ministry of Foreign Affairs) and published in the
UNODC Global Report on Trafficking in Persons
every two years.
16.2.3 Proportion of young wom-
en and men aged 18-29 years
who experienced sexual violence
by age 18
Proportion of young women and men aged 18-29 years
who experienced sexual violence by age 18
Household surveys such as DHS have been
collecting data on this indicator in low- and mid-
dle-income countries since the late 1990s.
16.3 Promote the rule of
law at the national and
international levels and
ensure equal access to
justice for all
16.3.1 Proportion of victims of vi-
olence in the previous 12 months
who reported their victimization
to competent authorities or other
officially recognized conflict reso-
lution mechanisms
Number of victims of violent crime in the previous 12
months who reported their victimization to competent
authorities or other officially recognized conflict reso-
lution mechanisms, as a percentage of all victims of
violent crime in the previous 12 months
Victimisation surveys provide direct information on
this indicator, as they collect information on the ex-
perience of violent crime and on whether the victim
has reported it to competent authorities. UNODC
collects data on reporting rates for violent crime
through its annual data collection (UN-CTS). The
data collection through the UN-CTS is facilitated
by a network of over 130 national Focal Points
appointed by responsible authorities
16.5 Substantially
reduce corruption and
bribery in all their forms
16.5.1 Proportion of persons who
had at least one contact with a
public official and who paid a
bribe to a public official, or were
asked for a bribe by those public
officials, during the previous 12
months
This indicator is defined as the percentage of persons
who paid at least one bribe (gave a public official mon-
ey, a gift or counter favour) to a public official, or were
asked for a bribe by these public officials, in the last 12
months, as a percentage of persons who had at least
one contact with a public official in the same period.
This indicator is derived from household surveys
on corruption experience and/or victimisation
surveys with a module on bribery. The indicator
refers to individual experience of the respondent,
who is randomly selected among the household
members, while experience of bribery by other
members is not to be included. Experience of
bribery is collected through a series of questions
on concrete contacts and experiences of bribery
with a list of public official and civil servants.
UNODC collects data on the prevalence of bribery
through its annual data collection (UN-CTS). The
data collection through the UN-CTS is facilitated
by a network of over 130 national Focal Points
appointed by responsible authorities.

138
Annex 5 Preliminary SDG Indicators -- Metadata Excerpts
ASEAN Statistical Report on Millennium Development Goals 2017
Goals and targets
(from the 2030
Agenda)
Indicators Excerpts from definition Excerpts from data source
16.5.2 Proportion of businesses
that had at least one contact with
a public official and that paid a
bribe to a public official, or were
asked for a bribe by those public
officials during the previous 12
months
Proportion of firms asked for a gift or informal payment
when meeting with tax officials. In every Enterprise
Survey (www.enterprisesurveys.org), there is a stan-
dard question which asks the survey respondent if they
were inspected by or required to meet with tax officials.
Enterprise Surveys are firm-level surveys conducted
in World Bank client countries. The survey focuses on
various aspects of the business environment as well as
firm’s outcome measures such as annual sales, produc-
tivity, etc. The surveys are conducted via face-to-face
interviews with the top manager or business owner. For
each country, the survey is conducted approximately
every 4-5 years.
The website for Enterprise Surveys (www.enter-
prisesurveys.org) provides all metadata, including
survey questionnaires and implementation reports
for all Enterprise Surveys. The implementation re-
ports indicate the sample size, sample frame used,
dates/duration of fieldwork, the response rates, etc.
Registration to the Enterprise Survey’s website is
free and the website’s data portal allows users to
access the raw data and survey documentation for
each survey.
16.8 Broaden and
strengthen the participa-
tion of developing coun-
tries in the institutions of
global governance
16.8.1 Proportion of members and
voting rights of developing coun-
tries in international organizations
The indicator Proportion of members and voting rights
of developing countries in international organizations
has two components, the developing country proportion
of voting rights and the developing country proportion
of membership in international organisations. In some
institutions these two components are identical. The
indicator is calculated independently for eleven different
international institutions: The United Nations General
Assembly, the United Nations Security Council, the
United Nations Economic and Social Council, the
International Monetary Fund, the International Bank
for Reconstruction and Development, the International
Finance Corporation, the African Development Bank,
the Asian Development Bank, the Inter-American
Development Bank, the World Trade Organisation, and
the Financial Stability Board.
Annual reports, as presented on the website of the
institution in question, are used as sources of data.
16.10 Ensure public
access to information
and protect fundamental
freedoms, in accor-
dance with national leg-
islation and international
agreements
16.10.2 Number of countries that
adopt and implement constitu-
tional, statutory and/or policy
guarantees for public access to
information
16.a Strengthen
relevant national
institutions, including
through international
cooperation, for building
capacity at all levels, in
particular in developing
countries, to prevent
violence and combat
terrorism and crime
16.a.1 Existence of independent
national human rights institutions
in compliance with the Paris
Principles
This indicator Existence of independent national human
rights institutions in compliance with the Paris Principles
measures the compliance of existing national human
rights institutions with the Principles relating to the
Status of National Institutions (The Paris Principles),
which were adopted by the General Assembly (reso-
lution 48/134) based on the rules of procedure of the
Global Alliance of National Human Rights Institutions
(GANHRI, formerly the International Coordinating
Committee of National Institutions for the Promotion
and Protection of Human Rights or ICC).
The main source of data on the indicator is
administrative records of the Sub- Committee on
Accreditation reports of the GANHRI. OHCHR
compiles the data into a global directory of NHRI
status accreditation updated every six months,
after the Sub-committee on Accreditation submits
its report.

139
Annex 5 Preliminary SDG Indicators -- Metadata Excerpts
ASEAN Statistical Report on Millennium Development Goals 2017
Goals and targets
(from the 2030
Agenda)
Indicators Excerpts from definition Excerpts from data source
Goal 17. Strengthen the means of implementation and revitalize the Global Partnership for Sustainable Development
Finance
17.1 Strengthen
domestic resource
mobilization, including
through international
support to developing
countries, to improve
domestic capacity for
tax and other revenue
collection
17.1.1 Total government revenue
as a proportion of GDP, by source
17.1.2 Proportion of domestic
budget funded by domestic taxes
17.2 Developed
countries to implement
fully their official devel-
opment assistance com-
mitments, including the
commitment by many
developed countries to
achieve the target of 0.7
per cent of gross na-
tional income for official
development assistance
(ODA/GNI) to develop-
ing countries and 0.15
to 0.20 per cent of ODA/
GNI to least developed
countries; ODA pro-
viders are encouraged
to consider setting a
target to provide at least
0.20 per cent of ODA/
GNI to least developed
countries
17.2.1 Net official development
assistance, total and to least de-
veloped countries, as a proportion
of the Organization for Economic
Cooperation and Development
(OECD) Development Assistance
Committee donors’ gross national
income (GNI)
The indicator Net official development assistance, total
and to least developed countries, as a proportion of
the Organization for Economic Cooperation and Devel-
opment (OECD) Development Assistance Committee
donors’ gross national income (GNI) is defined as Net
ODA disbursements as a per cent of GNI.
The OECD/DAC has been collecting data on offi-
cial and private resource flows from 1960 at an ag-
gregate level and 1973 at an activity level through
the Creditor Reporting System (CRS data are
considered complete from 1995 for commitments
at an activity level and 2002 for disbursements).
The data are reported by donors according to the
same standards and methodologies (see here:
http://www.oecd.org/dac/stats/methodology.htm).
Data are reported on an annual calendar year
basis by statistical reporters in national administra-
tions (aid agencies, Ministries of Foreign Affairs or
Finance, etc.

140
Annex 5 Preliminary SDG Indicators -- Metadata Excerpts
ASEAN Statistical Report on Millennium Development Goals 2017
Goals and targets
(from the 2030
Agenda)
Indicators Excerpts from definition Excerpts from data source
17.3 Mobilize additional
financial resources for
developing countries
from multiple sources
17.3.1 Foreign direct investments
(FDI), official development
assistance and South-South
Cooperation as a proportion of
total domestic budget
ODA PART: ODA disbursements. Total ODA flows
to developing countries quantify the public effort that
donors provide to developing countries.
The OECD/DAC has been collecting data on ODA
flows from 1960. The data are reported by donors
according to the same standards and methodolo-
gies http://www.oecd.org/dac/stats/methodology.
htm . Data are reported on an annual calendar
year basis by statistical reporters in national
administrations (aid agencies, Ministries of Foreign
Affairs or Finance, etc.
17.3.2 Volume of remittances
(in United States dollars) as a
proportion of total GDP
Personal remittances received as proportion of GDP
is the inflow of personal remittances expressed as a
percentage of Gross Domestic Product (GDP).
Volume of personal remittances data are sourced
from IMF’s Balance of Payments Statistics data-
base and then gap-filled with World Bank staff esti-
mates. GDP data, sourced from the World Bank’s
World Development Indicators (WDI) database is
used as the denominator. GDP data collection is
conducted from national and international sources
through an annual survey of economists in the
Bank’s country office network – the World Bank’s
principal mechanism for gathering quantitative
macroeconomic information on its member
countries.
17.4 Assist devel-
oping countries in
attaining long-term debt
sustainability through
coordinated policies
aimed at fostering debt
financing, debt relief
and debt restructuring,
as appropriate, and
address the external
debt of highly indebted
poor countries to reduce
debt distress
17.4.1 Debt service as a pro-
portion of exports of goods and
services
Debt service as proportion of exports of goods and
services is the percentage of debt services (principle
and interest payments) to the exports of goods and
services. Debt services covered in this indicator refer
only to public and publicly guaranteed debt..
In accordance with the World Bank’s Operational
Policy 14.10 (which includes IBRD and IDA Gener-
al Conditions) external debt reporting is required to
fulfil the World Bank’s needs for reliable and timely
external debt information to (a) assess a borrowing
country’s foreign debt situation, creditworthiness,
and economic management; and (b) conduct its
country economic work and assess regional and
global indebtedness and debt servicing problems.
Capacity-building
17.9 Enhance inter-
national support for
implementing effective
and targeted capaci-
ty-building in developing
countries to support
national plans to imple-
ment all the Sustainable
Development Goals,
including through North-
South, South-South and
triangular cooperation
17.9.1 Dollar value of financial
and technical assistance (includ-
ing through North-South, South-
South and triangular cooperation)
committed to developing countries
The indicator Dollar value of financial and technical
assistance (including through North-South, South-South
and triangular cooperation) committed to developing
countries is defined as Gross disbursements of total
ODA and other official flows from all donors for capacity
building and national planning.
The OECD/DAC has been collecting data on offi-
cial and private resource flows from 1960 at an ag-
gregate level and 1973 at an activity level through
the Creditor Reporting System (CRS data are
considered complete from 1995 for commitments
at an activity level and 2002 for disbursements).
The data are reported by donors according to the
same standards and methodologies (see here:
http://www.oecd.org/dac/stats/methodology.htm).
Data are reported on an annual calendar year
basis by statistical reporters in national administra-
tions (aid agencies, Ministries of Foreign Affairs or
Finance, etc.

141
Annex 5 Preliminary SDG Indicators -- Metadata Excerpts
ASEAN Statistical Report on Millennium Development Goals 2017
Goals and targets
(from the 2030
Agenda)
Indicators Excerpts from definition Excerpts from data source
Trade
17.10 Promote a univer-
sal, rules-based, open,
non-discriminatory and
equitable multilat-
eral trading system
under the World Trade
Organization, including
through the conclusion
of negotiations under
its Doha Development
Agenda
17.10.1 Worldwide weighted
tariff-average
Value in percentage of weighted average tariffs applied
to the imports of goods in HS chapter 01-97.
The main information used to calculate indicators
17.10.1 is import tariff data. Information on import
tariffs might be retrieved by contacting directly
National statistical offices, permanent country
missions to the UN, regional organizations or focal
points within the customs, ministries in charge of
customs revenues (Ministry of economy/finance
and related revenue authorities) or, alternatively,
the Ministry of trade. Tariff data for the calculation
of this indicator are retrieved from ITC (MAcMap)
- http://www.macmap.org/ - WTO (IDB) - http://
tao.wto.org - and UNCTAD (TRAINS) databases.
Import tariff data included in the ITC (MAcMap)
database are collected by contacting directly focal
points in line national agencies or regional organi-
zations (in the case of custom unions or regional
economic communities). When available, data
are downloaded from national or regional official
websites. In some cases, data are purchased from
private companies. Import tariff data included in the
WTO (IDB) database are sourced from official no-
tifications of WTO members. Import tariff included
in the UNCTAD (TRAINS) database are collected
from official sources, including official country or
regional organizations websites.
17.11 Significantly
increase the exports of
developing countries,
in particular with a view
to doubling the least
developed countries’
share of global exports
by 2020
17.11.1 Developing countries’ and
least developed countries’ share
of global exports
Exports by developing countries and LDCs as a share
of global exports of goods and services
Trade in goods data included in the ITC (Trade
Map) database are collected by contacting directly
focal points in national agencies or regional orga-
nizations (in the case of custom unions or regional
economic communities). Trade in goods data
included in the WTO (IDB) database are sourced
from official notifications of WTO members. Trade
in goods data are complemented, when needed
using the UN COMTRADE database. Trade
in services data are sourced from a joint ITC/
UNCTAD/WTO database, prevalently based on
balance of payments accounts data maintained by
the IMF, OECD and EUROSTAT. In some cases
WTO jointly with UNCTAD collects information
from national sources. Trade in services data can
be retrieved by domestic banks and/or national
statistic offices from one or more of the following
sources: International Transaction Reporting Sys-
tem (ITRS). In this case, international payments
channelled through domestic banks are collected,
generally, under the responsibility of the national
central bank. Payments are used as a proxy of
transactions. Enterprise surveys. Generally, under
the responsibility of the national statistical office.

142
Annex 5 Preliminary SDG Indicators -- Metadata Excerpts
ASEAN Statistical Report on Millennium Development Goals 2017
Goals and targets
(from the 2030
Agenda)
Indicators Excerpts from definition Excerpts from data source
17.12 Realize timely
implementation of
duty-free and quota-free
market access on a
lasting basis for all least
developed countries,
consistent with World
Trade Organization de-
cisions, including by en-
suring that preferential
rules of origin applicable
to imports from least
developed countries are
transparent and simple,
and contribute to facili-
tating market access
17.12.1 Average tariffs faced by
developing countries, least devel-
oped countries and small island
developing States
Average import tariffs (in per cent) faced by products
exported from developing countries and least devel-
oped countries.
The main information used to calculate indicators
17.12.1 is import tariff data. Information on import
tariffs might be retrieved by contacting directly
National statistical offices, permanent country
missions to the UN, regional organizations or focal
points within the customs, ministries in charge of
customs revenues (Ministry of economy/finance
and related revenue authorities) or, alternatively,
the Ministry of trade. Tariff data for the calculation
of this indicator are retrieved from ITC (MAcMap)
- http://www.macmap.org/ - WTO (IDB) - http://
tao.wto.org - and UNCTAD (TRAINS) databases.
Import tariff data included in the ITC (MAcMap)
database are collected by contacting directly focal
points in line national agencies or regional organi-
zations (in the case of custom unions or regional
economic communities). When available, data
are downloaded from national or regional official
websites. In some cases, data are purchased from
private companies. Import tariff data included in the
WTO (IDB) database are sourced from official no-
tifications of WTO members. Import tariff included
in the UNCTAD (TRAINS) database are collected
from official sources, including official country or
regional organizations websites.
Systemic issues
Policy and institutional coherence
17.15 Respect each
country’s policy space
and leadership to
establish and implement
policies for poverty
eradication and sustain-
able development
17.15.1 Extent of use of coun-
try-owned results frameworks
and planning tools by providers of
development cooperation
This indicator seeks to measure the extent to which,
and the ways in which, transparent, developing
country-led results frameworks (CRFs) are used by all
concerned development partners to plan development
cooperation efforts and assess their performance. The
indicator assesses the degree to which providers of
development cooperation (i.e. development partners)
design their interventions by relying on objectives
and results indicators that are drawn from developing
country government-led results frameworks reflecting
the country’s development priorities and goals.
OECD and UNDP are currently supporting about
80 developing countries in collecting relevant data
on a biennial basis, and these organisations lead
data aggregation and quality assurance at the
global level. Data collection and validation is a gov-
ernment-led process, with strong engagement of
other stakeholders, including providers of develop-
ment cooperation, representatives of parliaments,
local governments, civil society organizations,
the private sector, and trade unions. In addition,
countries are increasingly institutionalising the
data collection process within their national aid
management systems and may be able to report
on the indicator on a yearly basis.

143
Annex 5 Preliminary SDG Indicators -- Metadata Excerpts
ASEAN Statistical Report on Millennium Development Goals 2017
Goals and targets
(from the 2030
Agenda)
Indicators Excerpts from definition Excerpts from data source
Multi-stakeholder partnerships
17.16 Enhance the
Global Partnership for
Sustainable Develop-
ment, complemented by
multi-stakeholder part-
nerships that mobilize
and share knowledge,
expertise, technology
and financial resources,
to support the achieve-
ment of the Sustainable
Development Goals
in all countries, in
particular developing
countries
17.16.1 Number of countries
reporting progress in multi-stake-
holder development effectiveness
monitoring frameworks that
support the achievement of the
sustainable development goals
The indicator tracks the number of countries reporting
progress in multi stakeholder monitoring frameworks
that track effective development cooperation, to support
the achievement of sustainable development goals
(SDGs).
OECD and UNDP are currently supporting about
80 developing countries in collecting relevant
data on a biennial basis through the GPEDC
monitoring framework, and these organisations
lead data aggregation and quality assurance at the
global level. In addition, countries are increasingly
institutionalising the data collection process within
their national aid management systems and are
reporting on a yearly basis. Complementarily, the
United Nations Department of Economic and So-
cial Affairs has been conducting a regular survey
for the Development Cooperation Forum, in coop-
eration with UNDP, to identify national progress in
mutual accountability and transparency.
Data, monitoring and accountability
17.19 By 2030, build
on existing initiatives to
develop measurements
of progress on sus-
tainable development
that complement gross
domestic product,
and support statistical
capacity-building in
developing countries
17.19.1 Dollar value of all resourc-
es made available to strengthen
statistical capacity in developing
countries
The indicator Dollar value of all resources made
available to strengthen statistical capacity in developing
countries is based on the Partner Report on Support to
Statistics (PRESS) that is designed and administered
by PARIS21 to provide a snapshot of the US dollar
value of ongoing statistical support in developing
countries.
To provide a full picture of international support
to statistics, the indicator draws on three distinct
data sources. The first source of data is the
OECD Creditor Reporting System (CRS), which
records data from OECD Development Assistance
Committee (DAC) members and some non-DAC
donors, and provides a comprehensive accounting
of ODA. Second, when SCB is a component of a
larger project, it is not identified by this code, caus-
ing the CRS figures to underestimate actual levels
of support for international aid. PARIS21 seeks to
reduce this downward bias by searching project
descriptions in the CRS for terms indicating a
component of SCB. Third, and finally, the PARIS21
Secretariat supplements this data with an online
questionnaire completed by a global network of
reporters. The questionnaire covers a subset of the
variables collected in the CRS and some additional
variables specific to statistical capacity building.


THIS PUBLICATION IS SUPPORTED BY
EU-COMPASS PROJECT
www.asean.org