asda income tracker - walmart.com€¢each month, asda sends out a ‘pulse of the nation’ survey...
TRANSCRIPT
© Centre for Economics and Business Research 2017
Asda Income Tracker Report: June 2017
Released: July 2017
Centre for Economics and
Business Research ltd Unit 1, 4 Bath Street, London
EC1V 9DX
t 020 7324 2850
w www.cebr.com
M a k i n g B u s i n e s s S e n s e
© Centre for Economics and Business Research 2017
Essential
Spending
£443 per
week
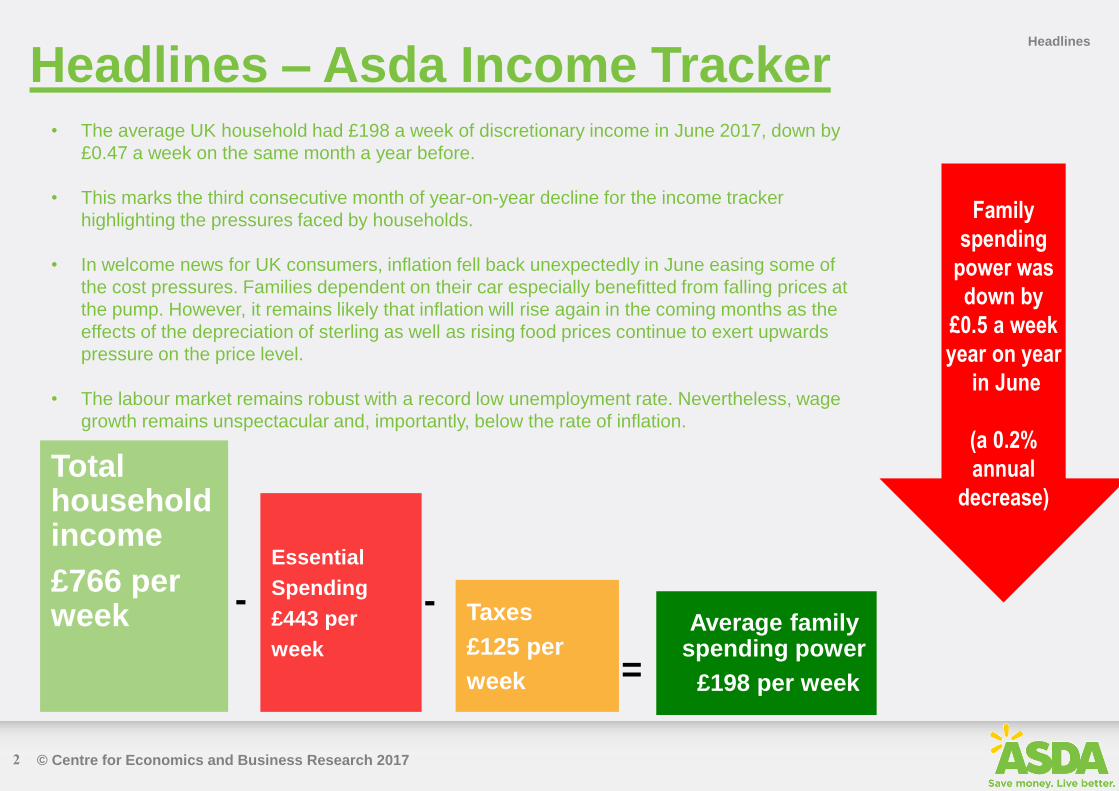
Headlines – Asda Income Tracker • The average UK household had £198 a week of discretionary income in June 2017, down by
£0.47 a week on the same month a year before.
• This marks the third consecutive month of year-on-year decline for the income tracker
highlighting the pressures faced by households.
• In welcome news for UK consumers, inflation fell back unexpectedly in June easing some of
the cost pressures. Families dependent on their car especially benefitted from falling prices at
the pump. However, it remains likely that inflation will rise again in the coming months as the
effects of the depreciation of sterling as well as rising food prices continue to exert upwards
pressure on the price level.
• The labour market remains robust with a record low unemployment rate. Nevertheless, wage
growth remains unspectacular and, importantly, below the rate of inflation.
Headlines
2
Total household income £766 per week Taxes
£125 per
week =
Average family spending power
£198 per week
- -
Family
spending
power was
down by
£0.5 a week
year on year
in June
(a 0.2%
annual
decrease)

© Centre for Economics and Business Research 2017
Asda Income Tracker Dashboard: June
Year-on-year
change Indicator
+2.0% Regular earnings growth* (Mar-May)
-0.4 p.p. Unemployment rate (Mar-May): 4.5%
+1.8% Net income (June)
+2.3% Food & non-alcoholic drinks inflation (June)
+4.1% Vehicle fuels (June)
+3.2% Furniture and household equipment (June)
+2.2% Essential item inflation (June)
-0.2% Family Spending Power (June)
KEY IMPROVING TREND NO SIGNIFICANT CHANGE IN TREND DETERIORATING TREND
Dashboard
3
* three-month average, excl bonuses
Change to
previous period
+2.0% GDP (Q1 2017) +0.2% QoQ
+0.2 p.p.
- 0.1 p.p.
CPI Inflation (June)
+2.6% -0.3% MoM
+0.2% MoM
+0.0% MoM
+0.6% MoM
-0.2% MoM
+0.4% MoM
-1.1% MoM

© Centre for Economics and Business Research 2017
Lower inflation provides welcome relief for
households in June
• While the annual rate of change for households
discretionary incomes remained negative in June,
there were some signs of a welcome relief.
• The fall in inflation eased the pressure on households’
budgets, especially for those who rely on their car for
transportation.
• Regular earnings growth also recovered somewhat
although bonus payments were squeezed. Overall,
pay growth has yet to turn a corner even though the
employment rate has climbed to a new all-time record
high of 74.9%.
• We expect June’s slowdown in inflation to be
temporary as higher food prices and the depreciation
of sterling will continue to exert upwards pressure on
price levels for the remainder of the year.
• This in turn means we expect further falls in the
Income Tracker for the coming months.
Income Tracker Trends
Year-on-year change in Asda income tracker, £ The Asda Income Tracker was £0.47 a week lower
in June 2017 than a year before
-£15
-£10
-£5
£0
£5
£10
£15
£20
£25
£30
4

© Centre for Economics and Business Research 2017
Cost of living
The main factors affecting family costs in June
were:
• Inflation as measured by the Consumer Price Index stood
at 2.6% in the year to June, down from 2.9% in the
previous month. This is only the third time that CPI
inflation fell since the start of 2016.
• The decrease was mainly driven by lower fuel prices
compared to May, falling prices for recreation and culture
and less expensive clothing and footwear.
• Out of the main CPI categories, alcoholic beverages and
tobacco showed the highest rate of inflation at 5.1%,
followed by education (4.3%) and transport (3.7%).
• Due to its bigger weight in the consumer basket of goods,
transportation still contributed most to the headline year-
on-year inflation rate with 0.6 percentage points.
• As in the previous month, gas was slightly cheaper in
June than in the same month a year ago. Electricity costs
on the other hand rose strongly, with inflation in this
category standing at 7.7%.
Inflation of selected goods, annual rate (LHS) and contribution
to headline inflation (RHS)
-0.6
-0.4
-0.2
0.0
0.2
0.4
0.6
0.8
1.0
1.2
-10%
-6%
-2%
2%
6%
10%
14%
18%
Rate of Inflation Contribution to inflation (in pp)
5
Cheaper fuel slows inflation in June
Vehicle fuel is a sub-category of Transport;
Gas and electricity are sub-categories of Housing & utilities

© Centre for Economics and Business Research 2017
Consumer Focus:
• In July, consumers told Asda how they are feeling about the economy and their finances. The data now shows that just
less than half of customers asked think their disposable income will fall in the next month, which is slightly fewer than the
June insight.
• 41% of customers feel that the cost of fuel prices will also increase over the next month, despite the income tracker data
showing the cost is decreasing month on month.
How are consumers feeling?
Negative
Neutral
Positive
• How do you feel about the current UK economy?
Rise
Fall
Stay the
same
• What will happen to your disposable income?
Rise
Fall
Stay the
same
• What will happen to the cost of day to day living?
Go up
Stay same
Go down
• What will happen to fuel prices?
Doesn’t
apply
• Each month, Asda sends out a ‘Pulse of the Nation’ survey to see how consumers are feeling about the economy. This survey asks
around hundreds of individuals from across the UK various questions about their thoughts on the economy. See below the results:

© Centre for Economics and Business Research 2017
Gross income growth slows notably in
Wales and Scotland
Regional Trends
Regional gross income, annual change to quarter indicated
Gross income growth slows in Q2 2017 across
the UK
• The weak wage growth figures of the last quarter have
led to a notable slowdown in gross income growth in a
number of regions.
• The largest decreases between Q1 and Q2 of this year
have been recorded in Wales and Scotland, where
gross income growth fell back by 0.2 percentage points.
• Other regions where gross income growth has slowed
are Yorkshire & the Humber, East Midlands and
Northern Ireland where incomes have grown 0.1
percentage points slower in Q2 than in the previous
three-month period. This has caused overall income
growth in the UK to fall back by 0.1 percentage points to
1.7% year-on-year.
• Income growth was fastest again in the North East,
followed by Yorkshire & the Humber and the North
West, the only regions where growth reached 2.0% or
more. This was mainly achieved by stronger-than-
average employment growth in these regions.
0.0%
0.5%
1.0%
1.5%
2.0%
2.5%
3.0%
3.5%
Q1 2017 Q2 2017
7

© Centre for Economics and Business Research 2017
Northern Ireland and Wales hit hardest by
fall in Income Tracker
Regional Trends
Asda Income Trackers by region, annual % change to quarter indicated and annual £ change to latest quarter
Most regions now report decreasing family
spending power
• The recent squeeze in discretionary incomes is visible
across all regions. Growth in the Income Tracker has
slowed across the country and stands in negative
territory for all regions except the North East, North
West and Yorkshire and the Humber. But even in those
regions, year-on-year increases in pound terms are at
their lowest since 2014.
• Northern Ireland and Wales are especially affected
with family spending power standing £4.60 and £5.90
lower than in the second quarter of 2016. Both regions
have experienced below average wage growth and
slower employment growth than the UK average.
• Q2 2017 is the first quarter for the UK to register
negative year-on-year increases in family spending
power since the end of 2013 when the country suffered
its latest squeeze on real incomes.
• With inflation expected to accelerate further and no
sign of faster wage growth in sight, the picture could
look even darker in Q3 2017.
-6%
-5%
-4%
-3%
-2%
-1%
0%
1%
2%
3%
4%
5%
Q1 2017 Q2 2017
8
-£4.6
-£5.9
-£4.4
-£1.8 -£1.5 -£1.2 -£1.3
-£1.1
-£0.9 -£1.2
+£0.5
+£1.1
+£3.8
© Centre for Economics and Business Research 2017
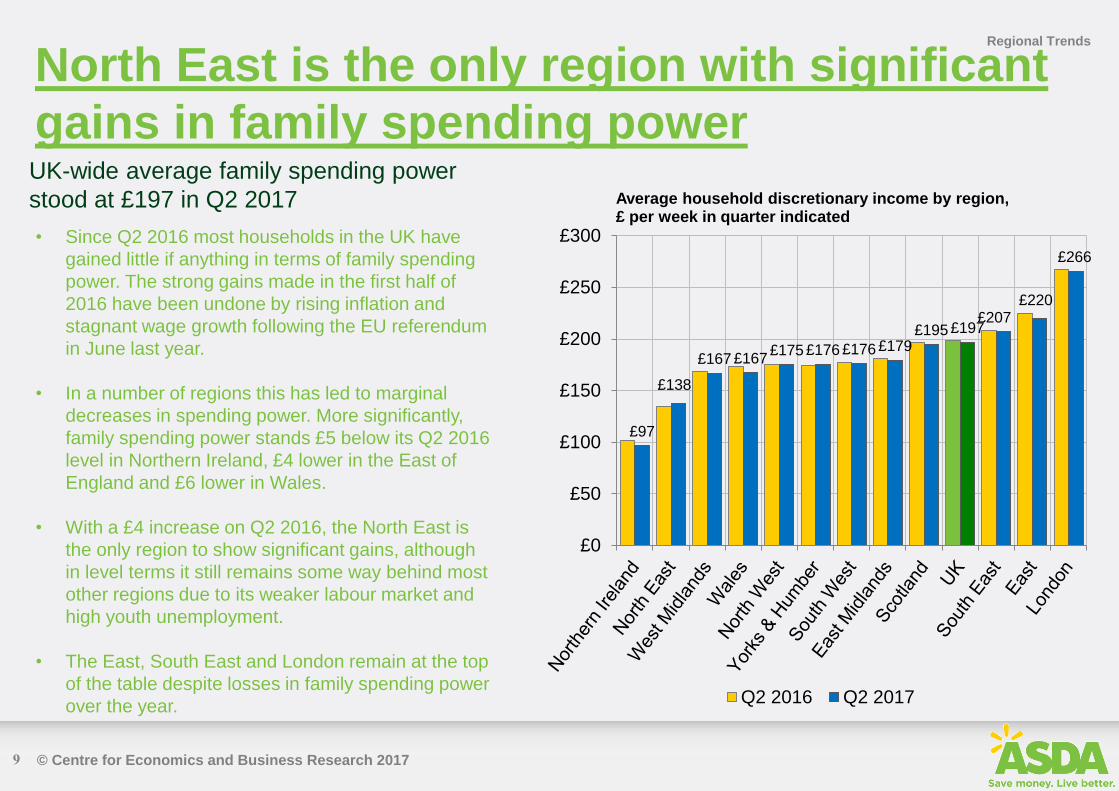
North East is the only region with significant
gains in family spending power
Regional Trends
Average household discretionary income by region, £ per week in quarter indicated
UK-wide average family spending power
stood at £197 in Q2 2017
• Since Q2 2016 most households in the UK have
gained little if anything in terms of family spending
power. The strong gains made in the first half of
2016 have been undone by rising inflation and
stagnant wage growth following the EU referendum
in June last year.
• In a number of regions this has led to marginal
decreases in spending power. More significantly,
family spending power stands £5 below its Q2 2016
level in Northern Ireland, £4 lower in the East of
England and £6 lower in Wales.
• With a £4 increase on Q2 2016, the North East is
the only region to show significant gains, although
in level terms it still remains some way behind most
other regions due to its weaker labour market and
high youth unemployment.
• The East, South East and London remain at the top
of the table despite losses in family spending power
over the year.
£97
£138
£167 £167 £175 £176 £176 £179
£195 £197 £207
£220
£266
£0
£50
£100
£150
£200
£250
£300
Q2 2016 Q2 2017
9

© Centre for Economics and Business Research 2017
Focus on Scotland and Northern Ireland Annual % change in discretionary incomes,
Scotland
Regional Trends
10
-5.0%
0.0%
5.0%
10.0%
15.0%
Q2
20
11
Q4
20
11
Q2
20
12
Q4
20
12
Q2
20
13
Q4
20
13
Q2
20
14
Q4
20
14
Q2
20
15
Q4
20
15
Q2
20
16
Q4
20
16
Q2
20
17
Annual % change in discretionary incomes,
Northern Ireland
-10.0%-5.0%0.0%5.0%
10.0%15.0%20.0%
Q2
20
11
Q4
20
11
Q2
20
12
Q4
20
12
Q2
20
13
Q4
20
13
Q2
20
14
Q4
20
14
Q2
20
15
Q4
20
15
Q2
20
16
Q4
20
16
Q2
20
17
• As most other regions and nations, discretionary
incomes have fallen in Scotland in Q2 2017compared
to the same quarter a year earlier.
• Family spending power stood at £195 in the second
quarter of the year which is 0.7% below the value of
the previous year.
• Scotland has suffered more than other regions and
nations from the falling oil prices of recent months.
Difficulties in the oil sector have spread to the wider
economy in the region leading to low growth and
below average wage inflation. We further forecast
employment growth in 2017 to stand at only 0.1% in
Scotland, the weakest among all regions.
• The fall in family spending power in Northern Ireland has
accelerated in the second quarter. After a fall of -0.8% YoY
in the first quarter, discretionary incomes have declined by
4.6% in Q2 2017 compared to the same quarter a year
earlier.
• This significant fall underlines the nation’s economic woes.
Northern Ireland has still by far the largest share of public
sector workers among all regions and nations. Limited pay
rises and low productivity gains in the public sector
therefore especially affect Northern Irish households.
• This is further exacerbated by weak business growth and
low private sector job growth.

© Centre for Economics and Business Research 2017
Report Spotlight:
The impact of housing costs on incomes
• The graph to the right shows a different measure of living
standards, incomes (net of benefit and taxes) by region before
and after housing costs are deducted.
• The distribution of incomes before housing costs are in line with
the regional analysis of the Income Tracker, with the Midlands,
the North and Yorkshire and the Humber showing incomes
clearly below the national average. Scotland, the East and the
South West are close to the national average while households
in London and the South East have incomes more then 10%
above the national median.
• After accounting for housing costs (private and social rent as
well as mortgage payments), the picture changes little for the
Midlands and the regions in the North. Incomes for London after
housing costs are, however, below the national median
underlining the high cost of accommodation in the capital.
According to the Family Resource Survey, households in the
capital spend almost twice as much on rent than the national
average (£247 pw compared to £132 pw).
• Things change little for the South East, where incomes after
housing costs are still more than 10% above the national
median.
Hot Topic
Percentage difference between median income by region
and overall median income, 2013-14 to 2015-16
Higher incomes in London are almost entirely
offset by higher housing cost
1
1
Source: IFS – Living Standards, poverty and inequality in
the UK: 2017

© Centre for Economics and Business Research 2017
Contact
Please find attached method notes and the tabulated date. Asda produces a
monthly income tracker report with a more comprehensive report every quarter.
For press enquiries please contact:
Jack Woodhead, Senior Press Officer, Corporate and People
[email protected] ; 0113 82 62852
For data enquiries please contact:
Kay Neufeld, Cebr Senior Economist,
[email protected] ; 020 7324 2841
Appendix
12

© Centre for Economics and Business Research 2017
Appendix

© Centre for Economics and Business Research 2017
-2%
-1%
0%
1%
2%
3%
4%
5%
6%
Ap
r-1
4
Ju
n-1
4
Au
g-1
4
Oct-
14
De
c-1
4
Fe
b-1
5
Ap
r-1
5
Jun-1
5
Au
g-1
5
Oct-
15
De
c-1
5
Fe
b-1
6
Ap
r-1
6
Ju
n-1
6
Au
g-1
6
Oct-
16
De
c-1
6
Fe
b-1
7
Ap
r-1
7
Ju
n-1
7
Regular earnings growth (RHS) CPIH Annual Percentage Change
Essential item inflation
2.2%
Falling oil prices
initiate broad fall in
inflation in late 2014
Highest earnings growth rate
since the financial crisis leads to
strong increases in family
spending power
Wage growth throughout 2016
remains lacklustre
Annual percentage change in Consumer Price Index, essential item inflation and average weekly earnings
Wage growth falls further behind inflation
2.6%
2.0%
Asda Income Tracker tables

© Centre for Economics and Business Research 2017
-6%
-4%
-2%
0%
2%
4%
6%
8%Ju
n-1
0
De
c-1
0
Ju
n-1
1
De
c-1
1
Ju
n-1
2
De
c-1
2
Ju
n-1
3
Dec-1
3
Ju
n-1
4
De
c-1
4
Ju
n-1
5
De
c-1
5
Ju
n-1
6
De
c-1
6
Ju
n-1
7
CPI Food and non-alcoholic drinks inflation Clothing and Footwear inflation
Inflation trends over time Asda Income Tracker tables

© Centre for Economics and Business Research 2017
Monthly Asda Income Tracker Asda Income Tracker tables
Asda Income Tracker (LHS) Asda Income Tracker annual % change (RHS)
Figure 1: Asda Income Tracker and year-on-year change (excluding bonuses)
16
-15%
-10%
-5%
0%
5%
10%
15%
20%
£130
£140
£150
£160
£170
£180
£190
£200
£210
Fe
b-1
0
Ju
n-1
0
Oct-
10
Fe
b-1
1
Ju
n-1
1
Oct-
11
Fe
b-1
2
Ju
n-1
2
Oct-
12
Fe
b-1
3
Ju
n-1
3
Oct-
13
Fe
b-1
4
Ju
n-1
4
Oct-
14
Fe
b-1
5
Ju
n-1
5
Oct-
15
Fe
b-1
6
Ju
n-1
6
Oct-
16
Fe
b-1
7
Ju
n-1
7

© Centre for Economics and Business Research 2017
Monthly Asda Income Tracker
Month Income tracker Month Income tracker Month Income tracker Month Income tracker
Table 1: Average UK household Income Tracker, £ per week, current prices, excluding bonuses
Income tracker Month
Asda Income Tracker tables
January 2013 £166 January 2014 £170 January 2015 £185 January 2016 £195 January 2017 £201
February 2013 £163 February 2014 £169 February 2015 £185 February 2016 £195 February 2017 £198
March 2013 £162 March 2014 £168 March 2015 £186 March 2016 £195 March 2017 £197
April 2013 £167 April 2014 £170 April 2015 £188 April 2016 £198 April 2017 £196
May 2013 £167 May 2014 £171 May 2015 £188 May 2016 £198 May 2017 £197
June 2013 £169 June 2014 £171 June 2015 £189 June 2016 £198 June 2017 £198
July 2013 £168 July 2014 £173 July 2015 £191 July 2016 £198
August 2013 £166 August 2014 £173 August 2015 £191 August 2016 £199
September 2013 £166
September 2014 £174
September 2015 £192
September 2016 £199
October 2013 £167 October 2014 £176 October 2015 £193 October 2016 £199
November 2013 £167
November 2014 £179
November 2015 £193
November 2016 £200
December 2013 £165
December 2014 £181
December 2015 £193
December 2016 £198
2013 Average £166 2014 Average £173 2015 Average £190 2016 Average £198
17
NB: In June, the ONS published revisions to the time series of its average
weekly earnings data, one of the inputs of the ASDA Income Tracker. The
values for the Income Tracker have been adjusted accordingly

© Centre for Economics and Business Research 2017
Total household income for the United Kingdom is derived from the Living Costs
and Food Survey 2012 (released December 2013). This is updated on a monthly
basis using official statistics on average earnings, unemployment, social security
payments, interest rates and pension income. Earnings data from the Office for
National Statistics that is released in the month of the report refers to the previous
month. We forecast earnings data for the month of the report.
Taxes are subtracted from total household income to estimate the actual amount
that can be spent on goods and services, i.e. net income or disposable income.
The average amount of tax paid is calculated using the latest version of the Living
Costs and Food Survey. This is updated on a monthly basis using Office for
National Statistics data and Cebr modelling.
Method notes The Asda income tracker is calculated from the following equations:
• Total household income minus taxes
equals net income
• Net income minus basic spend equals
Asda income tracker
Method notes
18
© Centre for Economics and Business Research 2017
Method notes
Net income is calculated by deducting our tax estimate from our total household
income estimate.
Basic spend (cost of living) figures are updated using monthly consumer price
data and the trend growth rate in the volume of essential goods and services
purchased over the most recent ten year period. A full list of items constituting
basic (or ‘essential’) spending was created in collaboration between Asda and Cebr
when the income tracker concept was originally formed in 2008. This list is
available on request.
The Asda income tracker is a measure of ‘discretionary income’, reflecting the
amount remaining after the average UK household has had taxes subtracted from
their income and bought essential items such as: groceries, electricity, gas,
transport costs and mortgage interest payments or rent. The income tracker
measures the amount left over to spend on discretionary purchases such as
leisure and recreation goods and services.
These components are based on official
statistics and Cebr calculations.
Method notes
19

© Centre for Economics and Business Research 2017
Disclaimer
This report was produced by the Centre for Economics and Business
Research (Cebr), an independent economics and business research
consultancy established in 1993 providing forecasts and advice to City
institutions, government departments, local authorities and numerous
blue-chip companies throughout Europe. The main contributors to this
report are Cebr economists Kay Neufeld and Nina Skero.
Whilst every effort has been made to ensure the accuracy of the
material in this report, the authors and Cebr will not be liable for any
loss or damages incurred through the use of this report.
London, July 2017
Disclaimer
20