as far as the east is from the west · pdf file1 as far as the east is from the west: an...
TRANSCRIPT

1
AS FAR AS THE EAST IS FROM THE WEST:
AN ANALYSIS OF THE SPIRITUAL DIFFERENCES AMONG THE
GEOGRAPHIC REGIONS OF KENTUCKY
BY
JASON LOWE, DIRECTOR OF MISSIONS
PIKE ASSOCIATION OF SOUTHERN BAPTISTS
SEPTEMBER 2016

2
BACKGROUND In December 2012, the Kentucky Baptist Convention released a report titled Lostness Indicators For Kentucky. This report revealed that “many Kentuckians are unclaimed by any religious group, and most of those who identified with a religious group don’t attend services of any sort on a regular basis.”1 The report included a breakdown of all 120 Kentucky counties, using three metrics:
Percentage of population which self-identify as religious “Adherents”.
Percentage of population which self-identify as “Members” of a specific religious congregation.
Percentage of population which self-identify as regular “Attenders” of religious worship services.
The results from the report indicated that only 51.6% of Kentuckians are identified with any religious group, and only 13.9% of Kentuckians attend a religious gathering on a regular basis. While these results were troubling enough, the county-by-county breakdown revealed that the percentages in some Kentucky counties were far worse. Over the past few years, the findings from this report have been used by local pastors, Directors of Missions, as well as Kentucky Baptist Convention leaders to raise awareness of the great spiritual darkness that still permeates the state.
PURPOSES OF CURRENT STUDY The 2012 report was extremely valuable in identifying specific counties across the commonwealth that faced significant spiritual challenges. However, the report did not address any larger geographical groupings, such as local Baptist associations or KBC consultant regions. Therefore, the first purpose of this report is to examine the metrics listed above in order to identify if there are specific regions in the state that include higher concentrations of lostness than other regions. While the 2012 report examined lostness in Kentucky based upon percentages, it did not address “populations of lostness.” In other words, while two counties may have a similar percentage of lostness, one of those counties may have a much larger population of lostness simply because it has more people living within its borders. In order to identify potential areas of priority for evangelism and church planting efforts, both metrics are valuable. Therefore, the second purpose of this study will be to factor in both the percentage of lostness as well as the population of lostness for each county and larger geographic regions.
1 This quote accessed online at http://old.kybaptist.org/2012/12/06/report-indicates-lostness-in-kentucky/ on 8/31/2016 at 3:05PM.

3
Data analyses such as what is found in this report are helpful only if they assist local churches, associations, and other denominational leaders in making strategic decisions. Therefore, the final purpose for this study will be to identify counties and regions that are in the greatest need of an intentional evangelistic and church planting emphasis. However, this report will not seek to address specific ministry strategies for these areas, other than the general observation that church planting and other evangelistic efforts are needed.
HOW TO UNDERSTAND THIS REPORT
The report itself is broken into three sections. In Section 1, the six KBC consultant regions are compared based upon several different metrics. Using these comparisons, a calculation will be introduced to assist pastors, church planters, and other interested individuals in identifying the regions that are most in need of intentional evangelism and church planting efforts. In Section 2, a similar comparison analysis is completed. Instead of comparing the 6 KBC consultant regions, Section 2 compares all 120 counties using the same metrics from Section 1. Based upon those comparisons, the same calculation is introduced to assist pastors, church planters, and other interested individuals in identifying the specific Kentucky counties that are most in need of intentional evangelism and church planting efforts. In Section 3, a short summary of the findings from Sections 1 and 2 will be presented. If a summary is desired before reading the detailed report, you may turn to pages 22 and 23 for that summary.
DATA SOURCES The information in this report was drawn from the following data sources:
U.S. Census Bureau 2015 population estimates (census.gov)
KBC’s 2012 Lostness Indicators for Kentucky report
Kentucky Baptist Convention Mission Board staff It is certainly worth noting that the KBC Mission Board staff was very cooperative and helpful during the research phase of this study. All requests for data were handled promptly and accurately. The churches of the Kentucky Baptist Convention are blessed to have a Mission Board staff that truly desires to live out its mission of helping churches reach Kentucky and the world for Christ.
4
SPIRITUAL LANDSCAPE OF KENTUCKY The 2015 population estimate for the state of Kentucky is 4,425,273 residents. Of these nearly 4.5 million Kentuckians:
51.6% identify as adhering to some type of religious group (2,282,048 Kentuckians)
33.8% identify as being a member of a religious congregation (1,497,925 Kentuckians)
13.0%2 identify as regularly attending religious worship services (575,911 Kentuckians)
In light of these numbers, it should be noted that there are currently 2,503 Kentucky Baptist congregations3 across the state seeking to reach the millions of lost Kentuckians with the gospel of Jesus Christ. To put it another way, there is one Kentucky Baptist church for every 1,768 residents in Kentucky.
2 This percentage is slightly lower than the 13.9% listed in the 2012 report. The difference is that the percentage listed in the 2012 report was a non-weighted average (total attendance percentage of all KY counties divided by 120). However, the percentage listed here is a weighted average which takes into account the populations of each of the 120 Kentucky counties. Therefore, the 13.0% is a more accurate representation of worship service attendance in Kentucky as a whole. 3 This total was provided by the Kentucky Baptist Convention Mission Board staff. It includes approximately 100 churches that are members of one of the 70 local Baptist associations in Kentucky, but are not affiliated with the Kentucky Baptist Convention. It does not include the approximately 100 churches in the state which are not currently a member of any local Baptist association but have had some type of affiliation with the Kentucky Baptist Convention in the past and/or at present.

5
SECTION 1 – REGIONAL COMPARISONS
INTRODUCTION OF KBC CONSULTANT REGIONS
In May 2012, the Kentucky Baptist Convention underwent a significant restructuring of its Mission Board staff. As part of that restructuring, the Church Consulting and Revitalization Team was created and the state was divided into five geographic “consultant regions”. In 2014, a sixth region was created. These six consultant regions will serve as the comparison groups throughout the majority of this report and are shown on the map below.
REGIONAL DEMOGRAPHICS
The demographic differences between the six regions are shown in Table 1.1. A few definitions are necessary in order to properly understand the table:
Population: The combined 2015 population estimate of all of the counties in each region.
# Counties: The number of counties included in each region.
# KBC Churches: The number of KBC churches in each region.
KBC Church Ratio: The KBC churches to population ratio for each region. A higher ratio is interpreted as less desirable than a lower ratio.
# KBC Funded Church Plants: The number of church plants and satellite campuses that are receiving funding assistance from the Kentucky Baptist Convention. This number fluctuates from month to month as new church plants

6
are started and older church plants conclude the 3-year funding schedule from the KBC.
Table 1.1 Regional Demographics
Region Population # Counties # KBC
Churches KBC Church
Ratio # KBC Funded Church Plants
West 474,879 19 506 1:938 13
South Central 540,679 20 425 1:1272 8
Central 1,303,806 15 482 1:2705 20
North Central 1,171,578 21 406 1:2886 10
South 388,048 16 437 1:888 3
East 546,283 29 247 1:2212 1
Total 4,425,273 120 2,503 1:1768 55
As Table 1.1 shows, there are some significant differences among the six regions. Several initial observations can be made from this data. First, the Central and North Central regions are much more densely populated, which makes sense as these two regions are home to the largest cities in the state. As one might expect, the KBC church to population ratio for these two regions is higher as well. What is surprising is that while the North Central region is the second-most populated region, it has the second-fewest number of KBC churches. However, significant church planting efforts are under way in both regions to address some of these issues. A second initial observation is the strong KBC presence in the West region. Although the population in the West region is the second-lowest, it boasts the largest number of KBC churches. This results in a KBC church to population ratio of nearly half the Kentucky average. Somewhat surprisingly, the West region also has the second-most currently funded KBC church plants, ensuring that the strong KBC presence will continue to grow. A third and final initial observation is the stark contrast between the West and East regions. While the East region is the third-most populated region behind the Central and North Central regions, it has the fewest KBC churches by far. In fact, while the East region has 71,404 more people in its population (15% difference), it has less than half the number of KBC churches than the West region. Although significant church planting efforts are needed in the East region, it only has 1 currently KBC-funded church plant. Tables 1.2-1.5 show the rankings of the six regions in each of the categories found in Table 1.1.

7
Table 1.2 Regional Population Rankings
Ranking Region Population
1 Central 1,303,806
2 North Central 1,171,578
3 East 546,283
4 South Central 540,679
5 West 474,879
6 South 388,048
Table 1.3 KBC Church Rankings
Ranking Region # KBC Churches
1 West 506
2 Central 482
3 South 437
4 South Central 425
5 North Central 406
6 East 247
Table 1.4 KBC Church to Population Ratio Rankings
(Worst to Best)
Ranking Region KBC Church Ratio
1 North Central 1:2886
2 Central 1:2705
3 East 1:2212
4 South Central 1:1272
5 West 1:938
6 South 1:888
Table 1.5 # KBC Church Plants Rankings
Ranking Region # KBC Church Plants
1 Central 20
2 West 13
3 North Central 10
4 South Central 8
5 South 3
6 East 1

8
LOSTNESS INDICATORS (BY PERCENTAGE) With an initial understanding of the differences between the six regions, Table 1.6 now presents the metrics that were introduced in the 2012 KBC Lostness Indicators for Kentucky report.
Table 1.6 Regional Comparison of Lostness Indicators (By Percentage)
Region % Adherents % Members % Attenders
West 65.0% 48.4% 19.4%
South Central 56.9% 40.5% 15.9%
Central 53.1% 30.8% 11.6%
North Central 49.8% 29.4% 11.4%
South 52.4% 41.9% 15.1%
East 34.2% 25.8% 10.0%
Total 51.6% 33.8% 13.0%
The lostness indicators found in Table 1.6 correlate with several of the initial observations identified from the regional demographics found in Table 1.1. First, just as the East region had the fewest number of KBC churches, it also has the lowest percentages in each of the lostness indicators. Similarly, just as the West region had the highest number of KBC churches, it also has the highest percentages in each of the lostness indicators. And just as the West region doubled the East region in the number of KBC churches, the West region nearly doubles the East region in each of the percentages above. Another observation is that just as the Central, North Central, and East regions had the highest KBC church to population ratios, those same regions have the lowest percentages of membership and attendance in Table 1.6. The regional rankings for each of these lostness indicators are found in Tables 1.7-1.9.
Table 1.7 % Adherents Rankings
(Worst to Best)
Ranking Region % Adherents
1 East 34.2%
2 North Central 49.8%
3 South 52.4%
4 Central 53.1%
5 South Central 56.9%
6 West 65.0%

9
Table 1.8 % Membership Rankings
(Worst to Best)
Ranking Region % Members
1 East 25.8%
2 North Central 29.4%
3 Central 30.8%
4 South Central 40.5%
5 South 41.9%
6 West 48.4%
Table 1.9 % Attendance Rankings
(Worst to Best)
Ranking Region % Attenders
1 East 10.0%
2 North Central 11.4%
3 Central 11.6%
4 South 15.1%
5 South Central 15.9%
6 West 19.4%
LOSTNESS INDICATORS (BY POPULATION) The percentages of lostness shown in Tables 1.6-1.9 tell part of the story of lostness in Kentucky, but not the whole story. Based upon these percentages, Table 1.10 provides an estimated number of lost people that are living in each region.
Table 1.10 Regional Comparison of Lostness Indicators (By Population)
Region Total
Non-Adherents Total
Non-Members Total
Non-Attenders
West 166,444 245,069 382,967
South Central 232,959 321,911 454,920
Central 611,505 902,291 1,152,492
North Central 588,236 827,275 1,037,562
South 184,752 225,343 329,497
East 359,330 405,459 491,925
Total 2,143,225 2,927,348 3,849,362

10
Tables 1.11-13 show the rankings for each of these three metrics included in the preceding table.
Table 1.11 Total Non-Adherents
Ranking Region Total Non-Adherents
1 Central 611,505
2 North Central 588,236
3 East 359,330
4 South Central 232,959
5 South 184,752
6 West 166,444
Table 1.12 Total Non-Members
Ranking Region Total Non-Members
1 Central 902,291
2 North Central 827,275
3 East 405,459
4 South Central 321,911
5 West 245,069
6 South 225,343
Table 1.13 Total Non-Attenders
Ranking Region Total Non-Attenders
1 Central 1,152,492
2 North Central 1,037,562
3 East 491,925
4 South Central 454,920
5 West 382,967
6 South 329,497
DEVELOPING EVANGELISTIC PRIORITIES In order to be the best possible stewards of the resources that have been entrusted to them, the International Mission Board and the North American Mission Board have developed missional strategies to focus on the locations and people groups that are in most desperate need of the gospel. A similar strategy is needed in Kentucky. In order to focus on the locations that are in most desperate need of an evangelistic witness and

11
the subsequent planting of new churches, some type of systematic process is needed to identify those locations. Based upon the information found in the preceding pages of this report, an attempt has been made to develop a “church planting priority index” for each of the six regions. This index is calculated by taking the average ranking for each region in each of the following categories:4
% Non-Adherents
Total Non-Adherents
% Non-Members
Total Non-Members
% Non-Attenders
Total Non-Attenders
KBC Church to Population Ratio
# of Current KBC-Funded Church Plants
Table 1.14 shows the rankings for each of the categories included in the calculation.
Table 1.14 Church Planting Priority Index Calculation
Region % Non-
Adh Total
Non-Adh % Non-
Members
Total Non-Mbrs
% Non-Attd
Total Non-Attd
KBC Church Ratio
KBC Church Plants
Average Ranking
West 6 6 6 5 6 5 5 5 5.50
S. Central 5 4 4 4 5 4 4 3 4.13
Central 4 1 3 1 3 1 2 6 2.63
N. Central 2 2 2 2 2 2 1 4 2.13
South 3 5 5 6 4 6 6 2 4.63
East 1 3 1 3 1 3 3 1 2.00
In light of the calculations in Table 1.14, the church planting priority index indicates that church planting is needed in the KBC regions in the following order of priority:
1. East (Index = 2.00) 2. North Central (Index = 2.13) 3. Central (Index = 2.63) 4. South Central (Index = 4.13) 5. South (Index = 4.63) 6. West (Index = 5.50)
4 In order to calculate a meaningful and consistent church planting priority index, the rankings for each category were determined by assigning a ranking of 1 to the region with the most undesirable value and a ranking of 2 to the region with the second most undesirable value, and so on. For example, the region with the highest number of total non-adherents received a ranking of 1 for that category because a higher number of non-adherents is an undesirable value for the purposes of this study. Similarly, the region with the lowest number of KBC-funded church plants received a ranking of 1 for that category because a lower number of church plants is an undesirable value.

12
SECTION 2 – COUNTY COMPARISONS
In this section, the analysis from Section 1 will be applied to all 120 counties in Kentucky. Because of the massive number of counties, the data in this section will only list the Top 25 counties in each category.
POPULATION
Table 2.1 Top 25 Counties By Population
Ranking County Region Population
1 Jefferson Central 763,623
2 Fayette North Central 314,488
3 Kenton North Central 165,012
4 Boone North Central 127,712
5 Warren South Central 122,851
6 Hardin Central 106,439
7 Daviess South Central 99,259
8 Campbell North Central 92,066
9 Madison North Central 87,824
10 Bullitt Central 78,702
11 Christian West 73,309
12 McCracken West 65,018
13 Oldham Central 64,875
14 Pulaski South 63,782
15 Pike East 61,792
16 Laurel South 60,094
17 Scott North Central 52,420
18 Jessamine North Central 51,961
19 Franklin Central 50,375
20 Boyd East 48,325
21 Henderson West 46,407
22 Hopkins West 46,222
23 Shelby Central 45,632
24 Nelson Central 45,126
25 Barren South Central 43,570
As Table 2.1 shows, both the Central and North Central regions include the highest number of counties in the Top 25 most populated counties in the state (7 each), followed by the West with 4, South Central with 3, and the East and South regions with 2 counties each.

13
KBC CHURCHES & CHURCH PLANTS
Table 2.2 Top 25 Worst KBC Church to Population Ratios
Ranking County Region KBC Ratio
1 Boone North Central 1:7512
2 Jessamine North Central 1:6495
3 Bath East 1:6114
4 Rowan East 1:5973
5 Johnson East 1:5839
6 Fayette North Central 1:5718
7 Kenton North Central 1:5000
8 Jefferson Central 1:4400
9 Campbell North Central 1:4185
10 Martin East 1:4102
11 Elliot East 1:3824
12 Oldham Central 1:3604
13 Carter East 1:3395
14 Bourbon North Central 1:3353
15 Scott North Central 1:3276
16 Magoffin East 1:3202
17 Menifee East 1:3179
18 Montgomery North Central 1:3068
19 Fleming East 1:2927
20 Breathitt East 1:2697
20 Floyd East 1:2697
22 Pike East 1:2687
23 Morgan East 1:2655
24 Lawrence East 1:2624
25 Greenup East 1:2576
As Table 2.2 shows, the East region is home to 15 out of the top 25 counties with the worst KBC church to population ratio, followed by the North Central region with 8, and the Central region with 2. It is very significant that the South, South Central, and West regions do not have any counties in the top 25 in this category.

14
Table 2.3 Currently-Funded KBC Church Plants By Region
Ranking County Region KBC Church Plants
1 Jefferson Central 12
2 McCracken West 4
3 Calloway West 3
4 Daviess South Central 2
4 Fayette North Central 2
4 Garrard North Central 2
4 Graves West 2
4 Hardin Central 2
4 Henderson West 2
4 Kenton North Central 2
4 Nelson Central 2
4 Warren South Central 2
13 Boone North Central 1
13 Grant North Central 1
13 Hart South Central 1
13 Knox South 1
13 LaRue South Central 1
13 Letcher East 1
13 Lincoln South 1
13 Madison North Central 1
13 Meade Central 1
13 Monroe South Central 1
13 Muhlenberg West 1
13 Oldham Central 1
13 Pulaski South 1
13 Scott North Central 1
27 Remaining 94 counties N/A 0
Tables 2.3 shows the number of currently-funded KBC church plants by county. As the table indicates, there are churches currently being planted in 5 Central region counties, 1 East region county, 7 North Central region counties, 3 South region counties, 5 South Central region counties, and 5 West region counties.

15
LOSTNESS INDICATORS (BY PERCENTAGE)
The percentages listed in Tables 2.4-2.6 are also found on the 2012 Lostness Indicators for Kentucky report.
Table 2.4
Top 25 Counties With Lowest % of Adherents
Ranking County Region % Adherents
1 Elliot East 5.1%
2 Menifee East 11.8%
3 Breathitt East 14.8%
4 Rowan East 19.9%
5 Morgan East 21.3%
5 Wolfe East 21.3%
7 McCreary South 21.7%
8 Knott East 21.9%
9 Martin East 22.2%
10 Robertson East 23.1%
11 Letcher East 25.2%
11 Magoffin East 25.2%
13 Jackson South 26.4%
14 Carter East 26.6%
15 Johnson East 28.0%
15 Lewis East 28.0%
17 Lee East 28.1%
18 Jessamine North Central 28.8%
19 Lawrence East 30.6%
20 Leslie East 30.8%
21 Allen South Central 31.1%
22 Floyd East 31.6%
23 Pike East 31.7%
24 Bullitt Central 33.2%
24 Owsley South 33.2%
As Table 2.4 shows, 19 out of the top 25 counties with the lowest percentage of adherents are located in the East region, followed by the South region with 3, and one each in the Central, North Central, and South Central regions. The West region had no counties in the top 25 in this category.

16
Table 2.5 Top 25 Counties With Lowest % of Members
Ranking County Region % Members
1 Elliot East 4.5%
2 Menifee East 7.5%
3 Breathitt East 9.7%
4 Rowan East 11.5%
5 Wolfe East 15.2%
6 Kenton North Central 16.0%
7 McCreary South 16.7%
8 Knott East 17.3%
9 Morgan East 17.4%
10 Campbell North Central 18.3%
11 Lee East 18.5%
12 Martin East 18.8%
13 Johnson East 19.2%
14 Magoffin East 19.3%
15 Jessamine North Central 20.0%
16 Robertson East 20.1%
16 Jackson South 20.1%
18 Carter East 20.7%
19 Letcher East 20.9%
20 Lewis East 23.2%
21 Bullitt Central 23.3%
22 Floyd East 24.0%
23 Leslie East 24.2%
24 Montgomery North Central 24.4%
24 Powell East 24.4%
24 Marion Central 24.4%
Because of a tie, there are actually 26 counties in the top 25 for the lowest percentage of members. The East region leads the way again with 18, followed by the North Central region with 4, and the Central and South regions each with 2 counties. The West and South Central regions did not have any counties in the top 25 in this category.

17
Table 2.6 Top 25 Counties With Lowest % of Attenders
Ranking County Region % Attenders
1 Elliot East 2.0%
2 Lewis East 3.9%
3 Edmonson South Central 4.5%
4 McCreary South 4.9%
5 Kenton North Central 5.9%
6 Carter East 6.1%
7 Martin East 6.3%
8 Lawrence East 6.5%
8 Robertson East 6.5%
10 Campbell North Central 7.1%
11 Spencer Central 7.2%
12 Johnson East 7.3%
13 Nicholas East 7.8%
14 Breathitt East 7.9%
14 Letcher East 7.9%
14 Bracken East 7.9%
17 Marion Central 8.1%
18 Knott East 8.2%
19 Rowan East 8.3%
20 Pike East 8.5%
21 Menifee East 8.7%
22 Gallatin North Central 9.0%
22 Jackson South 9.0%
22 Morgan East 9.0%
25 Bullitt Central 9.4%
Table 2.6 shows that the East region has the most counties in the top 25 with the lowest % of attenders with 16, followed by the Central and North Central regions each with 3 counties, the South region with 2 counties, and the South Central region with 1 county. The West region once again did not have any counties in the top 25 for this category. From the data found in Tables 2.4-2.6, it is clear that the East region contains the majority of the most lost and unchurched counties in Kentucky when the percentages are the metric under consideration. Tables 2.7-2.9 will rank the Top 25 counties in each category based upon population rather than by percentage.

18
LOSTNESS INDICATORS (BY POPULATION)
Table 2.7 Top 25 Counties With Most Non-Adherents
Ranking County Region Total Non-Adherents
1 Jefferson Central 345,158
2 Fayette North Central 150,325
3 Kenton North Central 84,981
4 Warren South Central 67,445
5 Boone North Central 63,984
6 Hardin Central 55,774
7 Madison North Central 53,748
8 Bullitt Central 52,573
9 Campbell North Central 46,770
10 Pike East 42,204
11 Jessamine North Central 36,996
12 Oldham Central 34,903
13 Christian West 34,015
14 Laurel South 33,893
15 Scott North Central 31,190
16 Daviess South Central 29,877
17 Pulaski South 26,406
18 Floyd East 25,825
19 Barren South Central 22,787
20 Franklin Central 21,561
21 Greenup East 20,956
22 Nelson Central 20,577
23 Shelby Central 20,352
24 Carter East 19,934
25 Henderson West 19,677
Table 2.7 shows that based upon population, both the Central and North Central regions have the most counties in the top 25 with 7 each, followed by the East region with 4, South Central with 3, and the South and West regions each with 2 counties.

19
Table 2.8
Top 25 Counties With Most Non-Members
Ranking County Region Total Non-Members
1 Jefferson Central 538,354
2 Fayette North Central 212,594
3 Kenton North Central 138,610
4 Boone North Central 95,912
5 Warren South Central 83,047
6 Campbell North Central 75,218
7 Hardin Central 73,124
8 Madison North Central 63,145
9 Bullitt Central 60,364
10 Daviess South Central 59,258
11 Oldham Central 48,332
12 Christian West 46,258
13 Pike East 45,973
14 Jessamine North Central 41,569
15 Laurel South 39,362
16 Scott North Central 38,424
17 Pulaski South 33,996
18 Nelson Central 33,799
19 McCracken West 30,428
20 Franklin Central 28,865
21 Floyd East 28,695
22 Henderson West 28,447
23 Barren South Central 27,580
24 Shelby Central 27,288
25 Boyd East 27,110
Table 2.8 shows that based upon population, both the Central and North Central regions have the most counties in the top 25 with 7 each. The East, South Central, and West regions each have 3 counties in the top 25, and the South region contains 2 counties.

20
Table 2.9 Top 25 Counties With Most Non-Attenders
Ranking County Region Total Non-Attenders
1 Jefferson Central 676,570
2 Fayette North Central 270,774
3 Kenton North Central 155,276
4 Boone North Central 114,941
5 Warren South Central 103,195
6 Hardin Central 93,134
7 Campbell North Central 85,529
8 Daviess South Central 84,966
9 Madison North Central 77,461
10 Bullitt Central 71,304
11 Christian West 63,192
12 Oldham Central 58,647
13 Pike East 56,540
14 Pulaski South 52,265
15 Laurel South 51,981
16 McCracken West 50,259
17 Jessamine North Central 46,713
18 Scott North Central 45,972
19 Franklin Central 42,517
20 Nelson Central 40,749
21 Boyd East 40,738
22 Shelby Central 40,339
23 Henderson West 39,817
24 Hopkins West 37,763
25 Barren South Central 36,904
Table 2.9 shows that based upon population, both the Central and North Central regions have the most counties in the top 25 with 7 each, followed by the West region with 4, South Central region with 3, and the East and South regions with 2 each.
CHURCH PLANTING PRIORITY INDEX (BY COUNTY)
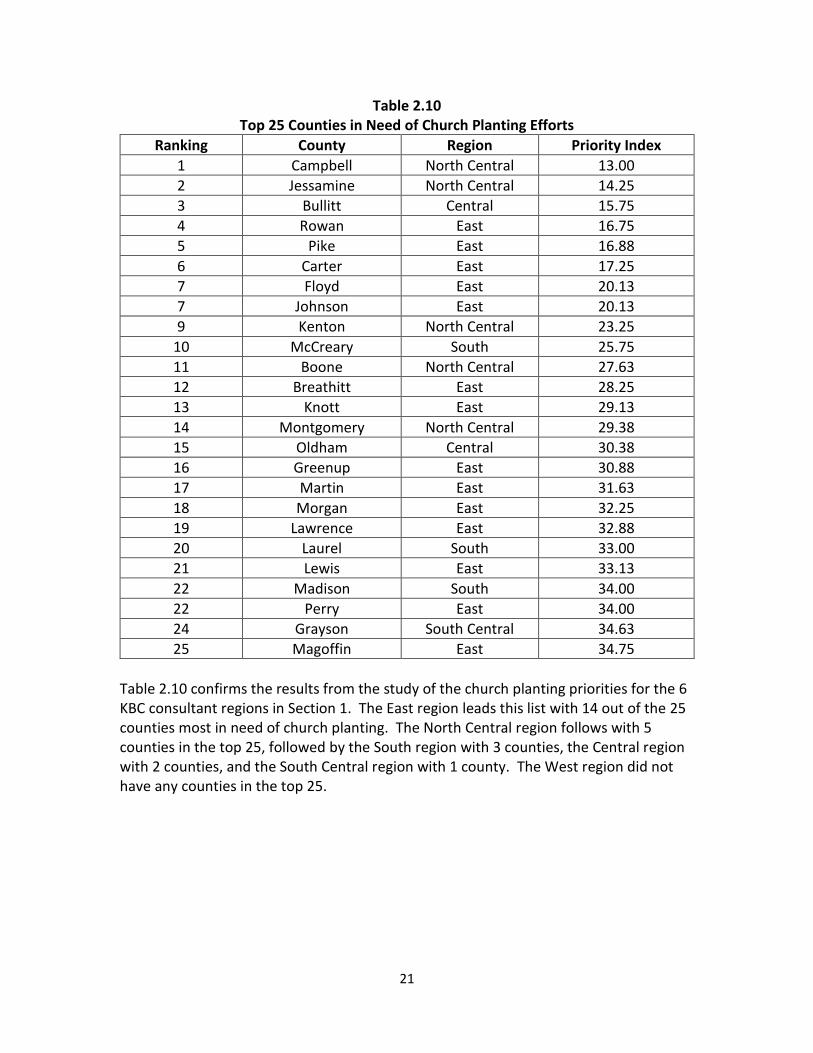
Based upon the data presented in Section 2, a church planting priority index was calculated for each of the 120 counties.5 Table 2.10 reveals the 25 counties that are most in need of church planting efforts. 5 The calculation for the church planting priority index for each county uses the same methodology that was used for the 6 KBC consultant regions presented earlier in this report. Although only the top 25 counties have been displayed in this report, the church planting priority index was calculated for all 120 counties.
21
Table 2.10 Top 25 Counties in Need of Church Planting Efforts
Ranking County Region Priority Index
1 Campbell North Central 13.00
2 Jessamine North Central 14.25
3 Bullitt Central 15.75
4 Rowan East 16.75
5 Pike East 16.88
6 Carter East 17.25
7 Floyd East 20.13
7 Johnson East 20.13
9 Kenton North Central 23.25
10 McCreary South 25.75
11 Boone North Central 27.63
12 Breathitt East 28.25
13 Knott East 29.13
14 Montgomery North Central 29.38
15 Oldham Central 30.38
16 Greenup East 30.88
17 Martin East 31.63
18 Morgan East 32.25
19 Lawrence East 32.88
20 Laurel South 33.00
21 Lewis East 33.13
22 Madison South 34.00
22 Perry East 34.00
24 Grayson South Central 34.63
25 Magoffin East 34.75
Table 2.10 confirms the results from the study of the church planting priorities for the 6 KBC consultant regions in Section 1. The East region leads this list with 14 out of the 25 counties most in need of church planting. The North Central region follows with 5 counties in the top 25, followed by the South region with 3 counties, the Central region with 2 counties, and the South Central region with 1 county. The West region did not have any counties in the top 25.

22
SECTION 3 – SUMMARY
The 2012 Lostness Indicators for Kentucky report was a very enlightening and informative report, and it served as a catalyst for the analysis included in this report. The present analysis has sought to enhance the results of the 2012 study by diving deeper into the available data to discover the spiritual characteristics of Kentuckians in greater detail. The summary findings of this report follow. Population:
The Central region has the most people (1,303,806) while the South region has the fewest people (388,048).
The East region has the most counties (29) while the Central region has the fewest (15).
KBC Churches & Church Plants:
The West region has the most KBC churches (506) while the East region has the fewest (247).
The North Central region has the worst KBC church to population ratio (1:2886) while the South region has the best (1:888).
The Central region has the most KBC-funded church plants (20) while the East region has the fewest (1).
Lostness Indicators (By Percentage):
The East region has the lowest percentage of religious adherents (34.2%) while the West region has the highest (65.0%).
The East region has the lowest percentage of members (25.8%) while the West region has the highest (48.4%).
The East region has the lowest percentage of attenders (10.0%) while the West region has the highest (19.4%).
Nineteen out of the top 25 most lost counties (based upon percentage) are located in the East region.
Lostness Indicators (By Population):
The Central region has the most religious non-adherents (611,505) while the West region has the fewest (166,444).
The Central region has the most non-members (902,291) while the South region has the fewest (225,343).
The Central region has the most non-attenders (1,152,492) while the South region has the fewest (329,497).
The Central & North Central regions have the most counties (7 each) in the top 25 most lost (by population) while the South and West regions have the fewest (2 each).

23
Church Planting Priority Index
The East region ranks #1 on the church planting priority index, followed by the North Central region at #2, and the Central region at #3.
The top 5 counties that have the greatest need for church planting efforts are: #1: Campbell (North Central), #2: Jessamine (North Central), #3: Bullitt (Central), #4: Rowan (East), and #5: Pike (East).
14 out of the top 25 counties that have the greatest need for church planting efforts are located in the East region, followed by 6 in the North Central region. None of the 25 counties identified as having the greatest need for church planting are located in the West region.

24
ABOUT THE AUTHOR Jason Lowe serves as the Director of Missions for the Pike Association of Southern Baptists as well as the Executive Pastor at First Baptist Church in Pikeville, Kentucky. Jason earned a Bachelor of Science degree in Statistics from Eastern Kentucky University in 2001, and a Master of Divinity in Missions and Evangelism from The Southern Baptist Theological Seminary in 2011. With over ten years of experience as a data analyst in the business world, Jason now analyzes issues relevant to the church and the Great Commission in his spare time.