as at october 31, 2018 - rbc.com · ab roy perf clie cap mill our and fun and func ca our fina (bc...
TRANSCRIPT
Royal Pillar
As at O
l Bank
3 Rep
ctober 3
k of Ca
port
31, 2018
anada
8
a
TA
CAU
ABO
CAP
DISC
OVE
KOO
LINK
L
LL
CRE
CCCCCCCCCCC
CCC
COU
CCCCCCCCC
SEC
SSSSS
MAR
MMMMMM
OPE
INTE
Royal Ban
BLE OF CON
UTION REGARD
OUT ROYAL BA
PITAL FRAMEW
CLOSURE MAP
ERVIEW OF KEY
KM1: Key CapitaOVA: Bank risk mOV1: Overview o
KAGES BETWE
LI1: Differences bcategories ...
LI2: Main sourceLIA: Explanations
EDIT RISK .........
CRA: General quCR1: Credit qualCR2: Changes inCRB: Additional dCRC: QualitativeCR3: Credit risk CRD: QualitativeCR4: StandardizeCR5: StandardizeCRE: QualitativeCR6: IRB – Cred
CR6: Memo ICR7: IRB – EffecCR8: RWA flow sCR9: IRB – Back
UNTERPARTY C
CCRA: QualitativCCR1: Analysis oCCR2: Credit valCCR3: StandardCCR4: IRB – CCCCR5: CompositCCR6: Credit deCCR7: RWA flowCCR8: Exposure
CURITIZATION ..
SECA: QualitativSEC1: IRB – SecSEC2: IRB – SecSEC3: SecuritizaSEC4: Securitiza
RKET RISK .......
MRA: QualitativeMRB: QualitativeMR1: Market riskMR2: RWA flow sMR3: IMA valuesMR4: Compariso
ERATIONAL RIS
EREST RATE R
nk of Cana
NTENTS
DING FORWARD
ANK OF CANAD
WORK .................
P .........................
Y METRICS, RIS
al and Leverage mmanagement appof risk weighted a
EEN FINANCIAL
between accoun..........................s of differences bs of differences b
...........................
ualitative informaity of assets ......
n stock of defaultdisclosure relate
e disclosure requmitigation techni
e disclosures on bed approach – ced approach – e disclosures rela
dit risk exposurestem: Retail Insur
ct on RWA of crestatements of crektesting of probab
CREDIT RISK ....
ve disclosure relaof counterparty cluation adjustmeized approach –
CR exposures by tion of collateral frivatives exposu
w statements of Ces to central coun
...........................
ve disclosure reqcuritization exposcuritization exposation exposures iation exposures i
...........................
e disclosure reque disclosures for k under standardstatements of mas for trading portfon of VaR estima
SK ......................
RISK IN THE BAN
ada Pillar 3
D-LOOKING STA
A .......................
..........................
..........................
SK MANAGEME
metrics (at consoproach ...............assets (RWA) ....
L STATEMENTS
ting and regulato..........................between regulatobetween account
..........................
ation about credit..........................ted loans and de
ed to the credit quirements related ques – overviewbanks' use of extredit risk exposuxposures by ass
ated to internal riss by portfolio andred Exposures ...edit derivatives usedit risk exposurebility of default (P
..........................
ated to counterpacredit risk (CCR) nt (CVA) capital CCR exposuresportfolio and PDfor CCR exposurres ....................
CCR exposures unterparties .........
..........................
uirements relatedsures in the banksures in the tradin the banking bon the banking bo
..........................
irements relatedbanks using the ized approach ...arket risk exposufolios .................
ates with gains/lo
..........................
NKING BOOK ..
3 Report
ATEMENTS ......
..........................
..........................
..........................
ENT AND RWA ..
olidated group lev....................................................
AND REGULAT
ory scopes of con..........................ory exposure amting and regulato
..........................
risk .............................................bt securities ......uality of assets ..to credit risk mit
w .........................ternal credit ratin
ure and credit riskset classes and risk-based (IRB) md PD range ...................................sed as CRM teches under IRB .....PD) per portfolio
..........................
arty credit risk ....exposure by appcharge ..............
s by regulatory poD scale ...............re .................................................under the Interna..........................
..........................
d to securitizatioking book ...........ng book ............
ook and associatook and associat
..........................
to market risk ...internal models ..........................ures under an IM..........................sses ..................
..........................
..........................
..........................
..........................
..........................
..........................
..........................
vel) ........................................................................
TORY EXPOSUR
nsolidation and m..........................
mounts and carryiory exposure amo
..........................
..........................
..........................
..........................
..........................tigation technique..........................
ngs under the stak mitigation (CRMisk weights ........
models ...................................................................hniques .................................................................
..........................
..........................proach .........................................ortfolio and risk w..............................................................................
al Model Method ..........................
..........................
n exposures ..........................................................ted regulatory cated capital requir
..........................
..........................approach (IMA) ...........................
MA ...........................................................................
..........................
..........................
..........................
..........................
..........................
..........................
..........................
..........................
..........................
..........................
RES ..................
mapping of finan..........................ing values in finaounts ................
..........................
..........................
..........................
..........................
..........................es ...............................................andardized approM) effects ................................................................................................................................................................................................
..........................
..........................
..........................
..........................weights ............................................................................................ (IMM) ........................................
..........................
..........................
..........................
..........................apital requiremenrements – bank a
..........................
..........................
..........................
..........................
..........................
..........................
..........................
..........................
..........................
..........................
..........................
..........................
..........................
..........................
..........................
..........................
..........................
..........................
cial statement ca..........................ancial statements..........................
..........................
..........................
..........................
..........................
..........................
..........................
..........................oach for credit ris................................................................................................................................................................................................................
..........................
..........................
..........................
..........................
..........................
..........................
..........................
..........................
..........................
..........................
..........................
..........................
..........................
..........................nts – bank actingacting as investo
..........................
..........................
..........................
..........................
..........................
..........................
..........................
..........................
..........................
..........................
..........................
..........................
..........................
..........................
..........................
..........................
..........................
..........................
ategories with re..........................s ..................................................
..........................
..........................
..........................
..........................
..........................
..........................
..........................sk .......................................................................................................................................................................................................................................
..........................
..........................
..........................
..........................
..........................
..........................
..........................
..........................
..........................
..........................
..........................
..........................
..........................
.......................... as originator or
or ........................
..........................
..........................
..........................
..........................
..........................
..........................
..........................
..........................
..........................
Q4 2018
....................... 1
....................... 1
....................... 1
....................... 3
....................... 8
....................... 8
....................... 9
..................... 10
..................... 11
egulatory risk ..................... 11..................... 12..................... 13
..................... 14
..................... 14
..................... 15
..................... 15
..................... 15
..................... 19
..................... 20
..................... 20
..................... 21
..................... 22
..................... 23
..................... 26
.....................29
..................... 30
..................... 30
..................... 31
..................... 34
..................... 34
..................... 35
..................... 35
..................... 35
..................... 36
..................... 37
..................... 37
..................... 37
..................... 38
..................... 39
..................... 39
..................... 40
..................... 41as sponsor .. 42..................... 43
..................... 44
..................... 44
..................... 45
..................... 47
..................... 47
..................... 48
..................... 49
..................... 50
..................... 50

Ca
Fro“safsecCantypi“pronaturiseassreadmatbe frespExcfrom Ab
Royperfcliecapmill OurandFunandfunc Ca
OurFina(BC The
Undexpregurequapp
In JdiscregurequOSFimpfirst
Royal Ban
aution regard
m time to timefe harbour” pr
curities legislatinadian regulatocally identified
oject” and simiure, forward-lo
e to the possibiumptions may ders not to platerially from thefound in the rispect to us, invecept as requiredm time to time b
bout Royal B
yal Bank of Cformance. Our nts thrive and
pitalization, we ion clients in C
r business segd Capital Markenctions. Technod services to octional groups.
apital framew
r consolidated ancial Institutio
CBS).
e Basel III fram
Pillar 1 pfor calcul
Pillar 2 rethe risk p
Pillar 3 eacross ju
der Basel III, bposure types iulatory leveraguirements. Re
proaches. Refe
Credit Ri Counterp Market R Operatio Securitiza
January 2015, cipline through ulatory capitaluirements in thFI mandated t
portant banks (Dt phase of the R
nk of Cana
ding forward
e, we make wrirovisions of theon. We may mors or the SEC
d by words sucilar expressionoking statemenlity that our prenot be correct
ace undue rele expectations sk sections of estors and othd by law, we doby us or on our
Bank of Cana
Canada is a gsuccess come
d communitieshave a divers
Canada, the U.S
gments include ets. Our busineology & Operaour clients, wh
work
regulatory capons (OSFI), wh
ework integrate
prescribes minilating risk-weigequires the estprofile and capienhances the
urisdictions for m
banks use definncluding cred
ge ratio based oefer to the “Car to the followin
sk party Credit RisRisk nal Risk ation Exposure
the BCBS pubregulatory dis
l including ouhe areas of crethe domestic iD-SIBs) for theRevised Standa
ada Pillar 3
d-looking sta
itten or oral fore United State
make forward-loC, in other repch as “believe”ns of future or nts require us edictions, forect and that our iance on thesexpressed in sour 2018 Annuers should caro not undertaker behalf.
ada
global financiaes from the 84, prosper. As
sified business S. and 34 other
Personal & Cess segments ations provides ile Functions i
pital requiremeich are based
es three “Pillar
imum capital reghted assets (Rtablishment of tal adequacy oconsistency a
market particip
ned approacheit, counterparton OSFI’s Levapital manageng sections in t
sk
es
blished the “Resclosure requireur methodologdit risk, countemplementation
e reporting perioards.
3 Report
atements
rward-looking ses Private Secooking statemeports to shareh”, “expect”, “foconditional ve
to make assumcasts, projectiofinancial perfoe statements such forward-loual Report. Wrefully considere to update an
al institution w,000+ employeCanada’s bigmodel with a
r countries.
Commercial Banare supported the technolog
includes our fi
ents are determon the Basel I
s” to establish
equirements aRWA);
internal assessof banks; and comparabipants through m
es to calculate ty credit, mark
verage Requireement” sectionthis report for fu
evised Pillar 3 ements. The R
gies used in erparty credit rin of the first pod ending Octo
statements witcurities Litigati
ents in this Pillaholders and in oresee”, “forecaerbs such as “mptions and arons, expectatiormance and mas a number
ooking statemeWhen relying on
r these risk facy forward-look
with a purposeees who bring ogest bank, anfocus on inno
nking, Wealthby Corporate Sical and operanance, human
mined by guideII framework a
a robust found
nd addresses
sment process
lity of risk andmeaningful disc
their minimumket, operationments (LR) Gu
n of our 2018urther informat
Disclosure ReRevised Standacalculating cask and securiti
phase of the Rober 31, 2018.
hin the meaninion Reform Acar 3 Report, ouother commun
ast”, “anticipate“will”, “may”, “sre subject to inons or conclusimanagement ob
of risk factorsents. Additionan our forward-loctors as well asing statement,
e-driven, princour vision, valund one of the
ovation and pro
Management,Support, whichational foundatin resources, ri
elines issued badopted by the
dation for banki
capital adequa
ses and superv
d capital profilclosures.
m regulatory caal, and securuideline, which Annual Repotion on the resp
equirements” (ards require c
apital requiremization activitie
Revised Stand This Pillar 3 re
ng of certain sct of 1995 andur 2018 Annualnications. Forwe”, “intend”, “eshould”, “could
nherent risks aons will not probjectives will ns could cause al information aooking statemes other uncertawhether writte
ciples-led apprues and stratege largest in thoviding excepti
Insurance, Inv consists of Teion required tosk manageme
by the Office oBasel Commit
ing supervision
acy, including
visory review to
les between b
pital required tritizations expoh reflects the Bort for further pective approa
(Revised Standomprehensive
ments institutees are replacedards for Canaeport provides
ecurities laws,d any applical Report, in oth
ward-looking stestimate”, “goad” or “would”. nd uncertaintieove to be accuot be achievedour actual re
about certain risents to make dainties and poten or oral, that
roach to delivgy to life so wehe world baseional experienc
vestor & Treasechnology & Oo effectively deent, internal au
of the Superintttee on Banking
n and financial
standards
o evaluate
banks and
to support variosures. We dCBS Basel III information o
ches:
dards) to encodisclosure of
d under Pillad by the Reviseadian domesticdisclosures ref
Q4 2018
1
including the ble Canadian
her filings with tatements are al”, “plan” and
By their very es, which give urate, that our d. We caution sults to differ sk factors can decisions with tential events. may be made
vering leadinge can help oured on market ces to our 16
sury Services,perations andliver products
udit and other
endent of the g Supervision
stability:
ous risks and determine our leverage ratio
on calculation
ourage market our risks and r 1. Existing ed Standards. c systemically flective of this

Ca
In M– coBasdatefurth
Royal Ban
apital framew
March 2017, thonsolidated ansel III framewoe for the BCBSher information
nk of Cana
work (continu
e BCBS issuedd enhanced frark, including thS phase two dn on other upco
ada Pillar 3
ued)
d its second phamework”. The
he leverage andisclosure requ
oming regulato
3 Report
hase of the Pille disclosure stad liquidity ratioirements. Refery reforms.
lar 3 disclosureandard consoli
os disclosure teer to the “Capit
e requirementsidates all existemplates. OSFtal manageme
s entitled, “Pillating Pillar 3 disFI has not yet rent” section of
ar 3 disclosure sclosure requirereleased the imour 2018 Annu
Q4 2018
2
requirements ements of the
mplementation ual Report for
DI
Re
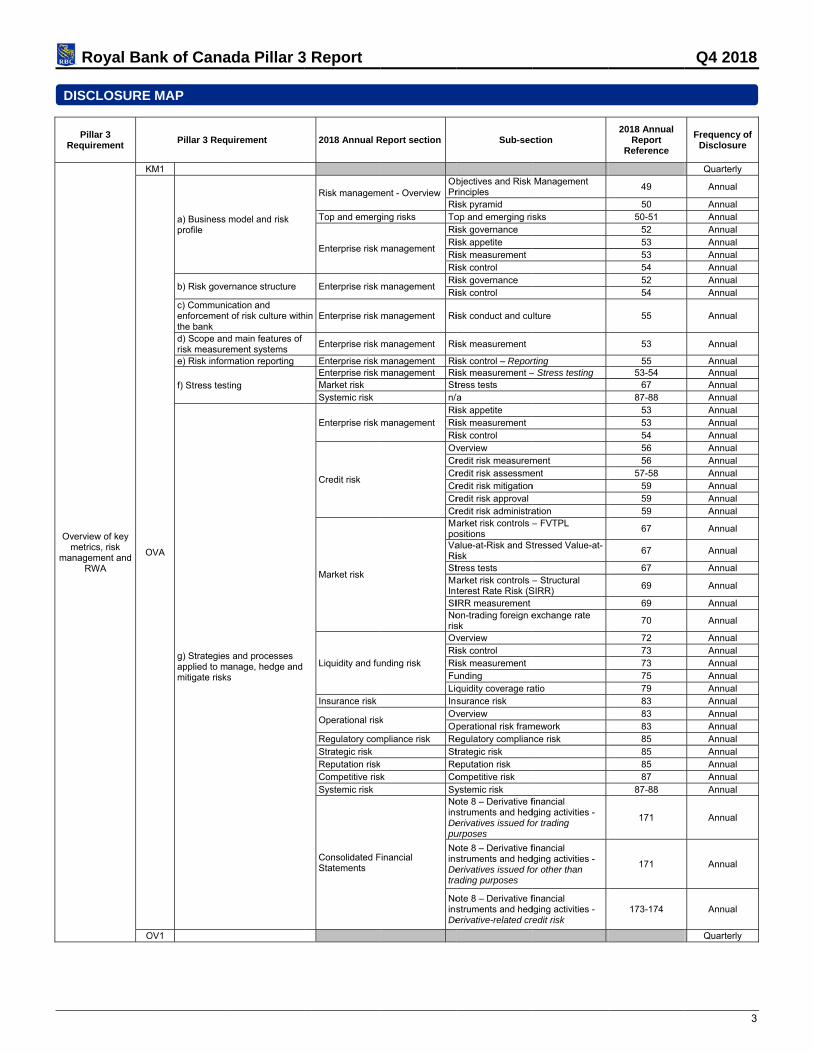
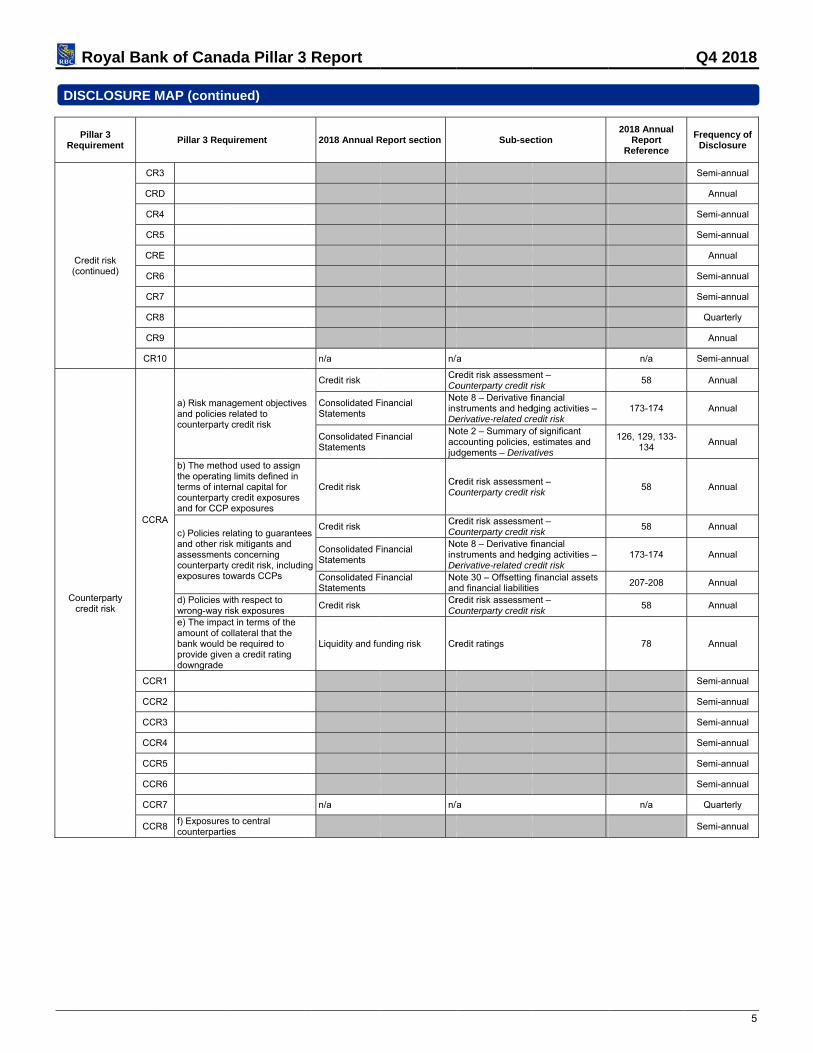
Ovem
man
Royal Ban
ISCLOSURE
Pillar 3 equirement
erview of key metrics, risk nagement and
RWA
K
O
O
nk of Cana
MAP
Pillar 3 Req
M1
VA
a) Business profile
b) Risk gove
c) Communicenforcementthe bank d) Scope andrisk measuree) Risk inform
f) Stress test
g) Strategiesapplied to mmitigate risks
OV1
ada Pillar 3
uirement
model and risk
ernance structure
cation and t of risk culture with
d main features of ement systems mation reporting
ting
s and processes anage, hedge and s
3 Report
2018 Annual R
Risk managem
Top and emerg
Enterprise risk
Enterprise risk
hin Enterprise risk
Enterprise risk
Enterprise risk Enterprise risk Market risk Systemic risk
Enterprise risk
Credit risk
Market risk
Liquidity and fu
Insurance risk
Operational risk
Regulatory comStrategic risk Reputation riskCompetitive risSystemic risk
Consolidated FStatements
Report section
ent - OverviewObPrRi
ging risks To
management
RiRiRiRi
management RiRi
management Ri
management Ri
management Rimanagement Ri
Stn/
management RiRiRiOvCrCrCrCrCrMapoVaRiStMaIntSINoris
unding risk
OvRiRiFuLiqIns
k OvOp
mpliance risk ReSt
k Rek Co
Sy
Financial
NoinsDepu
NoinsDetra
NoinsDe
Sub-sec
bjectives and Risk rinciples isk pyramid op and emerging risisk governance isk appetite isk measurement isk control isk governance isk control
isk conduct and cu
isk measurement
isk control – Reporisk measurement –tress tests /a isk appetite isk measurement isk control verview redit risk measuremredit risk assessmeredit risk mitigationredit risk approvalredit risk administraarket risk controls –ositions alue-at-Risk and Stisk tress tests arket risk controls –terest Rate Risk (SIRR measurementon-trading foreign esk verview isk control isk measurement unding quidity coverage rasurance risk verview perational risk framegulatory compliantrategic risk eputation risk ompetitive risk ystemic risk ote 8 – Derivative fstruments and hederivatives issued fourposes
ote 8 – Derivative fstruments and hederivatives issued foading purposes
ote 8 – Derivative fstruments and hederivative-related cr
ction
Management
sks
lture
rting – Stress testing
ment ent n
ation – FVTPL
tressed Value-at-
– Structural SIRR)
exchange rate
atio
mework nce risk
financial dging activities - or trading
financial dging activities - or other than
financial dging activities - redit risk
2018 Annual Report
Reference
49
50 50-51
52 53 53 54 52 54
55
53
55 53-54
67 87-88
53 53 54 56 56
57-58 59 59 59
67
67
67
69
69
70
72 73 73 75 79 83 83 83 85 85 85 87
87-88
171
171
173-174
Q4 2018
3
Frequency of Disclosure
Quarterly
Annual
Annual Annual Annual Annual Annual Annual Annual Annual
Annual
Annual
Annual Annual Annual Annual Annual Annual Annual Annual Annual Annual Annual Annual Annual
Annual
Annual
Annual
Annual
Annual
Annual
Annual Annual Annual Annual Annual Annual Annual Annual Annual Annual Annual Annual Annual
Annual
Annual
Annual
Quarterly

DI
Re
Linka
stare
C
Royal Ban
ISCLOSURE
Pillar 3 equirement
ages between financial tements and regulatory exposures
L
L
L
Credit risk
C
C
C
C
C
nk of Cana
MAP (contin
Pillar 3 Req
LI1
LI2
LIA
RA
a) Translatiomodel into ththe bank’s cr
b) Criteria anfor defining cmanagemensetting credit
c) Structure the credit riscontrol funct
d) Interactionrisk managecompliance afunctions
e) Scope andreporting on to the executand to the bo
R1
R2
RB
a) The scope“past due” anexposures upurposes anany, betweenpast due andaccounting apurposes. b) The extenexposures (mthat are not cimpaired andthis.
c) Descriptiofor determini
d) The bank’restructured
RC
a) Core featuprocesses foof the extentmakes use obalance shee
b) Core featuprocesses foevaluation an
c) Informatiocredit risk cothe credit risinstruments
ada Pillar 3
nued)
uirement
on of the business he components of redit risk profile
nd approach used credit risk t policy and for t risk limits
and organization ok management andion
n between the credment, risk control, and internal audit
d content of the credit risk exposurtive management oard of directors
e and definitions ofnd “impaired” sed for accounting d the differences, in the definition of d default for and regulatory
nt of past-due more than 90 days)considered to be d the reasons for
on of methods useding impairments.
’s own definition of exposure.
ures of policies andor, and an indicationt to which the bank of, on– and off–et netting
ures of policies andor collateral nd management
on about market or oncentrations underk mitigation used
3 Report
2018 Annual R
Credit risk
Enterprise risk
Credit risk
f d Enterprise risk
dit
Enterprise risk
re Enterprise risk
f
f Consolidated FStatements
) Consolidated FStatements
d Consolidated FStatements
a Consolidated FStatements
d n
Credit risk
Consolidated FStatements
Consolidated FStatements
d Credit risk
r Credit risk
Consolidated FStatements
Report section
Ov
Gr
management
Ri
Ri
Ri
Ri
Ov
Cr
Cr
Cr
management Ri
Ri
management Ri
management Ri
Ri
Financial
NoacjudDeCr(S
Financial NoacjudDe
Financial NoacjudAl
Financial NoacjudMo
Co
Financial NoinsDe
Financial Noan
Cr
Cr
Cr
Financial Noins
Sub-sec
verview
ross credit risk exp
isk governance
isk appetite
isk measurement
isk control - Author
verview
redit risk assessme
redit risk mitigation
redit risk approval
isk governance
isk control
isk governance
isk governance
isk control - Report
ote 2 – Summary occounting policies, dgments - efinition of defaultredit impaired finan
Stage 3)
ote 2 – Summary occounting policies, dgments - efinition of default
ote 2 – Summary occounting policies, dgments - llowance for credit ote 2 – Summary occounting policies, dgments -
Modifications
ounterparty credit r
ote 8 – Derivative fstruments and hederivative-related crote 30 – Offsetting nd financial liabilitie
redit risk mitigation
redit risk mitigation
redit risk approval -
ote 8 – Derivative fstruments and hed
ction
posure
rities and limits
ent
n
ting
of significant estimates and
ncial assets
of significant estimates and
of significant estimates and
losses of significant estimates and
risk
financial dging activities – redit risk
financial assets es
n - Collateral
n
- Credit risk limits
financial dging activities
2018 Annual Report
Reference
56
57
52
53
53
55
56
57-58
59
59
52
54
52
52
55
125
125
123-126, 129
126
58
173-174
207-208
59
59
59
170-178
Q4 2018
4
Frequency of Disclosure
Annual
Annual
Annual
Annual
Annual
Annual
Annual
Annual
Annual
Annual
Annual
Annual
Annual
Annual
Annual
Annual
Annual
Annual
Semi-annual
Semi-annual
Annual
Annual
Annual
Annual
Annual
Annual
Annual
Annual
Annual
Annual
Annual
DI
Re
C(c
Coc
Royal Ban
ISCLOSURE
Pillar 3 equirement
Credit risk continued)
C
C
C
C
C
C
C
C
C
CR
ounterparty credit risk
CC
CC
CC
CC
CC
CC
CC
CC
CC
nk of Cana
MAP (contin
Pillar 3 Req
R3
RD
R4
R5
RE
R6
R7
R8
R9
R10
CRA
a) Risk manaand policies counterparty
b) The methothe operatingterms of intecounterpartyand for CCP
c) Policies reand other risassessmentscounterpartyexposures to
d) Policies wwrong-way re) The impacamount of cobank would bprovide givendowngrade
CR1
CR2
CR3
CR4
CR5
CR6
CR7
CR8 f) Exposurescounterpartie
ada Pillar 3
nued)
uirement
agement objectivesrelated to
y credit risk
od used to assign g limits defined in rnal capital for
y credit exposures exposures
elating to guaranteesk mitigants and s concerning y credit risk, includinowards CCPs
with respect to isk exposures ct in terms of the ollateral that the be required to n a credit rating
s to central es
3 Report
2018 Annual R
n/a
s
Credit risk
Consolidated FStatements
Consolidated FStatements
Credit risk
es
ng
Credit risk
Consolidated FStatements
Consolidated FStatements
Credit risk
Liquidity and fu
n/a
Report section
n/
CrCo
Financial NoinsDe
Financial Noacjud
CrCo
CrCo
Financial NoinsDe
Financial NoanCrCo
unding risk Cr
n/
Sub-sec
/a
redit risk assessmeounterparty credit rote 8 – Derivative fstruments and hederivative-related crote 2 – Summary occounting policies, dgements – Deriva
redit risk assessmeounterparty credit r
redit risk assessmeounterparty credit rote 8 – Derivative fstruments and hederivative-related crote 30 – Offsetting nd financial liabilitieredit risk assessmeounterparty credit r
redit ratings
/a
ction
ent – risk financial
dging activities – redit risk of significant estimates and
atives
ent – risk
ent – risk financial
dging activities – redit risk
financial assets es ent – risk
2018 Annual Report
Reference
n/a
58
173-174
126, 129, 133-134
58
58
173-174
207-208
58
78
n/a
Q4 2018
5
Frequency of Disclosure
Semi-annual
Annual
Semi-annual
Semi-annual
Annual
Semi-annual
Semi-annual
Quarterly
Annual
Semi-annual
Annual
Annual
Annual
Annual
Annual
Annual
Annual
Annual
Annual
Semi-annual
Semi-annual
Semi-annual
Semi-annual
Semi-annual
Semi-annual
Quarterly
Semi-annual

DI
Re
Se
M
Royal Ban
ISCLOSURE
Pillar 3 equirement
ecuritization
SE
SE
SE
SE
SE
Market risk M
nk of Cana
MAP (contin
Pillar 3 Req
ECA
a) Objectivessecuritization
b) List of SPsponsor / prosupport
c) Accountinsecuritization
d) the namesassessment used for sectypes of secufor which eac
e) Use of Bapurposes
f) Use of othassessment
EC1 Securitizatiobanking boo
EC2 Securitizatiotrading book
EC3
Securitizatiobanking booregulatory cabank acting asponsor
EC4
Securitizatiobanking boocapital requiracting as inv
RA
a) Processesidentify, meacontrol the b
Policies for hstrategies/prmonitoring theffectiveness
b) Descriptiogovernance established tstrategies anbank
Description oand the commechanismsdifferent partmarket risk m
ada Pillar 3
nued)
uirement
s in relation to n activities
Es where RBC is ovides implicit
g policies for n
s of external credit institution (ECAIs) uritizations and theuritization exposurech agency is used
asel IAA for capital
er internal for capital purposen exposures in the k n activities in the
k n exposures in the k and associated apital requirementsas originator or as
n exposures in the k and associated rements - bank
vestor
s implemented to asure, monitor and ank’s market risks
hedging risk and rocesses for he continuing s of hedges
on of the market risstructure to implement the nd processes of the
of the relationshipsmunication
s between the ties involved in management
3 Report
2018 Annual R
Off-balance shearrangementsConsolidated FStatements Consolidated FStatements
Consolidated FStatements
Consolidated FStatements
Critical accountand estimates
e e
Capital Manage(also refer to Cdocument)
Credit risk
Capital Manage
es Credit risk
s -
Market risk
Consolidated FStatements
k
e Enterprise risk
Enterprise risk
Report section
eet Of
Financial Noas
Financial No
Financial No
Financial
Noacjud
Noacjudfin
ting policies Co
ement RD in this
Rese
n/
ement Rese
Cr
MapoStMapoMaFVliaMaInt
SI
MaIntMama
Financial Noacjud
management
Ri
Ri
Ri
Ri
St
Ri
management
Ri
Ri
Sub-sec
ff-balance sheet ar
ote 6 – Derecognitissets
ote 7 – Structured
ote 7 – Structured
ote 2 – Summary occounting policies, dgments – Basis o
ote 2 – Summary occounting policies, dgments – Derecognancial assets
onsolidation of stru
egulatory capital apecuritization exposu
/a
egulatory capital apecuritization exposu
redit risk assessme
arket risk controls –ositions tress Tests arket risk measureositions arket risk measureVTPL positions – Aabilities of RBC Insuarket risk controls –terest Rate Risk (S
IRR measurement
arket risk measureterest Rate Sensitiarket risk measureaterial non-trading
ote 2 – Summary occounting policies, dgements – Hedge
isk Governance
isk Appetite
isk Measurement
isk Control
tress Testing
isk Conduct and Cu
isk governance
isk Control
ction
rrangements
ion of financial
entities
entities
of significant estimates and
of consolidation
of significant estimates and gnition of
uctured entities
pproach for ures
pproach for ures
ent
– FVTPL
es – FVTPL
es for other Assets and urance – Structural
SIRR) positions
es – Structural vities
es for other portfolios
of significant estimates and
e accounting
ulture
2018 Annual Report
Reference
47-49
166
167-170
167-170
121-122
133
102
98-99
56-59
98-99
57-58
67
67
68
69
69
69
69
70
134
52
53
53
54
53-54
55
52
54
Q4 2018
6
Frequency of Disclosure
Annual
Annual
Annual
Annual
Annual
Annual
Annual
Annual
Annual
Annual
Annual
Semi-annual
Semi-annual
Semi-annual
Semi-annual
Annual
Annual
Annual
Annual
Annual
Annual
Annual
Annual
Annual
Annual
Annual
Annual
Annual
Annual
Annual
Annual
Annual
DI
Re
M(c
Royal Ban
ISCLOSURE
Pillar 3 equirement
Market risk continued)
M(cont
M
M
M
M
M
Operational risk
Interest rate risk i
nk of Cana
MAP (contin
Pillar 3 Req
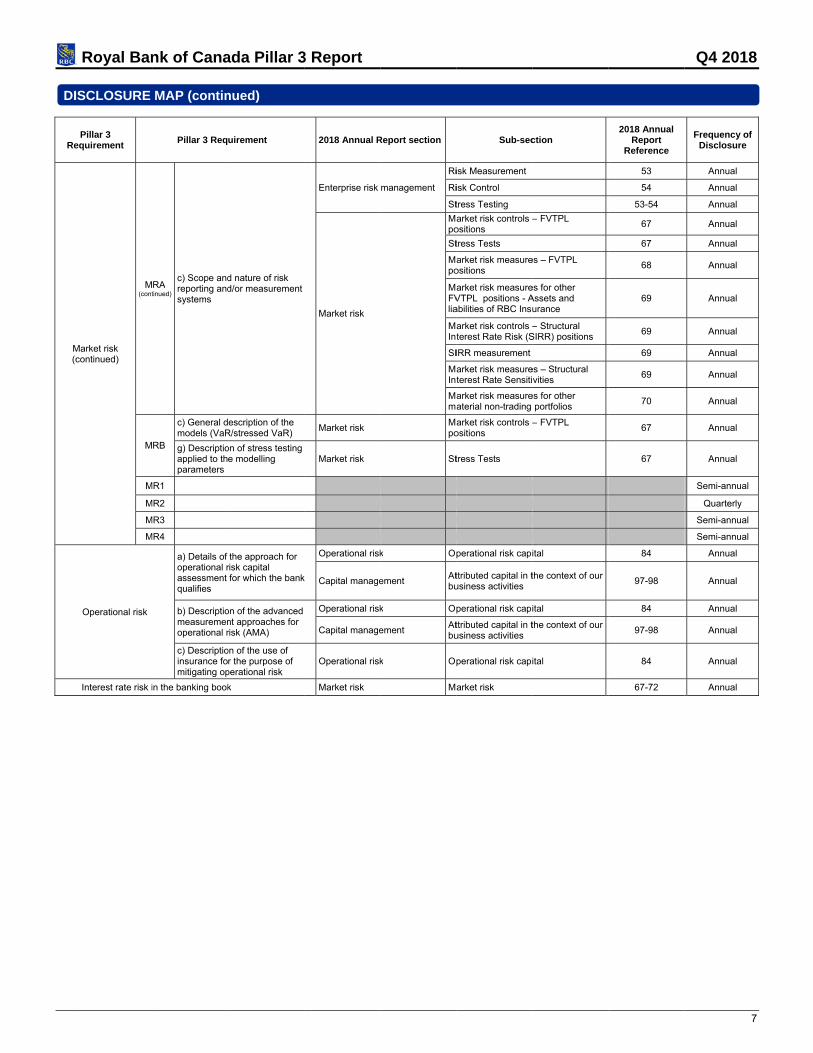
RA tinued)
c) Scope andreporting andsystems
RB
c) General dmodels (VaR
g) Descriptioapplied to thparameters
MR1 MR2
MR3
MR4
a) Details of operational rassessment qualifies
b) Descriptiomeasuremenoperational r
c) Descriptioinsurance fomitigating op
in the banking book
ada Pillar 3
nued)
uirement
d nature of risk d/or measurement
escription of the R/stressed VaR)
on of stress testing e modelling
the approach for risk capital for which the bank
on of the advanced nt approaches for risk (AMA)
on of the use of r the purpose of
perational risk
k
3 Report
2018 Annual R
Enterprise risk
Market risk
Market risk
Market risk
k
Operational risk
Capital manage
Operational risk
Capital manage
Operational risk
Market risk
Report section
management
Ri
Ri
St
Mapo
St
Mapo
MaFVlia
MaInt
SI
MaInt
Mama
Mapo
St
k Op
ement Atbu
k Op
ement Atbu
k Op
Ma
Sub-sec
isk Measurement
isk Control
tress Testing
arket risk controls –ositions
tress Tests
arket risk measureositions
arket risk measureVTPL positions - Aabilities of RBC Insu
arket risk controls –terest Rate Risk (S
IRR measurement
arket risk measureterest Rate Sensiti
arket risk measureaterial non-trading
arket risk controls –ositions
tress Tests
perational risk capi
ttributed capital in tusiness activities
perational risk capi
ttributed capital in tusiness activities
perational risk capi
arket risk
ction
– FVTPL
es – FVTPL
es for other Assets and urance
– Structural SIRR) positions
es – Structural vities
es for other portfolios
– FVTPL
ital
the context of our
ital
the context of our
ital
2018 Annual Report
Reference
53
54
53-54
67
67
68
69
69
69
69
70
67
67
84
97-98
84
97-98
84
67-72
Q4 2018
7
Frequency of Disclosure
Annual
Annual
Annual
Annual
Annual
Annual
Annual
Annual
Annual
Annual
Annual
Annual
Annual
Semi-annual
Quarterly
Semi-annual
Semi-annual
Annual
Annual
Annual
Annual
Annual
Annual

OV
KM
1
2
3
4
5
6
7
8
9
10
11
12
13
14 1 8%
Royal Ban
VERVIEW OF
M1: Key Cap
(Millions of Cana
Available capi
Common Equit
Tier 1
Total capital
Risk-weighted
Total risk-weig
Risk-based ca
Common Equit
Tier 1 ratio
Total capital ra
Additional CE
Capital conserv
Countercyclica
Bank G-SIB an
Total of bank C
CET1 available
Basel III levera
Total Basel III l
Basel III levera
reflects minimum ca
nk of Cana
F KEY METR
pital and Leve
dian dollars)
ital (amounts)
ty Tier 1 (CET1)
d assets (amount
hted assets (RWA
apital ratios as a
ty Tier 1 ratio
atio
ET1 buffer require
vation buffer requ
al buffer requireme
nd/or D-SIB additio
CET1 specific buff
e after meeting the
age ratio
leverage ratio exp
age ratio (row 2 / r
apital requirements w
ada Pillar 3
RICS, RISK M
erage metric
ts)
A)
percentage of R
ements as a perc
irement
ent
onal requirements
fer requirements (
e bank's minimum
posure measure
row 13)
which includes D-SIB
3 Report
MANAGEMEN
cs (at consoli
RWA
centage of RWA
s
row 8 + row 9 + ro
m capital requirem
B/G-SIB surcharge. R
NT AND RWA
idated group
ow 10)
ents (row 5 - 8%)
Refer to our Capital
A
p level)
)1
Management sectio
a
October 31
2018
57,001
63,279
72,494
496,459
11.5%
12.8%
14.6%
2.5%
-
1.0%
3.5%
3.5%
1,450,769
4.4%
n of our 2018 Annua
b
July 31
2018
55,054
61,332
70,525
498,896
11.1%
12.3%
14.1%
2.5%
-
1.0%
3.5%
3.1%
1,413,899
4.3%
al Report
Q4 2018
8
c
Change
1,947
1,947
1,969
(2,437)
0.4%
0.5%
0.5%
0.4%
36,870
0.1%

OV
Theincohttp
a)
b)
c)
d)
e)
f)
g)
Royal Ban
VA: Bank ris
e table below porporated by rp://www.rbc.com
Pillar 3 disclos
Business model
Risk governance
Communication culture within the
Scope and mainmeasurement syRisk information
Stress testing
Strategies and pmanage, hedge
nk of Cana
sk manageme
presents an ovreference into m/investorrelat
sures requireme
and risk profile
e structure
and enforcement e bank
features of risk ystems
reporting
processes applied and mitigate risks
ada Pillar 3
ent approach
verview of Pillathis Pillar 3
ions
nt RBC
Risk ma
Top and
Enterpr
Enterpr
of risk Enterpr
Enterpr
EnterprEnterprMarket System
to s
Enterpr
Credit r
Market
Liquidity
Insuran
Operatio
RegulatStrategiReputatCompetSystem
Consoli
3 Report
h
r 3 disclosure report. Our 2
C 2018 Annual Re
anagement overvi
d emerging risks
ise risk managem
ise risk managem
ise risk managem
ise risk managem
ise risk managemise risk managemrisk ic risk
ise risk managem
isk
risk
y and funding risk
ce risk
onal risk
tory compliance riic risk tion risk titive risk ic risk
dated Financial S
requirements 2018 Annual R
eport section
ew
ment
ment
ment
ment
ment ment
ment
k
sk
Statements
that have beeReport is avai
Objectives and RRisk pyramid Top and emerginRisk governanceRisk appetite Risk measuremeRisk control Risk governanceRisk control
Risk conduct an
Risk measureme
Risk control – RRisk measuremeStress tests n/a Risk appetite Risk measuremeRisk control Overview Credit risk measCredit risk assesCredit risk mitigaCredit risk approCredit risk adminMarket risk contValue-at-Risk anStress tests Market risk contpositions SIRR measuremNon-trading foreOverview Risk control Risk measuremeFunding Liquidity coveragInsurance risk Overview Operational risk Regulatory compStrategic risk Reputation riskCompetitive riskSystemic risk Note 8 - DerivatiDerivatives issueNote 8 - DerivatiDerivatives issueNote 8 - DerivatiDerivative-relate
n met within oilable free of
Sub-se
Risk Managemen
ng risks e
ent
e
d culture
ent
Reporting ent – Stress testin
ent
surement ssment ation oval nistration rols – FVTPL posnd Stressed Value
rols – Structural In
ment eign exchange rate
ent
ge ratio
framework pliance risk
k
ive financial instrued for trading purpive financial instrued for other-than-ive financial instru
ed credit risk
our 2018 Annuacharge on ou
ection
t Principles
ng
sitions e-at-Risk
nterest Rate Risk
e risk
uments and hedgirposes
uments and hedgi-trading purposesuments and hedgi
Q4 2018
9
al Report andur website at
(SIRR)
ng activities –
ng activities –
ng activities –
OV
The
1
2
3
4
4a
4b
5
6
7
8
9
10
11
12
12a
13
14
15
16
17
18
19
20
21
22
23
24
25 1 Amoamou2 Amo3 Amo
Royal Ban
V1: Overview
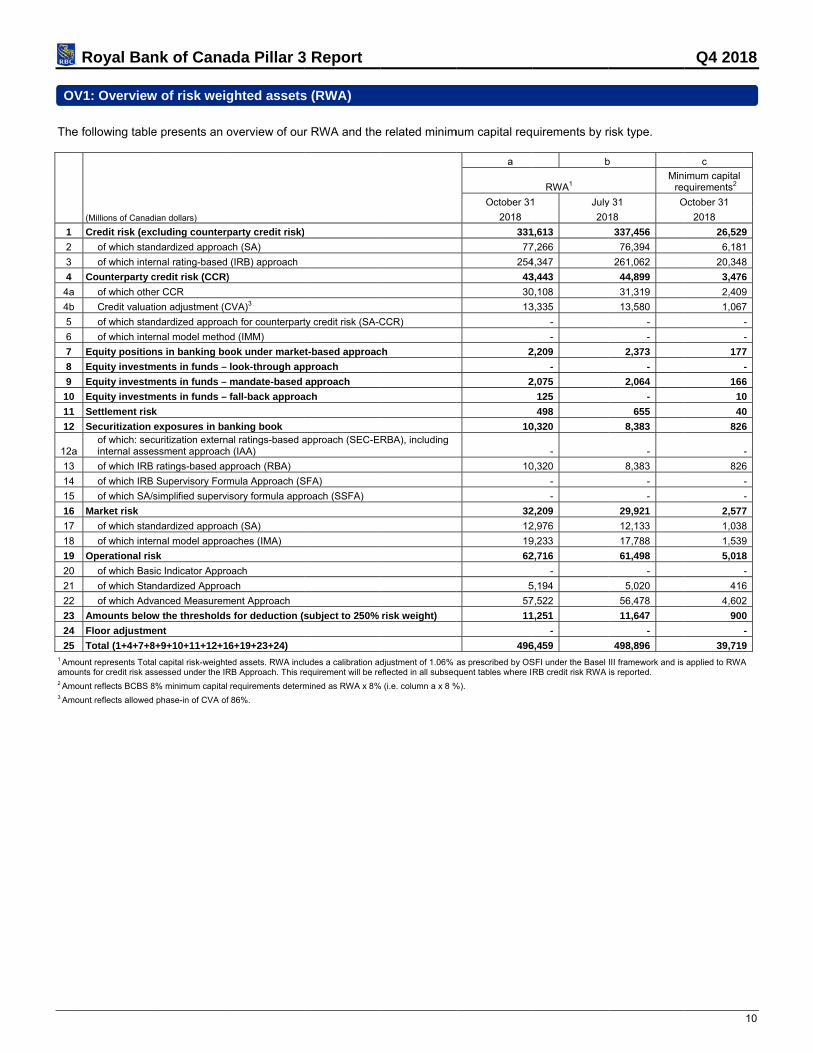
e following table
(Millions of Canad
Credit risk (ex
of which stan
of which inte
Counterparty c
of which othe
Credit valuat
of which stan
of which inte
Equity positio
Equity investm
Equity investm
Equity investm
Settlement ris
Securitization
a of which: secinternal asse
of which IRB
of which IRB
of which SA/
Market risk
of which stan
of which inte
Operational ris
of which Bas
of which Sta
of which Adv
Amounts below
Floor adjustme
Total (1+4+7+8
ount represents Totaunts for credit risk as
ount reflects BCBS 8
ount reflects allowed
nk of Cana
w of risk weig
e presents an o
dian dollars)
cluding counterp
ndardized approac
ernal rating-based
credit risk (CCR)
er CCR
tion adjustment (C
ndardized approac
ernal model metho
ns in banking bo
ments in funds –
ments in funds –
ments in funds –
k
exposures in bacuritization externessment approach
B ratings-based ap
B Supervisory Form
/simplified supervi
ndardized approac
ernal model approa
sk
sic Indicator Appro
ndardized Approa
vanced Measurem
w the thresholds
ent
8+9+10+11+12+1
al capital risk-weightessessed under the IR
8% minimum capital
d phase-in of CVA of
ada Pillar 3
ghted assets
overview of our
party credit risk)
ch (SA)
(IRB) approach
)
CVA)3
ch for counterpart
od (IMM)
ook under marke
look-through ap
mandate-based
fall-back approa
anking book
al ratings-based ah (IAA)
pproach (RBA)
mula Approach (S
isory formula appr
ch (SA)
aches (IMA)
oach
ach
ment Approach
s for deduction (s
6+19+23+24)
ed assets. RWA inclRB Approach. This re
requirements determ
f 86%.
3 Report
s (RWA)
r RWA and the
ty credit risk (SA-C
et-based approac
pproach
approach
ach
approach (SEC-E
SFA)
roach (SSFA)
subject to 250%
udes a calibration adequirement will be re
mined as RWA x 8%
e related minim
CCR)
ch
RBA), including
risk weight)
djustment of 1.06% eflected in all subseq
% (i.e. column a x 8 %
mum capital req
a
October 31
2018
331
77
254
43
30
13
2
2
10
10
32
12
19
62
5
57
11
496
as prescribed by OSquent tables where I
%).
uirements by r
b
RWA1
1 July
20
1,613
7,266
4,347
3,443
0,108
3,335
-
-
2,209
-
2,075
125
498
0,320
-
0,320
-
-
2,209
2,976
9,233
2,716
-
5,194
7,522
1,251
-
6,459
SFI under the Basel RB credit risk RWA
risk type.
b
Min req
y 31 O
18
337,456
76,394
261,062
44,899
31,319
13,580
-
-
2,373
-
2,064
-
655
8,383
-
8,383
-
-
29,921
12,133
17,788
61,498
-
5,020
56,478
11,647
-
498,896
III framework and is is reported.
Q4 2018
10
c
imum capital quirements2
October 31
2018
26,529
6,181
20,348
3,476
2,409
1,067
-
-
177
-
166
10
40
826
-
826
-
-
2,577
1,038
1,539
5,018
-
416
4,602
900
-
39,719
applied to RWA

LI
LIsta
Thewithfina As a
(MillioAsseCasInterSecu
TIn
AsseagreLoan
RW
A
SegOthe
CDPGOO
TotaLiabDep
PBB
SegOthe
AOOreDInO
SubTotaEqu
PCRO
NonTotaTota1 Colu2 Der
Royal Ban
NKAGES BE
1: Differencatement cate
e following tablh International ancial statemen
at October 31, 201
ons of Canadian dolets h and due from brest-bearing depurities rading
nvestment, net of a
ets purchased ueements and secns
Retail Wholesale
Allowance for loan
regated fund neter
Customers' liabilityDerivatives2
remises and equiGoodwill Other intangibles Other assets
al assets2 bilities and equityposits
ersonal usiness and goveank
regated fund neter
Acceptances Obligations relatedObligations relatedepurchase agreem
Derivatives2 nsurance claims a
Other liabilities
ordinated debenal liabilities2 ity attributable toreferred shares
Common shares Retained earnings Other components
n-controlling inteal equity
al liabilities and e
umn c to g reflect a f
rivative assets and lia
nk of Cana
ETWEEN FINA
es between egories with
e provides the Financial Rep
nts into regulato
18
lars)
banks posits with banks
applicable allowa
nder reverse repcurities borrowed
losses
t assets
y under acceptanc
pment, net
y
ernment
t liabilities
to securities sold to assets sold un
ments and securiti
and policy benefit l
ntures
o shareholders
of equity
rests
equity2
further breakout of c
abilities are subject t
ada Pillar 3
ANCIAL STA
accountingregulatory r
differences beorting Standarory risk categor
Cva
repf
sta
s
nce
purchase d
ces
1
d short nder es loaned
liabilities
1
1
olumn b by providing
to both counterparty
3 Report
ATEMENTS A
g and regularisk categorie
etween carryingrds (IFRS) andries.
a
Carrying alues as ported in ublished inancial atements
Cavalue
scoregu
conso
30,209 36,471
128,258 1
94,608 222,866 2
294,602 2
399,452 3180,278 1579,730 5
(2,912)576,818 5
1,368
15,641 94,039 2,832
11,137 4,687
44,064 172,400 1
1,334,734 1,3
270,154 2534,371 5
32,521 837,046 8
1,368
15,662 32,247
206,814 290,238 10,000 52,273
407,234 39,131
1,254,779 1,2
6,309 17,617 51,112 4,823
79,86194
79,9551,334,734 1,3
g the respective CAR
credit risk and mark
AND REGULA
atory scopeses
g values presed our regulatory
b c
rrying es under ope of ulatory olidation
Subjeccredit framew
30,207 3036,471 36
120,162
92,555 79212,717 8
294,602
399,167 389178,280 166577,447 556
(2,912)574,535 556
-
15,641 1594,125 2,829 2
11,137 4,603
45,480 37173,815 56322,347 759
270,154 534,492
32,521 837,167
-
15,662 32,247
206,814 90,238
- 51,077
396,038 9,131
242,336
6,309 17,617 51,114 4,877
79,91794
80,011322,347
R guideline framewo
ket risk framework –
ATORY EXPO
s of consol
ented in our finy exposures. I
d
C
ct to risk
work
Subject counterpa
credit risframewo
0,207 6,471
1,432 9,685 1,117
- 294,6
9,534 6,566 46,100 4
- 6,100 4
-
5,641 - 94,
2,829 - -
7,554 4,56,024 98,79,919 393,7
- - - --
- -
- 206,8- 90,2- - - 297,0- - 297,0
- - - - -- -- 297,0
orks utilized.
hence column b will
OSURES
lidation and
ancial statemet further break
e
Carrying values o
to arty sk ork
Subject to thsecuritizatio
framework
- -
- 18- 12,87- 13,05
602
- 479 6,47479 6,47
- 479 6,47
-
- 125
- - -
593 2718 2799 19,55
- - - --
- -
814 238
- -
052 -
052
- - - - -- -
052
not equal to the sum
mapping o
ents prepared iks down the am
f
f items:1
he n
Subject to the market risk framework
- -- -
87 118,54370 -57 118,543
- -
- -74 3,47774 3,477
- -74 3,477
- -
- -- 91,192- -- -- -
23 2,60823 93,80054 215,820
- -- -- -- -- -
- -- -
- -- 87,761- -- -- 87,761- -- 87,761
- -- -- -- -- -- -- -- 87,761
m of column c to g.
Q4 2018
11
of financial
n accordance mounts in our
g
Not subject to capital
requirements / or subject to
deduction from capital
- -
- - -
-
9,633 1,284
10,917 (2,912)8,005
-
- - -
11,137 4,603
702 16,442
24,447
270,154 534,492
32,521 837,167
-
15,662 32,247
- - -
51,077 98,986 9,131
945,284
6,309 17,617 51,114 4,877
79,91794
80,0111,025,295

LI2sta
Thecarr
As a
1
2
3
4
5
6
7
8
9
10
1 Am– hen2 Off-
Royal Ban
2: Main souatements
e following tabrying values as
at October 31, 201
(Millions of Canad
Asset carryingregulatory con
Liabilities carryof consolidation
Total net amouconsolidation
Off-balance she
Differences due
Differences duethose already in
Differences due
Differences due
Difference due securitizations a
Exposure amopurposes
ount reflects Table Lnce column a will no
-balance sheet amou
nk of Cana
urces of diffe
ble provides ths presented in o
18
dian dollars)
g value amount unsolidation (as pe
ing value amount n (as per template
nt under regulator
eet amounts2
e to Fair Value adj
e to different nettinncluded in row 2
e to consideration
e to prudential filte
to accounting andand other items
ounts considered
LI1 columns (c), (d), t equal to the sum of
unts reflect the applic
ada Pillar 3
erences betw
he key differenour financial sta
under scope of er template LI1)1
under regulatory e LI1)1
ry scope of
justment
ng rules, other tha
of provisions
ers
d risk treatment of
d for regulatory
(e) and (f) from the pf column b to e.
cation of credit conv
3 Report
ween regula
nces between atements that a
a
Tot
1,2
scope 2
1,0
1,1
an
f
2,1
previous page. Deriv
version factors.
atory exposu
the exposure are within the s
tal Credfram
297,900
297,052
000,848
114,918
299
995
306
-
5,195
122,561 1
vative assets and liab
ure amounts
amounts for scope of regula
b
dit risk mework
Secfra
759,919
-
759,919
306,189
299
995
306
-
3,626
1,071,334
bilities are subject to
s and carryi
regulatory puatory consolida
c
Items subject
curitization amework
C
f
19,554
-
19,554
42,215
-
-
-
-
1,569
63,338
o both counterparty c
ing values i
rposes and thation.
d
t to: ounterparty credit risk framework
393,799
297,052
96,747
766,514
-
-
-
-
-
863,261
credit risk and marke
Q4 2018
12
n financial
he accounting
e
Market risk framework
215,820
87,761
128,059
-
(3,429)
-
-
-
-
124,630
et risk framework

LIA
OurStathe In Tcate(colbalainsu In Tqua Ourdebundcon Regrevesecdiffediffeexp ThesecCAR OurprudReprisk
Royal Ban
A: Explanati
r consolidated ndards (IFRS) required regula
Template LI1: egories with reumn a in LI1) ance sheet, onurance subsidia
Template LI2: Mantify measurem
r banking bookbt securities cader the Credit version factors
gulatory carryinerse repurchas
curities loaned erences betweerences in allo
posure amount.
e regulatory cacuritization holdR guidelines C
r trading book dent valuation port - Risk Mank to selected ba
nk of Cana
ons of differ
balance sheeas issued by t
atory requirem
Differences begulatory risk c
and our regn which capital aries as prescr
Main sources oment difference
k regulatory cararried at fair va
risk frameworks and undrawn
ng values for ose agreementsare determineen the accountwed IFRS and.
arrying value odings as well ahapter 7 but ar
regulatory carrguidance requ
nagement sectalance sheet ite
ada Pillar 3
rences betwe
et (“accountingthe Internationents prescribed
between accoucategories, wegulatory capital
adequacy reqribed by OSFI’s
of differences bes other than re
rrying values realue through otk, are measuramounts.
our Counterpar and securitiesd using OSFI’sting and regula
d regulatory ne
of exposures as our securitizre not consider
rying values areuirements, as stion which provems.
3 Report
een accounti
balance sheeal Accounting d by OSFI to d
unting and rege identify the dl consolidated uirements are s CAR guidelin
between regulaegulatory conso
eflect our IFRSther comprehered at amortize
rty credit risk rs borrowed ands CAR guidelinatory amounts etting rules, and
subject to thezed credit cardred securitized
e determined astated in CAR vides further in
ing and regu
et”) is prepareStandards Boaetermine our re
ulatory scopesdifferences betw
balance sheetdetermined, rees.
atory exposure olidation.
S accounting bansive income ed cost. Off-ba
related to our dd obligations renes Chapter 4 relate to regulad also applicat
e securitizationd exposures wfor the purpose
as prescribed uChapter 9 sec
nsight into how
ulatory expos
ed in complianard. We leveraegulatory capit
s of consolidaween our IFRSt (column b ineflects all of ou
amounts and c
alance sheet v(FVOCI) (availalance sheet r
derivative asseelated to assetSettlement an
atory inclusiontion of financia
n framework inhich meet the es of our IFRS
under the CARction 9.8 to ou
w we measure
sure amount
nce with Internage our accountal consolidated
ation and mapS consolidated
n LI1). Our regur consolidated
carrying values
values except flable for sale (regulatory asse
ets and liabilitiets sold under r
nd Counterpart of potential fu
al collateral in t
ncludes our onrisk transferen
S accounting ba
R guidelines Chur trading bookour market ris
ts
national Financnting balance sd balance shee
pping of financd accounting bgulatory capitald subsidiaries e
s in financial st
for our fair valu(AFS) under IAet values refle
es, assets purcrepurchase agrty risk framewouture exposure the calculation
n-balance shence requiremealance sheet.
hapter 9. We ek. Refer to our k and the linka
Q4 2018
13
cial Reporting sheet to applyet.
cial statement balance sheet consolidated except for our
tatements, we
ued loans and AS 39), which ect prescribed
chased under reements and ork. The main amounts and of regulatory
et third party nts under the
mploy OSFI’s 2018 Annual
age of market
CR
CR
Theincohttp
P
a)
b)
c)
d)
e)
Royal Ban
REDIT RISK
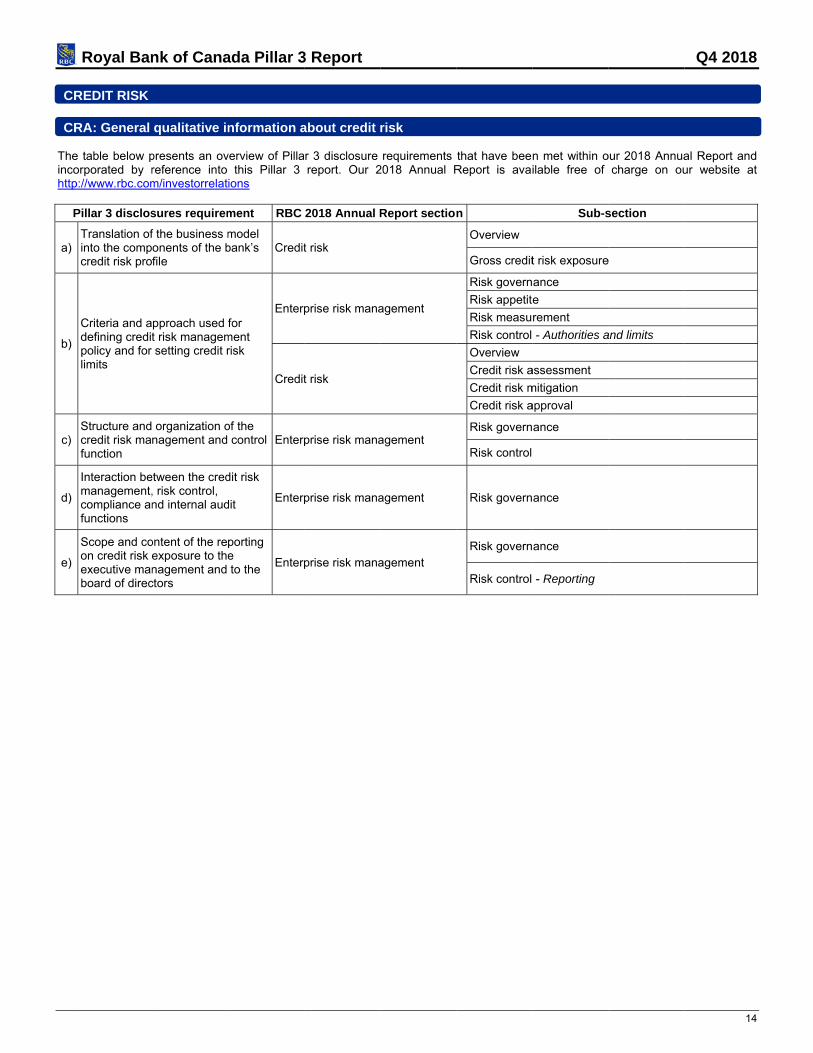
RA: General
e table below porporated by rp://www.rbc.com
Pillar 3 disclos
Translation ofinto the compcredit risk pro
Criteria and adefining creditpolicy and for limits
Structure andcredit risk mafunction
Interaction bemanagement,compliance anfunctions
Scope and coon credit risk executive manboard of direc
nk of Cana
qualitative in
presents an ovreference into m/investorrelat
sures requirem
f the business monents of the bfile
pproach used t risk managemsetting credit r
organization onagement and
etween the cred, risk control, nd internal aud
ontent of the reexposure to thenagement and
ctors
ada Pillar 3
nformation a
verview of Pillathis Pillar 3
ions
ment RBC
model bank’s Credit
for ment risk
Enterp
Credit
of the control Enterp
dit risk
dit Enterp
porting e to the
Enterp
3 Report
about credit
r 3 disclosure report. Our 2
2018 Annual R
t risk
prise risk mana
t risk
prise risk mana
prise risk mana
prise risk mana
risk
requirements 2018 Annual R
Report section
agement
agement
agement
agement
that have beeReport is avai
n
Overview
Gross credit
Risk govern
Risk appetit
Risk measu
Risk control
Overview
Credit risk a
Credit risk m
Credit risk a
Risk govern
Risk control
Risk govern
Risk govern
Risk control
n met within oilable free of
Sub-s
t risk exposure
ance
e
rement
- Authorities a
assessment
mitigation
approval
ance
ance
ance
- Reporting
our 2018 Annuacharge on ou
section
e
and limits
Q4 2018
14
al Report andur website at

CR
The
As a
1
2
3
4 1 Def2 Ref3 Off exclu
CR
Theand
For t
1
2
3
4
5
6
CR
Theincohttp
P
a)
b)
c)
d)
Royal Ban
R1: Credit qu
e following table
at October 31, 201
(Millions of Canad
Loans
Debt Securities
Off-Balance Sh
Total finition of default as pflects Stage 3 IFRS 9
balance sheet amouuded as per BCBS re
R2: Changes
e following tabld reductions in
the six months en
(Millions of Canad
Defaulted loan
Loans and debt
Returned to no
Amounts writte
Other changes
Defaulted loan
RB: Addition
e table below porporated by rp://www.rbc.com
Pillar 3 disclos
Definitions of exposures
Extent of past
Description ofdetermining im
Definition of aexposure
nk of Cana
uality of asse
e presents a co
18
dian dollars)
s
heet exposures3
per the CAR guidelin9 allowances only.
unts are before the aequirements.
s in stock of
e presents ourthe defaulted e
nded October 31, 2
dian dollars)
ns and debt secu
t securities that ha
n-defaulted status
n off
ns and debt secu
nal disclosur
presents an ovreference into m/investorrelat
sures requirem
past due and i
t due exposure
f methods usedmpairments
a restructured
ada Pillar 3
ets
omprehensive
a
Defaulted ex
nes.
application of credit c
defaulted loa
r defaulted expexposure balan
2018
urities at the end
ave defaulted sinc
s
urities at the end
re related to t
verview of Pillathis Pillar 3
ions
ment RBC
mpaired Cons
es Cons
d for Cons
Cons
3 Report
view of the cre
Gross carrying v
xposures1 N
2,027
-
289
2,316
conversion factors an
ans and deb
posure balancences due to writ
of the previous
ce the last reportin
of the reporting
the credit qu
r 3 disclosure report. Our 2
C 2018 Annual
solidated Finan
solidated Finan
solidated Finan
solidated Finan
edit quality of ou
b
values of
on-defaulted expo
5
2
8
nd reflect guarantees
t securities
s, the flows bete-offs.
reporting period
ng period
period
uality of asse
requirements 2018 Annual R
Report sectio
cial Statement
cial Statement
cial Statement
cial Statement
ur on- and off-b
Allowaosures
554,073
79,190
255,609
888,872
s given and irrevoca
etween non-def
d
ets
that have beeReport is avai
on
ts
Note 2 - Suestimates a"Definition "Credit imp
ts Note 2 - Suestimates a"Definition
ts Note 2 - Suestimates a"Allowance
ts Note 2 - Suestimates a"Modificatio
balance sheet
c
ances/impairments
7
7
able loan commitmen
faulted and de
n met within oilable free of
Sub-
ummary of signand judgmentsof default"
paired financial
ummary of signand judgmentsof default"
ummary of signand judgmentse for credit loss
ummary of signand judgmentsons”
assets.
s2 Net
(a
700
-
-
700
nts. Revocable loan
efaulted exposu
a
our 2018 Annuacharge on ou
-section
nificant accouns
assets (Stage
nificant accouns
nificant accouns ses"
nificant accouns
Q4 2018
15
d
values +b-c)
555,400
79,190
255,898
890,488
commitments are
ure categories
a
2,402
207
(148)
(841)
407
2,027
al Report andur website at
ting policies,
e 3)"
ting policies,
ting policies,
ting policies,
CR
(e) Theclas(EA As a
(Millio
Reta
R
Q
O
Who
A
A
B
C
C
O
F
F
Fo
G
In
In
In
M
P
R
O
Te
T
U
O
Tota
By G
C
U
E
O
Tota
By M
U
W
1
O
Tota1 Exc2 Off 3 Inclu4 Cou5 Inclu
Royal Ban
RB: Addition
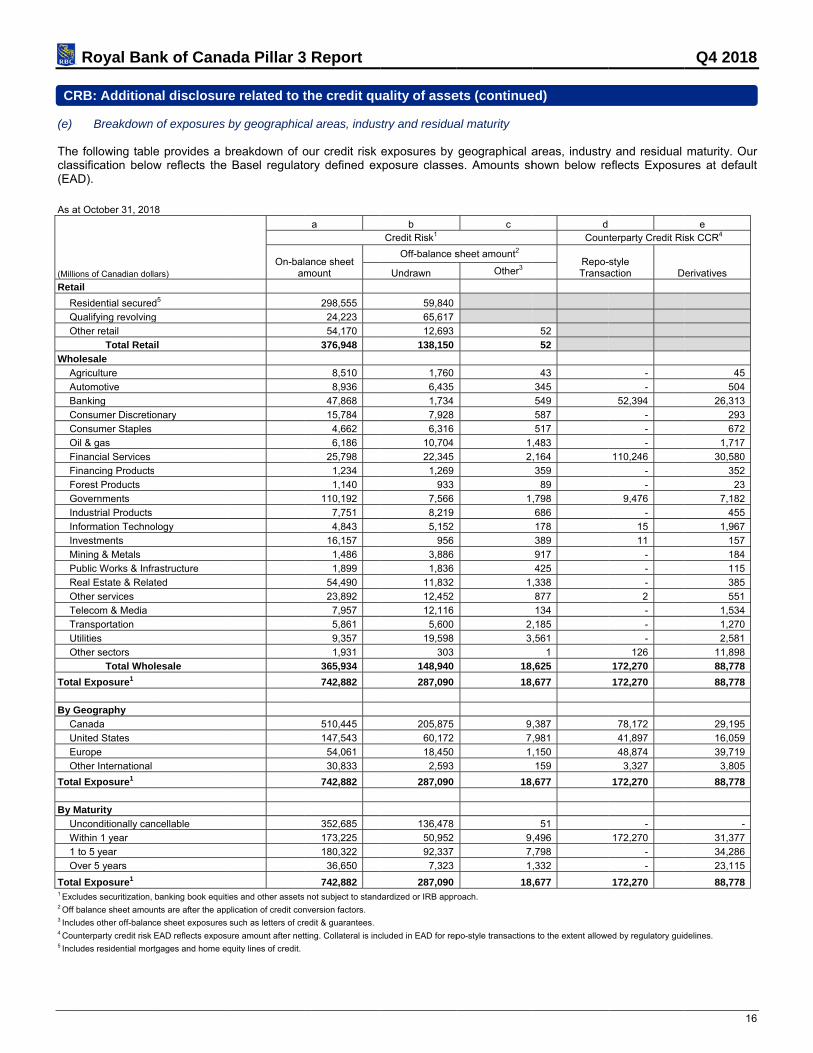
Breakdown
e following tablssification beloAD).
at October 31, 201
ons of Canadian dol
ail
Residential secured
Qualifying revolving
Other retail Total Reta
olesale
Agriculture
Automotive
anking
Consumer Discretio
Consumer Staples
Oil & gas
inancial Services
inancing Products
orest Products
Governments
ndustrial Products
nformation Techno
nvestments
Mining & Metals
ublic Works & Infr
Real Estate & Rela
Other services
elecom & Media
ransportation
tilities
Other sectors
Total Who
al Exposure1
Geography
Canada
nited States
urope
Other International
al Exposure1
Maturity
nconditionally can
Within 1 year
to 5 year
Over 5 years
al Exposure1
cludes securitization,
balance sheet amou
udes other off-balan
unterparty credit risk
udes residential mor
nk of Cana
nal disclosur
n of exposures
e provides a bow reflects the
18
lars)
d5
g
ail
onary
s
ology
rastructure
ated
olesale
ncellable
banking book equiti
unts are after the app
ce sheet exposures
EAD reflects exposu
rtgages and home eq
ada Pillar 3
re related to t
by geographica
breakdown of oBasel regulato
On-balam
ies and other assets
plication of credit con
such as letters of cr
ure amount after net
quity lines of credit.
3 Report
the credit qu
al areas, indus
our credit risk ory defined ex
a
lance sheet mount
298,555
24,223
54,170
376,948
8,510
8,936
47,868
15,784
4,662
6,186
25,798
1,234
1,140
110,192
7,751
4,843
16,157
1,486
1,899
54,490
23,892
7,957
5,861
9,357
1,931
365,934
742,882
510,445
147,543
54,061
30,833
742,882
352,685
173,225
180,322
36,650
742,882
not subject to stand
nversion factors.
redit & guarantees.
tting. Collateral is inc
uality of asse
stry and residua
exposures by xposure classe
b
Credit Risk1
Off-balance s
Undrawn
59,840
65,617
12,693138,150
1,760
6,435
1,734
7,928
6,316
10,704
22,345
1,269
933
7,566
8,219
5,152
956
3,886
1,836
11,832
12,452
12,116
5,600
19,598
303148,940
287,090
205,875
60,172
18,450
2,593
287,090
136,478
50,952
92,337
7,323
287,090
dardized or IRB appr
cluded in EAD for rep
ets (continue
al maturity
geographical aes. Amounts sh
c
sheet amount2
Other3
1
2
1
1
2
3
18,
18,
9
7
1
18,
9
7
1
18,
roach.
po-style transactions
ed)
areas, industryhown below re
d
Coun
Repo-Transa
52
52
43
345
549
587
517
,483
,164
359
89
,798
686
178
389
917
425
,338
877
134
,185
,561
1
,625
,677
,387
,981
,150
159
,677
51
,496
,798
,332
,677
s to the extent allowe
y and residual eflects Exposu
terparty Credit Ri
-style action D
-
-
52,394
-
-
-
110,246
-
-
9,476
-
15
11
-
-
-
2
-
-
-
126
172,270
172,270
78,172
41,897
48,874
3,327
172,270
-
172,270
-
-
172,270
ed by regulatory guid
Q4 2018
16
maturity. Our res at default
e
sk CCR4
erivatives
45
504
26,313
293
672
1,717
30,580
352
23
7,182
455
1,967
157
184
115
385
551
1,534
1,270
2,581
11,898
88,778
88,778
29,195
16,059
39,719
3,805
88,778
-
31,377
34,286
23,115
88,778
delines.

CR
(f)
The As a
Impa(Millio
Can
R
W
STo
Unit
R
W
STo
Othe
R
W
STo
Tota
R
W
STota1 Geo2 Allo
Net (Millio
Can
R
W
Unit
R
W
Othe
R
W
Tota
R
W
Tota1 Geo2 Inclu
Royal Ban
RB: Addition
Amounts oallowances
e following table
at October 31, 201
aired exposures ons of Canadian dol
ada
Retail
Wholesale
ecurities
otal - Canada
ted States
Retail
Wholesale
ecurities
otal - United Stat
er International
Retail
Wholesale
ecurities
otal - Other Inter
al
Retail
Wholesale
ecurities
al impaired expos
ographic information
owance reflects only
write-offs by geo
ons of Canadian dol
ada
Retail
Wholesale
ted States2
Retail
Wholesale
er International
Retail
Wholesale
al
Retail
Wholesale
al net write-offs
ographic information
udes acquired credit
nk of Cana
nal disclosur
of impaired exs and write-offs,
es provide a br
18
by geography1 alars)
tes
rnational
sures
is based on residen
Stage 3 IFRS 9 allo
ography1 and po
lars)
is based on residen
t-impaired loans rela
ada Pillar 3
re related to t
xposures (acco, broken down
reakdown of im
and portfolio
nce of borrower.
wances.
rtfolio
nce of borrower.
ated to the acquisition
3 Report
the credit qu
ording to the by geographic
mpaired exposu
n of City National.
uality of asse
definition usecal areas and in
ures by geograp
Grosex
ets (continue
ed by the banndustry
phical areas an
ss impaired xposures
723
396
- 1,119
23
401
- 424
327
313
125
765
1,073
1,110
125
2,308
ed)
nk for account
nd industry.
Allowance2
For the ye
ting purposes)
2 Net ex
168
92
- 260
1
164
- 165
166
109
- 275
335
365
- 700
ear ended Octobe
Q4 2018
17
) and related
impaired posures
555
304
- 859
22
237
- 259
161
204
125
490
738
745
125
1,608
er 31, 2018
942
83
4
19
24
40
970
142
1,112
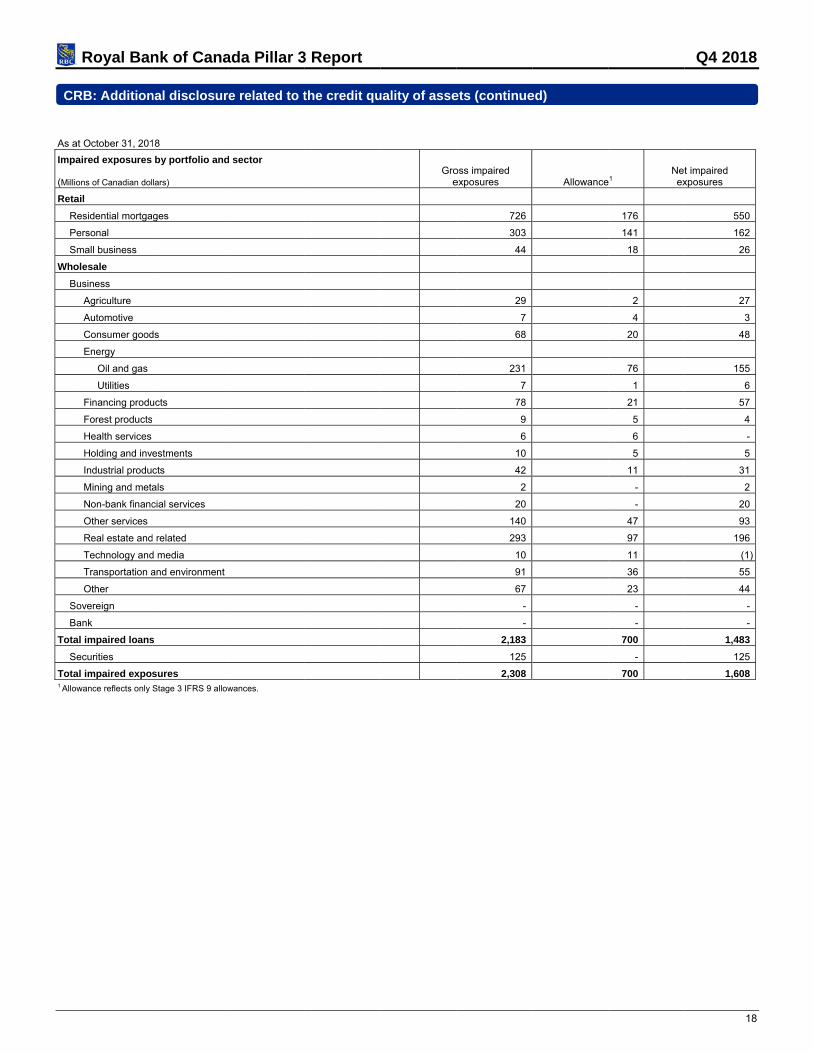
CR
As a
Impa (Millio
Reta
R
P
S
Who
B
S
B
Tota
S
Tota1 Allo
Royal Ban
RB: Addition
at October 31, 201
aired exposures
ons of Canadian dol
ail
Residential mortga
ersonal
mall business
olesale
usiness
Agriculture
Automotive
Consumer good
Energy
Oil and gas
Utilities
Financing produ
Forest products
Health services
Holding and inv
Industrial produ
Mining and meta
Non-bank financ
Other services
Real estate and
Technology and
Transportation a
Other
overeign
ank
al impaired loans
ecurities
al impaired expos
owance reflects only
nk of Cana
nal disclosur
18
by portfolio and
lars)
ages
ds
ucts
s
estments
cts
als
cial services
d related
d media
and environment
s
sures
Stage 3 IFRS 9 allow
ada Pillar 3
re related to t
d sector
wances.
3 Report
the credit quuality of asse
Groe
ets (continue
oss impaired exposures
726
303
44
29
7
68
231
7
78
9
6
10
42
2
20
140
293
10
91
67
-
-
2,183
125
2,308
ed)
Allowance
e1 Netex
176
141
18
2
4
20
76
1
21
5
6
5
11
-
-
47
97
11
36
23
-
-
700
-
700
Q4 2018
18
t impaired xposures
550
162
26
27
3
48
155
6
57
4
-
5
31
2
20
93
196
(1)
55
44
-
-
1,483
125
1,608

CR
(g) The
As a
(Millio
Reta
Who
Tota
(h) Amo
CR
Theincohttp
P
a)
b)
c)
Royal Ban
RB: Addition
Ageing ana
e following table
at October 31, 201
ons of Canadian dollar
ail
olesale
al
Breakdown
ounts are deem
RC: Qualitati
e table below porporated by rp://www.rbc.com
Pillar 3 disclos
Core featuresprocesses forthe extent to wuse of, on- annetting
Core featuresprocesses forand managem
Information abrisk concentrarisk mitigation
nk of Cana
nal disclosur
alysis of accoun
e provides the
18
rs)
n of restructured
med not signific
ive disclosur
presents an ovreference into m/investorrelat
sures requirem
s of policies andr, and an indicawhich the banknd off-balance s
s of policies andr collateral evalment
bout market or ations under then instruments u
ada Pillar 3
re related to t
nting past-due
ageing of our r
1 to 29 days
2
1
4
d exposures be
cant for disclos
re requireme
verview of Pillathis Pillar 3
ions
ment RBC
d ation of k makes sheet
Credit
Conso
d uation Credit
credit e credit sed
Credit
Conso
3 Report
the credit qu
exposures
retail and whole
30
2,995
1,246
4,241
etween impaire
sure.
ents related t
r 3 disclosure report. Our 2
2018 Annual R
t risk
olidated Financ
t risk
t risk
olidated Financ
uality of asse
esale past due
0 to 89 days
1,40
46
1,87
ed and not impa
to credit risk
requirements 2018 Annual R
Report section
cial Statements
cial Statements
ets (continue
e exposures.
90 days
02
68
70
aired exposure
k mitigation t
that have beeReport is avai
n
Counterpart
s
Note 8 - Deractivities – D
Note 30 - Ofliabilities
Credit risk m
Credit risk m
Credit risk a
sNote 8 - Deractivities
ed)
and greater
179
-
179
es
techniques
n met within oilable free of
Sub-s
ty credit risk
rivative financiaDerivative-relat
ffsetting financ
mitigation - Coll
mitigation
approval – Cred
rivative financia
Tot
our 2018 Annuacharge on ou
section
al instruments ted credit risk
cial assets and
lateral
dit risk limits
al instruments
Q4 2018
19
tal
4,576
1,714
6,290
al Report andur website at
and hedging
financial
and hedging

CR
We expSecutiliz
As a
1
2
3
4 1 Colu2 Crefor an3 Colu
CRcr
As AppcouStaappundAs w Extean ionly OurageApp
Stan
Lon
(AAA
(A+
(BBB
(BB+
(B+
(Belo
We age
Royal Ban
R3: Credit ris
utilize alloweposures. The focured exposureze credit deriva
at October 31, 201
(Millions of Canad
Loans
Debt securities
Total
Of which defau
umn c is a subset of
dit mitigation allocatny remaining balancumn e is a subset of
RD: Qualitatredit risk
detailed in seproach requirenterparties, issndard & Poor’s
proved by OSFder the asset cwell, external r
ernal ratings utissue-specific ry for our expos
r supervisor, Oencies to an eqproach portfolio
ndardized Risk W
g Term
A to AA-)
to A-)
B+ to BBB-)
+ to BB-)
to B-)
ow B-)
understand thencies in its ann
nk of Cana
sk mitigation
ed regulatory collowing table pes are mitigatedatives to mitiga
18
dian dollars)
lted
column b.
ion for multi-securede. f column d.
ive disclosu
ction CR4, cements. OSFI’s
sued by indepes (S&P), Mood
FI. Currently, elasses of corpoatings are used
tilized from therating if it is avures which ran
OSFI specifies iquivalent risk wos under the gu
Weight Category
hat OSFI annunual update to
ada Pillar 3
n techniques
credit mitigatiopresents a detd by way of ad
ate our on-balan
a
Exposures unsecured:
carrying amount
187,975
60,906
248,881
582
d exposures is made
res on bank
rtain of our pos Standardizedendent rating ay’s Investors S
external ratingsorate, sovereigd for determinin
e above-mentiovailable for the nk pari-passu w
n its CAR guidweight. We relyuideline. OSFI’s
S&P
AAA to AA
A+ to A-
BBB+ to BB
BB+ to BB
B+ to B-
Below B-
ually reviews ththe CAR guide
3 Report
– overview
on techniques ailed breakdowditional collatence sheet expo
b
Exposures secured by collateral
255,724
18,284
274,008
790
e by way of order of p
ks' use of ex
ortfolios RWA d Approach mgencies, for the
Service, Fitch Rs are used to dgn, public sectong the risk weig
oned rating agepurposes of d
with senior claim
deline the requiy on OSFI’s ms current mapp
Lon
Mo
A- AAA
A1
BB- BAA1
B- BA1
B1
- Be
he list of acceelines.
to reduce cawn of our unseral or guaranteosures.
c
Exposures secured by collateral, of
which: secured amount1
247,148
18,284
265,432
790
priority of available m
xternal credit
amounts are methodology all
e determinationRating Servicesdetermine the Ror entities, mulghting for certa
encies are eitheetermining RW
ms of the issue
ired standard mmapping to deteping of external
ng-term rating
oody's
A to AA3
to A3
to BAA3
to BA3
to B3
low B3
eptable rating a
apital requiremecured and secees being reque
d
Exposures secured by
financial guarantees2
111,693
-
111,693
238
mitigation to be utilize
t ratings und
calculated as lows for the rn of RWA. Fives, DBRS and KRWA amounts ltilateral develoain of our secu
er an issuer raWA for the expoer.
mapping of lonermine the appl rating agencie
Fitch
AAA to AA-
A+ to A-
BBB+ to BBB-
BB+ to BB-
B+ to B-
Below B-
agencies and
ments associatecured loan andested of the bo
e
Exposures secured by
financial guarantees, of which: secured
amount3
72,407
-
72,407
237
ed: financial guarant
der the stan
per OSFI’s CAreliance on thee external ratinKroll Bond Ratassociated wi
opment banks,ritizations expo
ting or an issuosure we hold.
g term externapropriate risk bes rating is refl
DBRS
AAA to AA
A(high) to
BBB(high) to
BB(high) to
B(high) to
CCC or l
will reflect any
ed with our bd debt securitieorrower. We so
f
Exposures secured by
credit derivatives
8
-
8
-
tees portion first follo
ndardized ap
AR Guideline e external cre
ng agencies ratting Agency, Inth our wholesa banks and se
osures.
e-specific ratin. We utilize the
al ratings of theuckets for our ected in the tab
S
A (low) A
A(low)
BBB(low) BB
BB(low) B
B(low)
ower
y changes in a
Q4 2018
20
balance sheet es exposures. ometimes also
g
Exposures secured by
credit derivatives, of which: secured
amount
8
-
8
-
owed by collateral
pproach for
Standardized edit ratings of tings, namely, nc. have been ale exposures ecurities firms.
ng. We rely on e issuer rating
e above rating Standardized ble below:
Kroll
AAA to AA-
A+ to A-
BB+ to BBB-
BB+ to BB-
B+ to B-
Below B-
allowed rating

CR
Thepresassdete
As a
1
2
3
4
5
6
7
8
9
10
11
12
13
14 1 Whethe p
Royal Ban
R4: Standard
e following tabsents on balanociated RWA ermine the pres
at October 31, 201
(Millions of Canad
Asset Classes
Sovereigns and
Non-central go
Multilateral dev
Banks
Securities firms
Corporates1
Regulatory reta
Secured by res
Secured by com
Equity
Past-due loans
Higher-risk cate
Other assets
Total
en CRM is available protection provider’s
nk of Cana
dized approa
le provides thnce sheet and and RWA denscribed regulat
18
dian dollars, except a
d their central ban
vernment public s
velopment banks
s1
ail portfolios
sidential property1
mmercial real esta
s
egories
in the form of an eligasset class in colum
ada Pillar 3
ach – credit r
e effect of CRoff-balance sh
nsity by asset tory risk weight
as otherwise noted)
nks1
sector entities
ate
gible guarantee, the mn c and d.
3 Report
risk exposure
RM on the caleet exposuresclasses. As n
t to be assigne
a
ExposurCCF a
On-balance sheet amount
16,011
8,904
367
4,164
1,327
44,961
7,013
35,187
-
-
449
452
12,678
131,513
portion that is cover
e and credit
culation of capbefore and afoted in CRD, d.
b
res before nd CRM
Off-balance sheet amount
324
31
-
317
2,406
26,759
3,915
-
-
-
1
391
-
34,144
red by the guarantee
risk mitigati
pital requiremefter credit convthe external r
c
Expopost-CCF
On-balance sheet amount
33,542
8,927
367
4,164
2,339
38,360
7,013
16,669
-
-
447
452
12,678
124,958
e will attract the risk
on (CRM) eff
ents under theversion factors ratings of the
d
osures F and CRM
Off-balance sheet amount
5
15
-
125
1,114
6,123
1,497
-
-
-
1
183
-
9,063
weight of the protec
fects
e standardized(CCF) and CRcounterparty is
e
RWA and R
RWA
9
1,842
-
1,168
1,084
44,429
6,836
6,530
-
-
604
952
13,812
77,266
tion provider and wil
Q4 2018
21
d approach. It RM as well as s relied on to
f
RWA density
RWA density
-
20.6%
-
27.2%
31.4%
100.00%
80.3%
39.2%
-
-
134.8%
150.00%
108.9%
57.7%
ll be reflected in

CR
Theweig
As a
1
2
3
4
5
6
7
8
9
10
11
12
13
14
Royal Ban
R5: Standard
e following tablght.
at October 31, 201
Asset Classes (Millions of Canadian
Sovereigns and tbanks
Non-central govepublic sector entitMultilateral develobanks
Banks
Securities firms
Corporates
Regulatory retail Secured by resideproperty
Secured by commestate
Equity
Past-due loans
Higher-risk categ
Other assets
Total
nk of Cana
dized approa
le presents the
18
Risk weight
dollars) heir central
rnment ties
opment
portfolios
ential
mercial real
ories
ada Pillar 3
ach – exposu
e breakdown o
a b
0% 10%
33,534
-
367
-
-
-
-
-
-
-
-
-
1,790
35,691
3 Report
ures by asset
of credit risk ex
c
20%
- -
- 8,829
- -
- 3,898
- 2,424
- 56
- -
- -
- -
- -
- -
- -
- -
- 15,207
t classes and
xposures unde
d e
35% 50%
-
-
-
-
- 8
-
-
14,932
-
-
-
-
-
14,932 9
d risk weight
er the standard
f
% 75%
11 -
75 -
- -
8 -
862 -
34 -
- 6,697
- 1,737
- -
- -
- -
- -
- -
990 8,434
ts
dized approach
g h
100% 150
3
38
-
384
167
44,393
1,814
-
-
-
135
-
10,634
57,568
h by asset cla
h i
0% Others
- -
- -
- -
- -
- -
- -
- -
- -
- -
- -
312 -
635 -
- 254
947 254
Q4 2018
22
sses and risk
j
Total credit exposures
amount (post CCF and
post-CRM)
33,547
8,942
367
4,289
3,453
44,483
8,511
16,669
-
-
447
635
12,678
134,021
CR
In mappappuse Undat Dfacigov In aportFor segreguInst Credatais otranthe PD gradcredoblicondiffeobli EADobliestimod LGDcredestirateneccon Estion a
Royal Ban
RE: Qualitati
measuring credproach and theproved by OSFes risk weights
der the IRB apDefault (EAD). lities and their
vernance functi
accordance witfolios, a PD isRetail portfoli
gmentation of tulatory capital titutions (OSFI)
edit parameter a where approp
oriented to the nsaction-specifcredit facility le
is an estimatede or for a pardit quality of thgor’s businessservative refleerentiates the rgations on time
D is an amountgor and the pomated to refledelling process
D is an estimadit facility is asmating LGD in
es draw primarcessary. LGD raservatism adde
imates of PD, Lan annual basi
nk of Cana
ve disclosur
dit risk to detee StandardizedFI. The remainprescribed by O
proach, we deThey are the kcorrespondingons. In addition
ith the IRB aps estimated for os, borrowers he portfolios inmodels for wh).
estimates are priate. We emprisk of borroweic factors such evel.
ed percentage trticular pool of e obligor and es risk and finaection of our riskiness of obe over a three-
t expected to bossible future cect an economs.
ated percentagssigned an LGDnclude seniorityrily on internal ates are estimaed to reflect da
LGD and EAD s. In addition, q
ada Pillar 3
res related to
ermine regulatod approach. Thder of our porOSFI to calcula
termine our owkey credit para
g estimates aren, the IRB para
pproach for creach internal are risk rated
nto pools. Retaolesale and ret
based on our ploy a two-dimeer default and q
as collateral, p
that representsexposure. Eac
each BRR has ancial risk andexperience th
ligors and repryear time horiz
be owed by an changes in thaic downturn, w
e of EAD thatD rate reflectivey of debt, collaloss experiencated to reflect cata limitations a
are updated aquarterly monit
3 Report
o internal ris
ory capital, twohe majority ofrtfolios are repate RWA for cr
wn estimates foameters that fo used for credi
ameter estimate
edit risk, modborrower grad using internaail PD, EAD antail credit risk a
internal historensional risk raquantified throuproduct type, a
s the likelihoodch obligor is asa PD calibrated is based onhrough an ecoresents our evazon.
obligor at the tt exposure driv
with added con
is not expectee of the extent
ateral security,ce and approprconditions that
and statistical u
nd then validattoring and back
k-based (IRB
o principal appour credit risk
ported under thredit risk expos
or Probability oorm the basis ot approval, riskes are critical i
els are designe and LGD anl credit scoringnd LGD paramare subject to a
rical default anating system fough the PD as
and seniority, a
d of default of asigned a Borro
ed against it. Thn fundamentalonomic cycle,aluation of the
time of defaultven by factorsnservatism to r
ed to be recov of losses anticand the indust
riate external dt might be expeuncertainties id
ted and back-tk-testing proce
B) models
proaches applik exposures ahe Standardizesures.
of Default (PD)of our credit risk managementnputs for enter
ned for wholed EAD parameg models. Cre
meters are estimapproval by the
nd loan loss exor the majorityssigned to the bnd is quantified
an obligor withower Risk Ratinhe assignmentl credit analys including peobligors’ ability
. EAD is estimsuch as the n
reflect data an
vered during thcipated in the etry sector in w
data is used toected to prevaientified in the e
tested by an indedures are perfo
ied are: the Inare reported ued approach. T
, Loss Given Dsk measures. I, internal capitarprise and regu
sale and retaieters are estimedit scores aremated at the pe Office of the
xperience and of our credit poborrower. The d by LGD and
hin a given timeng (BRR), refleof BRRs is ba
sis. PD estimaeriods of econy and willingne
ated based onature of the cr
nd statistical un
he collection aevent the oblig
which the obligo supplement thil in an economestimation proc
dependent valiormed.
nternal Ratingsnder the IRBThe Standardiz
Default (LGD) aInternal ratingsal allocations, a
ulatory stress-te
il portfolios. Fmated for eache one of the kpool level. All ISuperintenden
are augmenteortfolios. The fisecond dimenEAD estimates
e period for a secting an asse
ased on the evaates are designomic downturess to meet the
the current exredit commitmencertainties ide
and recovery pgor defaults. Faor operates. Eshe estimation p
mic downturn, wcess.
idation team w
Q4 2018
23
s Based (IRB)approach, aszed approach
and Exposure s for borrowerand corporateesting.
or Wholesalecredit facility.ey drivers forIRB approach nt of Financial
ed by external irst dimensionsion capturess that apply at
specific rating ssment of the aluation of the gned to be a rn. The BRR eir contractual
xposure to the ent. Rates areentified in the
process. Eachactors used instimated LGDprocess whenwith additional
within the bank

CR
EAD TheThe As a
EAD
Reta
R
Q
O
Who
C
S
B
E
Othe
Tota1 Stan
Royal Ban
RE: Qualitati
D Covered by
e following tablee Foundation In
at October 31, 201
D (in %)
ail
Residential secured
Qualifying revolving
Other retail
olesale
Corporate
overeign
ank
quity
er assets not sub
al
ndardized Approach
nk of Cana
ve disclosur
the Various A
e outlines the pnternal Ratings
18
d
g
bject to Standard
includes assumptio
ada Pillar 3
res related to
Approaches
percentage of o Based (FIRB)
dized or IRB App
ns and waivers gran
3 Report
o internal ris
our EAD coverapproach is cu
proaches
nted by OSFI based o
k-based (IRB
red by the IRB urrently not app
StaA
on an OSFI approve
B) models (c
and Standardiplied.
EAD cov
andardized Approach1
14%
-
5%
-
15%
18%
5%
-
-
11%
ed rollout plan.
ontinued)
ized approache
vered by the vario
IRB Approach
86%
100%
95%
-
85%
82%
95%
100%
-
87%
es for each of
ous approaches
h
Q4 2018
24
our portfolios.
Other
-
-
-
-
-
-
-
-
100%
2%

CR
Par Thecalialso Ourthe requ Our(EMpararevimanDire Stre Thetestderimetare use CrematAnyesti
Royal Ban
RE: Qualitati
rameters Gove
e techniques ubrate our modo build conserv
r models have framework setuirements, coll
r models are reMRM) team. Eameters. EMRiew. The paramnagement comectors.
ess Testing of
e IRB credit parting is to track ive the paramthodological adoutside accep
ed in the back-t
edit risk parameterial events ary changes resumation cycle, e
nk of Cana
ve disclosur
ernance
used to develoels to ensure t
vatism into our
Model Developt by our policiesecting and revi
equired to be inEMRM is respM issues a repmeters reviewe
mmittees for ef
f Parameters a
rameters are sand assess a
eters are refledvances are incptable toleranceesting of param
eters are estimre identified in ulting from thiseach change is
ada Pillar 3
res related to
op models arethat variations model develop
pment Ownerss, standards aniewing data, te
ndependently ronsible for thport at the ended by EMRM ffective challen
and Model Per
ubject to quartactual performaective of currecorporated. If te limits, a full remeters and the
ated, at a minia timely fashios monitoring p
s reviewed by th
3 Report
o internal ris
in accordancof default rate
pment process
s (MDO) who and procedures.sting and evalu
reviewed and ce review and of each validaare presented
nge and review
rformance
terly back-testinance against thnt and expectthe quarterly reeview may becalibration of t
mum, annuallyon, we engageprocess are aphe Rating Mod
k-based (IRB
ce with bankinges through an eto reflect statis
are accountable. MDOs are resuating, designin
comprehensivechallenge of
ation exercise td to the Ratingw prior to ultim
ng, the resultshe estimated pted conditionseview indicatestriggered earliethe models is r
y and more freqin regular mon
ppropriately doels Governanc
B) models (c
g industry staeconomic cyclestical uncertain
e for the develosponsible for cng model perfo
ely evaluated bthe methodo
that documentg Models Govemate approval
of which are reparameters. Thand that any
s a substantialer than the annreviewed if pred
quently if deemnitoring of realiocumented. Whce Committee.
ontinued)
ndards and ree are includedties.
opment and pecollecting, definormance monit
by the Enterprislogy underpints the scope, aernance Comm
by the Risk C
eported to OSFhis ensures tha
significant nechange in con
nual schedule.defined thresho
med necessaryized results aghen changes a
egulatory requd in the underly
erformance of ning and documoring, and doc
se Model Riskning the estim
approach and fmittee and othCommittee of
FI. The purposeat the assump
ew data or tecnditions or the Stress testingolds are breach
. In order to enainst establisharise outside o
Q4 2018
25
irements. We ying data. We
models withinmenting model umenting.
Management mation of thefindings of theer senior riskthe Board of
e of the back-ptions used to chnical and/or actual results
g methods arehed.
nsure that anyhed estimates. of the annual
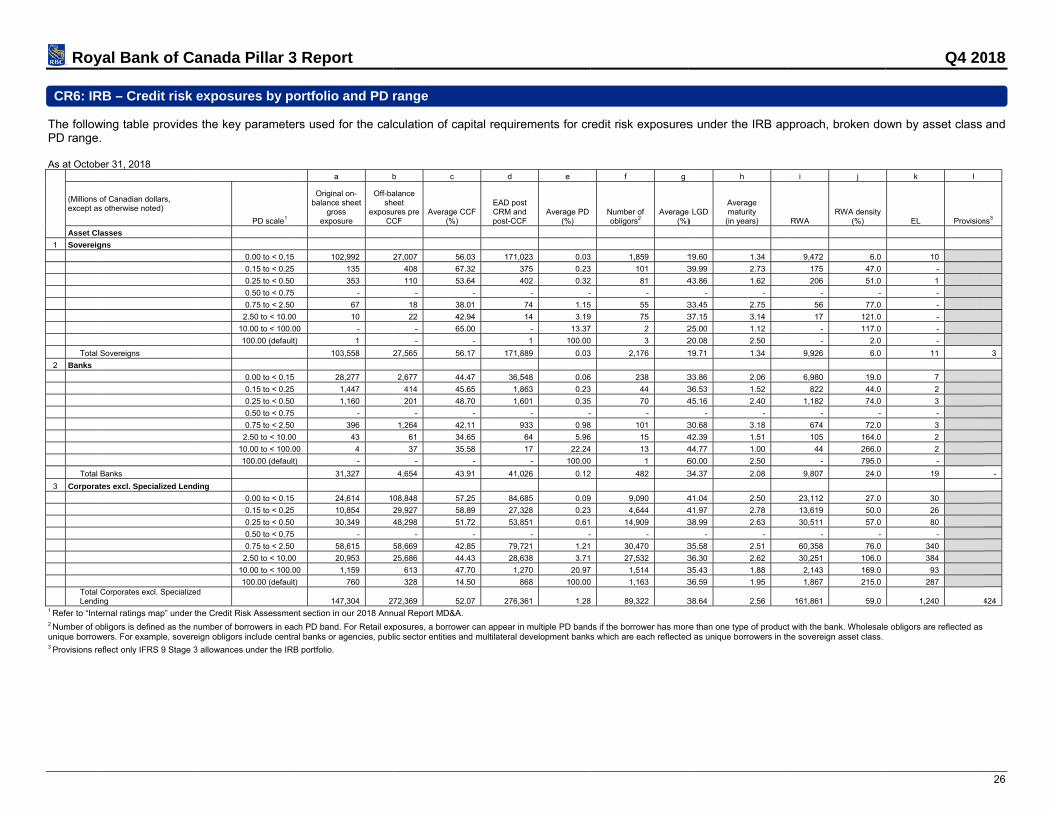
Roy CR6: IR
The followPD range As at Octob
(Millions except a
Asset Cl
1 Sovereig
Total
2 Banks
Total
3 Corpora
Total Lendi
1 Refer to “Inte2 Number of ounique borrow3 Provisions re
yal Bank of Ca
RB – Credit risk e
wing table provides.
ber 31, 2018
of Canadian dollars, s otherwise noted)
lasses
gns
Sovereigns
Banks
ates excl. Specialized Lend
Corporates excl. Specializeing
ernal ratings map” under t
obligors is defined as the nwers. For example, sovere
eflect only IFRS 9 Stage 3
anada Pillar 3
exposures by po
s the key paramete
PD scale1
0.00 to < 0.15
0.15 to < 0.25
0.25 to < 0.50
0.50 to < 0.75
0.75 to < 2.50
2.50 to < 10.00
10.00 to < 100.0
100.00 (default
0.00 to < 0.15
0.15 to < 0.25
0.25 to < 0.50
0.50 to < 0.75
0.75 to < 2.50
2.50 to < 10.00
10.00 to < 100.0
100.00 (default
ding
0.00 to < 0.15
0.15 to < 0.25
0.25 to < 0.50
0.50 to < 0.75
0.75 to < 2.50
2.50 to < 10.00
10.00 to < 100.0
100.00 (defaultd
the Credit Risk Assessmen
number of borrowers in eaceign obligors include centra
3 allowances under the IRB
3 Report
ortfolio and PD r
rs used for the calc
a b
Original on-balance sheet
gross exposure
Off-bashe
exposuCC
102,992 2
135
353
-
67
0 10
00 -
) 1
103,558 2
28,277
1,447
1,160
-
396
0 43
00 4
) -
31,327
24,614 10
10,854 2
30,349 4
-
58,615 5
0 20,953 2
00 1,159
) 760
147,304 27
nt section in our 2018 Ann
ch PD band. For Retail expal banks or agencies, publ
B portfolio.
range
culation of capital r
b c
alance eet
ures pre CF
Average CCF (%)
27,007 56.03
408 67.32
110 53.64
- -
18 38.01
22 42.94
- 65.00
- -
27,565 56.17
2,677 44.47
414 45.65
201 48.70
- -
1,264 42.11
61 34.65
37 35.58
- -
4,654 43.91
08,848 57.25
29,927 58.89
48,298 51.72
- -
58,669 42.85
25,686 44.43
613 47.70
328 14.50
72,369 52.07
ual Report MD&A.
posures, a borrower can aic sector entities and mult
requirements for cr
d e
EAD post CRM and post-CCF
Average PD(%)
171,023 0.03
375 0.23
402 0.32
- -
74 1.15
14 3.19
- 13.37
1 100.00
171,889 0.03
36,548 0.06
1,863 0.23
1,601 0.35
- -
933 0.98
64 5.96
17 22.24
- 100.00
41,026 0.12
84,685 0.09
27,328 0.23
53,851 0.61
- -
79,721 1.21
28,638 3.71
1,270 20.97
868 100.00
276,361 1.28
appear in multiple PD bandilateral development bank
redit risk exposures
f g
Number of obligors2
Average(%)
3 1,859 1
3 101 3
2 81 4
- -
5 55 3
9 75 3
7 2 2
0 3 2
3 2,176 1
6 238 3
3 44 3
5 70 4
- -
8 101 3
6 15 4
4 13 4
0 1 6
2 482 3
9 9,090 4
3 4,644 4
14,909 3
- -
30,470 3
27,532 3
7 1,514 3
0 1,163 3
8 89,322 3
ds if the borrower has mores which are each reflected
s under the IRB ap
h
e LGD )
Average maturity
(in years)
19.60 1.34
39.99 2.73
43.86 1.62
- -
33.45 2.75
37.15 3.14
25.00 1.12
20.08 2.50
19.71 1.34
33.86 2.06
36.53 1.52
45.16 2.40
- -
30.68 3.18
42.39 1.51
44.77 1.00
60.00 2.50
34.37 2.08
41.04 2.50
41.97 2.78
38.99 2.63
- -
35.58 2.51
36.30 2.62
35.43 1.88
36.59 1.95
38.64 2.56
re than one type of productd as unique borrowers in th
pproach, broken do
i j
RWA RWA density
(%)
9,472 6.0
175 47.0
206 51.0
- -
56 77.0
17 121.0
- 117.0
- 2.0
9,926 6.0
6,980 19.0
822 44.0
1,182 74.0
- -
674 72.0
105 164.0
44 266.0
- 795.0
9,807 24.0
23,112 27.0
13,619 50.0
30,511 57.0
- -
60,358 76.0
30,251 106.0
2,143 169.0
1,867 215.0
161,861 59.0
t with the bank. Wholesalehe sovereign asset class.
Q4 20
own by asset class
k l
EL Provision
10
-
1
-
-
-
-
-
11
7
2
3
-
3
2
2
-
19
30
26
80
-
340
384
93
287
1,240 4
e obligors are reflected as
018
26
and
ns3
3
-
424

Roy CR6: IR
As at Octob
(Millions except a
Asset Cl
4 Corpora
Total
5 Total Wh
6 Retail reHELOCs
Total HELO
7 HELOCs
Total 1 Refer to “Inte2 Number of ounique borrow3 Provisions re
yal Bank of Ca
RB – Credit risk e
ber 31, 2018
of Canadian dollars, s otherwise noted)
lasses
ate - Specialized Lending
Corporate Specialized Lend
holesale
esidential mortgages excl. s
Retail residential mortgagesOCs
s
HELOCs
ernal ratings map” under t
obligors is defined as the nwers. For example, sovere
eflect only IFRS 9 Stage 3
anada Pillar 3
exposures by po
PD scale1
0.00 to < 0.15
0.15 to < 0.25
0.25 to < 0.50
0.50 to < 0.75
0.75 to < 2.50
2.50 to < 10.00
10.00 to < 100.0
100.00 (default
ding
0.00 to < 0.15
0.15 to < 0.25
0.25 to < 0.50
0.50 to < 0.75
0.75 to < 2.50
2.50 to < 10.00
10.00 to < 100.0
100.00 (default
s excl.
0.00 to < 0.15
0.15 to < 0.25
0.25 to < 0.50
0.50 to < 0.75
0.75 to < 2.50
2.50 to < 10.00
10.00 to < 100.0
100.00 (default
the Credit Risk Assessmen
number of borrowers in eaceign obligors include centra
3 allowances under the IRB
3 Report
ortfolio and PD r
a b
Original on-balance sheet
gross exposure
Off-bashe
exposuCC
451
25
2,196
-
4,609
0 3
00 -
) -
7,284
289,473 30
116,154
46,603
16,957
18,002
8,803
0 14,566
00 1,860
) 412
223,357
23,667 7
9,206
-
4,339
-
0 2,203
00 362
) 108
39,885 8
nt section in our 2018 Ann
ch PD band. For Retail expal banks or agencies, publ
B portfolio.
range (continue
b c
alance eet
ures pre CF
Average CCF (%)
240 58.05
192 61.56
371 59.78
- -
439 40.26
- -
- -
- -
1,242 53.20
05,830 52.83
238 100.00
153 100.00
167 100.00
47 100.00
107 100.00
46 100.00
- 100.00
- -
758 100.00
71,383 72.42
8,556 67.53
- -
2,033 64.84
- -
361 61.05
100 67.44
1 -
82,434 71.67
ual Report MD&A.
posures, a borrower can aic sector entities and mult
d)
d e
EAD post CRM and post-CCF
Average PD(%)
595 0.13
144 0.23
2,418 0.44
- -
4,779 0.93
- 2.64
- -
- -
7,936 0.71
497,212 0.74
114,009 0.06
35,659 0.23
2,692 0.45
15,476 0.65
353 1.10
7,820 4.22
978 42.71
193 100.00
177,180 0.83
75,363 0.05
14,984 0.21
- -
5,657 0.73
- -
2,423 4.97
430 44.24
108 100.00
98,965 0.53
appear in multiple PD bandilateral development bank
f g
Number of obligors2
Average(%)
3 7 3
3 3 3
4 70 2
- -
3 84 3
4 1 3
- -
- -
165 3
4 92,145 3
6 519,908 1
3 179,443 1
5 72,663 2
5 73,936 1
0 42,860 2
2 76,017 1
9,075 1
0 2,672 1
3 976,574 1
5 586,545 2
153,544 2
- -
3 67,949 2
- -
7 31,099 2
4 3,764 2
0 925 2
3 843,826 2
ds if the borrower has mores which are each reflected
h
e LGD )
Average maturity
(in years)
36.82 3.25
39.27 5.00
28.61 3.11
- -
32.13 3.82
30.00 1.98
- -
- -
31.54 3.58
31.63 2.12
16.07
18.99
21.41
19.66
25.54
19.48
18.47
19.49
17.23
21.26
21.25
-
22.04
-
22.08
21.22
23.96
21.33
re than one type of productd as unique borrowers in th
i j
RWA RWA density
(%)
209 35.0
94 66.0
1,199 50.0
- -
3,873 81.0
- 83.0
- -
- -
5,375 68.0
186,969 38.0
3,266 3.0
3,167 9.0
412 16.0
3,001 20.0
81 34.0
4,791 62.0
860 88.0
111 57.0
15,689 9.0
2,314 3.0
1,389 9.0
- -
1,338 24.0
- -
1,862 77.0
440 103.0
81 74.0
7,424 8.0
t with the bank. Wholesalehe sovereign asset class.
Q4 20
k l
EL Provision
-
-
3
-
15
-
-
-
18
1,288 4
12
15
2
20
1
63
77
32
222
8
7
-
9
-
27
41
25
117
e obligors are reflected as
018
27
ns3
-
427
33
25

Roy CR6: IR
As at Octob
(Millions except a
Asset Cl
8 Other rerevolvin
Total revolv
9 Qualifyin
Total
10 Total ret
Total 1 Refer to “Inte2 Number of ounique borrow3 Provisions re
yal Bank of Ca
RB – Credit risk e
ber 31, 2018
of Canadian dollars, s otherwise noted)
lasses
etail excl. Qualifying g retail
Other retail excl. Qualifying ving retail
ng revolving retail
Qualifying revolving retail
tail
ernal ratings map” under t
obligors is defined as the nwers. For example, sovere
eflect only IFRS 9 Stage 3
anada Pillar 3
exposures by po
PD scale1
0.00 to < 0.15
0.15 to < 0.25
0.25 to < 0.50
0.50 to < 0.75
0.75 to < 2.50
2.50 to < 10.00
10.00 to < 100.0
100.00 (default
0.00 to < 0.15
0.15 to < 0.25
0.25 to < 0.50
0.50 to < 0.75
0.75 to < 2.50
2.50 to < 10.00
10.00 to < 100.0
100.00 (default
the Credit Risk Assessmen
number of borrowers in eaceign obligors include centra
3 allowances under the IRB
3 Report
ortfolio and PD r
a b
Original on-balance sheet
gross exposure
Off-bashe
exposuCC
16,241
9,768
5,030
2,254
8,236
0 4,843
00 629
) 104
47,105
8,483 4
464
1,828
3,048
6,438
0 3,342
00 555
) 66
24,224 6
334,571 16
624,044 46
nt section in our 2018 Ann
ch PD band. For Retail expal banks or agencies, publ
B portfolio.
range (continue
b c
alance eet
ures pre CF
Average CCF (%)
5,742 99.38
1,353 97.74
715 100.05
720 116.73
1,918 98.68
789 94.77
25 93.69
1 -
11,263 99.88
46,719 95.10
403 109.58
6,613 107.42
4,282 95.12
7,706 97.12
2,010 96.75
158 86.55
2 -
67,893 96.65
62,348 92.66
68,178 63.37
ual Report MD&A.
posures, a borrower can aic sector entities and mult
d)
d e
EAD post CRM and post-CCF
Average PD(%)
21,935 0.08
11,046 0.20
5,683 0.45
3,092 0.63
9,930 1.21
5,332 4.00
470 43.41
80 100.00
57,568 1.22
52,915 0.08
906 0.17
8,932 0.34
7,121 0.59
13,923 1.50
5,286 4.80
692 38.74
66 100.00
89,841 1.01
423,554 0.85
920,766 0.79
appear in multiple PD bandilateral development bank
f g
Number of obligors2
Average(%)
8 481,274 4
0 338,873 5
5 217,618 6
3 136,800 5
518,091 7
0 331,274 7
23,829 6
0 3,086 6
2 2,050,845 5
8 6,345,031 8
7 57,029 7
4 3,371,429 8
9 784,376 8
0 3,590,109 8
0 1,686,755 8
4 551,565 8
0 45,703 8
16,431,997 8
5 20,303,242 3
9 20,395,387 3
ds if the borrower has mores which are each reflected
h
e LGD )
Average maturity
(in years)
49.29
54.43
66.86
53.72
74.01
73.09
66.67
65.46
58.88
88.71
78.54
87.84
86.21
89.29
89.97
89.12
85.78
88.49
38.96 -
35.00 2.12
re than one type of productd as unique borrowers in th
i j
RWA RWA density
(%)
2,431 11.0
2,457 22.0
2,720 48.0
1,398 45.0
8,338 84.0
5,932 111.0
793 169.0
142 178.0
24,211 42.0
2,383 5.0
69 8.0
1,367 15.0
1,650 23.0
6,761 49.0
5,887 111.0
1,755 254.0
182 274.0
20,054 22.0
67,378 16.0
254,347 27.6
t with the bank. Wholesalehe sovereign asset class.
Q4 20
k l
EL Provision
9
11
17
10
86
155
140
42
470
36
1
27
36
186
226
241
43
796
1,605
2,893 5
e obligors are reflected as
018
28
ns3
42
43
143
570

Roy CR6: M
As at Octob
(Millions otherwise
1 Sovereig
Total
2 CorporaSpecializ
Total Spec
3 Retail inmortgag
Total comm
Total 1 Refer to “Inte2 Provisions re
yal Bank of Ca
Memo Item: Retai
ber 31, 2018
of Canadian dollars, except e noted)
gns
Sovereigns
ates excl. zed Lending
Corporates excl. SMEs andialized Lending
nsured residential & commges & HELOCs
Retail insured residential & mercial mortgages & HELOC
ernal ratings map” under the flect only IFRS 9 Stage 3 all
anada Pillar 3
il Insured Expos
as PD scale1
0.00 to < 0.15
0.15 to < 0.25
0.25 to < 0.50
0.50 to < 0.75
0.75 to < 2.50
2.50 to < 10.0
10.00 to < 100.
100.00 (defaul
0.00 to < 0.15
0.15 to < 0.25
0.25 to < 0.50
0.50 to < 0.75
0.75 to < 2.50
2.50 to < 10.0
10.00 to < 100.
100.00 (defaul
ercial
0.00 to < 0.15
0.15 to < 0.25
0.25 to < 0.50
0.50 to < 0.75
0.75 to < 2.50
2.50 to < 10.0
10.00 to < 100.
100.00 (defaul
Cs
Credit Risk Assessment secowances under the IRB port
3 Report
sures
a
Original on-balance sheet
gross exposure
Of
exp
5 -
5 -
0 -
5 -
0 -
0 -
00 -
lt) -
-
5 -
5 -
0 -
5 -
0 -
0 -
00 -
lt) -
-
5 37,542
5 12,185
0 14,907
5 2,769
0 9,145
0 7,305
00 1,074
lt) 250
85,177
85,177 ction in our 2018 Annual Reptfolio.
b c
ff-balance sheet
posures pre CCF
Average CCF(%)
- -
- -
- -
- -
- -
- -
- -
- -
- -
- -
- -
- -
- -
- -
- -
- -
- -
- -
- -
- -
- -
- -
- -
- -
- -
- -
- -
- -port MD&A.
d
F EAD post CRM and Post CCF
Avera(%
- 47,645
- -
- -
- -
- -
- -
- -
- -
- 47,645
- 78
- -
- -
- -
- -
- -
- -
- -
- 78
- 35,148
- 1,043
- 411
- 192
- 390
- 252
- 9
- 8
- 37,453
- 85,176
e f
age PD %)
Average LGD (%)
0.01 15.06
- -
- -
- -
- -
- -
- -
- -
0.01 15.06
0.10 19.02
- -
- -
- -
- -
- -
- -
- -
0.10 19.02
0.09 10.07
0.17 11.39
0.38 13.04
0.65 10.83
1.17 21.31
4.00 25.84
26.00 79.09
100.00 78.05
0.16 10.40
0.08 13.01
g h
Average maturity
(in years) RWA
- 1
-
-
-
-
-
-
-
- 1
-
-
-
-
-
-
-
-
-
-
-
-
-
-
-
-
-
- 1
- 2
i
A RWA density
(%)
1,411 3.00
- -
- -
- -
- -
- -
- -
- -
1,411 3.00
23 30.00
- -
- -
- -
- -
- -
- -
- -
23 30.00
746 2.00
42 4.00
34 8.00
19 10.00
102 26.00
121 48.00
14 156.00
4 50.00
1,082 3.00
2,516 3.00
Q4 20
j k
EL Provisions2
1
-
-
-
-
-
-
-
1 1
-
-
-
-
-
-
-
-
-
3
-
-
-
1
4
2
6
16
17 1
018
29
3
-
6
9
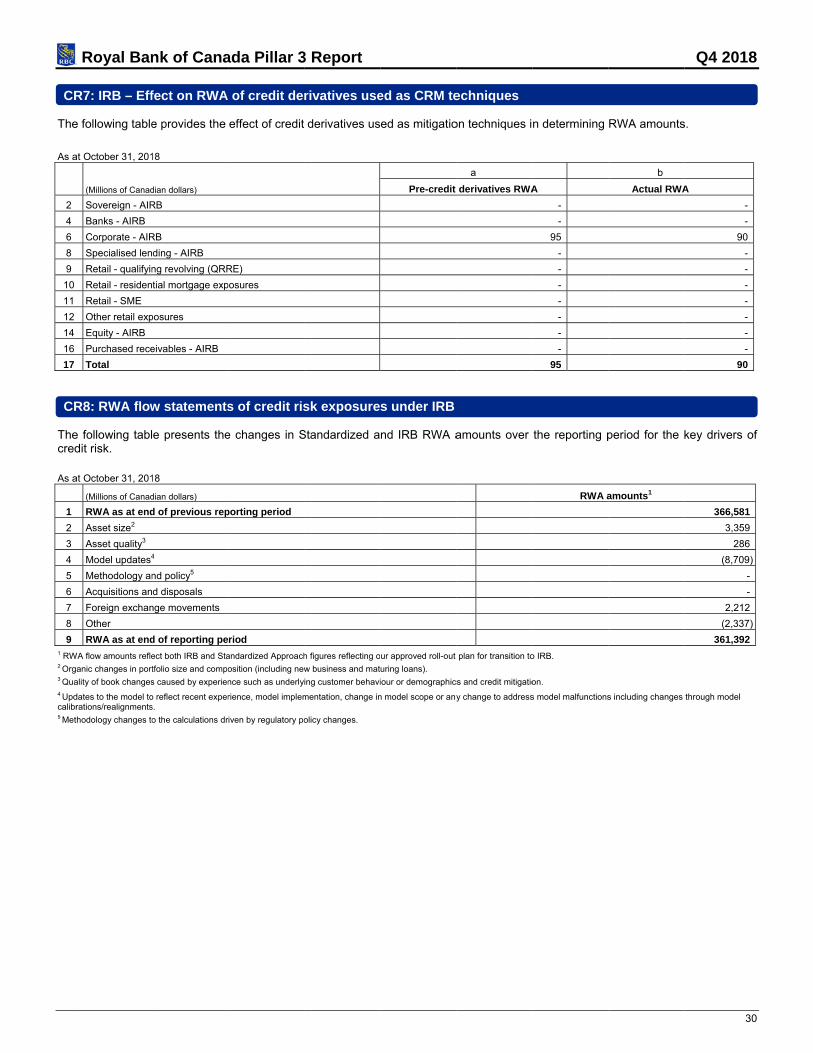
CR
The
As a
2
4
6
8
9
10
11
12
14
16
17
CR
Thecred As a
1
2
3
4
5
6
7
8
9 1 RW2 Org3 Qua4 Updcalibr5 Met
Royal Ban
R7: IRB – Eff
e following table
at October 31, 201
(Millions of Canad
Sovereign - AIR
Banks - AIRB
Corporate - AIR
Specialised len
Retail - qualifyin
Retail - residen
Retail - SME
Other retail exp
Equity - AIRB
Purchased rece
Total
R8: RWA flow
e following tabldit risk.
at October 31, 201
(Millions of Canad
RWA as at end
Asset size2
Asset quality3
Model updates4
Methodology an
Acquisitions an
Foreign exchan
Other
RWA as at end
WA flow amounts refle
anic changes in port
ality of book changes
dates to the model torations/realignments
thodology changes to
nk of Cana
fect on RWA
e provides the
18
dian dollars)
RB
RB
ding - AIRB
ng revolving (QRR
tial mortgage exp
posures
eivables - AIRB
w statements
e presents the
18
dian dollars)
d of previous rep
4
nd policy5
d disposals
nge movements
d of reporting pe
ect both IRB and Sta
tfolio size and compo
s caused by experien
o reflect recent expers.
o the calculations dr
ada Pillar 3
of credit de
effect of credit
RE)
posures
s of credit ris
e changes in S
porting period
riod
andardized Approach
osition (including new
nce such as underly
rience, model implem
iven by regulatory po
3 Report
rivatives use
derivatives us
sk exposure
Standardized a
h figures reflecting o
w business and mat
ing customer behavi
mentation, change in
olicy changes.
ed as CRM te
ed as mitigatio
Pre-credit
s under IRB
nd IRB RWA a
ur approved roll-out
uring loans).
iour or demographic
n model scope or any
echniques
on techniques i
a
derivatives RWA
amounts over
plan for transition to
cs and credit mitigatio
y change to address
n determining
A
-
-
95
-
-
-
-
-
-
-
95
the reporting p
RWA a
o IRB.
on.
s model malfunctions
RWA amounts
b
Actual RWA
period for the k
amounts1
s including changes
Q4 2018
30
s.
A
-
-
90
-
-
-
-
-
-
-
90
key drivers of
366,581
3,359
286
(8,709)
-
-
2,212
(2,337)
361,392
through model

Roy CR9: IR
The followcalculatio As at Octob
(Millions otherwise
Asset C1 Sovere Tota2 Banks Tota
3 Corpspec
Totaspec
1 Refer to "Int2 Weighted av3 Number of ounique borrow4 Number of d5 Number of n6 Defaulted ob7 Number of o
yal Bank of Ca
RB – Backtesting
wing table presentsns.
ber 31, 2018 a
of Canadian dollars, except e noted)
Classes eigns
l sovereigns
l banks
porates excl. cialized lending
l corporates excl. cialized lending ernal ratings map" under tverage PD means PD (afte
obligors is defined as the nwers. For example, soveredefaulted obligors in the yenew defaulted obligors in tbligors reflects obligors whobligors by PD range for th
anada Pillar 3
g of probability o
s a comparison of
b as
PD Range1
0.00 to < 0.15
0.15 to < 0.25
0.25 to < 0.50
0.50 to < 0.75
0.75 to < 2.50
2.50 to < 10.00
10.00 to < 100.00
100.00 (default)
0.00 to < 0.15
0.15 to < 0.25
0.25 to < 0.50
0.50 to < 0.75
0.75 to < 2.50
2.50 to < 10.00
10.00 to < 100.00
100.00 (default)
0.00 to < 0.15
0.15 to < 0.25
0.25 to < 0.50
0.50 to < 0.75
0.75 to < 2.50
2.50 to < 10.00
10.00 to < 100.00
100.00 (default)
the Credit Risk Assessmener CRM) weighted by EAD
number of borrowers in eaceign obligors include centraear includes i) existing oblihe year reflects the amoun
ho were in default after 90 he prior year has been upd
3 Report
of default (PD) p
the PD used in o
E
S&P Moody
AAA to A- Aaa to A
BBB+ to BBB Baa1 to B
BBB- to BB+ Baa3 to B
BB Ba2
BB- to B+ Ba3 to B
B to CCC+ B2 to Ca
CCC to CC Caa2 to
C or lower C or low
AAA to A- Aaa to A
BBB+ to BBB Baa1 to B
BBB- to BB+ Baa3 to B
BB Ba2
BB- to B+ Ba3 to B
B to CCC+ B2 to Ca
CCC to CC Caa2 to
C or lower C or low
AAA to A- Aaa to A
BBB+ to BBB Baa1 to B
BBB- to BB+ Baa3 to B
BB Ba2
BB- to B+ Ba3 to B
B to CCC+ B2 to Ca
CCC to CC Caa2 to
C or lower C or low
nt section in our 2018 AnnD as at October 31, 2018. A
ch PD band. For Retail expal banks or agencies, publgors not in default at the bnt in column g that relates days that have either retu
dated to align with current p
per portfolio
our IRB models wit
c
External rating equivalent
y's Fitch D
A3 AAA to A- AA
Baa2 BBB+ to BBB BBB
Ba1 BBB- to BB+ BBB
BB
B1 BB- to B+ BB
aa1 B to CCC+ BL t
Ca CCC or CC CCC
wer C or lower C o
A3 AAA to A- AA
Baa2 BBB+ to BBB BBB
Ba1 BBB- to BB+ BBB
BB
B1 BB- to B+ BB
aa1 B to CCC+ BL t
Ca CCC or CC CCC
wer C or lower C o
A3 AAA to A- AA
Baa2 BBB+ to BBB BBB
Ba1 BBB- to BB+ BBB
BB
B1 BB- to B+ BB
aa1 B to CCC+ BL t
Ca CCC or CC CCC
wer C or lower C o
ual Report MD&A. Arithmetic average PD is th
posures, a borrower can aic sector entities and mult
beginning of the year who wto new obligors in the yearned to performing status period PD methodology up
th the effective def
t
aDBRS Kroll
AA to AL AAA to A-
H to BBB BBB+ to BBB
L to BBH BBB- to BB+
BB BB
L to BH BB- to B+
to CCCH B to CCC+
C or CC CCC or CC
or lower C or lower
AA to AL AAA to A-
H to BBB BBB+ to BBB
L to BBH BBB- to BB+
BB BB
L to BH BB- to B+
to CCCH B to CCC+
C or CC CCC or CC
or lower C or lower
AA to AL AAA to A-
H to BBB BBB+ to BBB
L to BBH BBB- to BB+
BB BB
L to BH BB- to B+
to CCCH B to CCC+
C or CC CCC or CC
or lower C or lower
he sum of all the PDs (afte
appear in multiple PD bandilateral development bankwent into default during th
ar who went into default. or were written-off. For expdates.
fault rates of the b
d e
Weighted average PD2
Arithmeticaverage Pby obligor
0.03% 0.080.23% 0.230.32% 0.34
- 1.15% 1.333.19% 3.63
13.37% 17.56100.00% 100.00
0.03% 0.23
0.06% 0.090.23% 0.230.35% 0.38
- 0.98% 1.155.96% 6.56
22.24% 20.62100.00% 100.00
0.12% 0.81
0.09% 0.100.23% 0.230.61% 0.40
- 1.21% 1.273.71% 4.13
20.97% 19.33100.00% 100.00
1.28% 3.33
er CRM) over the number o
ds if the borrower has mores which are each reflectede year; and ii) new obligor
ample, unadvised overdra
bank’s obligors in o
f
c PD rs2
Number of oblig
End of previous year7
Eth
8% 1,827 3% 111 4% 81
- - 3% 47 3% 58 6% 3 0% 2 3% 2,129
9% 205 3% 43 8% 70
- - 5% 67 6% 20 2% 11 0% 1 1% 417
0% 7,451 3% 4,266 0% 13,987
- - 7% 30,848 3% 24,788 3% 1,521 0% 1,210
3% 84,071
of accounts as at October
re than one type of productd as unique borrowers in thrs in the year who went int
aft facilities have been inclu
order to validate th
g
gors3
Defaulted obligors in the year4,6
End of he year
1,859 -101 -81 -
- -55 -75 -2 13 -
2,176 1
238 -44 -70 -
- -101 -15 -13 -1 -
482 -
9,090 -4,644 -
14,909 5- 15
30,470 10627,532 3211,514 2631,163 -
89,322 710
r 31, 2018.
t with the bank. Wholesalehe sovereign asset class.to default.
uded that returned to perfo
Q4 20
he reliability of our
h iof which:
new defaulted obligors in the year5,6
Averahistoriannu
default
- - - - 1- - 01 5- 1
- - - - - - - 2- -
- 0- 03 0
12 060 0
178 0180 9
-
433
e obligors are reflected as
orming status.
018
31
r PD
age cal
ual rate
- - -
.05% -
.20%
.00% -
- - - - - -
.00% -
.02% .03% .05% .09% .31% .94% .25%
-

Roy CR9: IR
As at Octob
(Millions otherwise
Asset C
4 Corpspec
Totaspec
5 Retail rexcl. H
Totaexcl.
1 Refer to "Int2 Weighted av3 Number of ounique borrow4 Number of d5 Number of n6 Defaulted ob7 Number of o
yal Bank of Ca
RB – Backtesting
ber 31, 2018 a
of Canadian dollars, except e noted)
Classes
porate - cialized lending
l corporate - cialized lending
residential mortgages ELOGs
l retail residential mortga HELOCs ernal ratings map" under tverage PD means PD (afte
obligors is defined as the nwers. For example, soveredefaulted obligors in the yenew defaulted obligors in tbligors reflects obligors whobligors by PD range for th
anada Pillar 3
g of probability o
b as
PD Range1
0.00 to < 0.15
0.15 to < 0.25
0.25 to < 0.50
0.50 to < 0.75
0.75 to < 2.50
2.50 to < 10.00
10.00 to < 100.00
100.00 (default)
0.00 to < 0.15
0.15 to < 0.25
0.25 to < 0.50
0.50 to < 0.75
0.75 to < 2.50
2.50 to < 10.00
10.00 to < 100.00
100.00 (default)
ages
the Credit Risk Assessmener CRM) weighted by EAD
number of borrowers in eaceign obligors include centraear includes i) existing oblihe year reflects the amoun
ho were in default after 90 he prior year has been upd
3 Report
of default (PD) p
E
S&P Moody
AAA to A- Aaa to A
BBB+ to BBB Baa1 to B
BBB- to BB+ Baa3 to B
BB Ba2
BB- to B+ Ba3 to B
B to CCC+ B2 to Ca
CCC to CC Caa2 to
C or lower C or low
nt section in our 2018 AnnD as at October 31, 2018. A
ch PD band. For Retail expal banks or agencies, publgors not in default at the bnt in column g that relates days that have either retu
dated to align with current p
per portfolio (con
c
External rating equivalent
y's Fitch D
A3 AAA to A- AA
Baa2 BBB+ to BBB BBB
Ba1 BBB- to BB+ BBB
BB
B1 BB- to B+ BB
aa1 B to CCC+ BL t
Ca CCC or CC CCC
wer C or lower C o
ual Report MD&A. Arithmetic average PD is th
posures, a borrower can aic sector entities and mult
beginning of the year who wto new obligors in the yearned to performing status period PD methodology up
ntinued)
t
aDBRS Kroll
AA to AL AAA to A-
H to BBB BBB+ to BBB
L to BBH BBB- to BB+
BB BB
L to BH BB- to B+
to CCCH B to CCC+
C or CC CCC or CC
or lower C or lower
he sum of all the PDs (afte
appear in multiple PD bandilateral development bankwent into default during th
ar who went into default. or were written-off. For expdates.
d e
Weighted average PD2
Arithmeticaverage Pby obligor
0.13% 0.180.23% 0.230.44% 0.46
- 0.93% 0.932.64% 2.64
- -
0.71% 0.66
0.06% 0.070.23% 0.210.45% 0.360.65% 0.651.10% 0.844.22% 3.72
42.71% 44.67100.00% 100.00
0.83% 1.17
er CRM) over the number o
ds if the borrower has mores which are each reflectede year; and ii) new obligor
ample, unadvised overdra
f
c PD rs2
Number of oblig
End of previous year7
Eth
8% 9 3% 5 6% 90
- - 3% 184 4% 3
- - - -
6% 291
7% 497,374 1% 180,048 6% 73,987 5% 76,241 4% 44,340 2% 68,977 7% 5,488 0% 2,826
7% 949,281
of accounts as at October
re than one type of productd as unique borrowers in thrs in the year who went int
aft facilities have been inclu
g
gors3
Defaulted obligors in the year4,6
End of he year
7 -3 -
70 -- -
84 -1 -- -- -
165 -
519,908 208179,443 -72,663 11773,936 10942,860 38076,017 3369,075 2,2272,672 -
976,574 3,377
r 31, 2018.
t with the bank. Wholesalehe sovereign asset class.to default.
uded that returned to perfo
Q4 20
h iof which:
new defaulted obligors in the year5,6
Averahistoriannu
default
- - - - - 0- - -
-
2 0- 02 01 0
12 02 0
29 9-
48
e obligors are reflected as
orming status.
018
32
age cal
ual rate
- - - -
.65% - - -
.01% .03% .03% .03% .30% .64% .30%
-

Roy CR9: IR
As at Octob
(Millions otherwise
Asset C6 HELOC Tota
7 Other rrevolvi
Totarevo
8 Qualify Tota
1 Refer to "Int2 Weighted av3 Number of ounique borrow4 Number of d5 Number of n6 Defaulted ob7 Number of o
yal Bank of Ca
RB – Backtesting
ber 31, 2018 a
of Canadian dollars, except e noted)
Classes Cs
l HELOCs retail excl. qualifying ng retail
l other retail excl. qualifylving retail
ying revolving retail6
l qualifying revolving reta
ernal ratings map" under tverage PD means PD (afte
obligors is defined as the nwers. For example, soveredefaulted obligors in the yenew defaulted obligors in tbligors reflects obligors whobligors by PD range for th
anada Pillar 3
g of probability o
b as
PD Range1
0.00 to < 0.15
0.15 to < 0.25
0.25 to < 0.50
0.50 to < 0.75
0.75 to < 2.50
2.50 to < 10.00
10.00 to < 100.00
100.00 (default)
0.00 to < 0.15
0.15 to < 0.25
0.25 to < 0.50
0.50 to < 0.75
0.75 to < 2.50
2.50 to < 10.00
10.00 to < 100.00
100.00 (default)
ying
0.00 to < 0.15
0.15 to < 0.25
0.25 to < 0.50
0.50 to < 0.75
0.75 to < 2.50
2.50 to < 10.00
10.00 to < 100.00
100.00 (default)
ail
the Credit Risk Assessmener CRM) weighted by EAD
number of borrowers in eaceign obligors include centraear includes i) existing oblihe year reflects the amoun
ho were in default after 90 he prior year has been upd
3 Report
of default (PD) p
E
S&P Moody
nt section in our 2018 Ann
D as at October 31, 2018. A
ch PD band. For Retail expal banks or agencies, publgors not in default at the bnt in column g that relates days that have either retu
dated to align with current p
per portfolio (con
c
External rating equivalent
y's Fitch D
ual Report MD&A.
Arithmetic average PD is th
posures, a borrower can aic sector entities and mult
beginning of the year who wto new obligors in the yearned to performing status period PD methodology up
ntinued)
t
aDBRS Kroll
he sum of all the PDs (afte
appear in multiple PD bandilateral development bankwent into default during th
ar who went into default. or were written-off. For expdates.
d e
Weighted average PD2
Arithmeticaverage Pby obligor
0.05% 0.050.21% 0.21
- 0.73% 0.73
- 4.97% 4.97
44.24% 45.72100.00% 100.77
0.53% 0.64
0.08% 0.080.20% 0.190.45% 0.460.63% 0.591.21% 1.264.00% 4.01
43.41% 41.07100.00% 100.00
1.22% 1.77
0.08% 0.070.17% 0.170.34% 0.310.59% 0.581.50% 1.564.80% 4.84
38.74% 41.41100.00% 100.00
1.01% 2.59
er CRM) over the number o
ds if the borrower has mores which are each reflectede year; and ii) new obligor
ample, unadvised overdra
f
c PD rs2
Number of oblig
End of previous year7
Eth
5% 511,175 1% 142,123
- - 3% 61,067
- - 7% 21,763 2% 1,916 7% 985 4% 739,029
8% 286,661 9% 302,179 6% 213,776 9% 76,216 6% 466,065 1% 267,020 7% 28,008 0% 4,896
7% 1,644,821 2
7% 5,548,104 67% 31,405 1% 3,217,194 38% 598,782 6% 3,329,434 34% 1,501,333 11% 397,307 0% 45,250 9% 14,668,809 16
of accounts as at October
re than one type of productd as unique borrowers in thrs in the year who went int
aft facilities have been inclu
g
gors3
Defaulted obligors in the year4,6
End of he year
586,545 164153,554 -
- -67,949 -
- 9231,099 3183,764 807
925 -843,836 1,381
481,274 65338,863 10217,618 635136,800 8518,091 2,028331,274 1,91223,829 5,9503,086 -
2,050,835 10,608
6,345,031 -57,029 991
3,371,429 991784,376 12
3,590,109 12,2511,686,755 26,684
551,565 165,81045,703 -
6,431,997 206,739
r 31, 2018.
t with the bank. Wholesalehe sovereign asset class.to default.
uded that returned to perfo
Q4 20
h iof which:
new defaulted obligors in the year5,6
Averahistoriannu
default
1 0- - - 0- 01 18 10-
10
10 0- 0
50 01 0
604 0238 1
1,027 6-
1,930
- 60 017 03 0
718 02,477 1
50,813 20-
54,088
e obligors are reflected as
orming status.
018
33
age cal
ual rate
.02%
- -
.06%
.33%
.02%
.16% -
.06% .04% .11% .09% .46% .21% .95%
-
- .04% .03% .05% .30% .70% .06%
-

CO
CC
Theincohttp
P
a)
b)
c)
d)
e)
CC
Royal Ban
OUNTERPAR
CRA: Qualita
e table below porporated by rp://www.rbc.com
Pillar 3 disclos
Risk managempolicies relatecredit risk
The method uoperating limitinternal capitacredit exposuexposures
Policies relatinother risk mitigassessments counterparty cexposures tow
Policies with rrisk exposures
The impact inof collateral threquired to prorating downgr
CRA: Qualita
nk of Cana
RTY CREDIT
ative disclos
presents an ovreference into m/investorrelat
sures requirem
ment objectivesed to counterpa
used to assign ts defined in teal for counterpares and for CC
ng to guarantegants and concerning
credit risk, incluwards CCPs
respect to wrons
terms of the ahat the bank woovide given a crade
ative disclos
ada Pillar 3
RISK
ure related to
verview of Pillathis Pillar 3
ions
ment RBC
s and arty
Credit
Conso
the erms of arty
CP Credit
es and
uding
Credit
Conso
ng-way Credit
mount ould be credit
Liquid
ure related to
3 Report
o counterpa
r 3 disclosure report. Our 2
2018 Annual R
t Risk
olidated Financ
t Risk
t Risk
olidated Financ
t Risk
dity and funding
o counterpa
rty credit ris
requirements 2018 Annual R
Report section
cial Statements
cial Statements
g risk
rty credit ris
k
that have beeReport is avai
n
Credit risk a
s
Note 8 - Deractivities – D
Note 2 - Sumestimates an
Credit risk a
Credit risk a
s
Note 8 - Deractivities – D
Note 30 - Ofliabilities
Credit risk a
Credit rating
k (continue
n met within oilable free of
Sub-s
assessment – C
rivative financiaDerivative-relat
mmary of signifnd judgements
assessment – C
assessment – C
rivative financiaDerivative-relat
ffsetting financ
assessment – C
gs
our 2018 Annuacharge on ou
section
Counterparty cr
al instruments ted credit risk
ficant accountis – Derivatives
Counterparty cr
Counterparty cr
al instruments ted credit risk
cial assets and
Counterparty cr
Q4 2018
34
al Report andur website at
redit risk
and hedging
ng policies,
redit risk
redit risk
and hedging
financial
redit risk

CC
ThemaiFigu
As a
1
1a
2
3
4
5
6 1 RW
CC
The
As a
1
2
3
4 1 RW
CC
Theby p
As a
Reg(Millio
Sove
Nonentit
Mult
Bank
Secu
Corp
Reg
Othe
Tota
Royal Ban
CR1: Analys
e following tablin parameters ures below refl
at October 31, 201
(Millions of Canad
SA-CCR (for de
Current Exposu
Internal Model
Simple Approac
Comprehensive
VaR for SFTs
Total
WA includes a calibrat
CR2: Credit v
e following table
at October 31, 201
(Millions of Canad
Total portfolios
(i) VaR compon
(ii) Stressed Va
All portfolios su
Total subject t
WA reflects OSFI perm
CR3: Standa
e following tablportfolio and ris
at October 31, 201
ulatory portfolio ons of Canadian dollar
ereigns
-central governmeties (PSEs)
tilateral developm
ks
urities firms
porates
ulatory retail portf
er assets
al
nk of Cana
is of counter
le provides a cused within eaect both house
18
dian dollars, except a
erivatives)
ure Method (CEM
Method (for deriva
ch for credit risk m
e Approach for cre
tion adjustment of 1.
valuation adj
e presents a br
18
dian dollars)
subject to the Adv
nent (including the
aR component (inc
ubject to the Stand
to the CVA capita
mitted CVA phase-in
rdized appro
e presents a bsk weight.
18
Risk weight
rs)
ent public sector
ent banks (MDBs
folios
ada Pillar 3
rparty credit
comprehensiveach method, if e and client trad
as otherwise noted)
- for derivatives)
atives and SFTs)
mitigation (for SFT
edit risk mitigation
.06% as prescribed b
justment (CV
reakdown of th
vanced CVA capi
e 3x multiplier)
cluding the 3x mu
dardized CVA cap
al charge
n of 86% for Total Ca
oach – CCR e
breakdown of c
a
0%
-
-
) -
-
-
-
-
-
-
3 Report
risk (CCR) e
e view of the mapplicable. Re
des.
Ts)
n (for SFTs)
by OSFI under the B
VA) capital c
e CVA capital
tal charge
ltiplier)
pital Charge
apital in 2018. CVA p
exposures b
counterparty cr
b c
10% 20
-
-
-
-
-
-
-
-
-
exposure by
methods used efer to CCR 8
a
Replacement Cost
27,702
Basel III framework.
harge
charge by adva
phase-in is no longer
y regulatory
edit risk expos
c d
0% 50%
-
-
-
30
-
625
-
-
655
approach
to calculate c8 for our centra
b
Potential future
exposure E
37,877
anced and stan
r applicable in 2019.
y portfolio an
sures calculate
e
75%
- -
- -
- -
- -
- -
- -
- -
- -
- -
counterparty cral counterparty
c d
EEPE
Alpha ufor
compuregulat
EAD
ndardized appr
a
EAD post
.
nd risk weigh
ed according to
f
100% 15
-
-
-
27
7
626
-
-
660
edit risk exposy clearing hous
e used
ting tory D
EAD post-CRM
1.4
63,90
170,56
roaches.
t-CRM
64,008
64,008
hts
o the standardiz
g h
50% Others
-
-
-
-
-
-
-
-
-
Q4 2018
35
sures and the se exposures.
f
M RWA1
03 19,234
62 10,254
29,488
b
RWA1
13,335
13,335
zed approach
i
Total credit exposure
- -
- -
- -
- 57
- 7
- 1,251
- -
- -
- 1,315

CC
The
As a
(MilliodollaotherAsseSove
ToBan
ToCorp
Corpspec
Tosp
Tota1 Ref
Royal Ban
CR4: IRB – C
e following table
at October 31, 201
ons of Canadian rs, except as rwise noted) et classes ereigns
otal sovereigns ks
otal banks porates
porates excl. cialized lending
otal corporates expecialized lending
al
fer to “Internal rating
nk of Cana
CCR exposur
e presents a de
18
PD sc
0.00 to <0.15 to <0.25 to <0.50 to <0.75 to <2.50 to <
10.00 100.00 (d
0.00 to <0.15 to <0.25 to <0.50 to <0.75 to <2.50 to <
10.00 100.00 (d
0.00 to <0.15 to <0.25 to <0.50 to <0.75 to <2.50 to <
10.00 100.00 (d
xcl. g
s map” in the Credit
ada Pillar 3
res by portfo
etailed view of
cale1
a
EADpost-C
< 0.15 2< 0.25 < 0.50 < 0.75 < 2.50 < 10.00 to <
default)
2
< 0.15 10< 0.25 1< 0.50 1< 0.75 < 2.50 < 10.00 to <
default)
13
< 0.15 5< 0.25 < 0.50 < 0.75 < 2.50 < 10.00 to <
default)
7
23
risk assessment sec
3 Report
olio and PD s
CCR exposure
b
D CRM
Average(%)
4,736
40 166
- 5 5 - -
4,952
6,888 7,942 1,921
- 1,007
4 - -
7,762
3,6706,4905,999
-3,623
62413 115 10
0,434
3,148
ction in our 2018 An
scale
es subject to IR
c
e PD Number obligors
0.03 0.23 0.34
- 0.88 2.73
- -
0.04 4
0.09 0.23 0.33
- 0.89 3.13
- -
0.13
0.07 6,0.23 1,0.34 1,4
-1.083.184.80
00.00
0.21 10,
0.15 11,
nual Report MD&A.
RB approach by
d
of s
Average LG(%)
385 10.
15 22.29 39.
- 6 45.3 45.- -
438 10.
377 12.71 10.
108 15.-
56 5.10 45.
- -
622 12.
288 35.194 35.410 36.
-936 35.506 42.
11 45.5 45.
350 35.
410 19.
y asset classes
e
GD Average maturity
(in years)
.68 1.8
.30 1.7
.49 1.5-
.00 1.0
.00 1.1- -
.90 1.8
.68 0.5
.45 0.2
.19 0.7-
.71 0.1
.00 1.0- -
.55 0.5
.29 0.8
.27 1.6
.95 1.0-
.86 1.7
.96 1.9
.00 1.5
.00 1.2
.53 0.9
.23 0.7
s and PD scale
f
RWA
83 70974 957 67
- 00 317 6
- -
83 794
53 7,67728 1,91371 2,255
- 16 10600 5
- -
51 11,956
83 7,1163 2,49509 2,60
- 73 2,85599 7650 2720 9
98 15,94
79 28,691
Q4 2018
36
e.
g
RWA density(%)
9 39 217 41- -3 736 115- -- -
4 3
7 73 115 19- -6 115 126- -- -
6 9
1 135 381 43- -5 791 1227 2181 596
1 23
1 12
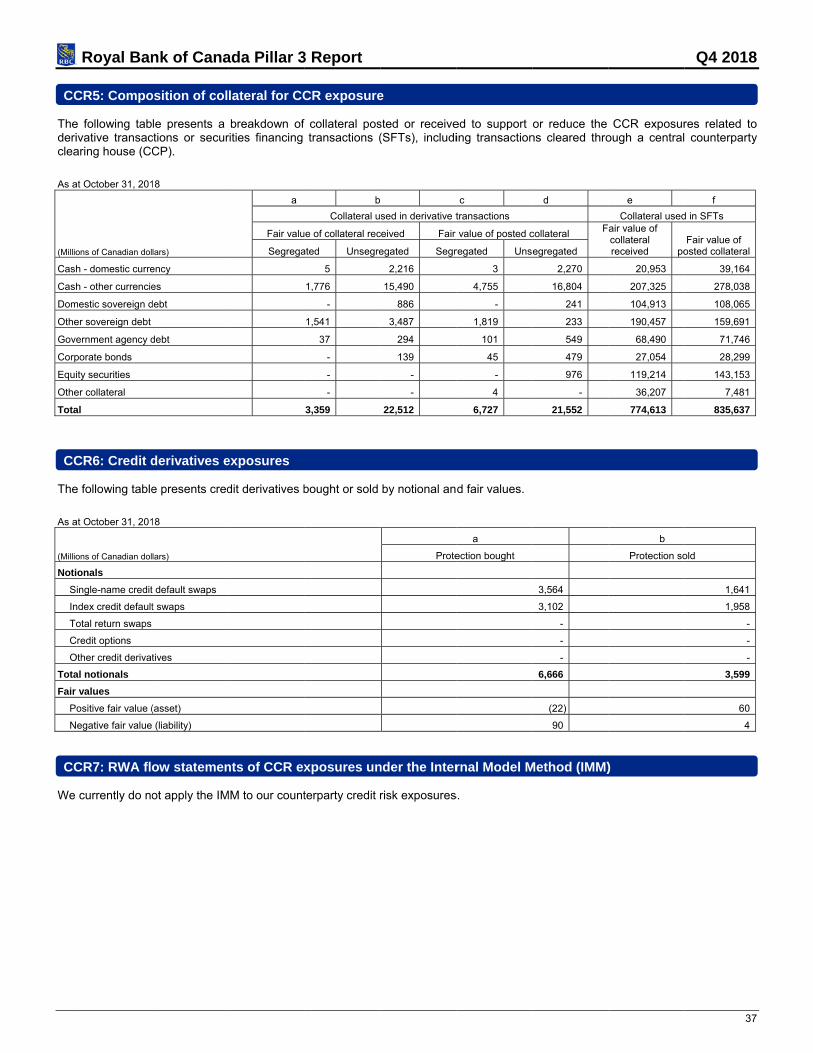
CC
Thedericlea
As a
(Millio
Cash
Cash
Dom
Othe
Gov
Corp
Equi
Othe
Tota
CC
The
As a
(Millio
Noti
S
In
To
C
O
Tota
Fair
P
N
CC
We
Royal Ban
CR5: Compo
e following tabivative transacaring house (CC
at October 31, 201
ons of Canadian dol
h - domestic curre
h - other currencie
mestic sovereign d
er sovereign debt
ernment agency d
porate bonds
ity securities
er collateral
al
CR6: Credit d
e following table
at October 31, 201
ons of Canadian dol
ionals
ingle-name credit
ndex credit default
otal return swaps
Credit options
Other credit derivat
al notionals
r values
ositive fair value (
egative fair value
CR7: RWA flo
currently do no
nk of Cana
osition of col
le presents a ctions or securCP).
18
lars)
ency
es
debt
debt
derivatives e
e presents cred
18
lars)
t default swaps
t swaps
tives
(asset)
(liability)
ow statemen
ot apply the IM
ada Pillar 3
lateral for CC
breakdown ofrities financing
a
Fair valu
Segrega
exposures
dit derivatives b
nts of CCR ex
MM to our count
3 Report
CR exposure
f collateral postransactions (
b
Collateral u
ue of collateral rec
ated Unsegre
5
1,776
-
1,541
37
-
-
-
3,359
bought or sold
xposures un
terparty credit r
e
sted or receive(SFTs), includi
sed in derivative t
ceived Fair
egated Segr
2,216
15,490
886
3,487
294
139
-
-
22,512
by notional an
Prote
nder the Inter
risk exposures
ed to support ing transaction
c
transactions
value of posted c
regated Uns
3
4,755
-
1,819
101
45
-
4
6,727
d fair values.
a
ection bought
rnal Model M
s.
or reduce the ns cleared thro
d
collateral F
egregated
2,270
16,804
241
233
549
479
976
-
21,552
3,564
3,102
-
-
-
6,666
(22)
90
Method (IMM)
CCR exposurough a central
e
Collateral usedair value of collateral received po
20,953
207,325
104,913
190,457
68,490
27,054
119,214
36,207
774,613
b
Protection so
)
Q4 2018
37
res related to counterparty
f
d in SFTs
Fair value of osted collateral
39,164
278,038
108,065
159,691
71,746
28,299
143,153
7,481
835,637
old
1,641
1,958
-
-
-
3,599
60
4

CC
Theto o
As a
(Millio
1
2
3
4
5
6
7
8
9
10
11
12
13
14
15
16
17
18
19
20 1 Unf
Royal Ban
CR8: Exposu
e following tableoperations, mar
at October 31, 201
ons of Canadian dol
Exposures to Q
Exposures for tdefault fund con
(i) OTC deriv
(ii) Exchange
(iii) Securitie
(iv) Netting sapproved
Segregated init
Non-segregated
Pre-funded defa
Unfunded defau
Exposures to
Exposures for tdefault fund con
(i) OTC deriv
(ii) Exchange
(iii) Securitie
(iv) Netting sapproved
Segregated init
Non-segregated
Pre-funded defa
Unfunded defau
funded default fund c
nk of Cana
ures to centr
e presents a corgins and contr
18
lars)
QCCPs (total)
trades at QCCPs ntributions); of wh
vatives
e-traded derivative
s financing transa
sets where cross-p
tial margin
d initial margin
ault fund contribu
ult fund contributio
non-QCCPs (tota
trades at non-QCCntributions); of wh
vatives
e-traded derivative
s financing transa
sets where cross-p
tial margin
d initial margin
ault fund contribu
ult fund contributio
contributions are risk
ada Pillar 3
ral counterpa
omprehensive ributions to defa
(excluding initial mhich
es
actions
product netting ha
tions
ons1
al)
CPs (excluding inhich
es
actions
product netting ha
tions
ons
k weighted at 0%.
3 Report
arties
view of our exault funds, and
margin and
as been
itial margin and
as been
xposures to cend related RWA.
EAD
ntral counterpa
a
D (post-CRM)
arty clearing ho
35,301
26,582
13,590
11,285
1,707
-
2,396
1,875
889
3,559
ouses (CCPs),
b
RWA
Q4 2018
38
including due
620
543
283
226
34
-
37
40
-

SE
SE
Theincohttp
a)
b)
c)
d)
e)
f)
Royal Ban
ECURITIZAT
ECA: Qualita
e table below porporated by rp://www.rbc.com
Pillar 3 disclo
Objectives in securitization
List of SPEs w/ provides imp
Accounting posecuritization
the names of assessment iused for secutypes of secuwhich each a
Use of Basel purposes
Use of other ifor capital pur
nk of Cana
ION
ative disclosu
presents an ovreference into m/investorrelat
sures require
relation to activities
where RBC is splicit support
olicies for
external creditnstitution (ECA
uritizations and ritization exposgency is used
IAA for capital
internal assessrposes
ada Pillar 3
ure requirem
verview of Pillathis Pillar 3
ions
ment RBC
Off-b
Cons
Cons
sponsor Cons
Cons
Criticestim
t AIs)
the sure for
Capi(also
Cred
Capi
sment Cred
3 Report
ments related
r 3 disclosure report. Our 2
C 2018 Annual
balance sheet a
solidated Finan
solidated Finan
solidated Finan
solidated Finan
cal accounting mates
tal Managemeo refer to CRD i
dit risk
tal Manageme
dit risk
d to securitiza
requirements 2018 Annual R
l Report sectio
arrangements
ncial Statement
ncial Statement
ncial Statement
ncial Statement
policies and
nt in this docume
nt
ation exposu
that have beeReport is avai
on
"Off-balanc
ts Note 6 - D
ts Note 7 - St
ts Note 7 - St
ts
Note 2 - Suestimates - Basis of c- Derecogn
Consolidat
ent)Regulatoryexposures
n/a
Regulatoryexposures
Credit risk
ures
n met within oilable free of
Sub-
ce sheet arrang
erecognition of
tructured entitie
tructured entitie
ummary of signand judgmentsconsolidation nition of financi
tion of structure
y capital approas
y capital approas
assessment
our 2018 Annuacharge on ou
-section
gements"
f financial asse
es
es
nificant accouns
ial assets
ed entities
ach for securiti
ach for securiti
Q4 2018
39
al Report and ur website at
ets
nting policies,
ization
ization

SE
The
As a
(Millio
1
2
3
4
4a
4b
4c
4d
5
6
7
8
9
10
10a
10b
10c
10d
11 1 Ban2 Banfacilit3 Ban
Royal Ban
EC1: IRB – S
e following table
at October 31, 201
ons of Canadian dol
Retail (total) - of which
residential m
credit card
other retail eof which sloans of which aand leaseof which cloans
of which o
re-securitizatWholesale (tot– of which
loans to corp
commercial m
lease and re
other wholes
a of which dplan recei
b of which ereceivable
c of which treceivable
d of which owholesale
re-securitizatnk acts as originator nk acts as sponsor reties to the SPE. nk acts as investor re
nk of Cana
Securitization
e presents the
18
lars) Tra
mortgage
exposures student
auto loans es consumer
other retail
tion
tal)
porates
mortgage
ceivables
sale dealer floor vable
equipment e rade e other e
tion reflects securitizatio
eflects securitization
eflects purchases of
ada Pillar 3
n exposures
breakdown of
a b
Bank acts as
aditional Synth
1,598
-
1,569
29
-
-
-
29
-
-
-
-
-
-
-
-
-
-
- n activities in which activities in which R
securitization assets
3 Report
in the bankin
our balance sh
c
s originator1
hetic Sub-tota
- 1,59
-
- 1,56
- 2
-
-
-
- 2
-
-
-
-
-
-
-
-
-
-
- we securitize our ow
RBC works with its cl
s from the market.
ng book
heet banking bo
e
Bank
l Traditional
98 35,753
- 1,671
69 7,487
29 26,595
- 4,204
- 18,664
- 3,727
29 -
- -
- 12,934
- 1,939
- -
- -
- 8,892
- 1,839
- 2,463
- 668
- 3,922
- 2,103 wn assets (e.g. Goldeient to originate secu
ook carrying va
f
k acts as sponsor2
Synthetic S
-
-
-
-
-
-
-
-
-
-
-
-
-
-
-
-
-
-
- en credit card securiuritization transactio
alues by our ro
g i 2
ub-total Tradit
35,753 5
1,671 3
7,487
26,595 1
4,204 1
18,664
3,727
-
-
12,934 7
1,939 6
-
-
8,892
1,839
2,463
668
3,922
2,103 itization). ns. RBC provides th
ole and type.
j
Bank acts as in
tional Synthetic
5,573
3,291
586
1,696
1,212
484
-
-
-
7,478
6,239
957
-
282
-
-
-
282
-
he liquidity and credit
Q4 2018
40
k
nvestor3
c Sub-total
- 5,573
- 3,291
- 586
- 1,696
- 1,212
- 484
- -
- -
- -
- 7,478
- 6,239
- 957
- -
- 282
- -
- -
- -
- 282
- -
t enhancement
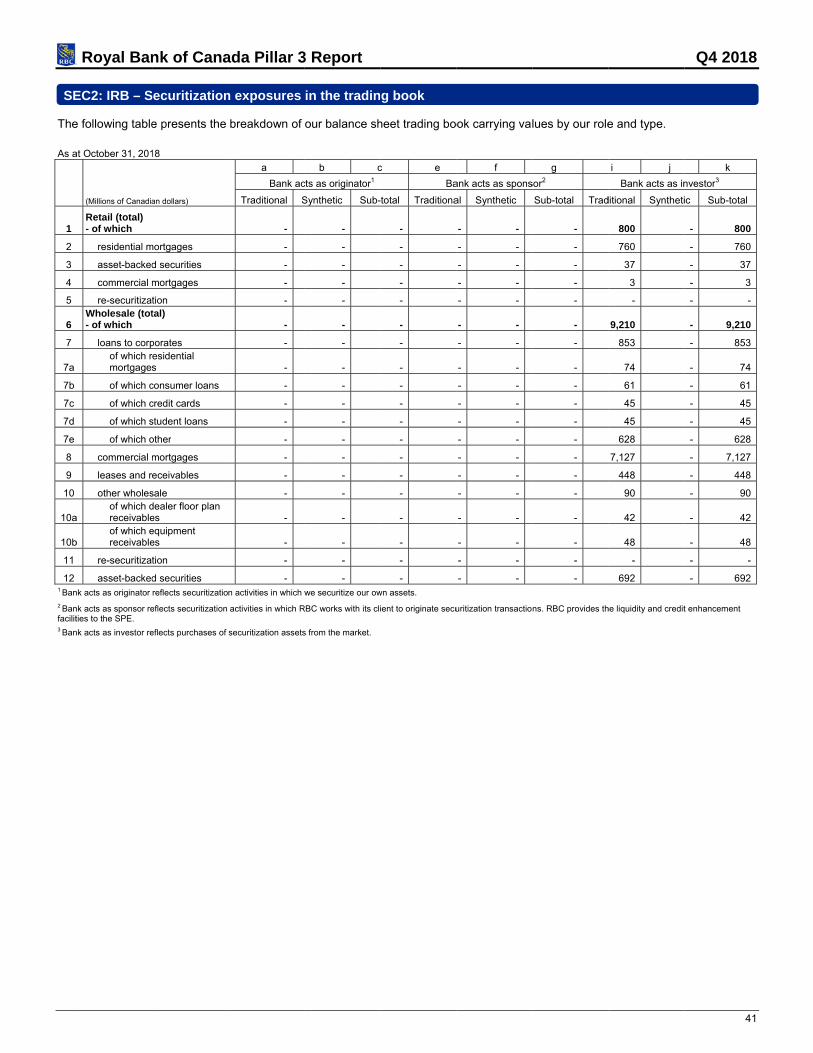
SE
The As a
1
2
3
4
5
6
7
7a
7b
7c
7d
7e
8
9
10
10a
10b
11
12 1 Ban
2 Banfacilit3 Ban
Royal Ban
EC2: IRB – S
e following table
at October 31, 201
(Millions of Canadia
Retail (total) - of which
residential m
asset-backed
commercial m
re-securitizatWholesale (tot- of which
loans to corpof which rmortgages
of which c
of which c
of which s
of which o
commercial m
leases and r
other wholes
a of which dreceivable
b of which ereceivable
re-securitizat
asset-backed
nk acts as originator
nk acts as sponsor reties to the SPE.
nk acts as investor re
nk of Cana
Securitization
e presents the
18
an dollars)
mortgages
d securities
mortgages
tion
tal)
porates
residential s
consumer loans
credit cards
student loans
other
mortgages
eceivables
sale
dealer floor plan es
equipment es
tion
d securities
reflects securitizatio
eflects securitization
eflects purchases of
ada Pillar 3
n exposures
breakdown of
a
Bank ac
Traditional S
-
-
-
-
-
-
-
-
-
-
-
-
-
-
-
-
-
-
-
n activities in which
activities in which R
securitization assets
3 Report
in the tradin
our balance sh
b c
cts as originator1
Synthetic Sub-
-
-
-
-
-
-
-
-
-
-
-
-
-
-
-
-
-
-
-
we securitize our ow
RBC works with its cl
s from the market.
g book
heet trading bo
c e
Ba
-total Traditiona
-
-
-
-
-
-
-
-
-
-
-
-
-
-
-
-
-
-
-
wn assets.
ient to originate secu
ook carrying val
f
ank acts as spons
al Synthetic
- -
- -
- -
- -
- -
- -
- -
- -
- -
- -
- -
- -
- -
- -
- -
- -
- -
- -
- -
uritization transactio
lues by our role
g
sor2
Sub-total Trad
-
-
-
-
-
-
-
-
-
-
-
-
-
-
-
-
-
-
-
ns. RBC provides th
e and type.
i j
Bank acts as in
ditional Syntheti
800
760
37
3
-
9,210
853
74
61
45
45
628
7,127
448
90
42
48
-
692
he liquidity and credit
Q4 2018
41
k
nvestor3
ic Sub-total
- 800
- 760
- 37
- 3
- -
- 9,210
- 853
- 74
- 61
- 45
- 45
- 628
- 7,127
- 448
- 90
- 42
- 48
- -
- 692
t enhancement
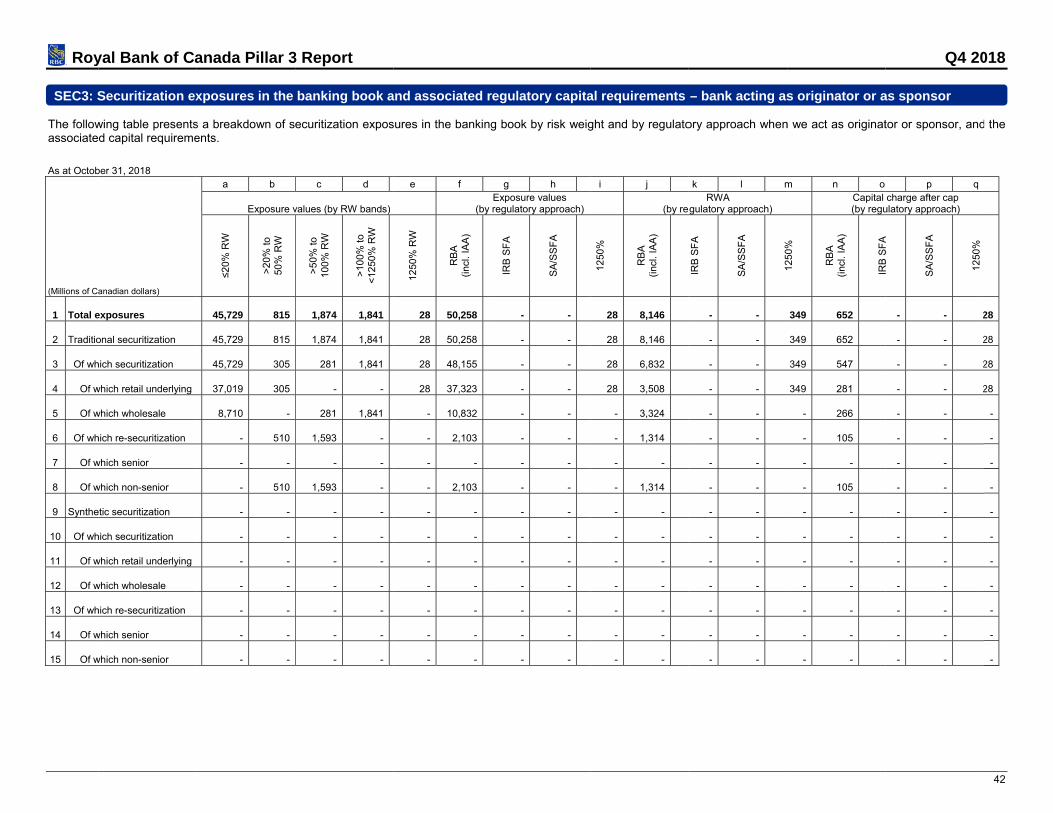
Roy SEC3: S
The followassociate
As at Octob
(Millions of Ca
1 Total e
2 Traditio
3 Of wh
4 Of w
5 Of w
6 Of wh
7 Of w
8 Of w
9 Synthe
10 Of wh
11 Of w
12 Of w
13 Of wh
14 Of w
15 Of w
yal Bank of Ca
Securitization ex
wing table presentsd capital requireme
ber 31, 2018
anadian dollars)
exposures
onal securitization
hich securitization
which retail underlying
which wholesale
hich re-securitization
which senior
which non-senior
etic securitization
hich securitization
which retail underlying
which wholesale
hich re-securitization
which senior
which non-senior
anada Pillar 3
xposures in the
s a breakdown of sents.
a b
Exposure v
≤20
% R
W
>2
0%
to
50
% R
W
45,729 815
45,729 815
45,729 305
37,019 305
8,710 -
- 510
- -
- 510
- -
- -
- -
- -
- -
- -
- -
3 Report
banking book a
ecuritization expos
c d
values (by RW bands)
>5
0%
to
10
0%
RW
>1
00
% t
o
<1
250
% R
W
1,874 1,841
1,874 1,841
281 1,841
- -
281 1,841
1,593 -
- -
1,593 -
- -
- -
- -
- -
- -
- -
- -
and associated r
sures in the banking
e f
(by
12
50%
RW
RB
A
(inc
l. IA
A)
28 50,258
28 50,258
28 48,155
28 37,323
- 10,832
- 2,103
- -
- 2,103
- -
- -
- -
- -
- -
- -
- -
regulatory capita
g book by risk weig
g h
Exposure values regulatory approach)
IRB
SF
A
SA
/SS
FA
- -
- -
- -
- -
- -
- -
- -
- -
- -
- -
- -
- -
- -
- -
- -
al requirements
ght and by regulato
i j
(by re
12
50%
RB
A
(inc
l. IA
A)
28 8,146
28 8,146
28 6,832
28 3,508
- 3,324
- 1,314
- -
- 1,314
- -
- -
- -
- -
- -
- -
- -
– bank acting as
ory approach when
k l mRWA
egulatory approach)
IRB
SF
A
SA
/SS
FA
12
50%
- -
- -
- -
- -
- -
- -
- -
- -
- -
- -
- -
- -
- -
- -
- -
s originator or a
n we act as originat
m n oCapital (by regu
12
50%
RB
A
(inc
l. IA
A)
IRB
SF
A
349 652
349 652
349 547
349 281
- 266
- 105
- -
- 105
- -
- -
- -
- -
- -
- -
- -
Q4 20
as sponsor
tor or sponsor, and
p qcharge after cap
ulatory approach)
IRB
SF
A
SA
/SS
FA
12
50%
- - 2
- - 2
- - 2
- - 2
- -
- -
- -
- -
- -
- -
- -
- -
- -
- -
- -
018
42
d the
28
28
28
28
-
-
-
-
-
-
-
-
-
-
-

Roy SEC4: S
The followcapital req
As at Octob
(Millions of Ca
1 Total e
2 Traditio
3 Of wh
4 Of w
5 Of w
6 Of wh
7 Of w
8 Of w
9 Synthe
10 Of wh
11 Of w
12 Of w
13 Of wh
14 Of w
15 Of w
yal Bank of Ca
Securitization ex
wing table presentsquirements.
ber 31, 2018
anadian dollars)
exposures
onal securitization
hich securitization
which retail underlying
which wholesale
hich re-securitization
which senior
which non-senior
etic securitization
hich securitization
which retail underlying
which wholesale
hich re-securitization
which senior
which non-senior
anada Pillar 3
xposures in the
s a breakdown of s
a b
Exp(by
≤20
%
RW
>2
0%
to
50
% R
W
12,940 83
12,940 83
12,940 83
5,461 83
7,479 -
- -
- -
- -
- -
- -
- -
- -
- -
- -
- -
3 Report
banking book a
securitization expos
c d
posure values y RW bands)
>5
0%
to
10
0%
RW
>1
00
% t
o
<1
250
% R
W
7 -
7 -
7 -
7 -
- -
- -
- -
- -
- -
- -
- -
- -
- -
- -
- -
and associated c
sures in the bankin
e f
(by
12
50%
RW
RB
A
(inc
lud
ing
IAA
)
23 13,030
23 13,030
23 13,030
23 5,551
- 7,479
- -
- -
- -
- -
- -
- -
- -
- -
- -
- -
capital requireme
ng book by risk wei
g h
Exposure values regulatory approach)
IRB
SF
A
SA
/SS
FA
- -
- -
- -
- -
- -
- -
- -
- -
- -
- -
- -
- -
- -
- -
- -
ents – bank acti
ight and by regulat
i j
(by re
12
50%
RB
A
(inc
lud
ing
IAA
)
23 1,542
23 1,542
23 1,542
23 964
- 578
- -
- -
- -
- -
- -
- -
- -
- -
- -
- -
ing as investor
tory approach whe
k l m
RWA egulatory approach)
IRB
SF
A
SA
/SS
FA
12
50%
- -
- -
- -
- -
- -
- -
- -
- -
- -
- -
- -
- -
- -
- -
- -
n we act as invest
m n o
Capital
12
50%
RB
A
(inc
lud
ing
IAA
)
IRB
SF
A
284 123
284 123
284 123
284 77
- 46
- -
- -
- -
- -
- -
- -
- -
- -
- -
- -
Q4 20
tor, and the associa
p q
charge after cap
IRB
SF
A
SA
/SS
FA
12
50%
- - 2
- - 2
- - 2
- - 2
- -
- -
- -
- -
- -
- -
- -
- -
- -
- -
- -
018
43
ated
23
23
23
23
-
-
-
-
-
-
-
-
-
-
-
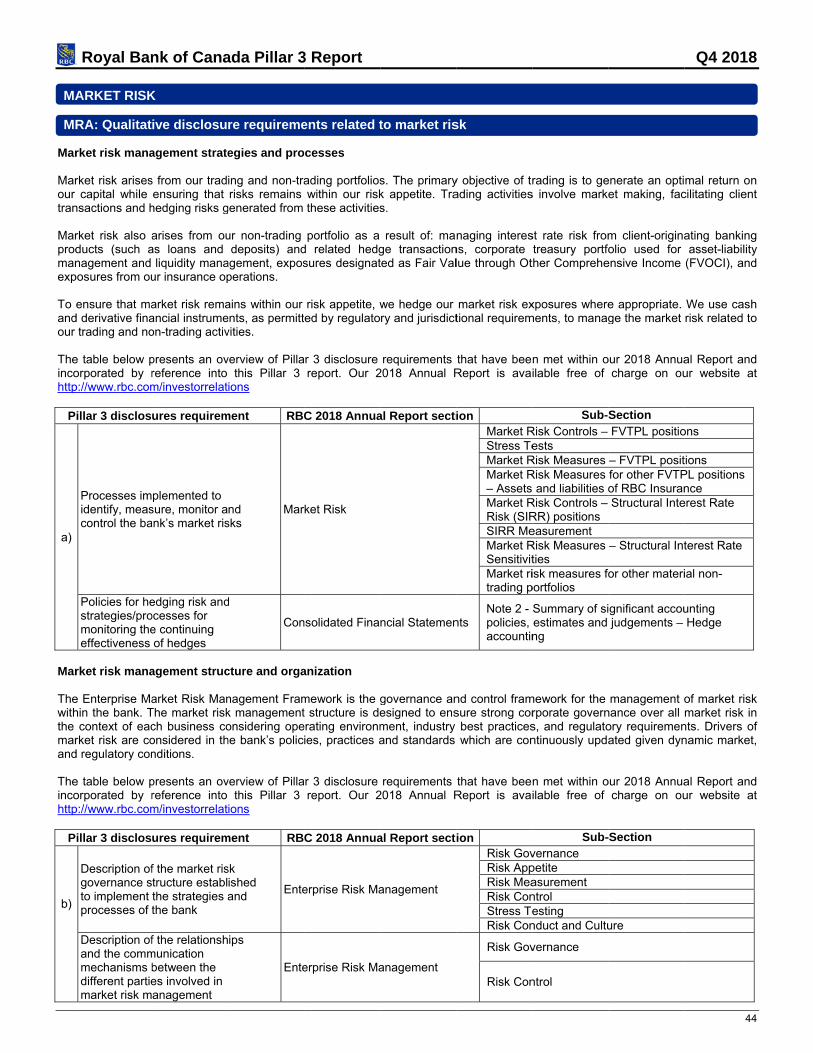
MA
MR
Mar Marour tran Marprodmanexp To andour Theincohttp
P
a)
Mar Thewiththe marand Theincohttp
P
b)
Royal Ban
ARKET RISK
RA: Qualitat
rket risk mana
rket risk arisescapital while
nsactions and h
rket risk also aducts (such anagement and
posures from ou
ensure that mad derivative fina
trading and no
e table below porporated by rp://www.rbc.com
illar 3 disclos
Processes imidentify, meascontrol the ba
Policies for hestrategies/promonitoring theeffectiveness
rket risk mana
e Enterprise Mahin the bank. T
context of eacrket risk are co
d regulatory con
e table below porporated by rp://www.rbc.com
illar 3 disclos
Description ofgovernance sto implement processes of t
Description ofand the commmechanisms bdifferent partiemarket risk m
nk of Cana
K
ive disclosu
agement strate
s from our tradensuring that
hedging risks g
arises from ouas loans and
liquidity manaur insurance op
arket risk remaancial instrumeon-trading activ
presents an ovreference into m/investorrelat
ures requirem
plemented to sure, monitor aank’s market ris
edging risk andocesses for e continuing of hedges
agement struc
arket Risk ManThe market riskch business coonsidered in thnditions.
presents an ovreference into m/investorrelat
ures requirem
f the market ristructure establthe strategies athe bank
f the relationshmunication between the es involved in anagement
ada Pillar 3
re requireme
egies and pro
ing and non-trarisks remains
generated from
ur non-trading deposits) and
agement, exposperations.
ains within our ents, as permittvities.
verview of Pillathis Pillar 3
ions
ment RBC
nd sks
Mar
d
Con
cture and orga
nagement Framk managementonsidering opehe bank’s polic
verview of Pillathis Pillar 3
ions
ment RB
sk ished and
Ente
ips
Ente
3 Report
ents related t
ocesses
ading portfolioswithin our riskthese activities
portfolio as a d related hedgsures designat
risk appetite, wed by regulato
r 3 disclosure report. Our 2
C 2018 Annua
ket Risk
nsolidated Fina
anization
mework is the gt structure is deerating environmies, practices a
r 3 disclosure report. Our 2
C 2018 Annua
erprise Risk Ma
erprise Risk Ma
to market ris
s. The primaryk appetite. Tras.
result of: mange transactionted as Fair Val
we hedge our ry and jurisdict
requirements 2018 Annual R
al Report secti
ncial Statemen
governance anesigned to ensment, industry and standards
requirements 2018 Annual R
al Report secti
anagement
anagement
sk
y objective of trading activities
naging interesns, corporate lue through Ot
market risk extional requirem
that have beeReport is avai
ionMarket RStress TeMarket RMarket R– Assets Market RRisk (SIRSIRR MeMarket RSensitivitMarket ritrading p
nts Note 2 - policies, accountin
nd control framsure strong cor
best practiceswhich are con
that have beeReport is avai
ionRisk GovRisk AppRisk MeaRisk ConStress TeRisk Con
Risk Gov
Risk Con
rading is to ges involve marke
st rate risk fromtreasury portfo
ther Comprehe
xposures wherements, to manag
n met within oilable free of
Sub-Risk Controls – ests
Risk Measures Risk Measures and liabilities o
Risk Controls – RR) positions easurement Risk Measures ties isk measures fo
portfolios
Summary of siestimates and ng
mework for the rporate governs, and regulatontinuously upda
n met within oilable free of
Sub-vernance petite asurement ntrol esting nduct and Cultu
vernance
ntrol
enerate an optiet making, fac
m client-originaolio used for
ensive Income
e appropriate. ge the market
our 2018 Annuacharge on ou
Section FVTPL positio
– FVTPL positfor other FVTPof RBC InsuranStructural Inte
– Structural Int
or other materi
gnificant accoujudgements –
management onance over all ory requiremenated given dyn
our 2018 Annuacharge on ou
-Section
ure
Q4 2018
44
mal return on cilitating client
ating banking asset-liability
(FVOCI), and
We use cash risk related to
al Report and ur website at
ons
tions PL positions nce
erest Rate
terest Rate
ial non-
unting Hedge
of market risk market risk in
nts. Drivers of namic market,
al Report and ur website at

MR
Sco Theincohttp
P
c)
MR
Inte
M
ReguValu(VaR
Stres(SVa
IncreRisk(IRC1 As a
VaR Thehavtotawhiccap For impsom
Royal Ban
RA: qualitati
ope and nature
e table below porporated by rep://www.rbc.com
illar 3 disclos
Scope and nareporting and/systems
RB: Qualitat
ernal models u
Measure
ulatory ue at Risk R)
VaR holditen-dto geto comix o
ssed VaR aR)
SVaRperiovolatconti
emental k Charge C)
IRC year unde
at October 31, 2018.
R and SVaR
e VaR and SVave obtained appal risk measurech we do not
pital.
management pact the bank’sme positions ins
nk of Cana
ve disclosur
e of risk repor
resents an oveeference into thm/investorrelat
ures requirem
ature of risk /or measureme
ive disclosu
used for meas
is a statistical meaing period. We meaday holding period enerate potential prompute VaR comprof absolute and rela
R is calculated dailod of extreme volattility during that timinues to reflect the
captures the risk ofhorizon at a 99.9%
er a constant level o
.
aR models areproval from ou; along with a thave regulato
purposes, VaR revenue acrosstead of full-rev
ada Pillar 3
re requireme
rting and/or m
erview of Pillar his Pillar 3 repoions
ment RBC
ent
Ente
Mar
res for banks
suring Market
asure of potential loasure VaR at the 9for regulatory capitrofit or loss values arises of the recent tative returns are us
y in a similar mannility. We currently ue in relation to the one year period of
f losses under defa% confidence level, of risk assumption.
e used for comur regulator. Wetotal correlatedry approval fo
R and SVaR ass the trading valuation, and i
3 Report
ents related t
measurement s
3 disclosure reort. Our 2018 A
C 2018 Annua
erprise Risk Ma
ket Risk
s using the i
Risk
De
oss for a financial p9th percentile confidtal measurement. Tarising from historictwo years of equallysed in generating th
ner as VaR, but basuse the historical perisks within our por
f greatest potential
ault or rating changand captures diffe
mputing regulate model a gen risk measure wr models base
are both compubook and non-inactive non-tra
to market ris
systems
equirements thaAnnual Report is
al Report secti
anagement
nternal mod
scription
portfolio computed adence level for a onThe measure is comcally observed dailyy weighted market he historical marke
sed on a ten-day hoeriod from Septembrtfolio. This historicloss for our portfoli
ges for issuers of trarent liquidity horizo
ory capital for neral market riswhich combine
ed capital, we
uted with one-d-trading book. ading book pos
k (continued
at have been ms available free
ionRisk MeaRisk ConStress TeMarket RStress TeMarket RMarket R– Assets Market RRisk (SIRSIRR MeMarket RSensitivitMarket Rtrading p
dels approach
at a given level of cne-day holding permputed daily, usingy market movemendata, and is rolled
et changes.
olding period directber 2008 to August
cal period is assessio.
aded instruments. ons for instruments
trading book psk measure, a es the above diuse the Stand
day holding peA sensitivity-la
sitions are refre
d)
met within our 2e of charge on
Sub-S
asurement ntrol esting
Risk Controls – ests
Risk Measures Risk Measures
and liabilities oRisk Controls – RR) positions easurement Risk Measures ties
Risk Measures portfolios
h (IMA)
confidence and overiod, and then scaleg a full-revaluation ants. The historical pforward at least m
tly and using a onet 2009, given the m
sed quarterly to ens
IRC is measured oand concentration
positions acrosdebt specific ristributions. Fodardized Appro
eriods and are adder interpolaeshed monthly
2018 Annual Rour website at
Section
FVTPL positio
– FVTPL positfor other FVTPof RBC InsuranStructural Inte
– Structural Int
for other mater
Pem
regu
er a defined e up to a approach period used onthly. A
e year market sure that it
over a one-s in issuers
ss the enterpririsk measure, aor portions of ouoach to compu
applied to all ation approach .
Q4 2018
45
Report and
ons
tions PL positions nce
erest Rate
terest Rate
rial non-
ercentage of market risk ulatory capital1
8%
22%
30%
se, where we and an equity ur portfolio for ute regulatory
positions that is applied for

MR
Theincohttp
P
c)
g)
Thereguto oVaRexpallo Whcapmodincothre Incr Ourmodscedetedefadatamon TheVaRstremea
Royal Ban
RB: Qualitat
e table below porporated by rep://www.rbc.com
illar 3 disclosGeneral descmodels (VaR/Description ofapplied to theparameters
e VaR and SVaular basis by a
ongoing model R on a daily bapectations of thws for compar
ile the majorityptured. This cadels. These Rorporated into tesholds regular
remental Risk
r IRC model isdelling techniqnarios due to iermined using ault observatioa. For the Monnths, six month
e IRC model is R and SVaR mess testing the asure, we do n
nk of Cana
ive disclosu
resents an oveeference into thm/investorrelat
ures requiremription of the /stressed VaR)f stress testing modelling
aR models are model validatiperformance masis, in order te applied confisons to the tot
y of market rian occur due tRisks Not in Vthe VaR moderly.
k Charge
s applied to deque known as issuer ratings ma transition prns. Correlation
nte Carlo procehs, or one year
also subject toodels. Model phistorical correot perform bac
ada Pillar 3
res for banks
erview of Pillar his Pillar 3 repoions
ment RBC
Mar
Mar
e governed by ion group that monitoring. Theto ensure that fidence intervaltal correlated V
sks are reflectto infrastructur
VaR (RNIV) arels, where poss
ebt instrumentthe Monte Ca
migration and robability matrixns between issess, each posit, depending on
o the same indeperformance moelation and liquick-testing of the
3 Report
s using the i
3 disclosure reort. Our 2018 A
C 2018 Annua
ket Risk
ket Risk
a model risk gis independent
e VaR model isactual outcoml. Backtesting i
VaR, the genera
ted in our VaRre limitations, lre identified thsible. An asses
ts, credit produarlo simulationdefault in ordex which is caliuer regions antion is assignedn its issuer type
ependent vettinonitoring includidity assumptioe IRC model as
nternal mod
equirements thaAnnual Report is
al Report secti
governance frat of the model ds back tested b
mes in trading rs also performal market risk V
R models, thelack of historic
hrough backtesssment of resid
ucts, and credprocess is us
er to establish tbrated using red sectors are cd a liquidity hoe, credit rating,
ng, validation pdes reviews anons. Due to the s we do for the
dels approach
at have been ms available free
ion
Market R
Stress Te
amework, whicdevelopers. Th
by comparing mrevenue do no
med using a hypVaR, and asset
ere is the potecal market datsting and othedual RNIV mat
it derivatives wsed to generathe losses at tecent 20 yearscalibrated usin
orizon (the lengand maturity p
procedures andnd stress testing long time horiz
e VaR measure
h (continued
met within our 2e of charge on
Sub-S
Risk Controls –
ests
h requires thathe VaR and SVmarked-to-markot exceed the Vpothetical profit class VaR me
ential for certata or missing er model monteriality is revie
within our tradate a statisticahat confidences of historical ig five years of
gth of time to cprofile.
d model risk gog of model asszon and high c
e.
d)
2018 Annual Rour website at
Section
FVTPL positio
t models are vVaR models areket revenue to VaR projectionit and loss calceasures separa
in risks to be risk factors wi
nitoring procesewed and mon
ding portfolios.lly relevant nu
e level. These issuer ratings mf historical equiclose out a pos
overnance framsumptions, whicconfidence leve
Q4 2018
46
Report and
ons
validated on a e also subject the computed
ns beyond the culation which ately.
inadequately ithin our VaR
sses, and are itored against
A probability umber of loss scenarios are migration and ity time series sition) of three
mework as the ch includes el of the risk
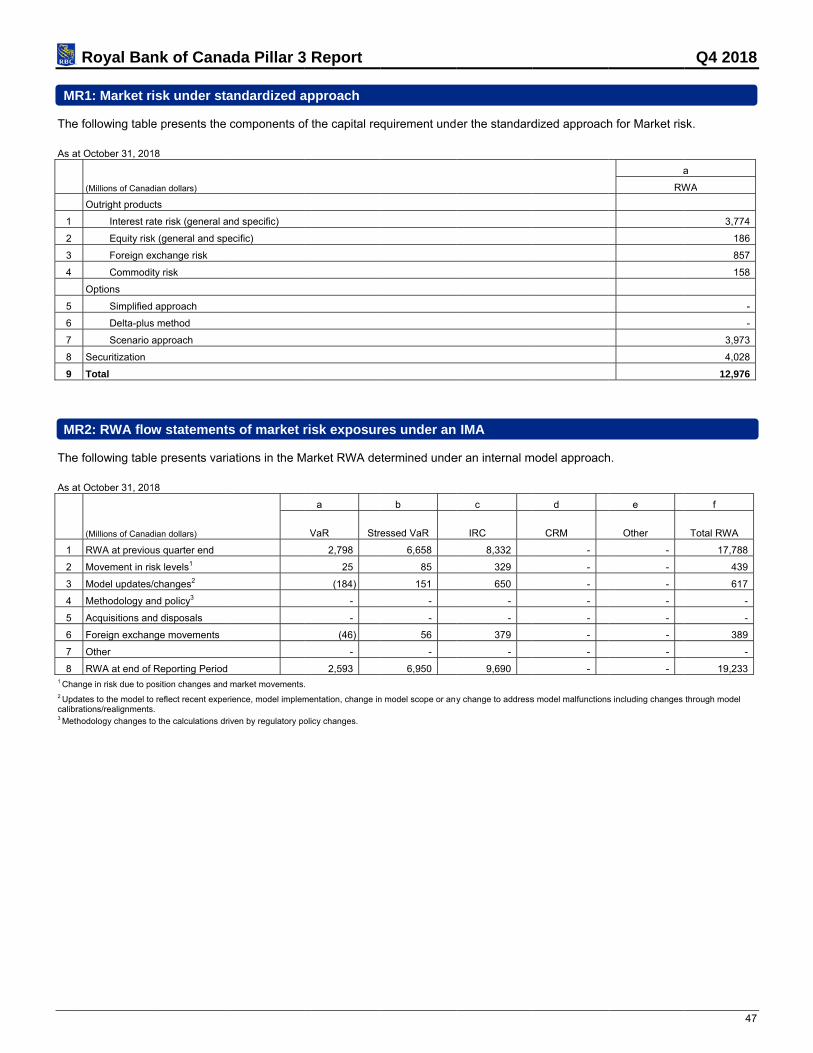
MR
The As a
1
2
3
4
5
6
7
8
9
MR
The As a
1
2
3
4
5
6
7
8 1 Cha2 Updcalibr3 Met
Royal Ban
R1: Market r
e following table
at October 31, 201
(Millions of Canad
Outright produc
Interest ra
Equity risk
Foreign ex
Commodi
Options
Simplified
Delta-plus
Scenario a
Securitization
Total
R2: RWA flow
e following table
at October 31, 201
(Millions of Canad
RWA at previou
Movement in ris
Model updates/
Methodology an
Acquisitions an
Foreign exchan
Other
RWA at end of
ange in risk due to po
dates to the model torations/realignmentsthodology changes to
nk of Cana
isk under sta
e presents the
18
dian dollars)
cts
ate risk (general a
k (general and spe
xchange risk
ty risk
approach
s method
approach
w statement
e presents vari
18
dian dollars)
us quarter end
sk levels1
/changes2
nd policy3
d disposals
nge movements
Reporting Period
osition changes and
o reflect recent expers. o the calculations dr
ada Pillar 3
andardized a
components o
nd specific)
ecific)
s of market r
ations in the M
market movements.
rience, model implem
iven by regulatory po
3 Report
approach
of the capital re
risk exposur
Market RWA de
a
VaR Str
2,798
25
(184)
-
-
(46)
-
2,593
.
mentation, change in
olicy changes.
quirement und
res under an
etermined unde
b
essed VaR
6,658
85
151
-
-
56
-
6,950
n model scope or any
er the standard
IMA
er an internal m
c
IRC
8,332
329
650
-
-
379
-
9,690
y change to address
dized approach
model approach
d
CRM
-
-
-
-
-
-
-
-
s model malfunctions
h for Market ris
a
RW
h.
e
Other
-
-
-
-
-
-
-
-
s including changes
Q4 2018
47
sk.
a
WA
3,774
186
857
158
-
-
3,973
4,028
12,976
f
Total RWA
17,788
439
617
-
-
389
-
19,233
through model
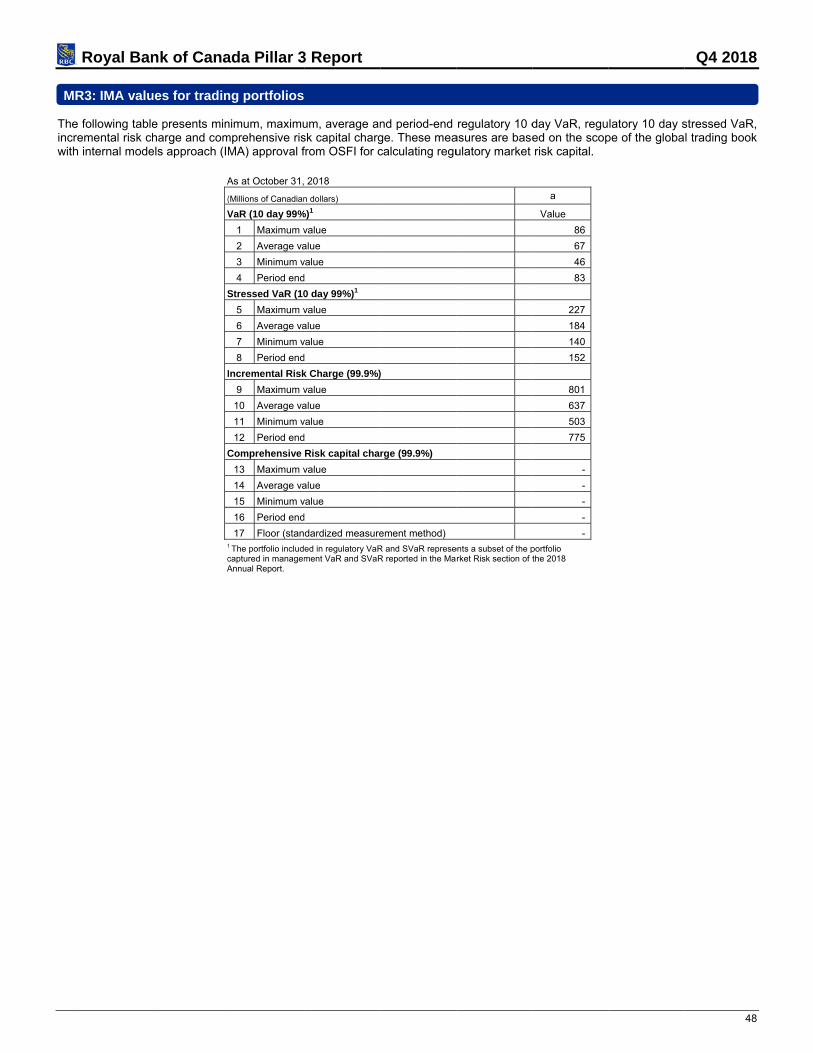
MR
Theincrwith
Royal Ban
R3: IMA valu
e following tableremental risk chh internal mode
nk of Cana
ues for tradin
e presents minharge and comels approach (IM
A
(
V
S
I
C
1
cA
ada Pillar 3
ng portfolios
nimum, maximumprehensive risMA) approval f
As at October 31,
(Millions of Canadian
VaR (10 day 99%
1 Maximum v
2 Average va
3 Minimum v
4 Period end
Stressed VaR (10
5 Maximum v
6 Average va
7 Minimum v
8 Period end
Incremental Risk
9 Maximum v
10 Average va
11 Minimum v
12 Period end
Comprehensive
13 Maximum v
14 Average va
15 Minimum v
16 Period end
17 Floor (stan1 The portfolio includcaptured in managemAnnual Report.
3 Report
um, average ansk capital chargfrom OSFI for c
2018
n dollars)
%)1
value
alue
value
d
0 day 99%)1
value
alue
value
d
k Charge (99.9%)
value
alue
value
d
Risk capital cha
value
alue
value
d
dardized measure
ed in regulatory VaRment VaR and SVaR
nd period-end ge. These meacalculating regu
)
rge (99.9%)
ement method)
R and SVaR represeR reported in the Ma
regulatory 10 dasures are baseulatory market
ents a subset of the prket Risk section of t
day VaR, regued on the scoprisk capital.
a
Value 86
67
46
83
227
184
140
152
801
637
503
775
- - - - -
portfolio the 2018
latory 10 day spe of the globa
Q4 2018
48
stressed VaR, l trading book
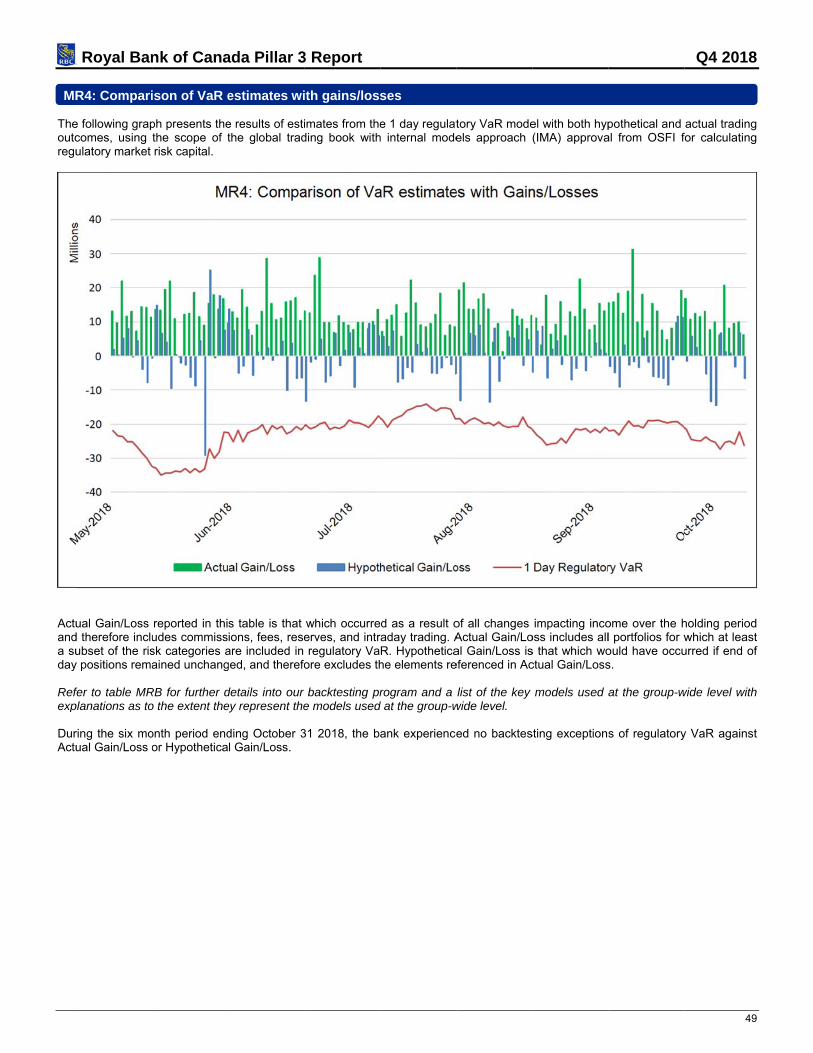
MR
Theoutcregu
Actuanda suday Refexp DurActu
Royal Ban
R4: Compari
e following grapcomes, using ulatory market
ual Gain/Loss d therefore incluubset of the ris
y positions rema
fer to table MRplanations as to
ring the six moual Gain/Loss o
nk of Cana
ison of VaR e
ph presents thethe scope of trisk capital.
reported in thiudes commisssk categories aained unchang
RB for further do the extent the
onth period endor Hypothetica
ada Pillar 3
estimates wi
e results of estithe global trad
s table is that ions, fees, rese
are included in ged, and therefo
details into our ey represent the
ding October 3l Gain/Loss.
3 Report
ith gains/loss
imates from theding book with
which occurreerves, and intrregulatory Va
ore excludes th
r backtesting pre models used
31 2018, the b
ses
e 1 day regulath internal mode
d as a result oraday trading. AR. Hypotheticahe elements re
rogram and a d at the group-w
ank experience
tory VaR modeels approach
of all changes Actual Gain/Loal Gain/Loss iseferenced in Ac
list of the key wide level.
ed no backtes
el with both hyp(IMA) approva
impacting incooss includes alls that which woctual Gain/Loss
models used
sting exceptions
pothetical and al from OSFI f
ome over the hl portfolios for would have occus.
at the group-w
s of regulatory
Q4 2018
49
actual trading for calculating
holding period which at least urred if end of
wide level with
y VaR against

OP
Theincohttp
P
a)
b)
c)
IN
Theincohttp
Inte
Royal Ban
PERATIONA
e table below porporated by rp://www.rbc.com
Pillar 3 disclos
Details of the operational risfor which the
Description ofmeasurementoperational ris
Description offor the purposoperational ris
TEREST RA
e table below porporated by rp://www.rbc.com
Pillar 3 disclo
erest rate risk in
nk of Cana
L RISK
presents an ovreference into m/investorrelat
sures requirem
approach for sk capital assebank qualifies
f the advancedt approaches fosk (AMA)
f the use of insse of mitigatingsk
TE RISK IN T
presents an ovreference into m/investorrelat
sures require
n the banking b
ada Pillar 3
verview of Pillathis Pillar 3
ions
ment RBC
ssment Opera
Capita
or
Opera
Capita
urance Opera
THE BANKIN
verview of Pillathis Pillar 3
ions
ment RBC
book Mark
3 Report
r 3 disclosure report. Our 2
2018 Annual R
ational risk
al managemen
ational risk
al managemen
ational risk
NG BOOK
r 3 disclosure report. Our 2
C 2018 Annual
ket Risk
requirements 2018 Annual R
Report section
nt
nt
requirements 2018 Annual R
Report sectio
that have beeReport is avai
n
Operational
Attributed caactivities
Operational
Attributed caactivities
Operational
that have beeReport is avai
on
Market Ris
n met within oilable free of
Sub-s
risk capital
apital in the con
risk capital
apital in the con
risk capital
n met within oilable free of
Sub-
k
our 2018 Annuacharge on ou
section
ntext of our bu
ntext of our bu
our 2018 Annuacharge on ou
-section
Q4 2018
50
al Report andur website at
siness
siness
al Report andur website at