as a result of a fiscal year end change from september
TRANSCRIPT

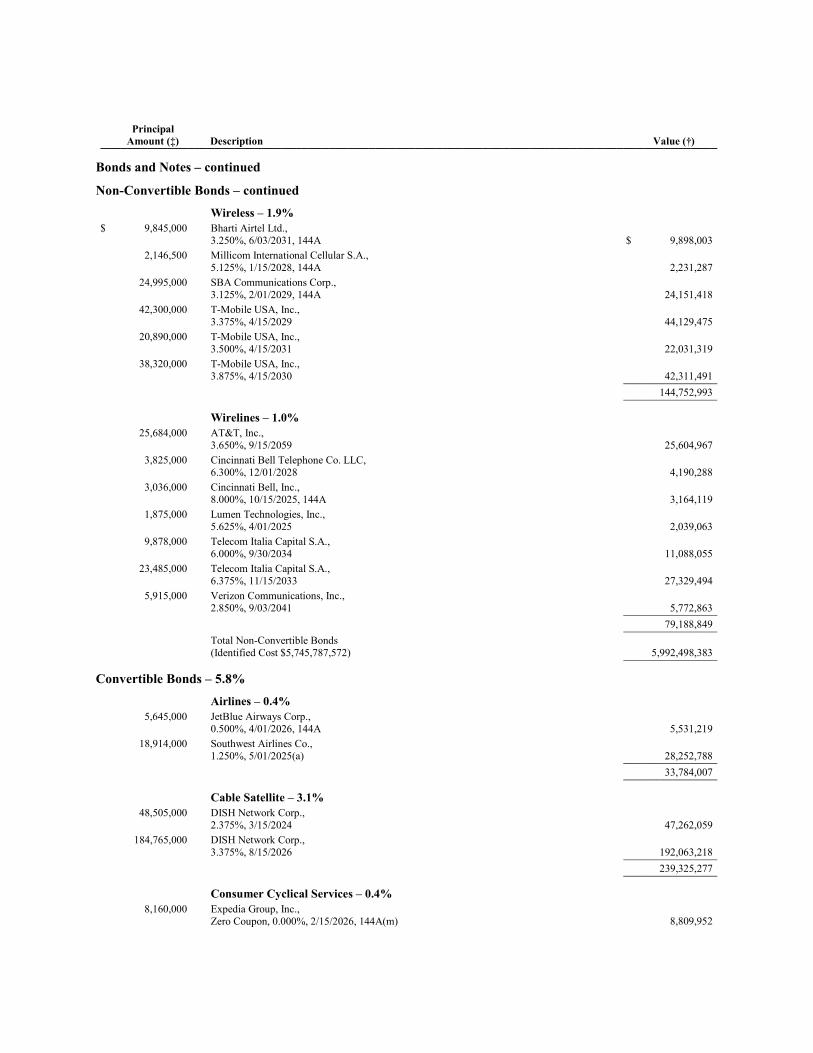
PORTFOLIO OF INVESTMENTS – as of September 30, 2021 (Unaudited) Loomis Sayles Bond Fund
Principal Amount (‡) Description Value (†) ____________________________________________________________________________________________
Bonds and Notes – 84.0% of Net Assets
Non-Convertible Bonds – 77.0%
ABS Car Loan – 1.8% $ 2,205,000 Avis Budget Rental Car Funding AESOP LLC, Series 2017-1A, Class C,
4.150%, 9/20/2023, 144A $ 2,252,494 13,000,000 Avis Budget Rental Car Funding AESOP LLC, Series 2018-2A, Class D,
3.040%, 3/20/2025, 144A 13,082,693 1,540,000 Avis Budget Rental Car Funding AESOP LLC, Series 2019-1A, Class C,
4.530%, 3/20/2023, 144A 1,553,468 1,680,000 Avis Budget Rental Car Funding AESOP LLC, Series 2019-2A, Class C,
4.240%, 9/22/2025, 144A 1,794,696 6,300,000 Avis Budget Rental Car Funding AESOP LLC, Series 2019-3A, Class C,
3.150%, 3/20/2026, 144A(a) 6,533,373 3,880,000 Avis Budget Rental Car Funding AESOP LLC, Series 2020-2A, Class C,
4.250%, 2/20/2027, 144A 4,200,171 1,745,000 Avis Budget Rental Car Funding AESOP LLC, Series 2021-1A, Class C,
2.130%, 8/20/2027, 144A 1,739,030 7,288,000 Carvana Auto Receivables Trust, Series 2021-N3, Class C,
1.020%, 6/12/2028 7,281,270 6,400,000 Carvana Auto Receivables Trust, Series 2021-P3, Class C,
1.930%, 10/12/2027 6,366,549 4,020,000 Credit Acceptance Auto Loan Trust, Series 2021-3A, Class C,
1.630%, 9/16/2030, 144A(a) 4,014,473 21,420,000 Drive Auto Receivables Trust, Series 2021-2, Class D,
1.390%, 3/15/2029 21,349,376 11,340,000 Exeter Automobile Receivables Trust, Series 2021-2A, Class D,
1.400%, 4/15/2027 11,311,710 15,295,000 Exeter Automobile Receivables Trust, Series 2021-3A, Class D,
1.550%, 6/15/2027 15,264,976 5,245,000 Flagship Credit Auto Trust, Series 2021-2, Class D,
1.590%, 6/15/2027, 144A 5,242,399 6,565,000 Flagship Credit Auto Trust, Series 2021-3, Class D,
1.650%, 9/15/2027, 144A 6,538,285 5,260,000 Foursight Capital Automobile Receivables Trust, Series 2021-2, Class D,
1.920%, 9/15/2027, 144A 5,246,154 10,265,000 GLS Auto Receivables Issuer Trust, Series 2021-3A, Class D,
1.480%, 7/15/2027, 144A 10,218,085 8,425,000 GLS Auto Receivables Trust, Series 2021-2A, Class D,
1.420%, 4/15/2027, 144A 8,365,149 3,508,407 JPMorgan Chase Bank NA, Series 2021-3, Class D,
1.009%, 2/26/2029, 144A 3,506,435 ______________ 135,860,786 ______________
ABS Credit Card – 0.0% 1,445,000 Brex Commercial Charge Card Master Trust, Series 2021-1, Class A,
2.090%, 7/15/2024, 144A 1,460,031 1,245,000 Mission Lane Credit Card Master Trust, Series 2021-A, Class B,
2.240%, 9/15/2026, 144A 1,247,593 ______________ 2,707,624 ______________

Principal Amount (‡) Description Value (†) ____________________________________________________________________________________________
Bonds and Notes – continued
Non-Convertible Bonds – continued
ABS Home Equity – 3.2% $ 15,175,676 510 Asset Backed Trust, Series 2021-NPL1, Class A1,
2.240%, 6/25/2061, 144A(b) $ 15,160,273 12,850,000 CAFL Issuer LLC, Series 2021-RTL1, Class A1,
2.239%, 3/26/2029, 144A(b) 12,840,877 2,715,000 CoreVest American Finance Trust, Series 2021-1, Class C,
2.800%, 4/15/2053, 144A(a) 2,752,182 4,647,000 CoreVest American Finance Trust, Series 2021-2, Class C,
2.478%, 7/15/2054, 144A 4,553,859 20,105,196 Credit Suisse Mortgage Trust, Series 2021-RPL4, Class A1,
1.796%, 12/27/2060, 144A(a)(b) 20,183,888 3,716,673 Credit Suisse Mortgage Trust, Series 2021-RPL6, Class M2,
3.125%, 10/25/2060, 144A 3,959,041 7,995,000 FirstKey Homes Trust, Series 2021-SFR1, Class E1,
2.389%, 8/17/2038, 144A 7,932,934 6,576,000 FirstKey Homes Trust, Series 2021-SFR1, Class E2,
2.489%, 8/17/2038, 144A 6,525,085 6,352,000 FirstKey Homes Trust, Series 2021-SFR2, Class E1,
2.258%, 9/17/2038, 144A 6,345,032 3,120,000 FirstKey Homes Trust, Series 2021-SFR2, Class E2,
2.358%, 9/17/2038, 144A 3,116,449 2,210,000 FRTKL, Series 2021-SFR1, Class E1,
2.372%, 9/17/2038, 144A 2,209,025 1,930,000 FRTKL, Series 2021-SFR1, Class E2,
2.522%, 9/17/2038, 144A 1,929,108 1,464,468 Home Partners of America Trust, Series 2021-1, Class E,
2.577%, 9/19/2041, 144A 1,453,875 2,959,535 Invitation Homes Trust, Series 2018-SFR2, Class B,
1-month LIBOR + 1.080%, 1.164%, 6/17/2037, 144A(a)(c) 2,963,612 1,449,866 Invitation Homes Trust, Series 2018-SFR3, Class B,
1-month LIBOR + 1.150%, 1.234%, 7/17/2037, 144A(a)(c) 1,452,285 770,102 Legacy Mortgage Asset Trust, Series 2019-GS3, Class A1,
3.750%, 4/25/2059, 144A(b) 775,296 2,169,530 Legacy Mortgage Asset Trust, Series 2020-GS5, Class A1,
3.250%, 6/25/2060, 144A 2,204,508 9,591,419 Legacy Mortgage Asset Trust, Series 2021-GS2, Class A1,
1.750%, 4/25/2061, 144A(a)(b) 9,695,045 3,156,818 Legacy Mortgage Asset Trust, Series 2021-GS4, Class A1,
1.650%, 11/25/2060, 144A(b) 3,152,710 1,720,000 Mill City Mortgage Loan Trust, Series 2019-GS1, Class M2,
3.250%, 7/25/2059, 144A(b) 1,814,222 1,635,000 Progress Residential Trust, Series 2021-SFR4, Class E1,
2.409%, 5/17/2038, 144A(a) 1,638,040 1,145,000 Progress Residential Trust, Series 2021-SFR4, Class E2,
2.559%, 5/17/2038, 144A 1,139,706 3,535,000 Progress Residential Trust, Series 2021-SFR5, Class E1,
2.209%, 7/17/2038, 144A 3,502,298 925,000 Progress Residential Trust, Series 2021-SFR5, Class E2,
2.359%, 7/17/2038, 144A 913,189 4,495,000 Progress Residential Trust, Series 2021-SFR6, Class E1,
2.425%, 7/17/2038, 144A 4,488,890 2,300,000 Progress Residential Trust, Series 2021-SFR6, Class E2,
2.525%, 7/17/2038, 144A 2,296,879

Principal Amount (‡) Description Value (†) ____________________________________________________________________________________________
Bonds and Notes – continued
Non-Convertible Bonds – continued
ABS Home Equity – continued $ 6,880,000 Progress Residential Trust, Series 2021-SFR7, Class E1,
2.591%, 8/17/2040, 144A $ 6,764,509 1,445,000 Progress Residential Trust, Series 2021-SFR7, Class E2,
2.640%, 8/17/2040, 144A 1,420,713 15,322,823 PRPM LLC, Series 2021-3, Class A1,
1.867%, 4/25/2026, 144A(a)(b) 15,470,811 14,942,008 PRPM LLC, Series 2021-4, Class A1,
1.867%, 4/25/2026, 144A(a)(b) 15,075,948 12,264,362 PRPM LLC, Series 2021-5, Class A1,
1.793%, 6/25/2026, 144A(b) 12,235,553 10,305,000 PRPM LLC, Series 2021-8, Class A1,
1.743%, 9/25/2026, 144A(b) 10,298,230 12,050,000 Toorak Mortgage Corp., Series 2021-1, Class A1,
2.240%, 6/25/2024, 144A(b) 12,056,179 3,660,000 Towd Point Mortgage Trust, Series 2016-3, Class M2,
4.000%, 4/25/2056, 144A(b) 3,872,616 170,000 Towd Point Mortgage Trust, Series 2015-4, Class M2,
3.750%, 4/25/2055, 144A(b) 175,397 430,000 Towd Point Mortgage Trust, Series 2017-3, Class A2,
3.000%, 7/25/2057, 144A(b) 445,766 1,960,000 Towd Point Mortgage Trust, Series 2018-5, Class M1,
3.250%, 7/25/2058, 144A(b) 2,042,292 905,000 Towd Point Mortgage Trust, Series 2020-1, Class A2B,
3.250%, 1/25/2060, 144A(b) 957,555 495,000 Towd Point Mortgage Trust, Series 2020-2, Class A2B,
3.000%, 4/25/2060, 144A(b) 530,848 19,710,000 VCAT Asset Securitization LLC, Series 2021-NPL6, Class A1,
1.917%, 9/25/2051, 144A(b) 19,708,837 498,763 VCAT LLC, Series 2021-NPL1, Class A1,
2.289%, 12/26/2050, 144A(b) 500,115 12,628,680 VCAT LLC, Series 2021-NPL5, Class A1,
1.868%, 8/25/2051, 144A(b) 12,621,034 10,127,109 VOLT XCIV LLC, Series 2021-NPL3, Class A1,
2.240%, 2/27/2051, 144A(a)(b) 10,136,413 ______________ 249,311,124 ______________
ABS Other – 1.6% 1,290,000 Affirm Asset Securitization Trust, Series 2021-B, Class C,
1.400%, 8/17/2026, 144A 1,287,411 2,410,000 Aqua Finance Trust, Series 2021-A, Class B,
2.400%, 7/17/2046, 144A(d) 2,411,224 3,001,206 Castlelake Aircraft Structured Trust, Series 2017-1R, Class A,
2.741%, 8/15/2041, 144A 3,008,256 17,368,285 CLI Funding VIII LLC, Series 2021-1A, Class A,
1.640%, 2/18/2046, 144A(a) 17,145,142 1,630,000 Freedom Financial Trust, Series 2021-2, Class C,
1.940%, 6/19/2028, 144A(a) 1,638,484 3,495,000 Freedom Financial Trust, Series 2021-3FP, Class D,
2.370%, 11/20/2028, 144A 3,493,910 32,585,000 GCA2014 Holdings Ltd., Series 2014-1, Class E,
1/05/2030, 144A(d)(e)(f)(g)(h) 440,679

Principal Amount (‡) Description Value (†) ____________________________________________________________________________________________
Bonds and Notes – continued
Non-Convertible Bonds – continued
ABS Other – continued $ 3,980,000 HPEFS Equipment Trust, Series 2021-1A, Class D,
1.030%, 3/20/2031, 144A(a) $ 3,969,918 22,730,040 MAPS Trust, Series 2021-1A, Class A,
2.521%, 6/15/2046, 144A 22,906,471 1,733,000 Marlette Funding Trust, Series 2021-2A, Class C,
1.500%, 9/15/2031, 144A 1,742,355 3,250,000 Nelnet Student Loan Trust, Series 2021-A, Class B2,
2.850%, 4/20/2062, 144A 3,294,539 1,145,000 OneMain Financial Issuance Trust, Series 2018-2A, Class A,
3.570%, 3/14/2033, 144A(a) 1,193,458 5,485,000 OneMain Financial Issuance Trust, Series 2021-1A, Class D,
2.470%, 6/16/2036, 144A 5,528,244 725,000 SCF Equipment Leasing LLC, Series 2021-1A, Class D,
1.930%, 9/20/2030, 144A 719,375 16,252,444 SLAM Ltd., Series 2021-1A, Class A,
2.434%, 6/15/2046, 144A 16,263,658 1,440,000 SoFi Consumer Loan Program Trust, Series 2021-1, Class D,
2.040%, 9/25/2030, 144A 1,439,690 3,500,000 Towd Point Mortgage Trust, Series 2011-1, Class M1,
3.750%, 10/25/2056, 144A(b) 3,709,903 18,474,963 Triton Container Finance VIII LLC, Series 2021-1A, Class A,
1.860%, 3/20/2046, 144A(a) 18,306,576 12,940,916 Willis Engine Structured Trust, Series 2021-A, Class A,
3.104%, 5/15/2046, 144A(a) 12,822,248 ______________ 121,321,541 ______________
ABS Student Loan – 0.2% 2,760,000 College Ave Student Loans LLC, Series 2021-A, Class C,
2.920%, 7/25/2051, 144A(a) 2,779,949 5,895,000 Navient Private Education Refi Loan Trust, Series 2021-FA, Class B,
2.120%, 2/18/2070, 144A 5,780,354 5,735,000 SMB Private Education Loan Trust, Series 2021-B, Class B,
2.650%, 7/17/2051, 144A(a) 5,853,955 630,000 SoFi Professional Loan Program LLC, Series 2017-A, Class C,
4.430%, 3/26/2040, 144A(b) 657,120 ______________ 15,071,378 ______________
ABS Whole Business – 0.4% 600,850 Domino's Pizza Master Issuer LLC, Series 2019-1A, Class A2,
3.668%, 10/25/2049, 144A 645,630 3,466,313 Hardee's Funding LLC, Series 2021-1A, Class A2,
2.865%, 6/20/2051, 144A 3,473,217 13,785,000 Taco Bell Funding LLC, Series 2021-1A, Class A2II,
2.294%, 8/25/2051, 144A 13,795,215 8,119,650 Wendy's Funding LLC, Series 2021-1A, Class A2I,
2.370%, 6/15/2051, 144A 8,187,571 1,177,050 Wendy's Funding LLC, Series 2021-1A, Class A2II,
2.775%, 6/15/2051, 144A 1,197,167 ______________ 27,298,800 ______________

Principal Amount (‡) Description Value (†) ____________________________________________________________________________________________
Bonds and Notes – continued
Non-Convertible Bonds – continued
Aerospace & Defense – 2.3% $ 22,105,000 Boeing Co. (The),
3.625%, 2/01/2031(a) $ 23,663,593 2,995,000 Boeing Co. (The),
3.625%, 3/01/2048 2,940,321 3,932,000 Boeing Co. (The),
3.750%, 2/01/2050 3,986,458 6,180,000 Boeing Co. (The),
3.825%, 3/01/2059 6,062,339 1,200,000 Boeing Co. (The),
3.850%, 11/01/2048 1,222,717 8,855,000 Boeing Co. (The),
3.900%, 5/01/2049(a) 9,115,342 6,035,000 Boeing Co. (The),
3.950%, 8/01/2059(a) 6,193,705 4,165,000 Boeing Co. (The),
5.150%, 5/01/2030(a) 4,888,419 60,763,000 Boeing Co. (The),
5.805%, 5/01/2050(a) 80,995,277 4,055,000 Embraer Netherlands Finance BV,
5.400%, 2/01/2027 4,313,547 10,576,000 Leonardo U.S. Holdings, Inc.,
6.250%, 1/15/2040, 144A 12,563,230 10,821,000 Leonardo U.S. Holdings, Inc.,
7.375%, 7/15/2039, 144A 14,137,853 328,000 Leonardo U.S. Holdings, Inc.,
7.375%, 7/15/2039 428,538 9,030,000 TransDigm, Inc.,
5.500%, 11/15/2027 9,278,325 400,000 TransDigm, Inc.,
7.500%, 3/15/2027 419,000 ______________ 180,208,664 ______________
Airlines – 2.0% 27,327,247 Air Canada Pass Through Trust, Series 2020-2A,
5.250%, 10/01/2030, 144A(a) 29,528,456 345,000 American Airlines Group, Inc.,
3.750%, 3/01/2025, 144A 310,880 11,745,000 American Airlines Group, Inc.,
5.000%, 6/01/2022, 144A 11,759,681 3,601,780 American Airlines Pass Through Trust, Series 2016-3, Class B,
3.750%, 4/15/2027 3,467,722 3,417,222 American Airlines Pass Through Trust, Series 2017-2, Class B,
3.700%, 4/15/2027 3,302,868 4,055,000 American Airlines, Inc./AAdvantage Loyalty IP Ltd.,
5.500%, 4/20/2026, 144A 4,262,819 4,670,000 American Airlines, Inc./AAdvantage Loyalty IP Ltd.,
5.750%, 4/20/2029, 144A 5,031,925 41,995,000 Mileage Plus Holdings LLC/Mileage Plus Intellectual Property Assets Ltd.,
6.500%, 6/20/2027, 144A 45,666,203 4,629,898 United Airlines Pass Through Trust, Series 2014-1, Class A,
4.000%, 10/11/2027(a) 4,886,708

Principal Amount (‡) Description Value (†) ____________________________________________________________________________________________
Bonds and Notes – continued
Non-Convertible Bonds – continued
Airlines – continued $ 29,897,157 United Airlines Pass Through Trust, Series 2020-1, Class A,
5.875%, 4/15/2029(a) $ 33,340,711 4,493,743 United Airlines Pass Through Trust, Series 2020-1, Class B,
4.875%, 7/15/2027 4,754,559 3,480,000 United Airlines, Inc.,
4.375%, 4/15/2026, 144A 3,571,350 5,205,000 United Airlines, Inc.,
4.625%, 4/15/2029, 144A 5,379,107 ______________ 155,262,989 ______________
Automotive – 1.3% 3,172,000 Cummins, Inc.,
6.750%, 2/15/2027(a) 3,973,759 30,125,000 Ford Motor Co.,
4.750%, 1/15/2043 31,574,916 2,440,000 Ford Motor Co.,
5.291%, 12/08/2046 2,717,550 1,560,000 Ford Motor Co.,
6.625%, 2/15/2028 1,835,621 1,580,000 Ford Motor Co.,
7.500%, 8/01/2026 1,875,428 3,505,000 General Motors Co.,
5.200%, 4/01/2045 4,268,197 3,170,000 General Motors Co.,
6.250%, 10/02/2043 4,269,823 44,900,000 General Motors Financial Co., Inc.,
3.600%, 6/21/2030(a) 48,161,149 815,000 General Motors Financial Co., Inc., Series A, (fixed rate to 9/30/2027, variable rate
thereafter), 5.750%(i) 890,355
1,305,000 General Motors Financial Co., Inc., Series C, (fixed rate to 9/30/2030, variable rate thereafter), 5.700%(i) 1,502,381 ______________
101,069,179 ______________
Banking – 4.8% 20,700,000 Ally Financial, Inc., Series B, (fixed rate to 5/15/2026, variable rate thereafter),
4.700%(i) 21,545,595 15,605,000 Ally Financial, Inc., Series C, (fixed rate to 5/15/2028, variable rate thereafter),
4.700%(i) 16,307,225 19,880,000 Banco Santander Mexico S.A. Institucion de Banca Multiple Grupo Financiero
Santander, 5.375%, 4/17/2025, 144A(a) 22,219,876
12,588,000 Bank of America Corp., (fixed rate to 4/29/2030, variable rate thereafter), 2.592%, 4/29/2031(a) 12,847,665
8,870,000 Bank of America Corp., (fixed rate to 7/23/2030, variable rate thereafter), MTN, 1.898%, 7/23/2031(a) 8,553,135
17,805,000 Barclays PLC, (fixed rate to 3/15/2028, variable rate thereafter), 4.375%(i) 17,792,537
47,298,000 Barclays PLC, (fixed rate to 9/23/2030, variable rate thereafter), 3.564%, 9/23/2035(a) 49,070,435
14,915,000 BNP Paribas S.A., 2.824%, 1/26/2041, 144A(a) 14,146,728

Principal Amount (‡) Description Value (†) ____________________________________________________________________________________________
Bonds and Notes – continued
Non-Convertible Bonds – continued
Banking – continued $ 22,200,000 BNP Paribas S.A., (fixed rate to 6/25/2037, variable rate thereafter),
7.195%, 144A(a)(i) $ 23,310,000 14,253,000 BNP Paribas S.A., (fixed rate to 8/12/2030, variable rate thereafter),
2.588%, 8/12/2035, 144A(a) 13,809,589 40,185,000 Citigroup, Inc., (fixed rate to 3/31/2030, variable rate thereafter),
4.412%, 3/31/2031(a) 46,399,909 8,565,000 Credit Agricole S.A.,
2.811%, 1/11/2041, 144A(a) 8,173,130 10,265,000 Credit Agricole S.A.,
3.250%, 1/14/2030, 144A(a) 10,773,733 8,140,000 Credit Agricole S.A., (fixed rate to 1/10/2028, variable rate thereafter), EMTN,
4.000%, 1/10/2033(a) 8,793,990 5,885,000 Deutsche Bank AG, (fixed rate to 1/14/2031, variable rate thereafter),
3.729%, 1/14/2032 6,076,172 2,275,000 Deutsche Bank AG, (fixed rate to 12/01/2027, variable rate thereafter),
4.875%, 12/01/2032 2,501,985 9,830,000 Deutsche Bank AG, (fixed rate to 5/28/2031, variable rate thereafter),
3.035%, 5/28/2032 9,973,600 3,380,000 Intesa Sanpaolo SpA,
4.198%, 6/01/2032, 144A 3,464,297 13,820,000 JPMorgan Chase & Co., (fixed rate to 11/19/2030, variable rate thereafter),
1.764%, 11/19/2031(a) 13,196,718 20,030,000 JPMorgan Chase & Co., (fixed rate to 2/04/2031, variable rate thereafter),
1.953%, 2/04/2032(a) 19,323,369 22,550,000 NatWest Group PLC, (fixed rate to 8/28/2030, variable rate thereafter),
3.032%, 11/28/2035(a) 22,587,658 20,365,000 UniCredit SpA, (fixed rate to 6/30/2030, variable rate thereafter),
5.459%, 6/30/2035, 144A 22,467,575 ______________ 373,334,921 ______________
Brokerage – 0.6% 21,725,000 Jefferies Group LLC,
6.250%, 1/15/2036(a) 29,182,210 13,420,000 Owl Rock Technology Finance Corp.,
4.750%, 12/15/2025, 144A 14,670,039 ______________ 43,852,249 ______________
Building Materials – 1.2% 57,099,000 Cemex SAB de CV,
3.875%, 7/11/2031, 144A 57,133,259 3,605,000 Cemex SAB de CV,
5.200%, 9/17/2030, 144A 3,871,950 9,035,000 Cemex SAB de CV, (fixed rate to 6/08/2026, variable rate thereafter),
5.125%, 144A(i) 9,202,238 4,057,000 Masco Corp.,
6.500%, 8/15/2032 5,361,704 4,534,000 Masco Corp.,
7.750%, 8/01/2029(a) 6,101,990 650,000 Owens Corning,
4.400%, 1/30/2048 759,821

Principal Amount (‡) Description Value (†) ____________________________________________________________________________________________
Bonds and Notes – continued
Non-Convertible Bonds – continued
Building Materials – continued $ 6,344,000 Owens Corning,
7.000%, 12/01/2036(a) $ 9,123,190 ______________ 91,554,152 ______________
Cable Satellite – 3.7% 50,750,000 CCO Holdings LLC/CCO Holdings Capital Corp.,
4.250%, 1/15/2034, 144A 50,274,219 5,945,000 Charter Communications Operating LLC/Charter Communications Operating
Capital Corp., 2.800%, 4/01/2031 5,958,429
90,490,000 Charter Communications Operating LLC/Charter Communications Operating Capital Corp., 3.700%, 4/01/2051(a) 88,103,211
14,827,000 Charter Communications Operating LLC/Charter Communications Operating Capital Corp., 3.850%, 4/01/2061 14,140,402
7,660,000 Charter Communications Operating LLC/Charter Communications Operating Capital Corp., 3.900%, 6/01/2052 7,629,927
47,260,000 Charter Communications Operating LLC/Charter Communications Operating Capital Corp., 3.950%, 6/30/2062 45,591,261
5,935,000 Charter Communications Operating LLC/Charter Communications Operating Capital Corp., 5.125%, 7/01/2049 6,981,028
24,710,000 CSC Holdings LLC, 5.375%, 2/01/2028, 144A 25,821,950
9,430,000 DISH DBS Corp., 5.125%, 6/01/2029 9,239,420
3,465,000 DISH DBS Corp., 5.875%, 11/15/2024 3,725,845
14,719,000 DISH DBS Corp., 7.750%, 7/01/2026 16,621,063
6,190,000 Time Warner Cable LLC, 4.500%, 9/15/2042 6,773,972
535,000 Time Warner Cable LLC, 5.875%, 11/15/2040 674,850
7,579,000 Ziggo BV, 5.500%, 1/15/2027, 144A 7,834,791 ______________
289,370,368 ______________
Chemicals – 0.8% 6,315,000 Alpek SAB de CV,
3.250%, 2/25/2031, 144A 6,378,213 11,740,000 Ashland LLC,
3.375%, 9/01/2031, 144A 11,842,725 1,995,000 Braskem Netherlands Finance BV,
4.500%, 1/31/2030, 144A 2,122,680 10,170,000 Braskem Netherlands Finance BV,
5.875%, 1/31/2050, 144A 11,568,375 1,360,000 INEOS Quattro Finance 2 PLC,
3.375%, 1/15/2026, 144A 1,373,600

Principal Amount (‡) Description Value (†) ____________________________________________________________________________________________
Bonds and Notes – continued
Non-Convertible Bonds – continued
Chemicals – continued $ 9,275,000 Minerals Technologies, Inc.,
5.000%, 7/01/2028, 144A $ 9,622,071 14,178,000 Orbia Advance Corp. SAB de CV,
2.875%, 5/11/2031, 144A(a) 14,283,484 3,450,000 SPCM S.A.,
3.125%, 3/15/2027, 144A 3,454,140 3,200,000 SPCM S.A.,
3.375%, 3/15/2030, 144A 3,197,520 ______________ 63,842,808 ______________
Construction Machinery – 0.5% 27,030,000 Toro Co. (The),
6.625%, 5/01/2037(f)(j) 36,724,305 ______________
Consumer Cyclical Services – 2.6% 5,315,000 Expedia Group, Inc.,
2.950%, 3/15/2031 5,371,126 42,710,000 Expedia Group, Inc.,
3.250%, 2/15/2030 44,170,880 9,060,000 Expedia Group, Inc.,
3.800%, 2/15/2028 9,833,070 16,135,000 Go Daddy Operating Co. LLC/GD Finance Co., Inc.,
3.500%, 3/01/2029, 144A 15,993,819 8,919,000 Terminix Co. LLC (The),
7.450%, 8/15/2027 10,814,287 14,700,000 TriNet Group, Inc.,
3.500%, 3/01/2029, 144A 14,736,750 33,010,000 Uber Technologies, Inc.,
4.500%, 8/15/2029, 144A 33,236,944 20,723,000 Uber Technologies, Inc.,
6.250%, 1/15/2028, 144A 22,225,210 38,763,000 Uber Technologies, Inc.,
7.500%, 9/15/2027, 144A 42,324,351 ______________ 198,706,437 ______________
Consumer Products – 0.4% 15,473,000 Avon Products, Inc.,
8.450%, 3/15/2043 19,573,345 9,385,000 Natura Cosmeticos S.A.,
4.125%, 5/03/2028, 144A 9,499,966 ______________ 29,073,311 ______________
Diversified Manufacturing – 0.0% 2,080,000 General Electric Co., Series D,
3-month LIBOR + 3.330%, 3.446%(c)(i) 2,035,800 ______________
Electric – 1.1% 31,822,797 Alta Wind Holdings LLC,
7.000%, 6/30/2035, 144A 37,372,540 8,663,000 Enel Generacion Chile S.A.,
7.875%, 2/01/2027(a) 10,648,768

Principal Amount (‡) Description Value (†) ____________________________________________________________________________________________
Bonds and Notes – continued
Non-Convertible Bonds – continued
Electric – continued $ 2,655,000 Pacific Gas & Electric Co.,
3.250%, 6/01/2031 $ 2,645,352 6,582,000 Pacific Gas & Electric Co.,
3.500%, 8/01/2050 5,985,903 8,302,000 Pacific Gas & Electric Co.,
4.250%, 3/15/2046 8,160,963 11,201,000 Pacific Gas & Electric Co.,
4.300%, 3/15/2045 11,050,802 11,830,000 Pacific Gas & Electric Co.,
4.750%, 2/15/2044 12,046,943 ______________ 87,911,271 ______________
Finance Companies – 5.6% 1,190,000 AerCap Ireland Capital DAC/AerCap Global Aviation Trust,
3.650%, 7/21/2027 1,264,050 3,100,000 AGFC Capital Trust I,
3-month LIBOR + 1.750%, 1.876%, 1/15/2067, 144A(c)(f)(j) 1,796,884 10,575,000 Air Lease Corp.,
3.125%, 12/01/2030(a) 10,833,670 6,606,000 Air Lease Corp.,
4.625%, 10/01/2028(a) 7,420,004 4,065,000 Air Lease Corp., MTN,
3.000%, 2/01/2030 4,124,779 17,166,000 Air Lease Corp., Series B, (fixed rate to 6/15/2026, variable rate thereafter),
4.650%(i) 17,959,927 5,325,000 Aircastle Ltd., (fixed rate to 6/15/2026, variable rate thereafter),
5.250%, 144A(i) 5,449,073 15,585,000 Antares Holdings LP,
6.000%, 8/15/2023, 144A 16,860,227 27,210,000 Antares Holdings LP,
8.500%, 5/18/2025, 144A 32,457,802 30,250,000 Ares Capital Corp.,
2.875%, 6/15/2028 30,643,808 7,990,000 Aviation Capital Group LLC,
1.950%, 1/30/2026, 144A(a) 7,961,136 11,041,000 FS KKR Capital Corp.,
3.400%, 1/15/2026 11,536,533 64,915,000 GE Capital Funding LLC,
4.550%, 5/15/2032(a) 76,873,379 16,790,000 GE Capital International Funding Co. Unlimited Co.,
4.418%, 11/15/2035(a) 20,148,877 445,000 Navient Corp.,
5.000%, 3/15/2027 458,350 19,021,000 Navient Corp.,
6.750%, 6/15/2026 20,992,146 5,750,000 Navient Corp., MTN,
5.625%, 8/01/2033 5,469,688 3,162,000 Navient Corp., MTN,
6.125%, 3/25/2024 3,385,712 10,145,000 OneMain Finance Corp.,
7.125%, 3/15/2026 11,755,519

Principal Amount (‡) Description Value (†) ____________________________________________________________________________________________
Bonds and Notes – continued
Non-Convertible Bonds – continued
Finance Companies – continued $ 9,355,000 Owl Rock Capital Corp.,
2.875%, 6/11/2028 $ 9,337,539 14,750,000 Owl Rock Capital Corp.,
4.250%, 1/15/2026 15,831,216 10,870,000 Rocket Mortgage LLC,
5.250%, 1/15/2028, 144A 11,712,425 22,200,000 Rocket Mortgage LLC/Rocket Mortgage Co-Issuer, Inc.,
2.875%, 10/15/2026, 144A 21,693,840 18,044,000 Rocket Mortgage LLC/Rocket Mortgage Co-Issuer, Inc.,
3.625%, 3/01/2029, 144A 18,246,995 53,276,000 Rocket Mortgage LLC/Rocket Mortgage Co-Issuer, Inc.,
3.875%, 3/01/2031, 144A 53,742,165 14,835,000 Rocket Mortgage LLC/Rocket Mortgage Co-Issuer, Inc.,
4.000%, 10/15/2033, 144A 14,723,738 ______________ 432,679,482 ______________
Financial Other – 1.3% 22,260,000 Blackstone Secured Lending Fund,
2.125%, 2/15/2027, 144A 22,010,912 2,815,000 CIFI Holdings Group Co. Ltd.,
6.000%, 7/16/2025 2,802,913 990,000 CIFI Holdings Group Co. Ltd.,
6.450%, 11/07/2024 988,871 7,770,000 Country Garden Holdings Co. Ltd.,
3.300%, 1/12/2031 7,082,349 36,625,000 Icahn Enterprises LP/Icahn Enterprises Finance Corp.,
4.375%, 2/01/2029 36,579,219 5,390,000 Icahn Enterprises LP/Icahn Enterprises Finance Corp.,
5.250%, 5/15/2027 5,592,125 14,125,000 Nationstar Mortgage Holdings, Inc.,
5.500%, 8/15/2028, 144A 14,548,750 4,185,000 Shimao Group Holdings Ltd.,
3.450%, 1/11/2031 3,726,406 4,445,000 Shimao Group Holdings Ltd.,
5.600%, 7/15/2026 4,390,021 ______________ 97,721,566 ______________
Food & Beverage – 1.3% 6,490,000 JBS USA LUX S.A./JBS USA Food Co./JBS USA Finance, Inc.,
3.750%, 12/01/2031, 144A 6,753,040 68,535,000 Kraft Heinz Foods Co.,
4.375%, 6/01/2046(a) 78,197,750 14,795,000 Pilgrim's Pride Corp.,
3.500%, 3/01/2032, 144A 15,048,290 ______________ 99,999,080 ______________
Gaming – 0.8% 19,755,000 Genm Capital Labuan Ltd.,
3.882%, 4/19/2031, 144A(a) 19,548,256 17,635,000 International Game Technology PLC,
6.250%, 1/15/2027, 144A 19,927,550

Principal Amount (‡) Description Value (†) ____________________________________________________________________________________________
Bonds and Notes – continued
Non-Convertible Bonds – continued
Gaming – continued $ 4,850,000 Penn National Gaming, Inc.,
4.125%, 7/01/2029, 144A $ 4,793,740 19,251,000 Scientific Games International, Inc.,
7.000%, 5/15/2028, 144A 20,767,016 415,000 Scientific Games International, Inc.,
7.250%, 11/15/2029, 144A 466,309 ______________ 65,502,871 ______________
Government Owned - No Guarantee – 1.4% 2,929,000,000 Export-Import Bank of Korea,
4.890%, 8/09/2023, 144A, (INR) 39,242,740 689,000,000 Export-Import Bank of Korea, MTN,
6.750%, 8/09/2022, (INR)(a) 9,446,155 16,920,000 Indian Railway Finance Corp. Ltd.,
2.800%, 2/10/2031, 144A 16,340,659 8,465,000 Pertamina Persero PT,
6.450%, 5/30/2044, 144A(a) 11,029,473 28,145,000 Petroleos Mexicanos,
5.950%, 1/28/2031(a) 27,283,763 2,735,000 Sino-Ocean Land Treasure IV Ltd.,
4.750%, 8/05/2029 2,589,625 5,250,000 Sino-Ocean Land Treasure IV Ltd.,
4.750%, 1/14/2030 4,900,191 ______________ 110,832,606 ______________
Health Insurance – 0.6% 32,650,000 Centene Corp.,
2.500%, 3/01/2031 32,201,062 8,940,000 Centene Corp.,
2.625%, 8/01/2031 8,879,566 6,921,000 Centene Corp.,
3.000%, 10/15/2030 7,094,025 ______________ 48,174,653 ______________
Healthcare – 0.8% 24,220,000 HCA, Inc.,
5.250%, 6/15/2049 30,913,181 29,992,000 Tenet Healthcare Corp.,
6.875%, 11/15/2031 34,415,820 ______________ 65,329,001 ______________
Home Construction – 0.9% 910,000 Logan Group Co. Ltd.,
4.250%, 7/12/2025 860,027 3,163,000 Logan Group Co. Ltd.,
4.850%, 12/14/2026 2,965,337 52,605,000 PulteGroup, Inc.,
6.000%, 2/15/2035(a) 67,991,962 ______________ 71,817,326 ______________

Principal Amount (‡) Description Value (†) ____________________________________________________________________________________________
Bonds and Notes – continued
Non-Convertible Bonds – continued
Independent Energy – 3.1% $ 15,807,000 Aker BP ASA,
3.750%, 1/15/2030, 144A $ 16,923,708 24,645,000 Aker BP ASA,
4.000%, 1/15/2031, 144A 26,806,405 8,634,000 Ascent Resources Utica Holdings LLC/ARU Finance Corp.,
9.000%, 11/01/2027, 144A 11,828,580 14,910,000 Continental Resources, Inc.,
5.750%, 1/15/2031, 144A 18,022,462 3,985,000 Devon Energy Corp.,
4.500%, 1/15/2030, 144A 4,343,201 5,500,000 Diamondback Energy, Inc.,
3.125%, 3/24/2031 5,711,014 3,480,000 Diamondback Energy, Inc.,
3.500%, 12/01/2029 3,721,640 9,555,000 Energean Israel Finance Ltd.,
5.375%, 3/30/2028, 144A 9,778,683 12,510,000 Energean Israel Finance Ltd.,
5.875%, 3/30/2031, 144A 12,849,647 1,215,000 EQT Corp.,
3.125%, 5/15/2026, 144A 1,245,521 2,580,000 EQT Corp.,
3.625%, 5/15/2031, 144A 2,688,360 19,040,000 Hess Corp.,
5.600%, 2/15/2041 23,789,546 1,724,000 Leviathan Bond Ltd.,
6.125%, 6/30/2025, 144A 1,871,988 16,125,000 Leviathan Bond Ltd.,
6.500%, 6/30/2027, 144A 17,698,316 12,725,000 Lundin Energy Finance BV,
2.000%, 7/15/2026, 144A 12,801,767 9,185,000 Lundin Energy Finance BV,
3.100%, 7/15/2031, 144A 9,313,090 27,050,000 Mesquite Energy, Inc.,
6.125%, 1/15/2023(d)(e)(f)(k) 1,082,000 12,420,000 Mesquite Energy, Inc.,
7.750%, 6/15/2021(d)(e)(f)(k) 496,800 2,770,000 Occidental Petroleum Corp.,
4.500%, 7/15/2044 2,781,329 37,985,000 Occidental Petroleum Corp.,
6.625%, 9/01/2030 46,816,512 1,901,000 Ovintiv, Inc.,
6.500%, 8/15/2034 2,563,839 828,000 Ovintiv, Inc.,
6.500%, 2/01/2038 1,138,959 4,156,000 Ovintiv, Inc.,
6.625%, 8/15/2037 5,699,724 553,000 Ovintiv, Inc.,
7.200%, 11/01/2031 742,093 495,000 Ovintiv, Inc.,
7.375%, 11/01/2031 671,445 2,285,000 Ovintiv, Inc.,
8.125%, 9/15/2030 3,143,612

Principal Amount (‡) Description Value (†) ____________________________________________________________________________________________
Bonds and Notes – continued
Non-Convertible Bonds – continued
Independent Energy – continued $ 190,000 Range Resources Corp.,
4.875%, 5/15/2025 $ 200,602 ______________ 244,730,843 ______________
Industrial Other – 0.1% 5,995,000 TopBuild Corp.,
4.125%, 2/15/2032, 144A 6,054,950 ______________
Leisure – 0.7% 17,850,000 Carnival Corp.,
5.750%, 3/01/2027, 144A 18,452,437 10,030,000 NCL Corp. Ltd.,
5.875%, 3/15/2026, 144A 10,280,750 3,695,000 NCL Finance Ltd.,
6.125%, 3/15/2028, 144A 3,833,563 18,780,000 Royal Caribbean Cruises Ltd.,
5.500%, 4/01/2028, 144A 19,208,353 ______________ 51,775,103 ______________
Life Insurance – 2.9% 14,675,000 Athene Global Funding,
1.608%, 6/29/2026, 144A 14,664,368 7,878,000 Brighthouse Financial, Inc.,
4.700%, 6/22/2047(a) 8,908,270 20,335,000 Brighthouse Financial, Inc.,
5.625%, 5/15/2030(a) 24,547,819 2,030,000 MetLife, Inc.,
9.250%, 4/08/2068, 144A 3,085,843 10,175,000 MetLife, Inc.,
10.750%, 8/01/2069(a) 17,719,833 57,985,000 Mutual of Omaha Insurance Co.,
6.800%, 6/15/2036, 144A(a) 78,087,479 38,476,000 National Life Insurance Co.,
10.500%, 9/15/2039, 144A(f)(j) 62,698,566 12,950,000 NLV Financial Corp.,
7.500%, 8/15/2033, 144A(f)(j) 16,964,370 ______________ 226,676,548 ______________
Lodging – 0.7% 11,490,000 Hilton Domestic Operating Co., Inc.,
3.625%, 2/15/2032, 144A 11,317,650 2,475,000 Hilton Grand Vacations Borrower Escrow LLC/Hilton Grand Vacations Borrower
Escrow, 4.875%, 7/01/2031, 144A 2,484,281
8,090,000 Hilton Grand Vacations Borrower Escrow LLC/Hilton Grand Vacations Borrower Escrow, 5.000%, 6/01/2029, 144A 8,251,800
11,290,000 Marriott International, Inc., Series HH, 2.850%, 4/15/2031 11,434,304
6,155,000 Marriott Ownership Resorts, Inc., 4.500%, 6/15/2029, 144A 6,231,937
11,584,000 Travel & Leisure Co., 4.625%, 3/01/2030, 144A 11,902,560

Principal Amount (‡) Description Value (†) ____________________________________________________________________________________________
Bonds and Notes – continued
Non-Convertible Bonds – continued
Lodging – continued $ 1,465,000 Travel & Leisure Co.,
6.000%, 4/01/2027 $ 1,623,549 1,695,000 Travel & Leisure Co.,
6.625%, 7/31/2026, 144A 1,930,215 ______________ 55,176,296 ______________
Media Entertainment – 1.3% 8,340,000 AMC Networks, Inc.,
4.250%, 2/15/2029 8,298,300 5,896,000 iHeartCommunications, Inc.,
4.750%, 1/15/2028, 144A 6,075,828 2,905,000 iHeartCommunications, Inc.,
5.250%, 8/15/2027, 144A 3,018,469 7,085,000 iHeartCommunications, Inc.,
8.375%, 5/01/2027 7,572,094 2,110,000 Netflix, Inc.,
4.875%, 4/15/2028 2,431,775 17,720,000 Netflix, Inc.,
4.875%, 6/15/2030, 144A 20,865,300 2,007,000 Netflix, Inc.,
5.375%, 11/15/2029, 144A 2,430,979 9,827,000 Netflix, Inc.,
5.875%, 11/15/2028 12,042,006 11,544,000 Netflix, Inc.,
6.375%, 5/15/2029 14,603,160 5,955,000 ViacomCBS, Inc.,
4.375%, 3/15/2043(a) 6,812,282 6,730,000 ViacomCBS, Inc.,
4.900%, 8/15/2044(a) 8,238,562 6,940,000 ViacomCBS, Inc.,
4.950%, 5/19/2050(a) 8,688,658 ______________ 101,077,413 ______________
Metals & Mining – 3.2% 6,936,000 Anglo American Capital PLC,
2.625%, 9/10/2030, 144A(a) 6,889,601 22,660,000 Anglo American Capital PLC,
2.875%, 3/17/2031, 144A(a) 22,737,046 30,635,000 ArcelorMittal S.A.,
6.750%, 3/01/2041 42,103,978 1,145,000 ArcelorMittal S.A.,
7.000%, 10/15/2039 1,615,881 3,950,000 Barrick Gold Corp., Series A,
5.800%, 11/15/2034(a) 4,824,647 7,370,000 First Quantum Minerals Ltd.,
6.875%, 3/01/2026, 144A 7,664,800 31,810,000 First Quantum Minerals Ltd.,
6.875%, 10/15/2027, 144A 33,639,075 1,445,000 First Quantum Minerals Ltd.,
7.500%, 4/01/2025, 144A 1,482,324 14,665,000 FMG Resources August 2006 Pty Ltd.,
4.375%, 4/01/2031, 144A 15,154,078

Principal Amount (‡) Description Value (†) ____________________________________________________________________________________________
Bonds and Notes – continued
Non-Convertible Bonds – continued
Metals & Mining – continued $ 34,855,000 Freeport-McMoRan, Inc.,
5.400%, 11/14/2034 $ 41,869,569 18,565,000 Glencore Funding LLC,
2.500%, 9/01/2030, 144A(a) 18,217,649 50,440,000 Glencore Funding LLC,
2.850%, 4/27/2031, 144A(a) 50,741,639 2,865,000 Volcan Cia Minera SAA,
4.375%, 2/11/2026, 144A 2,789,078 ______________ 249,729,365 ______________
Midstream – 0.9% 9,050,000 DCP Midstream Operating LP,
6.450%, 11/03/2036, 144A 11,245,349 22,005,000 Galaxy Pipeline Assets Bidco Ltd.,
2.940%, 9/30/2040, 144A(a) 21,959,117 3,745,000 Hess Midstream Operations LP,
4.250%, 2/15/2030, 144A 3,787,131 205,000 NGPL PipeCo LLC,
7.768%, 12/15/2037, 144A 293,789 2,149,000 Plains All American Pipeline LP/PAA Finance Corp.,
3.800%, 9/15/2030 2,294,261 280,000 Plains All American Pipeline LP/PAA Finance Corp.,
4.300%, 1/31/2043 287,517 17,090,000 Plains All American Pipeline LP/PAA Finance Corp.,
4.700%, 6/15/2044 18,340,990 1,775,000 Plains All American Pipeline LP/PAA Finance Corp.,
4.900%, 2/15/2045 1,912,895 5,300,000 Targa Resources Partners LP/Targa Resources Partners Finance Corp.,
4.000%, 1/15/2032, 144A 5,477,285 ______________ 65,598,334 ______________
Mortgage Related – 0.0% 4,303 FHLMC,
5.000%, 12/01/2031(a) 4,732 ______________
Non-Agency Commercial Mortgage-Backed Securities – 0.9% 10,990,000 BANK, Series 2021-BN35, Class AS,
2.457%, 6/15/2064 11,000,407 505,000 BBSG Mortgage Trust, Series 2016-MRP, Class A,
3.275%, 6/05/2036, 144A 520,081 3,475,000 Commercial Mortgage Pass Through Certificates, Series 2012-CR3, Class AM,
3.416%, 10/15/2045, 144A(a) 3,484,486 190,000 Commercial Mortgage Pass Through Certificates, Series 2012-LTRT, Class A2,
3.400%, 10/05/2030, 144A 189,053 5,150,000 Commercial Mortgage Trust, Series 2012-LC4, Class B,
4.934%, 12/10/2044(b) 5,156,572 412,000 Credit Suisse Commercial Mortgage Securities Corp., Series 2019-SKLZ, Class D,
1-month LIBOR + 3.600%, 3.684%, 1/15/2034, 144A(c) 406,989 3,380,000 Credit Suisse Mortgage Trust, Series 2014-USA, Class B,
4.185%, 9/15/2037, 144A(a) 3,434,469 630,000 Credit Suisse Mortgage Trust, Series 2014-USA, Class C,
4.336%, 9/15/2037, 144A 617,693

Principal Amount (‡) Description Value (†) ____________________________________________________________________________________________
Bonds and Notes – continued
Non-Convertible Bonds – continued
Non-Agency Commercial Mortgage-Backed Securities – continued $ 2,530,000 Credit Suisse Mortgage Trust, Series 2014-USA, Class D,
4.373%, 9/15/2037, 144A $ 2,407,636 3,088,930 Extended Stay America Trust, Series 2021-ESH, Class D,
1-month LIBOR + 2.250%, 2.334%, 7/15/2038, 144A(c) 3,127,219 3,760,000 GS Mortgage Securities Corp. Trust, Series 2013-PEMB, Class B,
3.668%, 3/05/2033, 144A(b) 3,764,473 435,000 JPMorgan Chase Commercial Mortgage Securities Trust, Series 2012-LC9, Class D,
4.508%, 12/15/2047, 144A(a)(b) 427,056 1,415,000 Morgan Stanley Bank of America Merrill Lynch Commercial Mortgage Securities
Trust, Series 2012-CKSV, Class A2, 3.277%, 10/15/2030, 144A(a) 1,408,300
9,556,000 Morgan Stanley Bank of America Merrill Lynch Trust, Series 2013-C11, Class A4, 4.297%, 8/15/2046(a)(b) 10,064,103
645,000 Motel Trust, Series 2021-MTL6, Class C, 1-month LIBOR + 1.500%, 1.600%, 9/15/2038, 144A(c) 646,429
641,568 UBS-Barclays Commercial Mortgage Trust, Series 2012-TFT, Class A, 2.892%, 6/05/2030, 144A(a) 642,139
7,926,751 Wells Fargo Commercial Mortgage Trust, Series 2013-LC12, Class B, 4.443%, 7/15/2046(b) 7,935,770
4,970,000 Wells Fargo Commercial Mortgage Trust, Series 2016-C36, Class B, 3.671%, 11/15/2059(b) 4,927,795
1,955,000 WFRBS Commercial Mortgage Trust, Series 2012-C10, Class B, 3.744%, 12/15/2045 1,939,374
7,575,000 WFRBS Commercial Mortgage Trust, Series 2013-C15, Class B, 4.650%, 8/15/2046(a)(b) 7,558,010
1,410,000 WFRBS Commercial Mortgage Trust, Series 2014-C20, Class B, 4.378%, 5/15/2047 1,464,961 ______________
71,123,015 ______________
Paper – 1.3% 16,157,000 Georgia-Pacific LLC,
7.750%, 11/15/2029(a) 22,915,086 9,625,000 International Paper Co.,
8.700%, 6/15/2038(a) 15,729,106 8,214,000 WestRock MWV LLC,
7.950%, 2/15/2031(a) 11,671,207 25,138,000 WestRock MWV LLC,
8.200%, 1/15/2030(a) 35,221,343 4,127,000 Weyerhaeuser Co.,
6.950%, 10/01/2027 5,274,772 7,985,000 Weyerhaeuser Co.,
7.375%, 3/15/2032(a) 11,370,789 ______________ 102,182,303 ______________
Pharmaceuticals – 0.0% 3,060,000 Jazz Securities DAC,
4.375%, 1/15/2029, 144A 3,171,078 ______________
Property & Casualty Insurance – 0.0% 80,000 MBIA Insurance Corp.,
3-month LIBOR + 11.260%, 11.386%, 1/15/2033(c)(d)(e)(f)(h) 13,800

Principal Amount (‡) Description Value (†) ____________________________________________________________________________________________
Bonds and Notes – continued
Non-Convertible Bonds – continued
Property & Casualty Insurance – continued $ 13,985,000 MBIA Insurance Corp.,
3-month LIBOR + 11.260%, 11.386%, 1/15/2033, 144A(c)(d)(e)(f)(h) $ 2,412,412 ______________ 2,426,212 ______________
Retailers – 0.8% 6,285,000 Carvana Co.,
5.500%, 4/15/2027, 144A 6,415,099 4,455,000 Carvana Co.,
5.625%, 10/01/2025, 144A 4,605,980 9,240,000 Carvana Co.,
5.875%, 10/01/2028, 144A 9,546,860 4,680,000 Dillard's, Inc.,
7.000%, 12/01/2028 5,526,986 7,182,000 Dillard's, Inc.,
7.750%, 7/15/2026 8,576,170 2,250,000 Dillard's, Inc.,
7.750%, 5/15/2027 2,689,515 5,975,000 Lithia Motors, Inc.,
3.875%, 6/01/2029, 144A 6,212,925 9,245,000 Marks & Spencer PLC,
7.125%, 12/01/2037, 144A 11,331,412 3,860,000 Murphy Oil USA, Inc.,
3.750%, 2/15/2031, 144A 3,884,125 ______________ 58,789,072 ______________
Sovereigns – 0.9% 45,245,000 Mexico Government International Bond,
3.771%, 5/24/2061(a) 40,176,203 31,860,000 Mexico Government International Bond,
4.280%, 8/14/2041(a) 32,506,758 ______________ 72,682,961 ______________
Supermarkets – 0.0% 2,705,000 Safeway, Inc.,
7.250%, 2/01/2031 3,232,475 ______________
Supranational – 0.1% 793,840,000 International Finance Corp.,
5.850%, 11/25/2022, (INR)(a) 10,812,330 ______________
Technology – 2.1% 965,000 Broadcom, Inc.,
3.187%, 11/15/2036, 144A 962,197 34,815,000 Broadcom, Inc.,
4.300%, 11/15/2032 39,014,851 14,400,000 CommScope Technologies LLC,
5.000%, 3/15/2027, 144A 13,696,704 16,765,000 CommScope, Inc.,
4.750%, 9/01/2029, 144A 16,744,044 20,540,000 Iron Mountain, Inc.,
4.875%, 9/15/2029, 144A 21,515,650

Principal Amount (‡) Description Value (†) ____________________________________________________________________________________________
Bonds and Notes – continued
Non-Convertible Bonds – continued
Technology – continued $ 4,930,000 Jabil, Inc.,
3.950%, 1/12/2028 $ 5,437,814 12,970,000 KLA Corp.,
5.650%, 11/01/2034(a) 16,758,023 8,630,000 Marvell Technology, Inc.,
2.950%, 4/15/2031, 144A 8,870,776 4,485,000 MSCI, Inc.,
3.250%, 8/15/2033, 144A 4,536,398 7,960,000 Sensata Technologies BV,
4.000%, 4/15/2029, 144A 8,102,882 8,675,000 Square, Inc.,
3.500%, 6/01/2031, 144A 8,898,208 17,090,000 SYNNEX Corp.,
1.750%, 8/09/2026, 144A 16,907,056 ______________ 161,444,603 ______________
Transportation Services – 0.4% 5,895,000 Adani Ports & Special Economic Zone Ltd.,
3.100%, 2/02/2031, 144A 5,627,190 19,345,000 Adani Ports & Special Economic Zone Ltd.,
4.200%, 8/04/2027, 144A 20,291,551 2,475,000 Fenix Marine Service Holdings Ltd.,
8.000%, 1/15/2024 2,710,719 1,845,000 GMR Hyderabad International Airport Ltd.,
4.250%, 10/27/2027, 144A 1,766,141 315,000 GMR Hyderabad International Airport Ltd.,
4.750%, 2/02/2026, 144A 314,313 ______________ 30,709,914 ______________
Treasuries – 13.5% 217,665(††) Brazil Notas do Tesouro Nacional, Series F,
10.000%, 1/01/2025, (BRL) 39,783,937 8,436,175(†††) Mexican Fixed Rate Bonds,
6.750%, 3/09/2023, (MXN)(a) 41,323,628 76,210,000 U.S. Treasury Note,
0.125%, 11/30/2022(a) 76,198,092 45,170,000 U.S. Treasury Note,
0.125%, 12/31/2022(l) 45,155,885 187,560,000 U.S. Treasury Note,
0.125%, 1/31/2023(a) 187,464,755 158,300,000 U.S. Treasury Note,
0.125%, 2/28/2023(a)(l) 158,182,511 389,480,000 U.S. Treasury Note,
0.125%, 6/30/2023 388,810,581 78,705,000 U.S. Treasury Note,
0.125%, 7/31/2023 78,535,907 39,160,000 U.S. Treasury Note,
0.250%, 9/30/2023 39,129,406 ______________ 1,054,584,702 ______________
Principal Amount (‡) Description Value (†) ____________________________________________________________________________________________
Bonds and Notes – continued
Non-Convertible Bonds – continued
Wireless – 1.9% $ 9,845,000 Bharti Airtel Ltd.,
3.250%, 6/03/2031, 144A $ 9,898,003 2,146,500 Millicom International Cellular S.A.,
5.125%, 1/15/2028, 144A 2,231,287 24,995,000 SBA Communications Corp.,
3.125%, 2/01/2029, 144A 24,151,418 42,300,000 T-Mobile USA, Inc.,
3.375%, 4/15/2029 44,129,475 20,890,000 T-Mobile USA, Inc.,
3.500%, 4/15/2031 22,031,319 38,320,000 T-Mobile USA, Inc.,
3.875%, 4/15/2030 42,311,491 ______________ 144,752,993 ______________
Wirelines – 1.0% 25,684,000 AT&T, Inc.,
3.650%, 9/15/2059 25,604,967 3,825,000 Cincinnati Bell Telephone Co. LLC,
6.300%, 12/01/2028 4,190,288 3,036,000 Cincinnati Bell, Inc.,
8.000%, 10/15/2025, 144A 3,164,119 1,875,000 Lumen Technologies, Inc.,
5.625%, 4/01/2025 2,039,063 9,878,000 Telecom Italia Capital S.A.,
6.000%, 9/30/2034 11,088,055 23,485,000 Telecom Italia Capital S.A.,
6.375%, 11/15/2033 27,329,494 5,915,000 Verizon Communications, Inc.,
2.850%, 9/03/2041 5,772,863 ______________ 79,188,849 ______________
Total Non-Convertible Bonds (Identified Cost $5,745,787,572) 5,992,498,383 ______________
Convertible Bonds – 5.8%
Airlines – 0.4% 5,645,000 JetBlue Airways Corp.,
0.500%, 4/01/2026, 144A 5,531,219 18,914,000 Southwest Airlines Co.,
1.250%, 5/01/2025(a) 28,252,788 ______________ 33,784,007 ______________
Cable Satellite – 3.1% 48,505,000 DISH Network Corp.,
2.375%, 3/15/2024 47,262,059 184,765,000 DISH Network Corp.,
3.375%, 8/15/2026 192,063,218 ______________ 239,325,277 ______________
Consumer Cyclical Services – 0.4% 8,160,000 Expedia Group, Inc.,
Zero Coupon, 0.000%, 2/15/2026, 144A(m) 8,809,952

Principal Amount (‡) Description Value (†) ____________________________________________________________________________________________
Bonds and Notes – continued
Convertible Bonds – continued
Consumer Cyclical Services – continued $ 8,860,000 Peloton Interactive, Inc.,
Zero Coupon, 0.000%-1.734%, 2/15/2026, 144A(n) $ 7,799,331 11,830,000 Uber Technologies, Inc.,
Zero Coupon, 0.000%, 12/15/2025, 144A(m) 11,506,218 ______________ 28,115,501 ______________
Gaming – 0.1% 2,390,000 Penn National Gaming, Inc.,
2.750%, 5/15/2026 7,626,490 ______________
Healthcare – 0.3% 26,209,000 Teladoc Health, Inc.,
1.250%, 6/01/2027 26,325,276 ______________
Media Entertainment – 0.2% 12,670,000 Twitter, Inc.,
Zero Coupon, 0.000%, 3/15/2026, 144A(m) 11,762,064 ______________
Pharmaceuticals – 0.7% 13,963,000 BioMarin Pharmaceutical, Inc.,
0.599%, 8/01/2024 14,286,750 27,688,000 BioMarin Pharmaceutical, Inc.,
1.250%, 5/15/2027 27,710,798 7,650,000 Ionis Pharmaceuticals, Inc.,
Zero Coupon, 0.000%, 4/01/2026, 144A(m) 6,951,841 4,650,000 Livongo Health, Inc.,
0.875%, 6/01/2025 6,143,069 ______________ 55,092,458 ______________
Technology – 0.6% 24,720,000 Palo Alto Networks, Inc.,
0.375%, 6/01/2025 40,814,540 8,485,000 Splunk, Inc.,
1.125%, 6/15/2027 8,320,603 ______________ 49,135,143 ______________
Total Convertible Bonds (Identified Cost $443,159,768) 451,166,216 ______________
Municipals – 1.2%
Virginia – 1.2% 92,215,000 Tobacco Settlement Financing Corp., Series A-1,
6.706%, 6/01/2046 (Identified Cost $91,558,895) 96,290,820 ______________
Total Bonds and Notes (Identified Cost $6,280,506,235) 6,539,955,419 ______________
Senior Loans – 0.9%
Airlines – 0.1% 8,970,422 United Airlines, Inc., 2021 Term Loan B,
3-month LIBOR + 3.750%, 4.500%, 4/21/2028(c) 9,025,500 ______________

Principal Amount (‡) Description Value (†) ____________________________________________________________________________________________
Senior Loans – continued
Cable Satellite – 0.1% $ 3,926,000 DirecTV Financing LLC, Term Loan,
7/22/2027(o) $ 3,927,217 3,992,630 DirecTV Financing LLC, Term Loan,
3-month LIBOR + 5.000%, 5.750%, 7/22/2027(c) 3,993,868 ______________ 7,921,085 ______________
Chemicals – 0.2% 10,864,295 Aruba Investments, Inc., 2020 2nd Lien Term Loan,
3-month LIBOR + 7.750%, 8.500%, 11/24/2028(c) 10,891,456 ______________
Healthcare – 0.1% 7,022,629 Medline Industries, Inc., USD Term Loan B,
9/20/2028(o) 7,007,249 ______________
Independent Energy – 0.2% 16,469,000 Ascent Resources - Utica, 2020 Fixed 2nd Lien Term Loan,
3-month LIBOR + 9.000%, 10.000%, 11/01/2025(c) 18,006,052 ______________
Lodging – 0.1% 9,065,193 Hilton Grand Vacations Borrower LLC, 2021 Term Loan B,
1-month LIBOR + 3.000%, 3.500%, 8/02/2028(c) 9,085,590 ______________
Pharmaceuticals – 0.1% 7,983,990 Jazz Financing Lux S.a.r.l., USD Term Loan,
1-month LIBOR + 3.500%, 4.000%, 5/05/2028(c) 7,993,012 ______________
Total Senior Loans (Identified Cost $67,949,076) 69,929,944 ______________
Collateralized Loan Obligations – 2.9% 7,140,000 AGL CLO 12 Ltd., Series 2021-12A, Class B,
3-month LIBOR + 1.600%, 1.730%, 7/20/2034, 144A(c) 7,114,429 7,240,000 AGL CLO 12 Ltd., Series 2021-12A, Class D,
3-month LIBOR + 2.850%, 2.980%, 7/20/2034, 144A(c) 7,239,236 1,805,000 AGL CLO 7 Ltd., Series 2020-7A, Class DR,
3-month LIBOR + 3.100%, 3.226%, 7/15/2034, 144A(c) 1,804,983 10,050,000 AIG CLO Ltd., Series 2021-1A, Class D,
3-month LIBOR + 2.950%, 3.134%, 4/22/2034, 144A(c) 10,040,389 5,605,000 AIG CLO Ltd., Series 2021-2A, Class D,
3-month LIBOR + 3.050%, 3.140%, 7/20/2034, 144A(c) 5,576,991 3,955,000 ARES Loan Funding I Ltd., Series 2021-ALFA, Class D,
3-month LIBOR + 3.000%, 3.116%, 10/15/2034, 144A(c) 3,962,840 9,977,000 Assurant CLO Ltd., Series 2018-3A, Class DR,
3-month LIBOR + 3.100%, 3.234%, 10/20/2031, 144A(c) 9,976,884 5,225,000 Bain Capital Credit CLO Ltd, Series 2017-2A, Class DR2,
3-month LIBOR + 3.100%, 3.235%, 7/25/2034, 144A(c)(d) 5,225,000 10,720,000 Benefit Street Partners CLO XVI Ltd., Series 2018-16A, Class CR,
3-month LIBOR + 2.000%, 2.134%, 1/17/2032, 144A(c) 10,688,628 2,245,000 Benefit Street Partners CLO XVI Ltd., Series 2018-16A, Class DR,
3-month LIBOR + 3.000%, 3.134%, 1/17/2032, 144A(c) 2,244,978 5,225,000 CarVal CLO III Ltd., Series 2019-2A, Class DR,
3-month LIBOR + 2.950%, 5.216%, 7/20/2032, 144A(c) 5,219,830 4,305,000 CIFC Funding Ltd., Series 2021-5A, Class D,
3-month LIBOR + 3.250%, 3.397%, 7/15/2034, 144A(c) 4,316,297

Principal Amount (‡) Description Value (†) ____________________________________________________________________________________________
Collateralized Loan Obligations – continued $ 6,075,000 Crown City CLO I, Series 2021-1A, Class CR,
3-month LIBOR + 3.420%, 3.566%, 7/20/2034, 144A(c) $ 6,074,923 7,745,000 Elmwood CLO V Ltd., Series 2020-2A, Class DR,
3-month LIBOR + 3.100%, 3.217%, 10/20/2034, 144A(c) 7,775,979 4,085,000 Elmwood CLO VIII Ltd., Series 2021-1A, Class D2,
3-month LIBOR + 2.850%, 2.984%, 1/20/2034, 144A(c) 4,080,990 3,365,000 KVK CLO Ltd., Series 2013-1A, Class DR,
3-month LIBOR + 2.950%, 3.083%, 1/14/2028, 144A(c) 3,365,053 8,760,000 LCM 30 Ltd., Series 30A, Class BR,
3-month LIBOR + 1.500%, 1.634%, 4/20/2031, 144A(c) 8,735,907 1,470,000 LCM 30 Ltd., Series 30A, Class CR,
3-month LIBOR + 2.000%, 2.134%, 4/20/2031, 144A(c) 1,468,547 4,215,000 LCM 30 Ltd., Series 30A, Class CR,
3-month LIBOR + 3.000%, 3.134%, 4/20/2031, 144A(c) 4,214,954 15,835,000 Madison Park Funding XXIII Ltd., Series 2017-23A, Class DR,
3-month LIBOR + 3.200%, 3.329%, 7/27/2031, 144A(c) 15,850,490 1,260,000 Madison Park Funding XXXI Ltd., Series 2018-31A, Class D,
3-month LIBOR + 3.000%, 3.138%, 1/23/2031, 144A(c) 1,260,076 5,260,000 Neuberger Berman CLO XVI-S Ltd., Series 2017-16SA, Class DR,
3-month LIBOR + 2.900%, 3.026%, 4/15/2034, 144A(c) 5,259,957 9,225,000 Neuberger Berman CLO XX Ltd., Series 2015-20A, Class BRR,
3-month LIBOR + 1.650%, 1.788%, 7/15/2034, 144A(c) 9,224,970 11,920,000 OCP CLO Ltd., Series 2019-17A, Class DR,
3-month LIBOR + 3.100%, 3.234%, 7/20/2032, 144A(c) 11,919,862 10,585,000 Octagon Investment Partners 42 Ltd., Series 2019-3A, Class DR,
3-month LIBOR + 3.150%, 3.276%, 7/15/2034, 144A(c) 10,613,397 4,920,000 Octagon Investment Partners 46 Ltd., Series 2020-A2, Class DR,
3-month LIBOR + 3.300%, 3.409%, 7/15/2036, 144A(c) 4,946,441 12,430,000 OHA Credit Funding 3 Ltd., Series 2019-3A, Class BR,
3-month LIBOR + 1.650%, 1.798%, 7/02/2035, 144A(c) 12,441,429 9,720,000 OHA Credit Funding 3 Ltd., Series 2019-3A, Class DR,
3-month LIBOR + 2.900%, 3.048%, 7/02/2035, 144A(c) 9,719,876 12,640,000 Palmer Square CLO Ltd., Series 2013-2A, Class A2R3,
3-month LIBOR + 1.500%, 1.634%, 10/17/2031, 144A(a)(c) 12,640,812 5,120,000 Palmer Square CLO Ltd., Series 2013-2A, Class CR3,
3-month LIBOR + 2.700%, 2.834%, 10/17/2031, 144A(c) 5,112,440 1,455,000 Palmer Square CLO Ltd., Series 2015-1A, Class A2R4,
3-month LIBOR + 1.700%, 1.831%, 5/21/2034, 144A(c) 1,462,199 11,440,000 Palmer Square CLO Ltd., Series 2015-1A, Class CR4,
3-month LIBOR + 2.850%, 2.981%, 5/21/2034, 144A(c) 11,439,842 1,710,000 Parallel Ltd., Series 2015-1A, Class DR,
3-month LIBOR + 2.550%, 2.684%, 7/20/2027, 144A(c) 1,713,309 700,000 THL Credit Wind River CLO Ltd., Series 2018-3A, Class D,
3-month LIBOR + 2.950%, 3.084%, 1/20/2031, 144A(c) 700,015 2,135,000 Vibrant CLO XIV Ltd., Series 2021-14A, Class C,
3-month LIBOR + 3.750%, 3.893%, 10/20/2034, 144A(c) 2,156,272 ______________
Total Collateralized Loan Obligations (Identified Cost $225,556,697) 225,588,225 ______________
Shares ____________________________________________________________________________________________
Common Stocks – 8.6%
Aerospace & Defense – 0.2% 51,366 Lockheed Martin Corp. 17,726,407 ______________

Shares Description Value (†) ____________________________________________________________________________________________
Common Stocks – continued
Air Freight & Logistics – 0.2% 99,820 United Parcel Service, Inc., Class B $ 18,177,222 ______________
Beverages – 0.2% 335,327 Coca-Cola Co. (The) 17,594,608 ______________
Capital Markets – 0.5% 22,015 BlackRock, Inc. 18,463,100 197,326 Morgan Stanley 19,201,793 ______________ 37,664,893 ______________
Chemicals – 0.2% 733,495 Hexion Holdings Corp., Class B(h) 15,525,889 ______________
Communications Equipment – 0.2% 347,260 Cisco Systems, Inc. 18,901,362 ______________
Electric Utilities – 0.5% 181,009 Duke Energy Corp. 17,664,668 244,731 NextEra Energy, Inc. 19,216,278 ______________ 36,880,946 ______________
Electronic Equipment, Instruments & Components – 0.3% 553,744 Corning, Inc. 20,206,119 ______________
Food & Staples Retailing – 0.2% 134,455 Walmart, Inc. 18,740,338 ______________
Health Care Equipment & Supplies – 0.2% 157,455 Abbott Laboratories 18,600,159 ______________
Health Care Providers & Services – 0.5% 49,788 Anthem, Inc. 18,560,967 46,430 UnitedHealth Group, Inc. 18,142,058 ______________ 36,703,025 ______________
Hotels, Restaurants & Leisure – 0.2% 156,327 Starbucks Corp. 17,244,431 ______________
Household Products – 0.3% 136,026 Procter & Gamble Co. (The) 19,016,435 ______________
IT Services – 0.4% 59,929 Accenture PLC, Class A 19,172,485 45,016 Automatic Data Processing, Inc. 8,999,599 ______________ 28,172,084 ______________
Machinery – 0.4% 41,133 Cummins, Inc. 9,236,826 53,066 Deere & Co. 17,780,825 ______________ 27,017,651 ______________
Media – 0.5% 328,856 Comcast Corp., Class A 18,392,916

Shares Description Value (†) ____________________________________________________________________________________________
Common Stocks – continued
Media – continued 705,779 iHeartMedia, Inc., Class A(h) $ 17,658,591 ______________ 36,051,507 ______________
Metals & Mining – 0.2% 305,108 Newmont Corp. 16,567,364 ______________
Oil, Gas & Consumable Fuels – 0.9% 93,585 Battalion Oil Corp.(h) 910,582 186,859 Chevron Corp. 18,956,846 666,240 Lonestar Resources U.S., Inc.(d)(e)(f)(g)(h)(p) 7,128,768 485,722 SM Energy Co. 12,813,346 150,022 Whiting Petroleum Corp.(h) 8,762,785 752,754 Williams Cos., Inc. (The) 19,526,439 ______________ 68,098,766 ______________
Pharmaceuticals – 0.7% 246,078 Bristol-Myers Squibb Co. 14,560,435 111,090 Johnson & Johnson 17,941,035 248,601 Merck & Co., Inc. 18,672,421 ______________ 51,173,891 ______________
Professional Services – 0.0% 7,905 Clarivate PLC(h) 173,119 ______________
REITs - Diversified – 0.2% 67,601 American Tower Corp. 17,941,981 ______________
Road & Rail – 0.2% 87,981 Union Pacific Corp. 17,245,156 ______________
Semiconductors & Semiconductor Equipment – 0.1% 51,476 Texas Instruments, Inc. 9,894,202 ______________
Software – 0.3% 17,622 iQor Holdings, Inc.(f)(h)(j) 208,169 66,770 Microsoft Corp. 18,823,798 ______________ 19,031,967 ______________
Specialty Retail – 0.1% 29,538 Home Depot, Inc. (The) 9,696,144 ______________
Technology Hardware, Storage & Peripherals – 0.2% 131,346 Apple, Inc. 18,585,459 ______________
Wireless Telecommunication Services – 0.7% 416,878 T-Mobile US, Inc.(h) 53,260,333 ______________
Total Common Stocks (Identified Cost $665,373,752) 665,891,458 ______________

Shares Description Value (†) ____________________________________________________________________________________________
Preferred Stocks – 1.7%
Convertible Preferred Stocks – 1.5%
Banking – 0.7% 27,889 Bank of America Corp., Series L,
7.250%(a) $ 40,227,651 11,335 Wells Fargo & Co., Class A, Series L,
7.500%(a) 16,798,470 ______________ 57,026,121 ______________
Food & Beverage – 0.1% 40,109 Bunge Ltd.,
4.875% 4,770,659 ______________
Midstream – 0.3% 433,942 El Paso Energy Capital Trust I,
4.750% 21,501,826 ______________
Technology – 0.2% 170,945 Clarivate PLC, Series A,
5.250% 14,819,222 ______________
Wireless – 0.2% 18,039 2020 Cash Mandatory Exchangeable Trust,
5.250%, 144A(f)(j) 20,397,960 ______________
Total Convertible Preferred Stocks (Identified Cost $108,512,103) 118,515,788 ______________
Non-Convertible Preferred Stocks – 0.2%
Electric – 0.0% 2,925 Connecticut Light & Power Co. (The), Series 1947,
1.900% 136,744 ______________
Finance Companies – 0.0% 16,004 iStar, Inc., Series G,
7.650% 412,263 ______________
Home Construction – 0.0% 52,867 Hovnanian Enterprises, Inc.,
7.625%(h) 925,172 ______________
REITs - Office Property – 0.0% 2,318 Highwoods Properties, Inc., Series A,
8.625% 2,897,500 ______________
REITs - Warehouse/Industrials – 0.2% 169,007 Prologis, Inc., Series Q,
8.540%(a) 11,830,490 ______________
Total Non-Convertible Preferred Stocks (Identified Cost $11,111,452) 16,202,169 ______________
Total Preferred Stocks (Identified Cost $119,623,555) 134,717,957 ______________
Closed-End Investment Companies – 0.0% 170,568 NexPoint Strategic Opportunities Fund
(Identified Cost $9,816,437) 2,372,601 ______________

Principal Amount (‡) Description Value (†) ____________________________________________________________________________________________
Short-Term Investments – 1.5% $ 116,740,676 Tri-Party Repurchase Agreement with Fixed Income Clearing Corporation, dated
9/30/2021 at 0.000% to be repurchased at $116,740,676 on 10/01/2021 collateralized by $85,723,500 U.S. Treasury Inflation Indexed Note, 0.250% due 07/15/2029 valued at $101,637,718; $15,576,300 U.S. Treasury Inflation Indexed Note, 0.125% due 7/15/2031 valued at $17,437,864 including accrued interest(r) (Identified Cost $116,740,676) $ 116,740,676 ______________
Total Investments – 99.6% (Identified Cost $7,485,566,428) 7,755,196,280
Other assets less liabilities – 0.4% 33,242,118 ______________ Net Assets – 100.0% $ 7,788,438,398 ______________ ______________

(†)
Fund securities and other investments are valued at market value based on market quotations obtained or determined by independent pricing services recommended by the adviser and approved by the Board of Trustees. Fund securities and other investments for which market quotations are not readily available are valued at fair value as determined in good faith by the adviser pursuant to procedures approved by the Board of Trustees, as described below. Market value is determined as follows: Debt securities and unlisted preferred equity securities are valued based on evaluated bids furnished to the Fund by an independent pricing service or bid prices obtained from broker-dealers. Senior loans and collateralized loan obligations are valued at bid prices supplied by an independent pricing service, if available. Listed equity securities (including shares of closed-end investment companies and exchange-traded funds) are valued at the last sale price quoted on the exchange where they are traded most extensively or, if there is no reported sale during the day, the closing bid quotation as reported by an independent pricing service. Securities traded on the NASDAQ Global Select Market, NASDAQ Global Market and NASDAQ Capital Market are valued at the NASDAQ Official Closing Price ("NOCP"), or if lacking an NOCP, at the most recent bid quotations on the applicable NASDAQ Market. Unlisted equity securities (except unlisted preferred equity securities) are valued at the last sale price quoted in the market where they are traded most extensively or, if there is no reported sale during the day, the closing bid quotation as reported by an independent pricing service. If there is no last sale price or closing bid quotation available, unlisted equity securities will be valued using evaluated bids furnished by an independent pricing service, if available. In some foreign markets, an official close price and a last sale price may be available from the foreign exchange or market. In those cases, the official close price is used. Broker-dealer bid prices may be used to value debt and unlisted equity securities and senior loans and collateralized loan obligations where an independent pricing service is unable to price a security or where an independent pricing service does not provide a reliable price for the security. Forward foreign currency contracts are valued utilizing interpolated rates determined based on information provided by an independent pricing service. Futures contracts are valued at the most recent settlement price on the exchange on which the adviser believes that, over time, they are traded most extensively. Fund securities and other investments for which market quotations are not readily available are valued at fair value as determined in good faith by the adviser pursuant to procedures approved by the Board of Trustees. The Fund may also value securities and other investments at fair value in other circumstances such as when extraordinary events occur after the close of a foreign market but prior to the close of the New York Stock Exchange. This may include situations relating to a single issuer (such as a declaration of bankruptcy or a delisting of the issuer's security from the primary market on which it has traded) as well as events affecting the securities markets in general (such as market disruptions or closings and significant fluctuations in U.S. and/or foreign markets). When fair valuing its securities or other investments, the Fund may, among other things, use modeling tools or other processes that may take into account factors such as securities or other market activity and/or significant events that occur after the close of the foreign market and before the time the Fund's net asset value ("NAV") is calculated. Fair value pricing may require subjective determinations about the value of a security, and fair values used to determine the Fund's NAV may differ from quoted or published prices, or from prices that are used by others, for the same securities. In addition, the use of fair value pricing may not always result in adjustments to the prices of securities held by the Fund. Illiquid securities for which market quotations are readily available and have been evaluated by the adviser are considered and classified as fair valued securities pursuant to the Fund's pricing policies and procedures. As of September 30, 2021, securities held by the Funds were fair valued as follows:
Securities classified as fair valued
Percentage of Net Assets
Securities fair valued by the Fund’s adviser
Percentage of Net Assets
$138,790,254 1.8% $11,574,459 0.1% The books and records of the Fund are maintained in U.S. dollars. The values of securities, currencies and other assets and liabilities denominated in currencies other than U.S. dollars are translated into U.S. dollars based upon foreign exchange rates prevailing at the end of the period.
(‡) Principal Amount stated in U.S. dollars unless otherwise noted. (††) Amount shown represents units. One unit represents a principal amount of 1,000. (†††) Amount shown represents units. One unit represents a principal amount of 100. (a) Security (or a portion thereof) has been designated to cover the Fund's obligations under open derivative contracts.
(b)
Variable rate security. The interest rate adjusts periodically based on; (i) changes in current interest rates and/or prepayments on underlying pools of assets, if applicable, (ii) reference to a base lending rate plus or minus a margin, and/or (iii) reference to a base lending rate adjusted by a multiplier and/or subject to certain floors or caps. Rate as of September 30, 2021 is disclosed.
(c) Variable rate security. Rate as of September 30, 2021 is disclosed. (d) Level 3 security. Value has been determined using significant unobservable inputs.
(e)
Fair valued by the Fund's adviser. At September 30, 2021, the value of these securities amounted to $11,574,459 or 0.1% of net assets.
(f) Illiquid security.

(g) Securities subject to restriction on resale. At September 30, 2021, the restricted securities held by the Fund are as follows:
Acquisition Date Acquisition Cost Value % of Net Assets GCA2014 Holdings Ltd., Series 2014-1, Class E 12/18/2014 $ 20,744,987 $ 440,679 Less than 0.1% Lonestar Resources U.S., Inc. 12/01/2020 4,623,706* 7,128,768 0.1% * Represents basis assigned upon receipt in a taxable restructuring. (h) Non-income producing security. (i) Perpetual bond with no specified maturity date.
(j)
Securities classified as fair valued pursuant to the Fund's pricing policies and procedures. At September 30, 2021, the value of these securities amounted to $138,790,254 or 1.8% of net assets.
(k) The issuer is in default with respect to interest and/or principal payments. Income is not being accrued. (l) Security (or a portion thereof) has been pledged as collateral for open derivative contracts. (m) Interest rate represents annualized yield at time of purchase; not a coupon rate.
(n)
Interest rate represents annualized yield at time of purchase; not a coupon rate. The Fund's investment in this security is comprised of various lots with differing annualized yields.
(o)
Position is unsettled. Contract rate was not determined at September 30, 2021 and does not take effect until settlement date. Maturity date is not finalized until settlement date.
(p) Affiliated issuer.
(r)
The Fund may enter into repurchase agreements, under the terms of a Master Repurchase Agreement, under which the Fund acquires securities as collateral and agrees to resell the securities at an agreed upon time and at an agreed upon price. It is the Fund's policy that the market value of the collateral for repurchase agreements be at least equal to 102% of the repurchase price, including interest. Certain repurchase agreements are tri-party arrangements whereby the collateral is held in a segregated account for the benefit of the Fund and on behalf of the counterparty. Repurchase agreements could involve certain risks in the event of default or insolvency of the counterparty, including possible delays or restrictions upon the Fund's ability to dispose of the underlying securities. As of September 30, 2021, the Fund had an investment in a repurchase agreement for which the value of the related collateral exceeded the value of the repurchase agreement.
144A
All or a portion of these securities are exempt from registration under Rule 144A of the Securities Act of 1933. These securities may be resold in transactions exempt from registration, normally to qualified institutional buyers. At September 30, 2021, the value of Rule 144A holdings amounted to $2,714,505,706 or 34.9% of net assets.
ABS Asset-Backed Securities EMTN Euro Medium Term Note FHLMC Federal Home Loan Mortgage Corp. LIBOR London Interbank Offered Rate MTN Medium Term Note REITs Real Estate Investment Trusts
BRL Brazilian Real INR Indian Rupee MXN Mexican Peso Forward Foreign Currency Contracts The Fund may enter into forward foreign currency contracts, including forward foreign cross currency contracts, to acquire exposure to foreign currencies or to hedge the Fund's investments against currency fluctuation. A contract can also be used to offset a previous contract. These contracts involve market risk in excess of the unrealized appreciation (depreciation). The U.S. dollar value of the currencies the Fund has committed to buy or sell represents the aggregate exposure to each currency the Fund has acquired or hedged through currency contracts outstanding at period end. Gains or losses are recorded for financial statement purposes as unrealized until settlement date. Contracts are traded over-the-counter directly with a counterparty. Risks may arise upon entering into these contracts from the potential inability of counterparties to meet the terms of their contracts and from unanticipated movements in the value of a foreign currency relative to the U.S. dollar. Certain contracts may require the movement of cash and/or securities as collateral for the Fund's or counterparty's net obligations under the contracts. At September 30, 2021, the Fund had the following open forward foreign currency contracts:
Counterparty Delivery
Date
Currency Bought/
Sold (B/S)
Units of
Currency In Exchange
for Notional
Value
Unrealized Appreciation
(Depreciation) ____________________________________________________________________________________________
Bank of America, N.A. 12/02/2021 BRL S 115,203,000 $ 21,590,981 $ 20,952,881 $ 638,100 ____________ ____________

Futures Contracts The Fund may enter into futures contracts. Futures contracts are agreements between two parties to buy and sell a particular instrument or index for a specified price on a specified future date. When the Fund enters into a futures contract, it is required to deposit with (or for the benefit of) its broker an amount of cash or short-term high-quality securities as "initial margin." As the value of the contract changes, the value of the futures contract position increases or declines. Subsequent payments, known as "variation margin," are made or received by the Fund, depending on the price fluctuations in the fair value of the contract and the value of cash or securities on deposit with the broker. Realized gain or loss on a futures position is equal to the difference between the value of the contract at the time it was opened and the value at the time it was closed, minus brokerage commissions. When the Fund enters into a futures contract certain risks may arise, such as illiquidity in the futures market, which may limit the Fund's ability to close out a futures contract prior to settlement date, and unanticipated movements in the value of securities or interest rates. Futures contracts are exchange-traded. Exchange-traded futures contracts are standardized and are settled through a clearing house with fulfillment supported by the credit of the exchange. Therefore, counterparty credit risks to the Fund are reduced; however, in the event that a counterparty enters into bankruptcy, the Fund's claim against initial/variation margin on deposit with the counterparty may be subject to terms of a final settlement in bankruptcy court.
At September 30, 2021, open long futures contracts were as follows:
Financial Futures Expiration
Date Contracts Notional Amount Value
Unrealized Appreciation
(Depreciation) ____________________________________________________________________________________________
10 Year U.S. Treasury Note 12/21/2021 4,465$ 593,971,078 $ 587,635,859 $ (6,335,219) ______________ ______________
At September 30, 2021, open short futures contracts were as follows:
Financial Futures Expiration
Date Contracts Notional Amount Value
Unrealized Appreciation
(Depreciation) ____________________________________________________________________________________________ Ultra 10 Year U.S. Treasury Note 12/21/2021 7,724$ 1,139,153,942 $ 1,121,911,000 $ 17,242,942 Ultra Long U.S. Treasury Bond 12/21/2021 360 70,540,282 68,782,500 1,757,782 ______________ Total $ 19,000,724 ______________ ______________

Affiliated Transactions As a result of a business restructuring, the Fund received common shares of Lonestar Resources U.S., Inc. (the “Company”) constituting more than 5% of the voting securities of the Company. As such, the Company is considered to be an affiliate at September 30, 2021. A summary of affiliated transactions for the period ended September 30, 2021, is as follows:
Beginning
Value Purchase
Cost Sales Proceeds
Accrued Discounts
(Premiums)
Realized Gain (Loss)
Change in Unrealized
Gain (Loss)
Ending Value
Investment Income
Lonestar Resources U.S., Inc. $ 4,623,706 $ — $ — $ — $ — $ 2,505,062 $ 7,128,768 $ —

Fair Value Measurements
In accordance with accounting standards related to fair value measurements and disclosures, the Fund has categorized the inputs utilized in determining the value of the Fund’s assets or liabilities. These inputs are summarized in the three broad levels listed below:
• Level 1 — quoted prices in active markets for identical assets or liabilities;
• Level 2 — prices determined using other significant inputs that are observable either directly, or indirectly through corroboration with observable market
data (which could include quoted prices for similar assets or liabilities, interest rates, credit risk, etc.); and
• Level 3 — prices determined using significant unobservable inputs when quoted prices or observable inputs are unavailable such as when there is little or no market activity for an asset or liability (unobservable inputs reflect the Fund’s own assumptions in determining the fair value of assets or liabilities and would be based on the best information available).
The inputs or methodology used for valuing securities are not necessarily an indication of the risk associated with investing in those securities. The following is a summary of the inputs used to value the Fund’s investments as of September 30, 2021, at value:

Asset Valuation Inputs Description Level 1 Level 2 Level 3 Total _____________________________________________________________________________________________________________ Bonds and Notes Non-Convertible Bonds ABS Other $ — $ 118,469,638 $ 2,851,903(a) $ 121,321,541 Independent Energy — 243,152,043 1,578,800(b) 244,730,843 Property & Casualty Insurance — — 2,426,212(b) 2,426,212 All Other Non-Convertible Bonds* — 5,624,019,787 — 5,624,019,787 _____________________________________________________________________________________________________________ Total Non-Convertible Bonds — 5,985,641,468 6,856,915 5,992,498,383 _____________________________________________________________________________________________________________ Convertible Bonds* — 451,166,216 — 451,166,216 Municipals* — 96,290,820 — 96,290,820 _____________________________________________________________________________________________________________ Total Bonds and Notes — 6,533,098,504 6,856,915 6,539,955,419 _____________________________________________________________________________________________________________ Senior Loans* — 69,929,944 — 69,929,944 Collateralized Loan Obligations — 220,363,225 5,225,000(c) 225,588,225 Common Stocks Chemicals — 15,525,889 — 15,525,889 Oil, Gas & Consumable Fuels 60,969,998 — 7,128,768(b) 68,098,766 Software 18,823,798 208,169 — 19,031,967 All Other Common Stocks* 563,234,836 — — 563,234,836 _____________________________________________________________________________________________________________ Total Common Stocks 643,028,632 15,734,058 7,128,768 665,891,458 _____________________________________________________________________________________________________________ Preferred Stocks Convertible Preferred Stocks Food & Beverage — 4,770,659 — 4,770,659 Wireless — 20,397,960 — 20,397,960 All Other Convertible Preferred Stocks* 93,347,169 — — 93,347,169 _____________________________________________________________________________________________________________ Total Convertible Preferred Stocks 93,347,169 25,168,619 — 118,515,788 _____________________________________________________________________________________________________________ Non-Convertible Preferred Stocks Electric — 136,744 — 136,744 REITs - Office Property — 2,897,500 — 2,897,500 REITs - Warehouse/Industrials — 11,830,490 — 11,830,490 All Other Non-Convertible Preferred Stocks* 1,337,435 — — 1,337,435 _____________________________________________________________________________________________________________ Total Non-Convertible Preferred Stocks 1,337,435 14,864,734 — 16,202,169 _____________________________________________________________________________________________________________ Total Preferred Stocks 94,684,604 40,033,353 — 134,717,957 _____________________________________________________________________________________________________________ Closed-End Investment Companies 2,372,601 — — 2,372,601 Short-Term Investments — 116,740,676 — 116,740,676 _____________________________________________________________________________________________________________ Total Investments 740,085,837 6,995,899,760 19,210,683 7,755,196,280 _____________________________________________________________________________________________________________ Forward Foreign Currency Contracts (unrealized appreciation) — 638,100 — 638,100 Futures Contracts (unrealized appreciation) 19,000,724 — — 19,000,724 _____________________________________________________________________________________________________________ Total $ 759,086,561 $ 6,996,537,860 $ 19,210,683 $ 7,774,835,104 _____________________________________________________________________________________________________________ _____________________________________________________________________________________________________________ Liability Valuation Inputs Description Level 1 Level 2 Level 3 Total _____________________________________________________________________________________________________________ Futures Contracts (unrealized depreciation) $ (6,335,219) $ — $ — $ (6,335,219) _____________________________________________________________________________________________________________ _____________________________________________________________________________________________________________ * Details of the major categories of the Fund's investments are reflected within the Portfolio of Investments. (a) Valued using broker-dealer bid prices ($2,411,224) or Fair valued by the Fund's adviser ($440,679). (b) Fair valued by the Fund's adviser. (c) Valued using broker-dealer bid prices.

The Fund’s pricing policies and procedures are recommended by the adviser and approved by the Board of Trustees. Debt securities are valued based on evaluated bids furnished to the Fund by an independent pricing service. Broker-dealer bid prices may be used if an independent pricing service either is unable to price a security or does not provide a reliable price for a security. The Fund’s adviser may use internally developed models to validate broker-dealer bid prices that are only available from a single broker or market maker. Such securities are considered and classified as fair valued. Broker-dealer bid prices for which the Fund does not have knowledge of the inputs used by the broker-dealer are categorized in Level 3. Securities for which market quotations are not readily available are valued at fair value as determined in good faith by the Fund’s adviser pursuant to procedures approved by the Board of Trustees. Fair valued securities may be categorized in Level 3. The following is a reconciliation of Level 3 investments for which significant unobservable inputs were used to determine fair value as of December 31, 2020 and/or September 30, 2021:

Asset Valuation Inputs
Investments in Securities
Balance as of December 31,
2020
Accrued Discounts
(Premiums) Realized Gain
(Loss)
Change in Unrealized
Appreciation (Depreciation) Purchases Sales
Transfers into Level 3
Transfers out of Level 3
Balance as of September 30,
2021
Change in Unrealized Appreciation (Depreciation)
from Investments Still Held at September 30, 2021
Bonds and Notes
Non-Convertible Bonds
ABS Other $ 26,341,487(a) $ - $ (1,792,359) $ 37,706,391 $ 3,686,173 $ (63,089,789) $ - $ - $ 2,851,903 $ 5,092,474
Finance Companies 1,205,500 - - - - - - (1,205,500) - -
Independent Energy - 379,847 - 1,063,113 - - 135,840 - 1,578,800 1,063,113
Property & Casualty Insurance - 47,200 - (2,543,738) - - 4,922,750 - 2,426,212 (2,543,738)
Collateralized Loan Obligations - - - - 5,225,000 - - - 5,225,000 -
Common Stocks
Oil, Gas & Consumable Fuels 4,623,706(a) - (1,451,033) 3,956,095 - - - - 7,128,768 2,505,062
Preferred Stocks
Convertible Preferred Stocks
Energy -(a) - (148,975,606) 148,975,606 - - - - - -
Warrants 10,234,074 - - 5,124,205 10 (15,358,289) - - - -
Total $ 42,404,767 $ 427,047 $ (152,218,998) $ 194,281,672 $ 8,911,183 $ (78,448,078) $ 5,058,590 $ (1,205,500) $ 19,210,683 $ 6,116,911
(a) Includes a security fair valued at zero by the Fund’s adviser using Level 3 inputs. A debt security valued at $1,205,500 was transferred from Level 3 to Level 2 during the period ended September 30, 2021. At December 31, 2020, this security was valued at fair value as determined in good faith by the Fund's investment adviser as an independent pricing service did not provide a reliable price for the security. At September 30, 2021, this security was valued on the basis of evaluated bids furnished to the Fund by an independent pricing service in accordance with the Fund's valuation policies. Debt securities valued at $135,840 were transferred from Level 2 to Level 3 during the period ended September 30, 2021. At December 31, 2020, these securities were valued on the basis of evaluated bids furnished to the Fund by an independent pricing service in accordance with the Fund's valuation policies. At September 30, 2021, these securities were valued at fair value as determined in good faith by the Fund's adviser as an independent pricing service was unable to price the securities. Debt securities valued at $4,922,750 were transferred from Level 2 to Level 3 during the period ended September 30, 2021. At December 31, 2020, these securities were valued on the basis of evaluated bids furnished to the Fund by an independent pricing service in accordance with the Fund's valuation policies. At September 30, 2021, these securities were valued at fair value as determined in good faith by the Fund's adviser as an independent pricing service did not provide a reliable price for the securities.

Derivatives Derivative instruments are defined as financial instruments whose value and performance are based on the value and performance of an underlying asset, reference rate or index. Derivative instruments that the Fund used during the period include forward foreign currency contracts and futures contracts. The Fund is subject to the risk that changes in foreign currency exchange rates will have an unfavorable effect on the value of Fund assets denominated in foreign currencies. The Fund may enter into forward foreign currency contracts for hedging purposes to protect the value of the Fund’s holdings of foreign securities. The Fund may also use forward foreign currency contracts to gain exposure to foreign currencies, regardless of whether securities denominated in such currencies are held in the Fund. During the period ended September 30, 2021, the Fund engaged in forward foreign currency contracts for hedging purposes and to gain exposure to foreign currencies. The Fund is subject to the risk that changes in interest rates will affect the value of the Fund’s investments in fixed-income securities. The Fund will be subject to increased interest rate risk to the extent that it invests in fixed-income securities with longer maturities or durations, as compared to investing in fixed-income securities with shorter maturities or durations. The Fund may use futures contracts to hedge against changes in interest rates and to manage duration without having to buy or sell portfolio securities. The Fund may also use futures contracts to gain investment exposure. During the period ended September 30, 2021, the Fund used futures contracts to manage duration. The following is a summary of derivative instruments for the Fund, as of September 30, 2021:

Assets
Unrealized appreciation
on forward foreign currency contracts
Unrealized appreciation on futures
contracts
Over-the-counter asset derivatives Foreign exchange contracts $ 638,100 $ — Exchange-traded asset derivatives Interest rate contracts — 19,000,724 Total asset derivatives $ 638,100 $ 19,000,724 Liabilities
Unrealized depreciation on futures
contracts
Exchange-traded liability derivatives Interest rate contracts $ (6,335,219)

The Fund’s derivatives do not qualify for hedge accounting under authoritative guidance for derivative instruments. The Fund’s investments in derivatives may represent an economic hedge; however, they are considered to be non-hedge transactions for the purpose of this disclosure.
Over-the-counter derivatives, including forward foreign currency contracts, are entered into pursuant to International Swaps and Derivatives Association, Inc. (“ISDA”) agreements negotiated between the Fund and its counterparties. ISDA agreements typically contain, among other things, terms for the posting of collateral and master netting provisions in the event of a default or other termination event. Collateral is posted by the Fund or the counterparty to the extent of the net mark-to-market exposure to the other party of all open contracts under the agreement, subject to minimum transfer requirements. Master netting provisions allow the Fund and the counterparty, in the event of a default or other termination event, to offset amounts owed by each related to derivative contracts, including any posted collateral, to one net amount payable by either the Fund or the counterparty. The Fund’s ISDA agreements typically contain provisions that allow a counterparty to terminate open contracts early if the NAV of the Fund declines beyond a certain threshold. As of September 30, 2021, the Fund did not hold any derivative positions subject to these provisions that are in a net liability position by counterparty. Timing differences may exist between when contracts under the ISDA agreement are marked-to-market and when collateral moves. The ISDA agreements include tri-party control agreements under which collateral is held for the benefit of the secured party at a third party custodian, State Street Bank.
Counterparty risk is managed based on policies and procedures established by the Fund’s adviser. Such policies and procedures may include, but are not limited to, minimum counterparty credit rating requirements, monitoring of counterparty credit default swap spreads and posting of collateral. The Fund's risk of loss from counterparty credit risk on over-the-counter derivatives is generally limited to the Fund’s aggregated unrealized gains and the amount of any collateral pledged to the counterparty, which may be offset by any collateral posted to the Fund by the counterparty. ISDA master agreements can help to manage counterparty risk by specifying collateral posting arrangements at pre-arranged exposure levels. Under these ISDA agreements, collateral is routinely transferred if the total net exposure in respect of certain transactions, net of existing collateral already in place, exceeds a specified amount (typically $250,000, depending on the counterparty). With exchange-traded derivatives, there is minimal counterparty credit risk to the Fund because the exchange’s clearinghouse, as counterparty to these instruments, stands between the buyer and the seller of the contract. Credit risk still exists in exchange-traded derivatives with respect to initial and variation margin that is held in a broker’s customer accounts. While brokers typically are required to segregate customer margin for exchange-traded derivatives from their own assets, in the event that a broker becomes insolvent or goes into bankruptcy and at that time there is a shortfall in the aggregate amount of margin held by the broker for all its customers, U.S. bankruptcy laws will typically allocate that shortfall on a pro rata basis across all of the broker’s customers, potentially resulting in losses to the Fund. The following table shows (i) the maximum amount of loss due to credit risk that, based on the gross fair value of the financial instrument, the Fund would incur if parties (including OTC derivative counterparties and brokers holding margin for exchange-traded derivatives) to the relevant financial instruments failed completely to perform according to the terms of the contracts and the collateral or other security, if any, for the amount due proved to be of no value to the Fund, and (ii) the amount of loss that the Fund would incur after taking into account master netting provisions pursuant to ISDA agreements, as of September 30, 2021:
Maximum Amount of Loss - Gross
Maximum Amount
of Loss - Net $ 77,769,790 $ 77,139,790
Net loss amount reflects cash received as collateral of $630,000.

Industry Summary at September 30, 2021 (Unaudited) Treasuries 13.5 % Cable Satellite 6.9 Finance Companies 5.6 Banking 5.5 Metals & Mining 3.4 Independent Energy 3.3 ABS Home Equity 3.2 Consumer Cyclical Services 3.0 Life Insurance 2.9 Technology 2.9 Airlines 2.5 Aerospace & Defense 2.5 Wireless 2.1 Other Investments, less than 2% each 37.9 Collateralized Loan Obligations 2.9 Short-Term Investments 1.5 Closed-End Investment Companies 0.0 * ______ Total Investments 99.6 Other assets less liabilities (including forward foreign currency and futures contracts) 0.4 ______ Net Assets 100.0 % ______ ______
* Less than 0.1%