artificial ground-water recharge at peoria, illinois
TRANSCRIPT

BULLETIN 48
Artificial Ground-Water Recharge
at Peoria, Illinois
by MAX SUTER and ROBERT H. HARMESON
Printed by authority of the State of Illinois

STATE OF ILLINOIS
HON. WILLIAM G. STRATTON, Governor
DEPARTMENT OF REGISTRATION AND EDUCATION
HON. VERA M. BINKS, Director
BOARD OF NATURAL RESOURCES AND CONSERVATION
HON. VERA M. BINKS, Chairman
ROGER ADAMS, Ph.D., D.Sc, LL.D., Chemistry
ROBERT H. ANDERSON, B.S., Engineering
ALFRED E. EMERSON, Ph.D., Biology
WALTER H. NEWHOUSE, Ph.D., Geology
LEWIS H. TIFFANY, Ph.D., Pd.D., Forestry
WILLIAM L EVERITT, E.E., Ph.D.,
University of Illinois
DELYTE W. MORRIS, Ph.D.,
President, Southern Illinois University
STATE WATER SURVEY DIVISION
WILLIAM C. ACKERMANN, Chief
URBANA
1960

CONTENTS
Page
ABSTRACT. . 7
INTRODUCTION , 7
PURPOSE AND SCOPE 7
ACKNOWLEDGMENTS 8
METHODS OF ARTIFICIAL RECHARGE 8
INDUCED INFILTRATION 8LANDFLOODING 8CHANNELS ' 9RECHARGE WELLS 9RECHARGE PITS 9SELECTION OF METHOD AT PEORIA 9TEST OF SELECTED RECHARGE METHOD . 12
PEORIA LABORATORY 14
USE OF ILLINOIS RIVER WATER FOR RECHARGE 14
QUANTITY OF WATER 14QUALITY OF WATER 14
Temperature and Turbidity 15Dissolved Oxygen 15Biochemical Oxygen Demand 15Ammonia 15Bacteria 15
PIT NO. 1 AND RECHARGE FACILITIES 19
INTAKE STRUCTURE 19CONTROL TOWER AND CAISSON 19PIPE LINES 19FLOW METERING EQUIPMENT 19APPURTENANCES 19
OPERATION OF RECHARGE PITS 20
TEMPERATURE-TURBIDITY LIMITS 20FILTERING MEDIA 20ARTIFICIAL RECHARGE WITH ONE PIT 20
Fi r s t Season, 1951-1952. . 20Second Season, 1952-1953 21Third Season, 1953-1954 22Fourth Season, 1954-1955 22Fifth Season, 1955-1956 23Summer Operation, 1956 23
PIT NO. 2 AND RECHARGE WITH TWO PITS 23
Sixth Season, 1956-1957 23Seventh Season, 1957-1958 24Eighth Season, 1958-1959 24
DISCUSSION OF RECHARGE OPERATION 24
FACTORS INFLUENCING RECHARGE 25
Filter Media 25Size and Shape of Pits 26River Stage 28Silt Removal 28Turbidity of River Water 29Other Operational Difficulties 31

CONTENTS (continued)
Page
FACTORS INFLUENCING GROUND WATER 31
River Stages 31Precipitation 31Temperature of Recharge Water 31Mineral Quality 35Quantity of Recharge 35
ARTIFICIAL, GROUND-WATER RECHARGE BY INDUSTRIES 35
BEMIS BRO. BAG COMPANY 35
PEORIA WATER WORKS COMPANY 43
COST OF EXPERIMENTAL ARTIFICIAL RECHARGE 43
CONCLUSIONS 45
REFERENCES 47

ILLUSTRATIONS
Figure Page
1 Location of major well fields in Peor ia 10
2 Location of first artificial recharge experiment 11
3 Effects of first artificial recharge on ground-water levels 13
4 Dissolved oxygen values in Illinois River at Peor ia , 1936-1957 16
5 Biochemical oxygen demand values in Illinois River at Peor ia , 1936-1957 17
6 Proposed designs for Water Survey recharge pit 18
7 Profile through recharge pit 20
8 Design of control tower 21
9 Cleaner for recharge pit 22
10 Proposed recharge pits at gas holder property 24
11 Layout of filter samples for pit No. 2, 1956-195 7 24
12 Layout of filter samples for pit No. 1, 1957-1958 26
13 River stages and daily infiltration rates in pi ts , 1956-1957 27
14 River stages and daily infiltration rates in pits, 1957-1958 27
15 River stages and daily infiltration rates in pi ts , 1958-1959 28
16 Ground-water elevations near pits 29
17 Water elevations in r iver and wells at Peoria 30
18 Precipitation, pumpage, artificial recharge, and water elevations in r iver and
Central Well Field 32
19 Ground-water surface profile along Illinois River valley, 1933 36
20 Ground-water surface profile along Illinois River valley, October 1951 to April 1952 . . 36
21 Ground-water surface profile along Illinois River valley, October 1952 to May 1953 . . 36
22 Ground-water surface profile along Illinois River valley, October 1953 to May 1954 . . 37
23 Ground-water surface profile along Illinois River valley, November 1954 to May 1955 . 37
24 Ground-water surface profile along Illinois River valley, November 1955 to May 1956 . 37
25 Ground-water surface profile along Illinois River valley, September 1956 to May 1957 . 38
26 Ground-water surface profile along Illinois River valley, September 1957 to May 1958 . 38
27 Ground-water surface profile along Illinois River valley, October 1958 to May 1959. . . 38
28 Ground-water surface profile across Illinois River valley, 1933 39
29 Ground-water surface profile across Illinois River valley, October 1951 to April 1952 . 39
30 Ground-water surface profile across Illinois River valley, October 1952 to May 1953. . 39
31 Ground-water surface profile across Illinois River valley, October 1953 to May 1954. . 40
32 Ground-water surface profile across Illinois River valley, November 1954 to May 1955. 40

ILLUSTRATIONS (continued)
Figure Page
33 Ground-water surface profile across Illinois River valley, November 1955 to May 1956. 40
34 Ground-water surface profile across Illinois River valley, September 1956 to May 1957. 41
35 Ground-water surface profile across Illinois River valley, September 1957 to May 1958. 41
36 Ground-water surface profile across Illinois River valley, October 1958 to May 1959. . 41
37 Effects of recharge at Bemis Bro. Bag Company 42
38 Comparison of pit sizes 44
39 Volume-area curves Water Survey Pit No. 1 44
40 Volume-area curves Water Survey Pit No. 2 45
41 Volume-area curves Bemis Bro. Bag Company pit 45
42 Volume-area curves Peor ia Water Works Company pi t . . 45
TABLES
Table Page
1 Results of recharge tests at gravel pit of Hiram Walker & Sons, Inc 12
2 Days per year available for artificial recharge from Illinois River at Peoria as
limited by temperature and turbidity, 1935-1945 15
3 Par t ia l operating data for all seasons, 1951-1959 25
4 Temperatures observed in ground-water samples from wells near recharge pits . . . . 34
5 Cost of artificial recharge at Peor ia , Illinois 46
7
ABSTRACT
This report summarizes research and demon- variety of major water-using industries. Prior tostration of the pit method of artificial recharge at 1959, most water needs were furnished from thesePeoria and its contribution to solution of the prob- ground-water resources. Since that time treat-lem of declining ground-water levels. Excessive ment facilities have been developed for direct usewithdrawals from the glacial drift aquifer at Peoria of water from the Illinois River.had resulted in progressive decline of the ground-water levels and remedial measures were urgently Described in this report are the types of re-needed. charge pits and operating techniques developed by
the Illinois State Water Survey and those whichGround-water resources at Peoria are devel- were built by local industries. Summaries of
oped from three well fields and must meet the operating records over an eight-year period showdemands of the municipal supply as well as a capacity and cost information.
ARTIFICIAL GROUND-WATER RECHARGE AT PEORIA
by Max Suter and Robert H. Harmeson
INTRODUCTION
The City of Peoria in central Illinois is lo- use may deprive others of their supply. Thecated in an urban area which is rich in water landowner is restricted from unlawful pollution orresources. Included in the area are Peoria, Peoria malicious depletion of the supply. The fact thatHeights, East Peoria, Creve Coeur, and Barton- the well owners of the Peoria area were able toville. The water resources support a population practice self-imposed conservation measures isof approximately 150,000 as well as an industrial a tribute to their cooperative approach to theconcentration of distilleries, breweries, and manu- existing water supply problem. The developmentfacturers of earth-moving equipment, steel prod- and use of artificial recharge, as part of the so-ucts, and chemicals. All these industries use lution to the problem, was delegated to personnellarge volumes of water and many of them require of the Water Survey Division. Although the im-low-temperature water for their processes. mediate objective was relief from the existing
ground-water shortage, the Survey hoped to obtainPopulation growth together with increasing per information on artificial recharge methods and
capita consumption of water, vigorous industrial techniques that could have application in otherdevelopment, and the requirement for low-tempera- areas of the State.ture water contributed to the creation of a watershortage despite the large resources. The IllinoisRiver, which flows through this metropolitan area PURPOSE AND SCOPEwith a minimum recorded flow of 2300 cubic feetper second (cfs), was used only to alimited extent This report is based on the historical andas a source of water, owing to its traditional pollu- technical development of artificial recharge attion and its high temperatures during the summer. Peoria and presents the results obtained fromThe Peoria Water Works Company and most of eight years of operation. Certain theoreticalthe industries used ground water from the local analyses and developments are deferred pendingalluvial and glacial deposits. completion of further laboratory and field re-
search.As a consequence of the ever-increasing de-
mand for low-temperature ground water, the water Undertaking a study of artificial recharge atlevels in well fields receded steadily because Peoria presented certain requirements. The firstpumpage exceeded replenishment by natural re- was an adequate source of water of satisfactorycharge and, by 1940, had reached such an alarming sanitary and chemical quality. In addition, thelevel that the Water Survey Division was requested recharged water must be cool enough not to in-to make a study of the situation. The results of crease substantially the normal ground-waterthis study were published in a bulletin (1) which temperatures. In the industrial areas, wherepresented the geologic, hydrologic, and chemical artificial recharge was most urgently needed,conditions of the local ground-water area; deter- open land for use in recharge operations was ex-mined the over-pumpage of ground water to be tremely limited. Consequently, it was necessarybetween 8 and 10 million gallons per day (mgd); to develop a method of recharge that would giveand demonstrated the need to adopt conservation a high unit rate of inflow, produce economically ameasures and some method of artificial recharge. satisfactory quality of infiltered water, and pro-
vide sufficient accumulation in storage during theGround-water law in Illinois gives exclusive operating season to help meet the pumpage de-
rights for use to the landowner, even though such mands of an entire year.

8
Prior to actual research operations, it wasnecessary to study the literature on ground-waterrecharge methods, examine the operation of ex-isting installations, investigate the suitability ofthe Illinois River as a source of supply, and ex-plore hydrologically and geologically the rechargepotentials of the local area.
ACKNOWLEDGMENTS
Investigations were carried out under the gen-eral administration of William C. Ackermann,Chief, State Water Survey Division and his prede-cessor, Dr. A. M. Buswell. Many members ofthe Division have contributed to the developmentand operation of the Peoria recharge pits. Par-ticular credit is due the personnel of the PeoriaLaboratory who have been involved in various as-pects of the work and have contributed substan-tially in the collation and analysis of the collectedinformation.
Valuable support and assistance in the projecthave come from individuals and organizations inthe Peoria area. Through the efforts of its WaterResources and Flood Control Committee, thePeoria Association of Commerce solicited fundswhich supplemented those of the State and helpedprovide for the construction of the first of theSurvey's two recharge pits. The Association'sWater Conservation Committee drafted and spon-sored a Water Authority Act(2) which was passedby the State Legislature in 1951. The Associationhas shown a continuing interest in solving thearea's water problems and maintains strong sup-port of the recharge project.
Both within and outside the framework of theAssociation, business andindustry have made manycontributions. Survey personnel also have enjoyedan atmosphere of close cooperation with Citygovernment. Communication locally on technicaland practical matters was frequent and effective.
METHODS OF ARTIFICIAL RECHARGE
Artificial recharge of ground water includes anumber of methods by which the rate and theamount of natural infiltration are increased. Inthe broad sense, contour farming and irrigationmight be considered as methods of rechargingexcept that they are primarily intended to increasethe water content of the upper, unsaturated stratafor agricultural use rather than raise the saturatedground-water level.
INDUCED INFILTRATION
Induced infiltration, whereby increased flowfrom natural water bodies is sought by the crea-tion of a negative head through the use of galleriesor horizontal wells, might be classed as artificialrecharge. Induced infiltration does not increasethe amount of ground water in storage, but per-mits a higher than normal rate of withdrawal underfavorable circumstances. Such infiltration cannotitself reverse ground-water recessions by in-creasing the local rate of infiltration and simul-taneously augmenting the ground-water storage.To accomplish both of these aims, it is necessaryto employ one of the following methods of artificialrecharge.
LAN DF LOO DING
Landflooding involves inundating a tract of agri-cultural or waste land, which is bounded by ad-joining hills, dams, or levees. The literaturereports the use of areas varying in size from one-half to more than one thousand acres. The depthof flooding is reported to vary from six inches tosix feet. Some basins are flooded by gravity flowwhile others require pumping, and the water to berecharged may be circulated through the basin orit may be completely stagnant. In many basins,the natural ground surface serves as the bottom,while in others the ground surface is first scari-
fied or treated with a fibrous material. Sincemost landflooding basins are used to capture ex-cess storm water, rates of inflow vary considera-bly and in most cases are reduced substantiallyduring a period of recharge. Initial rates arereported as high as 14.9 feet per day, which isthe height of a column of water filtering into aunit of surface area during twenty-four hours.Generally, the initial rates are five to six feetper day with final rates falling as low as oneinch per day. Average rates of recharge for thismethod are estimated between 0.5 and 1.5 feetper day. Estimation is necessary due to thescarcity of published data.
There seems to be no established practice forthe preparation and maintenance of landfloodingbasins. Some basins are planted with grass; someare stripped of vegetation; and in others the soilis tilled. Nearly all basins require regularlyscheduled periods of reconditioning and mainte-nance. On the basis of published information it isdifficult to generalize on the rate of reduction inrecharge and the frequency with which the basinsmust be reconditioned. The character of the ap-plied water and the soil differ too greatly betweenlocalities to permit such generalizations.
Published data on landflooding indicated thatthis method was not applicable in Peoria, wherethe total yearly quantity of recharge needed wouldaverage 10 mgd. Since recharge could be prac-ticed only during the six coolest months of theyear, it would be necessary to recharge at a rateof 20 mgd, or 61.4 acre feet per day, in orderto obtain the desired total annual amount. At anestimated average rate of one to two feet per day,the landflooding method would have required from30 to 60 acres of space. An area of this sizewas not available in the Peoria industrial sectionwhere recharge was needed.

CHANNELS
Channels, which have been used to an extent inCalifornia and Colorado, require modification ofthe stream channel to increase the wetted stream-bed area. This method was not considered appli-cable in Peoria because land area for suitablechannel modification was not available where therewas an adequate and satisfactory supply of surfacewater for recharge. On the other hand, whereland was available, there was no satisfactorysource of water.
RECHARGE WELLS
Recharge wells and shafts are used to increasethe flow into an aquifer. Some recharge wellshave high capacities, such as those at Louisville,Kentucky, where rates up to 1.7 mgd have beenobtained. However, all of the reports in the litera-ture stipulate that recharge wells must receiveclear water or they will eventually clog. Thereare reports of recharge wells having lost 50 per-cent of their initial capacity in periods of timeas short as. one week to two months. Successfulrecharge wells either receive filtered water orserve as return wells for clear water from cool-ing systems. In the latter case, the returnedwater will, in general, raise the temperature ofthe ground water.
Recharge wells from cooling systems were notconsidered a satisfactory method of recharge inPeoria because of the possibility of raising theground-water temperatures. The cost of filtrationequipment for clarifying river water would haveexceeded the amount of funds available for re-charge research.
RECHARGE PITS
Recharge pits differ from landflooding in thatthe topsoil is removed in the construction of pits,although in some instances the difference is onlynominal. Recharge pits are excavated into thewater-bearing porous material or into bedrockand are usually equipped with a layer of filteringmaterial for protection against silt intrusion ofthe aquifer. Abandoned gravel pits may be usedto save excavation costs.
In Sweden, many recharge pits have been duginto the tops of eskers, which are the local out-wash deposits from moraines. The material form-ing the esker is used as storage space for therecharged water which is eventually extracted bywells around the bottom of the esker. The rateof infiltration in Swedish pits varies from 5 to 53feet per day.
A recharge pit is effective only if the waterin it is at a higher elevation than the surroundingground water. For this reason it is quite oftennecessary to pump water into pits for recharge.
Although construction costs per unit area arehigher for pits as a rule than for landfloodingoperations, pits have a higher rate of inflow and
9
occupy a smaller total area than landflooding in-stallations of comparable capacity.
SELECTION OF METHOD AT PEORIA
During the search for a method of recharge,suggestions were received for using the IllinoisRiver as a means of recharging the aquifer under-lying the industrial section of Peoria (Fig. 1).These suggestions invariably proposed dredgingthe impervious bottom deposits to permit infil-tration from the river through exposed gravel.All such proposals were rejected for a numberof reasons. The extent and thickness of the im-pervious silt deposits were uncertain, but it wasclear that the silt could not be completely dredgedout. Maintenance of exposed, clean gravel wouldhave been virtually impossible due to constantredeposition of silt. In addition, observed dredg-ing operations had shown no apparent effect onthe ground-water levels nearby. No control orcheck could have been exercised over the rate ofrecharge, the temperature of the recharged water,nor the amount of chlorine needed for disinfection.
Selection of the method for artificial rechargeat Peoria was governed by the prevailing localconditions. The need for ground water that is be-low 65 F. required that artificial recharge shouldbe carried on during a limited part of the year inwhich temperatures in the Illinois River wererelatively low. Secondly, because no large landareas were available for use in recharge, andbecause there was a limited period of time availa-ble annually for recharging, the method selectedhad to be capable of high sustained rates of re-charge. It was important that the recharged waterbe transmitted readily to the aquifer and intostorage without risk of substantial loss back tothe river.
Recharge pits were selected as the methodwhich showed the most promise of recharging athigh rates during the periods of low river watertemperatures. Recharge wells were eliminatedfrom consideration because they required highclarity, or treated, water for successful operation,whereas it was assumed that pits could operatesuccessfully using river water carrying normalturbidity loads.
Topographic and hydrologic conditions weresuch that the pit method seemed capable of oper-ating without substantial loss of recharged waterto the river. The ground-water aquifer of theCentral Well Field (Fig. 1) is under a shallowsoil cover and the existing ground-water levelswere 20 to 25 feet below the normal river eleva-tion of 440 feet above mean sea level (m.s.l.) andabout 8 to 13 feet below the bottom of the river.These ground-water levels provided a large stor-age space for refilling before overflow to the rivercould occur. Information was gathered on theamount of natural recharge from the river in orderto estimate the loss of recharge during transmis-sion from the pit to the existing ground-waterlevels, and the loss from storage in the eventground-water levels rose above the river bottomor normal pool stage.

10
FIGURE 1 LOCATION OF MAJOR WELL FIELDS IN PEORIA

11
FIGURE 2 LOCATION OF FIRST ARTIFICIAL RECHARGE EXPERIMENT

12
Available information indicated that there waslittle natural recharge from the Illinois Riverwhen it was at normal stage since the lowestground-water levels were found near the riverand the loss in ground water was progressing ata constant, undiminishing rate. Additional infor-mation obtained during dredging operations gavesupport to this theory of little natural rechargeat normal stage. Test drillings for bridge con,struction showed that the Peoria Lake bottom con-sisted of about 20 feet of clay. During constructionof the McClugage Bridge in 1940, the clay in thelake bottom was found to be so tight that a sampleat two-foot depth contained only 12.5percent water.Tests on three undisturbed samples of this clayindicated permeabilities of 0.6, 0.75, and 1.0 mlper 12 hours against 10 feet of head. These per-meabilities were calculated to yield a maximumnatural recharge of about 1 mgd for the PeoriaLake area.(1) At no time during construction ofthe McClugage Bridge, nor later during dredgingoperations at LeTourneau-Westinghouse and belowthe Franklin Street Bridge, were any increases inwater levels recorded in observation wells nearthe construction sites. Two auger holes of 6 feetand 9-1/2 feet depths, drilled three feet from thepool stage water line at the Water Survey rechargepit construction site, penetrated the silt layer andwere dry. Water, which was splashed into thetwo holes from waves, disappeared through thebottom of the holes within two minutes.
The interpretation of all of this informationindicated that the operation of recharge pits shouldresult in very little loss during transmission ofrecharged water, and that losses from storagewould probably be slight.
TEST OF SELECTED RECHARGE METHOD
A preliminary test was made in 1941 of thepossibilities of recharging the aquifer with riverwater by the pit method. Hiram Walker & Sons,Inc. suggested the test and agreed to provide thenecessary operating personnel, materials, andlaboratory tests, with the Survey providing super-vision and responsibility for collection of hydro-logic data. The test was made in an abandonedgravel pit on Hiram Walker property, which isshown in Figure 1.
A vertical suction, 2500 gallons per minute(gpm), centrifugal pump was mounted on a bargein the river. This pump discharged river waterthrough a 12-inch steel pipeline to the gravel pit.Discharge was metered through an orifice set inthe pipeline. A three percent solution of calciumhypochlorite was applied to the water at an averagerate of 4.5 parts per million (ppm) available chlor-ine. Analyses of the river water had indicatedthat 12 ppm would be required for breakpointchlorination.
To obtain information on the effects of theinfiltration test, the Water Survey installed a staffgage in the gravel pit and drilled three 8-inchobservation wells. These wells were located 430to 450 feet apart at the corners of an approxi-mately equilateral triangle around the pit. Thesewells, and a well of the Pabst Brewing Companylocated upstream at a distance of 2300 feet from
the pit, were equipped with Stevens recording gagesfor continuous measurement of ground-waterlevels. Temperature readings were taken of theriver water as it entered the pit, of the groundwater in the three observation wells, and of wellsbelonging to Hiram Walker & Sons, Inc., Armourand Company, and the Peoria Packing Company.Figure 2 shows locations where observations weremade of the movement of chlorides and bacteriathrough the aquifer.
Recharge was limited to four separate shortperiods in August and September, 1941. This wasnecessary because protracted periods of rechargewould have resulted in raising the ground-watertemperatures above 65°F. The periods of testingwere from August 4 to 9, from August 12 to 14,from August 27 to 30, and from September 10 to12. Testing was frequently interrupted for thepurpose of cleaning snails and debris from theintake screen. The amounts of water rechargedand the chlorine dosage are shown in Table 1,and the effects of the tests on surrounding ground-water levels are shown in Figure 3.
TABLE 1
RESULTS OF RECHARGE TESTS AT GRAVELPIT OF HIRAM WALKER & SONS, INC.
Period Recharge Avg. Chlorination(MG) (ppm)
Aug. 4-9 6.2 4.912-14 5.6 4.827-30 9.1 2.5
Sept. 10-12 6.9 7.6Total 27.8
The results of these four tests indicated ahigh rate of recharge could be expected. Riverwater pumped at 2200 gpm was recharged into agravel area of 3628 square feet, giving a rechargerate of 118.8 feet per day. Due to the short dur-ation of the tests and to the clean gravel used, itwas assumed that this rate could not be main-tained for extended periods of time nor obtainedat all other locations.
The hydrographs of observation wells pre-sented in Figure 3 show the rapidity with whichground-water levels in the immediate area re-sponded to artificial recharge and give an indicationof the area influenced. Water levels in observationwells 1, 2, and 3 began to rise within ten minutesof the start of recharge and continued until re-charge was stopped. The effects of these testson the more distant Pabst well were not so pro-nounced nor so immediately apparent.
At the beginning of the tests on August 4, 1941,the river temperature was at 84°F. and decreasedto 70°F. by September 13. Observed ground-watertemperatures varied between the limits of 56 F.and 66°F. The first and last test periods pro-duced no appreciable increase in ground-watertemperatures. The two intermediate tests raisedthe temperature of the ground water 8 F. and10°F., respectively, in the Armour and Companywell.

FIGURE 3 EFFECTS OF FIRST ARTIFICIAL RECHARGE ON GROUND-WATER LEVELS
13

14
Several tests were made in an attempt to mea-sure the velocity of flow of the recharged waterthrough the ground-water aquifer. On August 12,sacks containing five tons of sodium chloride wereplaced in the pit before starting to recharge.During the test, samples of water collected fromthe three test wells and the Armour and Companywell were analyzed for chloride content. None ofthese analyses indicated the presence of chloridesin excess of the natural content. On August 27,five more tons of sodium chloride were spreadover the bottom of the pit. As soon as rechargestarted, hourly samples were taken from the testwells and continued over a period of six days.The progress of the recharged water, as identifiedby concentration of chlorides, could be detectedreliably only in Survey Test Wells No. 1 and No.3, and to some extent at the wells of Armour andCompany, Calahan and Company, and at the wellon the river bank. These tests with sodium chlor-ide indicated velocities of travel of 200 to 2 75feet per day toward the southwest and 75 to 130feet per day toward the east.
Water from four of the observation wells wasanalyzed for bacterial quality. Of the four, onlythe well at Armour and Company showed that itwas contaminated as a possible result of the re-charge tests. Bacteriological analyses made fromthat well during the tests indicated higher totalplate counts and a greater number of positivepresumptive coliform tests than had been observedprior to recharging.
As a result of these preliminary rechargetests, it was concluded that the pit method wasapplicable at Peoria. It was estimated that therecharge rate which could be continuously main-tained would be approximately 60 feet per dayinstead of the 118.8 feet per day which was ob-served in the brief experiment. It was also as-sumed that the surface of any pits constructedwould have to be covered with a layer of sandfor filtration of the recharged water. The oper-ational difficulties experienced with the river waterpump indicated that the gravity inflow to pitsmight be more desirable. Pretreatment of riverwater by sedimentation was not considered a ne-
cessity as long as limits on temperature andturbidity were observed.
Following the 1941 test of artificial rechargeby the pit method, the Peoria Association of Com-merce employed the consulting engineering firmof Alvord, Burdick, and Howson to make a compre-hensive report on the local ground-water situation.Mr. Burdick's report, presented to the Associationon January 15, 1942, was prepared from informa-tion provided by the State Geological Survey andthe State Water Survey, supplemented by the firm'sexperience with infiltration and landflooding atDes Moines, Iowa. The report recommended im-mediate use of the gravel pit located on the prop-erty of Hiram Walker & Sons, Inc., for artificialrecharge with subsequent acquisition of an addi-tional 200 acres for landflooding operations. Costestimates provided for an investment of $40,000in the pit with a monthly operating cost of $3500.Investment in landflooding was estimated to be$15,000 with a monthly operating cost of $2500.On the basis of production, the pit method wasestimated to cost $11.50 per million gallons andthe proposed landflooding operations $8.25 permillion gallons.
No immediate action followed the Alvord, Bur-dick, and Howson report since the urgency of theground-water situation was partially relieved byseveral seasons of abundant precipitation and highriver stages. Recognizing that the excess pre-cipitation could not continue, the Water Surveyproposed an artificial recharge project on a scalesufficiently large to determine whether or notthis method could economically correct the localground-water problems and provide information ofvalue for use in other areas of the state. TheSurvey's proposal was formalized in a report byJacob A. Harman and J. J. Woltmann on October16, 1945. No definite steps toward artificial re-charge evolved from this report, but studies werestarted on methods of financing such projects. Alater outgrowth of these studies was the approvalby the State Legislature of an Act,(2) sponsoredby the Peoria Association of Commerce, to pro-vide for the establishment of Water Authoritiesand to determine their powers and duties.
PEORIA LABORATORY
In 1947, the legislature provided the WaterSurvey with $250,000 for the construction of alaboratory in Peoria. A site on the river front,north of the Cedar Street Bridge, was acquiredin 1948 and a three-story laboratory and office
building was completed in 1949. This buildingwas constructed for the study of water resourceproblems and contained space and facilities foradministrative, engineering, chemical, and bac-teriological activities.
USE OF ILLINOIS RIVER WATER FOR RECHARGE
QUANTITY OF WATER
Discharge records of the U.S. Geological Surveyindicated that the quantity of water available inthe Illinois River was always greatly in excessof the amount required for recharge. Withdrawalof 20 mgd for recharge would amount to about 1.3percent of the minimum flow of 2300 cfs recordedin 1943.
QUALITY OF WATER
Sanitary quality of the Illinois River had beenthe subject of extensive investigation for morethan 20 years. (3 , 4, 5, 6) Early studies weremade in connection witn the project of the Metro-politan Sanitary District of Greater Chicago todivert sewage and dilute it with water from LakeMichigan. The opening of the Chicago Sanitary
15
TABLE 2
DAYS PER YEAR AVAILABLE FOR ARTIFICIAL RECHARGE FROM ILLINOIS RIVER ATPEORIA AS LIMITED BY TEMPERATURE AND TURBIDITY, 1935-1945
and Shipping Canal in 1900 was the prelude tonumerous periodic and systematic surveys of theIllinois River.
The quality of the river has varied over a widerange since 1900 and has been greatly influencedby the quantities of water diverted from LakeMichigan, by the amount of sewage dischargedfrom Chicago, and by the degree of treatmentgiven to Chicago's sewage.
Until about 1920, the quality of the IllinoisRiver deteriorated despite diversions of as muchas 7400 cfs from Lake Michigan.(7) The steadydevelopment of a sewage treatment program bythe Metropolitan Sanitary District of Greater Chi-cago brought about gradual improvement of thequality of the river despite a decree by the U.S.Supreme Court in 1930, limiting diversion to 1500cfs after 1938.
In order to use Illinois River water for re-charge at Peoria, it was necessary first to de-termine whether its quality was satisfactory andthen to overcome the prejudice of the peopleagainst its use. Results of an investigation bythe United States Public Health Service from 1920to 1922 were among the first in which standardizedmethods of analysis were reported. (8) The Peoriaoffice of the Metropolitan Sanitary District ofGreater Chicago furnished valuable records oftemperature, turbidity, dissolved oxygen, bio-chemical oxygen demand, and ammonia nitrogenanalyses of samples which had been collected overa period of years. Regular bacteriological analy-ses of river samples were made in the laboratoryof the Peoria Water Works Company from 1942until 1950. Following completion of the WaterSurvey's Peoria Laboratory, tests for physical,chemical, and bacteriological quality of the riverwater were performed in this laboratory on samp-les collected at the site.
Temperature and Turbidity
Daily temperature and turbidity data on riverwater were available from 1935. A study(9) ofthese data for the period 1935 to 1945 furnishedan estimate of the time intervals during whichrecharge could be undertaken within arbitrarilyimposed limits on temperature and turbidity. Maxi-
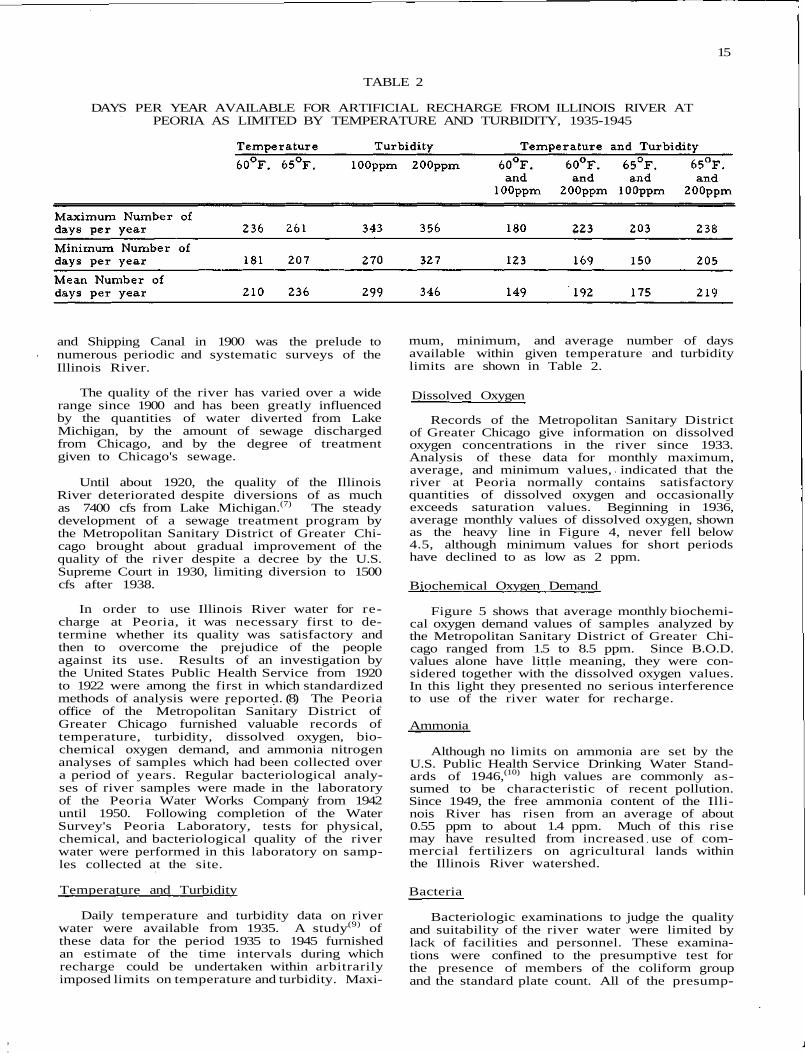
mum, minimum, and average number of daysavailable within given temperature and turbiditylimits are shown in Table 2.
Dissolved Oxygen
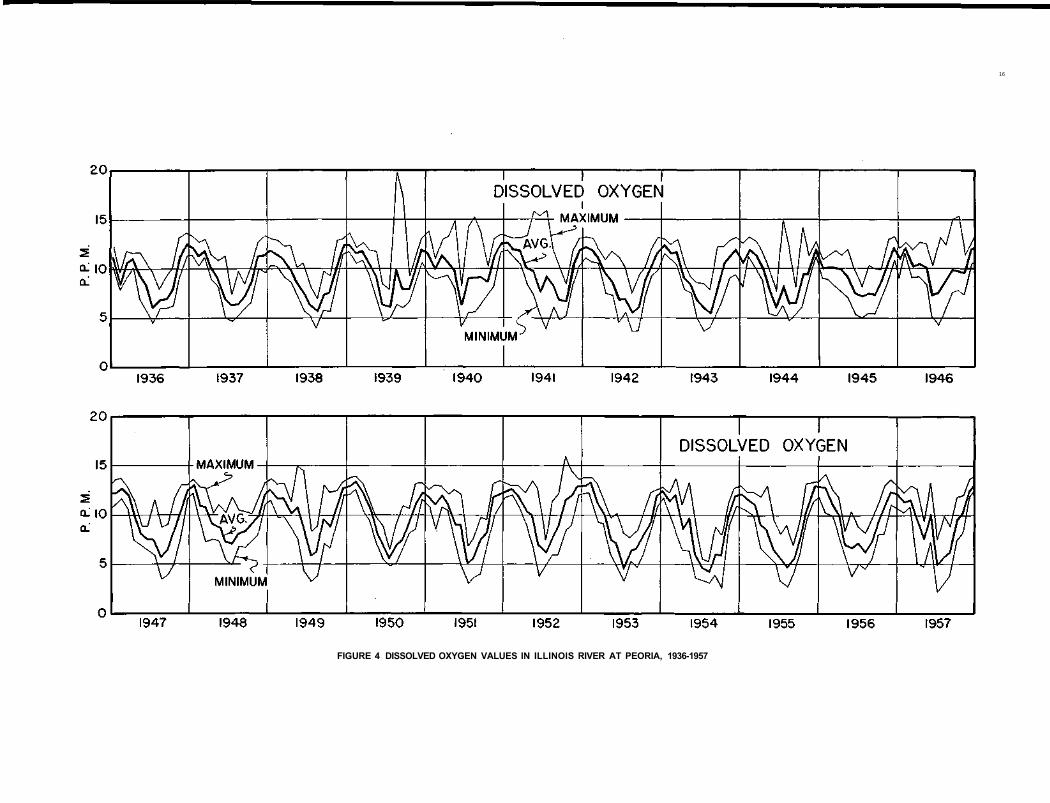
Records of the Metropolitan Sanitary Districtof Greater Chicago give information on dissolvedoxygen concentrations in the river since 1933.Analysis of these data for monthly maximum,average, and minimum values, indicated that theriver at Peoria normally contains satisfactoryquantities of dissolved oxygen and occasionallyexceeds saturation values. Beginning in 1936,average monthly values of dissolved oxygen, shownas the heavy line in Figure 4, never fell below4.5, although minimum values for short periodshave declined to as low as 2 ppm.
Biochemical Oxygen Demand
Figure 5 shows that average monthly biochemi-cal oxygen demand values of samples analyzed bythe Metropolitan Sanitary District of Greater Chi-cago ranged from 1.5 to 8.5 ppm. Since B.O.D.values alone have little meaning, they were con-sidered together with the dissolved oxygen values.In this light they presented no serious interferenceto use of the river water for recharge.
Ammonia
Although no limits on ammonia are set by theU.S. Public Health Service Drinking Water Stand-ards of 1946,(10) high values are commonly as-sumed to be characteristic of recent pollution.Since 1949, the free ammonia content of the Illi-nois River has risen from an average of about0.55 ppm to about 1.4 ppm. Much of this risemay have resulted from increased use of com-mercial fertilizers on agricultural lands withinthe Illinois River watershed.
Bacteria
Bacteriologic examinations to judge the qualityand suitability of the river water were limited bylack of facilities and personnel. These examina-tions were confined to the presumptive test forthe presence of members of the coliform groupand the standard plate count. All of the presump-
16
FIGURE 4 DISSOLVED OXYGEN VALUES IN ILLINOIS RIVER AT PEORIA, 1936-1957

FIGURE 5 BIOCHEMICAL OXYGEN DEMAND VALUES IN ILLINOIS RIVER AT PEORIA, 1936-1957

I118
FIGURE 6 PROPOSED DESIGNS FOR WATER SURVEY RECHARGE PIT

19
tive tests, initially made in the laboratory of the as plate counts as high as 3 million per milliliterPeoria Water Works Company and later in the had been recorded during the early 1920's, laterWater Survey Laboratory, were positive. Standard analyses revealed that the plate counts had sinceplate count results were more encouraging. Where- declined to a much lower value.
PIT NO. 1 AND RECHARGE FACILITIES
In 1949, the Water Survey proposed expenditure of a 12-inch tee. It was then equipped with aof $25,000 in appropriated funds for construction movable flushing ring which is supplied with waterand operation of a research pit with a capacity of under pressure. This ring can be moved up and0.3 mgd. In order to obtain substantial ground- down the screen by means of ropes leading downwater replenishment in addition to experimental from the control room. The ring successfullyand developmental information, the Water Re- cleans the screen except when flow conditionssources and Flood Control Committee of the Peoria are such that velocities through the screen slotsAssociation of Commerce solicited approximately exceed 0.6 feet per second. High velocities bind$ 70,000 from local business and industry with particles of debris very tightly to the screen andwhich to supplement the State's appropriation and wedge small fish into the slots. (11)
to aid in financing construction of a larger re-charge pit. Figure 6 represents comparative FLOW METERING EQUIPMENTproposed sizes of the 0.3 and 2.0 mgd pits.
From the screen, water discharges to Pit No.INTAKE STRUCTURE 1 through a venturi tube and a 12-inch gate valve.
Pressures at the intake and throat of the 12.125-With the exception of a portion of the intake inch by 9.35-inch venturi metering tube are indi-
structure and pipe line, the first pit and its appur- cated by water levels in 2-inch wells locatedtenances were built on the Peoria Laboratory above the intake and throat and are measured byproperty. Inasmuch as the strip of land only compressed air from a small, stationary corn-seven feet wide was available along the river be- pressor through two 1/8-inch copper lines endingtween the harbor line and the Chicago, Rock Island at identical elevations in the wells. The mea-and Pacific Railroad right-of-way, it was necessary sured venturi tube pressure differential is trans-to install the intake structure and valve manhole mitted by air pressure to the Republic flow meterbehind vertical sheet piling. The 16-inch intake recorder and integrator located in the operatingpipe is protected by a coarse, bar rack built in room.the sheet piling. The 1/2-inch by 2-inch bars ofthe rack are spaced two inches on centers. A APPURTENANCES16-inch gate valve is located in the manhole im-mediately behind the sheet piling. The building above the caisson contains the
Everson Type-K, Series-2500 chlorinator, airCONTROL TOWER AND CAISSON compressor, chlorine handling equipment, oper-
ating rooms, pump motor for Pit No. 2, and theFrom the inlet bar rack, a 16-inch transite flow recording and integrating instruments for
pipeline is laid in a 42-inch tunnel underneath the both pits.railroad tracks to the control tower building. The16-inch inlet pipe is wedged in the tunnel to pre- Chlorine is purchased in one-ton cylinders.vent floating and both ends of the tunnel are sealed The scale holds two cylinders, and storage spacewith concrete headers. Location and construction for two additional cylinders is available. Chlorinedetails are shown in Figures 7 and 8. River water is applied to the water in the caisson by gravityentering through the inlet pipe discharges into the • feed through a rubber line terminating below thecontrol tower through a 45-degree cast iron elbow water surface.to maintain circulation in the tower. Invert of theintake pipe is at elevation 435.1 feet. The con- The discharge line from the control tower totrol tower is built in two parts: the lower part Pit No. 1 is a 12-inch transite pipe which termi-consists of a circular, concrete caisson and the nates at the center of the pit in an upturned 90-upper part is a square building containing the degree cast iron elbow. The elevation of the topoperating rooms and equipment. The caisson has face of the elbow is one-half foot below the flooran inside diameter of sixteen feet and a depth of of the caisson in the control tower. A weep holetwenty-two feet, wall thickness of fifteen inches, in the bottom of the discharge pipe provides forand a foundation which is two feet thick. Elevation drainage of the line when the pit is not operating,of the caisson floor is at 432.5 feet. The bottom of Pit No. 1 is a rectangle measuring
62.5 feet by 40 feet and its elevation is 430 feet,PIPE LINES which is 10 feet below controlled pool level in
the adjacent river. Side slopes up to elevationChlorinated water from the caisson flows by 442.0 are two horizontal to one vertical. Between
gravity through a 12-inch transite pipe to Pit No. elevations 442.0 and 460.0 the side slopes are one1. This pipe is laid along the center line of the and one-half horizontal to one vertical. The bottomcaisson and the inlet end was protected from of the pit and side slopes to elevation 442.0 areclogging by a 26-inch length of 1/8-inch slot John- covered with a 6-inch layer of filtering material,son Everdur screen. The screen was difficult to Sand was used during the 1951 to 1954 operatingclean when mounted in the horizontal position, periods but was replaced by 3/8-inch pea graveland it was replaced in a vertical position on top in subsequent seasons.

20
FIGURE 7 PROFILE THROUGH RECHARGE PIT
OPERATION OF RECHARGE PITS
Artificial recharge was started on October 4,1951 using Pit No. 1. At the beginning, and forthe ensuing eight seasons of operation,(12, 13, 14,
15, 16, 17, 18, 19, 20) the operating methods and tech-niques were designed primarily for the collec-tion of basic information.(21, 22) With increasingexperience, it was possible to improve upon themethods and techniques. (23)
TEMPERATURE-TURBIDITY LIMITS
The limits on turbidity and temperature, underwhich recharge could be practiced, were amongfactors that were changed as a result of operatingexperience. During the first season of 1951-1952,the pit was not operated when the river tempera-ture was above 60°F. nor when its turbidity wasgreater than 100 ppm. As a result of this turbiditylimit, it was often necessary to stop rechargingduring freezing weather. The surface of the pitwould then freeze and recharge couldnot be startedagain until the pit had thawed. If the pit couldhave been operated continuously with water havingturbidities higher than 100 ppm it would not havefrozen, but its capacity would have been reducedby the deposition of silt. Comparisons of thereduction in recharge caused by silt depositionwith the loss sustained when the pit was frozenindicated that the latter was probably the morelimiting of the two. Eventually, no upper limiton turbidity of river water was observed andoperation was carried on continuously.
FILTERING MEDIA
At the beginning of each of the first threeseasons of operation, a 6-inch layer of clean sand,having an effective size of 0.3 to 0.4 mm and auniformity coefficient of 2.0, was placed in thepit to serve as the filtering media. During thefirst season this sand was clogged rapidly by thesilt in the river water and the amount of rechargedecreased by as much as 60 percent within threemonths time. Because of the reduced infiltrationcapacity, the dirty sand was removed and replacedwith clean sand. Replacement of the sand re-vealed that the original soil material in the bottomof the pit had been tightly compacted by the bull-dozer used during construction. This compactedlayer was blasted before the clean sand was in-stalled.
ARTIFICIAL RECHARGE WITH ONE PIT
First Season. 1951-1952
The first season of recharge lasted from Oc-tober 4, 1951 to April 28, 1952. Within this period,258.7 million gallons of river water were re-charged during 146 operating days. The pit wasinoperative owing to high turbidity of the riverwater, freezing of the pit, or for purposes ofcleaning on 62 days, or 30 percent of the operatingseason.
There were four periods during which the riverstage was four or more feet above normal pool

21
FIGURE 8 DESIGN OF CONTROL TOWER
stage. Each of these periods lasted for more stage. The sand filtering media was neitherthan 15 days and each had decided influence on cleaned nor replaced during the entire season.the artificial recharge. In each case the recharge The Johnson well screen protecting the 12-inchrate was increasedalthoughnot in a mathematically line from the control tower caisson to the pit,consistent ratio to the increase in wetted infil- clogged frequently and was difficult to clean intration surface in the pit. The river was one the horizontal position in which it was installed.foot or more above pool level for 101. days and Since no limit on turbidity of the river was ob-reached a stage of 7.1 feet above pool level in served, a much heavier load of silt was carriedboth March and April. The limit of one foot or into the pit and deposited on the surface of themore above pool is used because variations in filtering sand.the levels of ± 6 inches occur regularly due toflow changes, as the level is held constant at The effects of applying highly turbid waterHenry, about 40 miles above Peoria. In winter, upon the pit were varied. Reduction of rechargevariations of +1 foot occur when the river level by deposition of silt from water with turbiditiesis intentionally changed to break the ice cover. less than 100 ppm amounted to between three andTherefore, only levels of one foot or more can be ten percent per month. Turbidities over 100 ppmattributed unconditionally to flood occurrences. caused different effects, depending to some extent
upon the type of material producing turbidity inSecond Season, 1952-1953 the river. During a 9-day period in November-
December, 1952, turbidity in the river was highIn the second season of operation, the pit was reaching a value of 235 ppm and resulting in a 30
used continuously without any cleaning of the sand percent reduction in recharge. In February, 1953,filter. The calendar period of operation was from turbidity rose to 160 ppm during a 5-day periodOctober 13, 1952, to May 13, 1953, during which and resulted in a 16 percent reduction of recharge.time 214.6 million gallons were recharged in In March, 1953, turbidities reached 280 ppm over208.75 operating days. No limit on river water a 12-day period, but the resulting reduction inturbidity was observed with the result that the recharge was only seven percent. Turbiditiespit was inoperative for only 1.7 percent of the during the first two periods were due to highperiod of operation. The average recharge rate winds which stirred up very fine, slow-settling,was lower than that of the first year, and its re- bottom deposits of Peoria Lake, whereas turbidityduction was attributed to several factors. The occurring in the last period was from materialriver was one foot or more above pool stage for washed into the river by runoff from rainfall.only 13 days during the second season and did These observations indicated that the size andnot exceed a maximum of 2.6 feet above pool type of material causing high turbidities seem to
22
have greater effects upon reduction of rechargecapacity than the relative concentration of tur-bidity.
Tests made with a commercial swimming poolsuction cleaner indicated silt could be removedfrom the top of the filtering sand layer with theresult that the recharge rate was increased fora short period of time. Unfortunately the suctioncleaner removed some sand as well as the ac-cumulated silt. When recharge was terminated,measurements of the silt in the sand layer indi-cated very little penetration.
Third Season, 1953-1954
The third operating season was continuous withno replacement of the sand filtering media. Withrecharge conducted between October 26, 1953, andMay 17, 1954, the actual operating time amountedto 199.25 days. Total amount of water rechargedwas 208.2 million gallons, giving an average rateof 1.05 million gallons per operating day. Averagerecharge rates varied from a maximum of 1.95mgd to 0.8 mgd from the beginning to the end ofthe season.
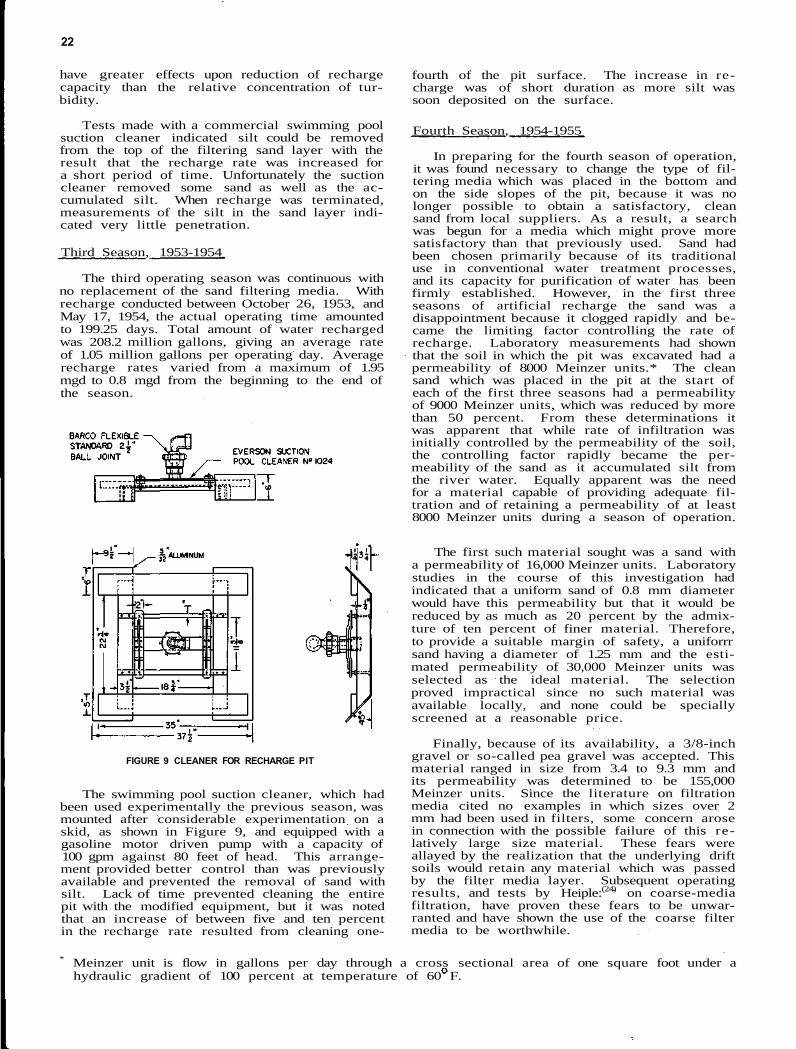
FIGURE 9 CLEANER FOR RECHARGE PIT
The swimming pool suction cleaner, which hadbeen used experimentally the previous season, wasmounted after considerable experimentation on askid, as shown in Figure 9, and equipped with agasoline motor driven pump with a capacity of100 gpm against 80 feet of head. This arrange-ment provided better control than was previouslyavailable and prevented the removal of sand withsilt. Lack of time prevented cleaning the entirepit with the modified equipment, but it was notedthat an increase of between five and ten percentin the recharge rate resulted from cleaning one-
fourth of the pit surface. The increase in re-charge was of short duration as more silt wassoon deposited on the surface.
Fourth Season, 1954-1955
In preparing for the fourth season of operation,it was found necessary to change the type of fil-tering media which was placed in the bottom andon the side slopes of the pit, because it was nolonger possible to obtain a satisfactory, cleansand from local suppliers. As a result, a searchwas begun for a media which might prove moresatisfactory than that previously used. Sand hadbeen chosen primarily because of its traditionaluse in conventional water treatment processes,and its capacity for purification of water has beenfirmly established. However, in the first threeseasons of artificial recharge the sand was adisappointment because it clogged rapidly and be-came the limiting factor controlling the rate ofrecharge. Laboratory measurements had shownthat the soil in which the pit was excavated had apermeability of 8000 Meinzer units.* The cleansand which was placed in the pit at the start ofeach of the first three seasons had a permeabilityof 9000 Meinzer units, which was reduced by morethan 50 percent. From these determinations itwas apparent that while rate of infiltration wasinitially controlled by the permeability of the soil,the controlling factor rapidly became the per-meability of the sand as it accumulated silt fromthe river water. Equally apparent was the needfor a material capable of providing adequate fil-tration and of retaining a permeability of at least8000 Meinzer units during a season of operation.
The first such material sought was a sand witha permeability of 16,000 Meinzer units. Laboratorystudies in the course of this investigation hadindicated that a uniform sand of 0.8 mm diameterwould have this permeability but that it would bereduced by as much as 20 percent by the admix-ture of ten percent of finer material. Therefore,to provide a suitable margin of safety, a uniforrrsand having a diameter of 1.25 mm and the esti-mated permeability of 30,000 Meinzer units wasselected as the ideal material. The selectionproved impractical since no such material wasavailable locally, and none could be speciallyscreened at a reasonable price.
Finally, because of its availability, a 3/8-inchgravel or so-called pea gravel was accepted. Thismaterial ranged in size from 3.4 to 9.3 mm andits permeability was determined to be 155,000Meinzer units. Since the literature on filtrationmedia cited no examples in which sizes over 2mm had been used in filters, some concern arosein connection with the possible failure of this re-latively large size material. These fears wereallayed by the realization that the underlying driftsoils would retain any material which was passedby the filter media layer. Subsequent operatingresults, and tests by Heiple:(24) on coarse-mediafiltration, have proven these fears to be unwar-ranted and have shown the use of the coarse filtermedia to be worthwhile.
* Meinzer unit is flow in gallons per day through a cross sectional area of one square foot under ahydraulic gradient of 100 percent at temperature of 60 F.

With the pea gravel installed, the pit was oper-ated for 165.2 days during the period betweenNovember 8, 1954, and May 11, 1955. The pitwas inoperative several times for the sole pur-pose of inspecting the condition of the pea gravelfilter media. A total of 365.02 million gallons ofwater was recharged which gave an average dailyoperating rate of 2.21 million gallons.
This increase in average rate of recharge overthat of 1.05 mgd for the preceding season couldnot be credited entirely to the use of pea gravel.There were 59 days during which the river wasmore than 1.0 foot, and as much as 3.8 feet abovepool stage. These high river stages were re-flected in the increased recharge rates in the pit.The pea gravel was given several partial and twocomplete cleanings with the suction cleaner, andeach was followed by a slight increase in recharge.
Evidence was found indicating that the peagravel functioned satisfactorily without excessivepenetration of silt. After two weeks of operationa thin blanket of silt formed over the top of thegravel. After two months of operation the bottomtwo inches of the 6-inch gravel layer were stillpractically clean and more than ninety percent ofthe silt was accumulated in a surface layer andthe upper two inches of gravel.
At the end of the season, the thickness of thesilt blanket had increased to about two inches.Determinations were then made of the silt con-centration per unit volume of material in the top,middle, and bottom 2-inch layers of the gravel.The top 2-inch layer of gravel contained 16.3 gmof dry, fine material per 100 ml volume of gravel,whereas only 6.8 gm of fine material per 100 mlvolume were found in the bottom layer. All ofthe fine material was such that it passed througha 40-mesh screen.
Fifth Season. 1955-1956
During the period between November 1, 1955and May 16, 1956, the pit was in operation for195.81 days and 422.63 million gallons were re-charged. Average recharge for this entire periodwas 2.16 mgd. The decline in average rate belowthat of the preceding year was attributed to lowerriver and pit stages.
Summer Operation. 1956
Temperature readings taken in observationwells throughout the Central Well Field had indi-cated the average ground-water temperatures didnot exceed 52 to 55 F. during recharge withriver water having temperatures of 60°F. or less.Since much of the industry in the well field canoperate using water at temperatures as high as60 F., the average ground-water temperatures of52°F. to 55°F. suggested the possibility of re-charging during a greater length of time eachseason without too great a rise in the tempera-ture of the ground water. Therefore the pit wasoperated from July 12 to August 10 in order tostudy the effects of recharging with warm water.
During the test period, 65.93 million gallonsof river water were recharged at an average rateof 2.27 mgd.1 The filter gravel was not cleanedat the end of the preceding winter season and had
23
not been replaced. The only preparation giventhe pit was the removal of all plant growth fromthe surface to be submerged. In spite of thesilted condition of the filter gravel, the averagedaily recharge rate was slightly above that of theprevious winter season.
Throughout this test the level of the river waswithin a few inches of normal pool stage. Turbidityin the river was less than 100 ppm and, with theexception of the first four operating days, wasalways less than 75 ppm. River temperaturesrose an average of 0.21 F. per day from 76 F.to a maximum of 82 F.
Clogging of the screens by minnows and of thepit surface by algae growth were the most seriousoperating problems. Copper sulfate was appliedto the river water at a rate of 20 pounds per dayto control algae growths. The rate of rechargewas reduced from about 2.5 mgd at the start to2.0 mgd at the end of the test due to the inter-ference by minnows and algae.
As a result of the summer recharge test, itwas concluded that temperature limitations couldbe relaxed, and subsequently recharge was prac-ticed with water temperatures as high as 65 F.without raising ground-water temperatures abovethose required for industrial operations.
PIT NO. 2 AND RECHARGE WITH TWO PITS
Sixth Season. 1956-1957
Pit No. 2 was constructed in 1956 on leasedproperty adjoining the Peoria Laboratory. Con-sideration was given to the alternatives of Project"A" which provided for construction of an addi-tional, separate pit, and to Project "B" whichplanned for an extension of Pit No. 1. Both areshown in Figure 10. An extension of the existingpit would have increased the total amount of arti-ficial recharge but would not have resulted insignificant changes in the rate or efficiency.Therefore, another pit of different design wasconstructed in the hope of gaining more efficiencyof operation as well as information on interferencebetween two adjacent pits.
The second pit was constructed with a rec-tangular bottom measuring 75 feet by 20 feet atelevation 435.0. Side slopes from the bottom toelevation 445.0 are three horizontal to one verti-cal, and from elevation 445.0 to 460.0 are twohorizontal to one vertical. The size and shape ofthis pit were chosen partly to fit the dimensionsof the available land area and partly to provide ahigher percentage of wetted surface area in theside slopes per foot of water depth.
Water is pumped from the control tower to PitNo. 2 through a 12-inch transite pipeline by asingle stage, 3 mgd, vertical mixed-flow propellerpump. Pumpage is measured by a Ratosleevemeter. The pipeline swings in a 75-foot arcaround Pit No. 1 and terminates in an upturnedelbow on the bottom of Pit No. 2 at an elevationof 436.3 feet. Water stages in both pits, in thecontrol tower caisson, and in the river are readfrom gage boards calibrated in tenths of feet.

24
FIGURE 10 PROPOSED RECHARGE PITS AT GAS HOLDER PROPERTY
The second pit was operated from September26, 1956, until May 25, 1957. Pit No. 1 was notstarted until October 16, 1956 and was stopped onMay 25, 1957. Together the two pits recharged1.08 billion gallons. Pit No. 1 recharged at anaverage rate of 1.76 mgd over a period of 210operating days for a total of 3 70 million gallons.Pit No. 2 recharged at an average rate of 2.99mgd during 235 operating days for a total of 710million gallons.
This sixth season of operation was started withclean pea gravel in the two pits. Both were oper-ated for the entire season without any type ofcleaning being given to the gravel in order toobtain information on the reduction of capacityby silt deposition.
Three observation wells were drilled betweenthe pits along a line intersecting the two. Thesewells were equipped with water-level recordingdevices and used to observe possible interferencebetween the pits.
Seventh Season, 1957-1958
A few days before the start of the seventhseason of operation, the silt, which had accumu-lated on the surface of the pea gravel during the1956-1957 season, was raked down into piles inthe bottom of each pit. Removing plant growthand raking the pea gravel were the only treat-ments used in preparation for the seventh season.The decision to operate the pits for a second sea-
son without cleaning or replacing the pea gravelwas made for the purpose of comparing the rela-tive economy of different operating conditions.
Pit No. 1 was in operation for a period of213.12 days, during which 359.21 million gallonswere recharged. Pit No. 2 was operated for215.71 days during which it recharged 607.57million gallons. Thus the average recharge ratesfor Pits No. 1 and 2 were 1.69 and 2.82 mgd,respectively, and the seasonal recharge totaled966.78 million gallons. This quantity of rechargewas extremely gratifying since this was the secondseason of operation without replacing the filteringgravel.
Eighth Season, 1958-1959
Because the silting of the pea gravelhad causedfar less reduction of inflow than expected, thepits were again operated without cleaning or re-placing the pea gravel. In addition to determiningwhat effects the dirty gravel had on the sustainedrecharge rate, information was sought regardingthe limits of silt saturation, or penetration, inthe filter media layer. Pit No. 1 was operatedfor a period of 199.79 days at an average rateof 1.74 mgd. Pit No. 2 was operated for 197.26days at an average rate of 2.87 mgd. The sea-son's total of 915.32 million gallons was the resultof recharging 347.81 million gallons in Pit No. 1and 567.51 million gallons in Pit No. 2.
DISCUSSION OF RECHARGE OPERATION
Partial operating data for all seasons is shownin Table 3, which summarizes briefly the resultsof eight years of recharge.
FIGURE 11 LAYOUT OF FILTER SAMPLES FOR PIT NO. 2, 1956-1957

25
TABLE 3
PARTIAL OPERATING DATA FOR ALL SEASONS, 1951-1959
Superscript Numbers: 1 - Sand used as a filter media, cleaned and changed each season2 - Sand changed once during operating season3 - Clean gravel used as filter media4 - Dirty gravel used as filter media5 - Summer operating season
FACTORS INFLUENCING RECHARGE them was under conditions identical to that throughthe 3/8-inch pea gravel. At the end of the season
Filter Media the test samples were analyzed for penetration ofsilt. These tests gave no conclusive determina-
Previous discussion has indicated some of the tion of filtration efficiency but indicated that filteradvantages and disadvantages in the use of differ- media of sizes larger than five-eighths inch willent types of filter media. The sand which was permit more penetration of silt with a consequentused in the first three seasons served effectively concentration in the lower layers.as a filter but this advantage was practically nulli-fied by its rapid clogging with silt. When the Samples of the pea gravel filtering materialsand was dirty, its permeability was a major fac- were taken at the end of each of the last threetor in confining recharge to relatively low rates. seasons and examined for the amount of silt inThe trial of a coarser filter media revealed that them. Samples were taken in several locationshigher permeabilities could be maintained together and from the top, middle, and bottom 2-inch layerswith effective filtration. of the pea gravel. The silt from a 200 ml volume
of each of these samples was washed from theThe possible use of filtering materials coarser gravel with distilled water and dried and weighed.
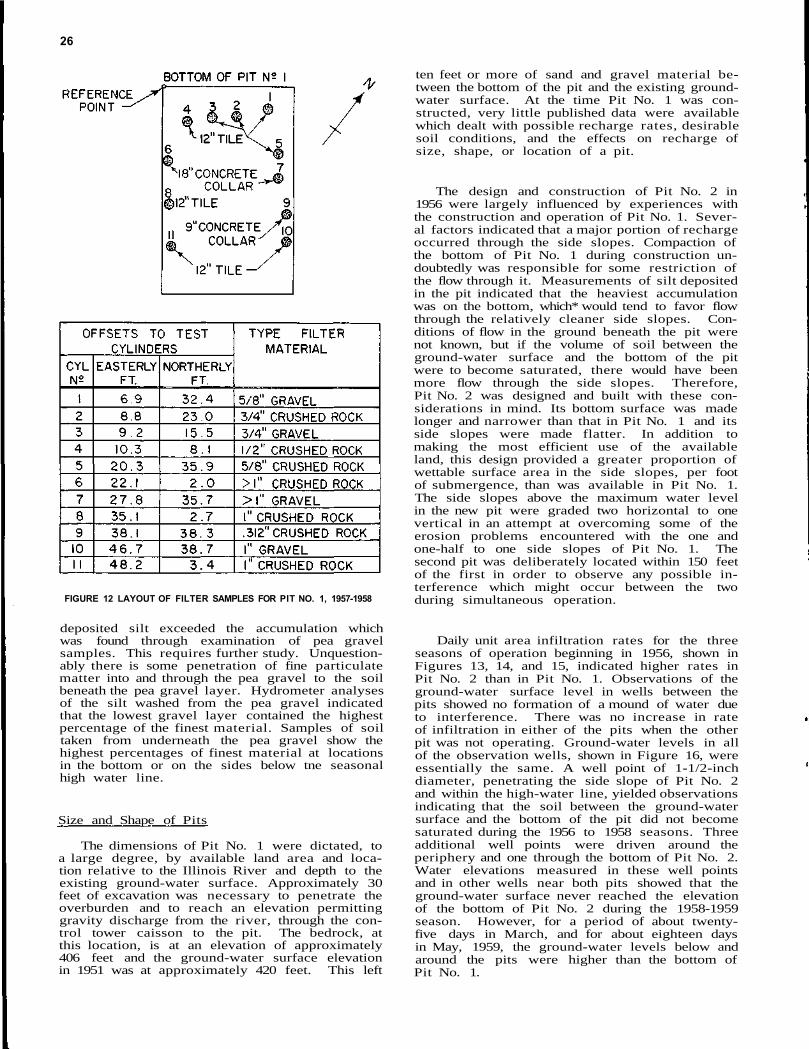
than the 3/8-inch gravel was studied during the Results of these determinations indicated the ac-1956-1957 and 1957-1958 seasons. In those peri- cumulation of silt in the pea gravel to be 2.28,ods, samples of gravel and broken limestone in 5.8, and 12.1 pounds per cubic foot in Pit No. 1graded sizes from three-eighths inch to more from May, 1957, to May, 1959. In Pit No. 2 thethan one inch were placed in short tile rings of concentrations found were 5.45, 8.6, and 9.8 pounds12- to 19-inch diameters in the bottom of the two per cubic foot for the three consecutive seasons.pits, at the locations shown in Figures 11 and 12. Attempts were made to relate the amount of siltThe tile rings, containing the material to be tested, accumulated on the surface and within the peawere set in the bottom of the pit so that the top gravel, to the theoretical amount calculated fromedge was even with the surface elevation of the daily recharge records and turbidity measure-pea gravel, and the flow of recharged water through ments. In all cases the theoretical amount of
26
FIGURE 12 LAYOUT OF FILTER SAMPLES FOR PIT NO. 1, 1957-1958
deposited silt exceeded the accumulation whichwas found through examination of pea gravelsamples. This requires further study. Unquestion-ably there is some penetration of fine particulatematter into and through the pea gravel to the soilbeneath the pea gravel layer. Hydrometer analysesof the silt washed from the pea gravel indicatedthat the lowest gravel layer contained the highestpercentage of the finest material. Samples of soiltaken from underneath the pea gravel show thehighest percentages of finest material at locationsin the bottom or on the sides below tne seasonalhigh water line.
Size and Shape of Pits
The dimensions of Pit No. 1 were dictated, toa large degree, by available land area and loca-tion relative to the Illinois River and depth to theexisting ground-water surface. Approximately 30feet of excavation was necessary to penetrate theoverburden and to reach an elevation permittinggravity discharge from the river, through the con-trol tower caisson to the pit. The bedrock, atthis location, is at an elevation of approximately406 feet and the ground-water surface elevationin 1951 was at approximately 420 feet. This left
ten feet or more of sand and gravel material be-tween the bottom of the pit and the existing ground-water surface. At the time Pit No. 1 was con-structed, very little published data were availablewhich dealt with possible recharge rates, desirablesoil conditions, and the effects on recharge ofsize, shape, or location of a pit.
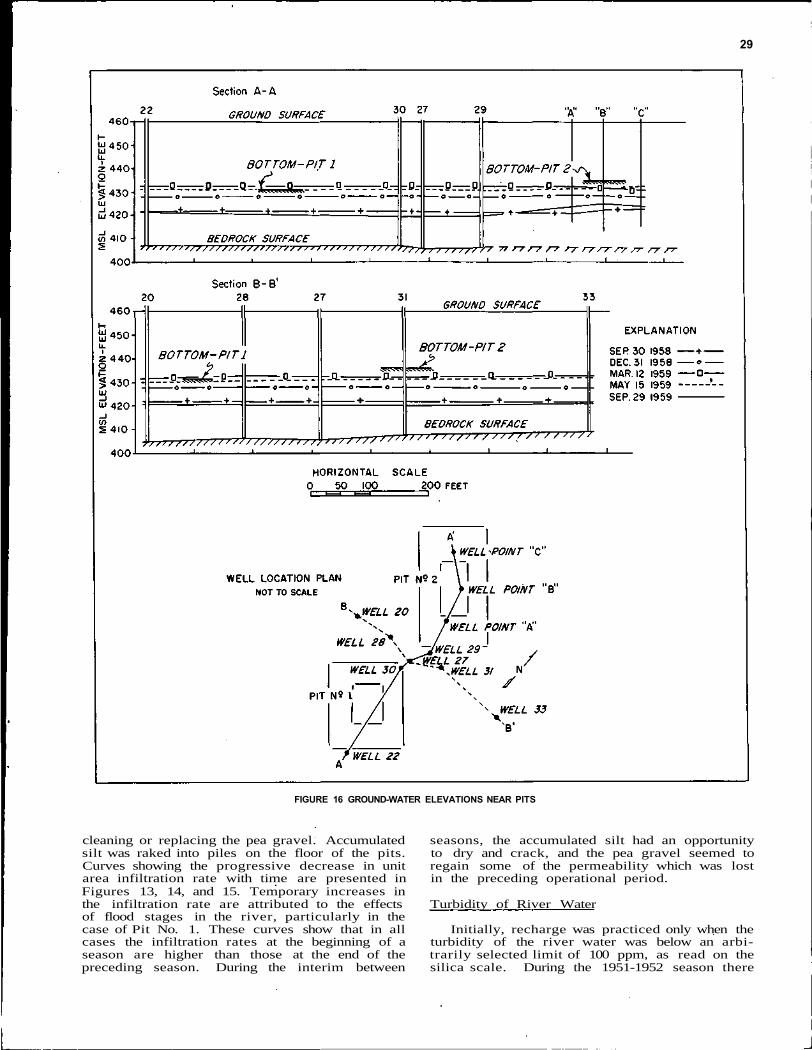
The design and construction of Pit No. 2 in1956 were largely influenced by experiences withthe construction and operation of Pit No. 1. Sever-al factors indicated that a major portion of rechargeoccurred through the side slopes. Compaction ofthe bottom of Pit No. 1 during construction un-doubtedly was responsible for some restriction ofthe flow through it. Measurements of silt depositedin the pit indicated that the heaviest accumulationwas on the bottom, which* would tend to favor flowthrough the relatively cleaner side slopes. Con-ditions of flow in the ground beneath the pit werenot known, but if the volume of soil between theground-water surface and the bottom of the pitwere to become saturated, there would have beenmore flow through the side slopes. Therefore,Pit No. 2 was designed and built with these con-siderations in mind. Its bottom surface was madelonger and narrower than that in Pit No. 1 and itsside slopes were made flatter. In addition tomaking the most efficient use of the availableland, this design provided a greater proportion ofwettable surface area in the side slopes, per footof submergence, than was available in Pit No. 1.The side slopes above the maximum water levelin the new pit were graded two horizontal to onevertical in an attempt at overcoming some of theerosion problems encountered with the one andone-half to one side slopes of Pit No. 1. Thesecond pit was deliberately located within 150 feetof the first in order to observe any possible in-terference which might occur between the twoduring simultaneous operation.
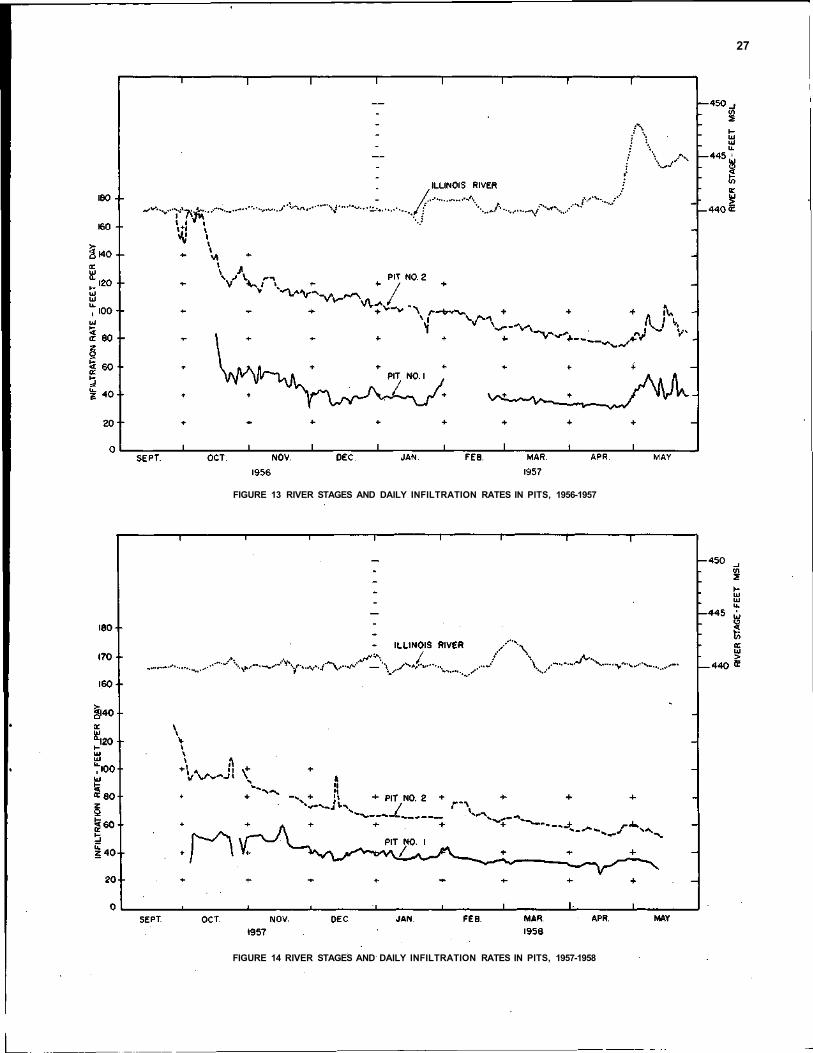
Daily unit area infiltration rates for the threeseasons of operation beginning in 1956, shown inFigures 13, 14, and 15, indicated higher rates inPit No. 2 than in Pit No. 1. Observations of theground-water surface level in wells between thepits showed no formation of a mound of water dueto interference. There was no increase in rateof infiltration in either of the pits when the otherpit was not operating. Ground-water levels in allof the observation wells, shown in Figure 16, wereessentially the same. A well point of 1-1/2-inchdiameter, penetrating the side slope of Pit No. 2and within the high-water line, yielded observationsindicating that the soil between the ground-watersurface and the bottom of the pit did not becomesaturated during the 1956 to 1958 seasons. Threeadditional well points were driven around theperiphery and one through the bottom of Pit No. 2.Water elevations measured in these well pointsand in other wells near both pits showed that theground-water surface never reached the elevationof the bottom of Pit No. 2 during the 1958-1959season. However, for a period of about twenty-five days in March, and for about eighteen daysin May, 1959, the ground-water levels below andaround the pits were higher than the bottom ofPit No. 1.
27
FIGURE 13 RIVER STAGES AND DAILY INFILTRATION RATES IN PITS, 1956-1957
FIGURE 14 RIVER STAGES AND DAILY INFILTRATION RATES IN PITS, 1957-1958

28
FIGURE 15 RIVER STAGES AND DAILY INFILTRATION RATES IN PITS, 1958-1959
River Stage Silt Removal
The effects of variations in river stage and Deposited silt was removed from the pits byfloods on recharge are difficult to analyze and, in two general methods: either by using the swim-addition, differ for the two pits. Because Pit No. ming pool suction cleaner during the operating1 is gravity fed, it responds strongly and readily period, or by removing the dirty filtering layerto high river stages. Flow into Pit No. 2 is rela- and replacing it with clean material.tively constant since water is pumped into it.Slight variations in the second pit are due to Removal of the silt with the suction cleanerchanges in head on the pump and condition of the resulted in small increases in the infiltration ratescreen. During high water the increased re- which lasted for short periods. The cleaner re-charge in Pit No. 2 is reflected by a lowering of moved only part of the surface layer of silt. Inthe water level in the pit which represents in- addition, the cleaning process was both laboriouscreased inflow per unit area. Other factors such and tedious. At least two men were required toas turbidity of the river water, degree of silt operate the suction pump and to control the longdeposition in the pits, and season of the year in- ropes with which the cleaner was dragged backfluence the amount and rate of recharge, but vari- and forth over the pit surface. During most ofations in these factors were not as closely observed the winter months, formation of a thick ice crustas river and pit stages. on the water prohibited use of the cleaning equip-
ment.For the three seasons, during which both pits
were operating (Figs. 13, 14, 15), comparison is Removal of the dirty filtering media and re-made of the daily values of river stages and unit placement with clean material was always effectivearea infiltration rates. These figures show the in raising the infiltration rate. During the firstreactions which the flood stages in the river had seasons of operation, when sand was used ason the infiltration rates in the pits. In Pit No. 1 filtering material, the recharge rates diminishedboth the unit area infiltration rate and the pit rapidly with the accumulation of silt. The reduc-stage, which is not shown in the figures, were tion was so great in the first season that the sandincreased by river flood stages in 1956-1957 and was removed and replaced during the winter.again in 1958-1959. Since Pit No. 1 is gravity- Loss of recharge rate was much slower whenfed, the increase in depth of water during flood pea gravel was used as the filtering media.stages of the river is to be expected due to theincreased head. During these river flood stages, During the summer of 1956, Pit No. 2 wasPit No. 2 did not show greater than normal in- constructed and clean pea gravel was placed increase in depth although there were increases in it and in Pit No. 1. The two pits were then oper-the infiltration rates. ated for the next three successive seasons without
29
FIGURE 16 GROUND-WATER ELEVATIONS NEAR PITS
cleaning or replacing the pea gravel. Accumulated seasons, the accumulated silt had an opportunitysilt was raked into piles on the floor of the pits. to dry and crack, and the pea gravel seemed toCurves showing the progressive decrease in unit regain some of the permeability which was lostarea infiltration rate with time are presented in in the preceding operational period.Figures 13, 14, and 15. Temporary increases inthe infiltration rate are attributed to the effects Turbidity of River Waterof flood stages in the river, particularly in thecase of Pit No. 1. These curves show that in all Initially, recharge was practiced only when thecases the infiltration rates at the beginning of a turbidity of the river water was below an arbi-season are higher than those at the end of the trarily selected limit of 100 ppm, as read on thepreceding season. During the interim between silica scale. During the 1951-1952 season there

FIGURE 17 WATER ELEVATIONS IN RIVER AND WELLS AT PEORIA
were only 26 days on which the turbidity of theriver water was over 100 ppm. However, thepit was inoperative for a total of 62 days, andconsequently the pit was inoperative on 36 daysdue to reasons other than the turbidity. Whenoperation ceased during cold weather, the surfaceof the sand froze and this condition accounted formost of the 36-day period.
In the second season, 1952-1953, no limit onriver water turbidity was observed. As a re-sult of recharging with more turbid river water,the average recharge rate per operating day wasdecreased by approximately 40 percent, and thetotal quantity recharged for the season was 19percent less than during the first year.
The reductions in both total recharge and dailyoperating rate due to silt were considerably lessfrom one season to the next when pea gravel wasused. A comparison of the operating data inTable 3 for the three seasons from 1956 to 1959,when there was no interruption for periods ofhigh turbidity, shows that the reductions in dailyoperating recharge rates which can be related toturbidity, and the consequent deposition of siltin the pits, were negligible in Pit No. 1 and were2.7 and 1.4 percent for Pit No. 2.
In general, it has been observed that the typesof silt materials in the river govern the effectson recharge to an extent equaling or exceedingthe turbidity concentration. Strong winds createwaves which scour the fine muds from the bottomof Peoria Lake. Turbidity created in this mannerwas persistent and rapidly clogged the filteringsurface of the recharge pits. In many instances,higher concentrations of turbidity which werecaused by excessive storm runoff were less per-sistent and had less effect on the recharge rate.
Other Operational Difficulties
Ice, fish, debris and algae are worthy of men-tion only because they were constant nuisances.Although the submerged river intake was protectedby a screened bar-rack, and the two pipe linesfrom the control tower caisson were screened, agreat proportion of the operators' time was spentin removing these miscellaneous materials whichcollected on the screens.
Seasonal algae growths invaded the rechargepits and contributed to minor reductions in theoperating rate. These sporadic invasions wereeffectively overcome by the application of 15 to20 pounds per day of copper sulfate.
FACTORS INFLUENCING GROUND WATER
River Stages
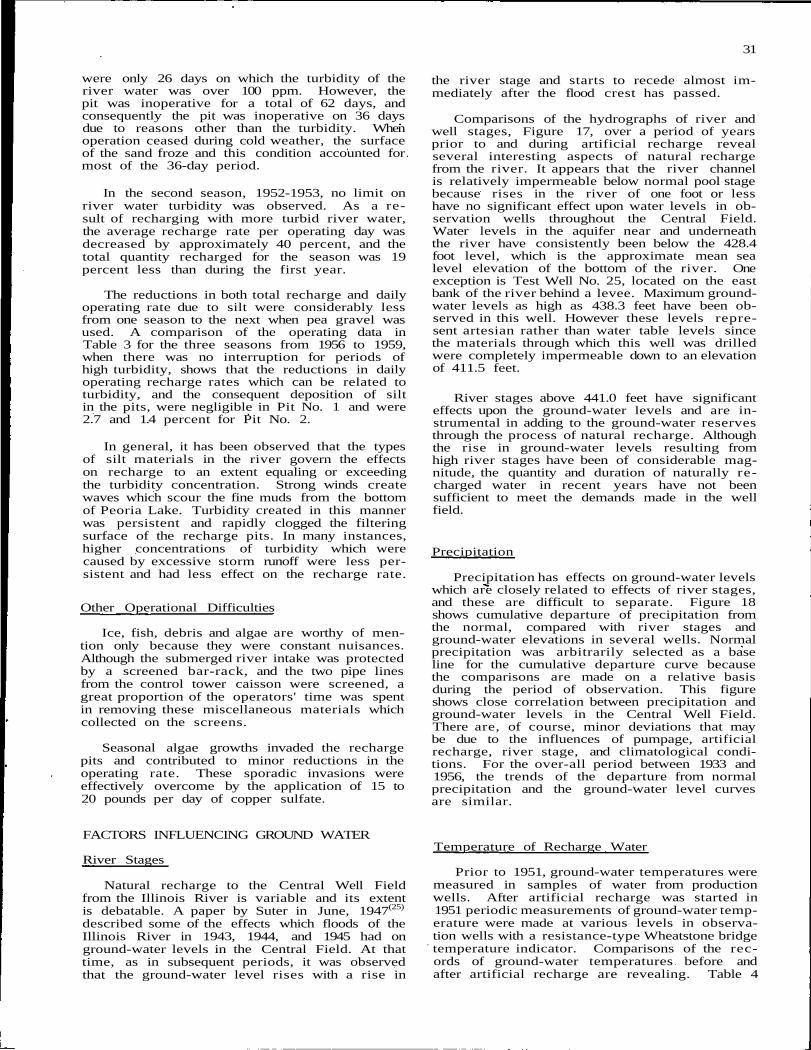
Natural recharge to the Central Well Fieldfrom the Illinois River is variable and its extentis debatable. A paper by Suter in June, 1947(25)
described some of the effects which floods of theIllinois River in 1943, 1944, and 1945 had onground-water levels in the Central Field. At thattime, as in subsequent periods, it was observedthat the ground-water level rises with a rise in
31
the river stage and starts to recede almost im-mediately after the flood crest has passed.
Comparisons of the hydrographs of river andwell stages, Figure 17, over a period of yearsprior to and during artificial recharge revealseveral interesting aspects of natural rechargefrom the river. It appears that the river channelis relatively impermeable below normal pool stagebecause rises in the river of one foot or lesshave no significant effect upon water levels in ob-servation wells throughout the Central Field.Water levels in the aquifer near and underneaththe river have consistently been below the 428.4foot level, which is the approximate mean sealevel elevation of the bottom of the river. Oneexception is Test Well No. 25, located on the eastbank of the river behind a levee. Maximum ground-water levels as high as 438.3 feet have been ob-served in this well. However these levels repre-sent artesian rather than water table levels sincethe materials through which this well was drilledwere completely impermeable down to an elevationof 411.5 feet.
River stages above 441.0 feet have significanteffects upon the ground-water levels and are in-strumental in adding to the ground-water reservesthrough the process of natural recharge. Althoughthe rise in ground-water levels resulting fromhigh river stages have been of considerable mag-nitude, the quantity and duration of naturally re-charged water in recent years have not beensufficient to meet the demands made in the wellfield.
Precipitation
Precipitation has effects on ground-water levelswhich are closely related to effects of river stages,and these are difficult to separate. Figure 18shows cumulative departure of precipitation fromthe normal, compared with river stages andground-water elevations in several wells. Normalprecipitation was arbitrarily selected as a baseline for the cumulative departure curve becausethe comparisons are made on a relative basisduring the period of observation. This figureshows close correlation between precipitation andground-water levels in the Central Well Field.There are, of course, minor deviations that maybe due to the influences of pumpage, artificialrecharge, river stage, and climatological condi-tions. For the over-all period between 1933 and1956, the trends of the departure from normalprecipitation and the ground-water level curvesare similar.
Temperature of Recharge Water
Prior to 1951, ground-water temperatures weremeasured in samples of water from productionwells. After artificial recharge was started in1951 periodic measurements of ground-water temp-erature were made at various levels in observa-tion wells with a resistance-type Wheatstone bridgetemperature indicator. Comparisons of the rec-ords of ground-water temperatures before andafter artificial recharge are revealing. Table 4

32
FIGURE 18 PRECIPITATION, PUMPACE, ARTIFICIAL RECHARGE,

33
AND WATER ELEVATIONS IN RIVER AND CENTRAL WELL FIELD

34
TABLE 4
TEMPERATURES OBSERVED IN GROUND-WATER SAMPLES FROM WELLS NEAR RECHARGE PITS
Range of Temperatures Observed in Hiram Walker Wells
shows the ranges of minimum and maximum temp- were apparent. The 1951 range of 52° to 66° F.eratures observed in samples taken from pro- was reduced to 42° to 63° F. in 1957, and the av-ducing wells over three consecutive periods. erage temperatures were 59° and 54° F., respec-These are the periods immediately preceding arti- tively.ficial recharge, during the operation of one re-charge pit, and during the operation of two recharge During the summer operating period in 1956,pits. In addition, three successive periods during temperatures were measured each week in obser-which the lowest and highest ground-water temp- vation wells near the pits at successive five-footeratures were observed in samples from five of levels from the ground-water surface to the bottomthe wells are given. These production wells are of each well. Additional temperature measure-between 1093 and 2810 feet from the recharge pits. ments were made in samples collected from neigh-The wells are listed in the table in order of in- boring production wells. Recharge with high-creasing distance from the pits. The apparent temperature water (76° to 82°F.) increased theeffects of recharge, using river water at tempera- maximum observed ground-water temperatures intures below 65 F., have been 1) to lower both the wells within a radius of 500 feet from Pit No. 1.minimum and maximum temperature range, 2) to Beyond that radius, the maximum was not in-move forward in time the date of occurrence of creased over values previously observed.the high and low temperatures, and 3) to shortenthe time periods during which the maximum and The deviations from average ground-waterminimum temperatures occur. temperatures and the differences between tempera-
tures at successive five-foot levels are greatestin those wells nearest the pits. These effects
Recharge with river water at temperatures may not be related entirely to the normal, inac-below 65° F. has had the effect of lowering the tive properties of the aquifer because all of theaverage ground-water temperatures, at least in wells in which observations were made are sub-wells within 2000 to 3000 feet of the pits. For ject to other variable and irregular influencesinstance, the temperatures ranged from 54° to such as natural recharge and pumpage. However,58° F. and averaged 56° F. in Hiram Walker's Well the trends are readily apparent.No. 5 during 1951. By 1957, the annual rangeof temperatures had been changed to 42° to 63° F. Temperatures in wells nearest the river showand the yearly average temperature was down to interference from natural recharge during high51°F. Although the influence of artificial recharge river stages. In summer, when the pits are notupon Well No. 2 is masked by some effects of operating, flood stages in the river produce highernatural recharge from the river, similar reduc- than normal temperatures in the ground water intions in yearly average and range of temperatures these wells. The same effect may be felt in wells

more remote from the river, but it is not clearlyevident.
Ground-water temperatures have given an indi-cation of the direction in which recharge movesinto and through the ground water. The mostpronounced changes occur near the recharge pits,as would be expected. Based on the assumptionthat the magnitude and frequency of temperaturechange are directly related to quantity of rechargeand direction of flow, the bulk of artificially re-charged water moves in a southwesterly directionfrom the pits and roughly parallel to the river.It was also noted that recharged water remainson top of the existing ground water irrespectiveof their relative temperatures.
Mineral Quality
Periodic mineral analyses were made of sam-ples collected from the river and ObservationWell No. 19, which is located inside the WaterSurvey Laboratory building. Artificial rechargeresults in reductions of about 50 percent in totalmineral content, alkalinity, hardness, and ironof the ground water in the vicinity of the pits.Manganese is completely eliminated. Concentra-tions of chlorides, sulfates, fluorides, nitrates,and dissolved oxygen are increased. There is noappreciable change in pH, and no increase in tur-bidity has been detected in ground-water samplesby means of the direct light transmission methodused. However, some of the local industries re-quire high clarity in water for their processesand are making systematic nephelometric obser-vations of the turbidity in ground-water samples.
During early 1959 at the request of the RobertA. Taft Sanitary Engineering Center, carbon filterswere installed to collect samples at the river in-take, from the Water Survey's Well No. 19 andfrom a well about 1,000 feet away. Taft person-nel are conducting a study of organic contaminants.It was found that all of the waters are similar,that water from the Survey's Well No. 19 is prac-tically undiluted recharge water during periods ofoperation, and that the water taken from the distantwell is about 50 percent diluted.
Quantity of Recharge
Figures 19 through 36 show ground-water ele-vations in wells, along lines drawn through thewell field parallel to and across the Illinois RiverValley, revealing some of the changes which haveoccurred since 1933. These profiles demonstratein part the effects of artificial recharge, but theydo not permit the comparison of the effects ofartificial recharge with those of other factorswhich prevail. It is significant to remember thatelevations observed in Well No. 25, on the eastside of the river, may not truly represent thefree ground-water surface as this well was drilledthrough a confining layer of clay.
Artificial recharge results in immediate andsubstantial changes in the ground-water levels nearthe pits, both when it begins and ends. At dis-tances over 1500 feet from the pits, effects arenot so evident except when considered togetherwith other factors which influence ground-water
35
levels and during the period of time precedingand including artificial recharge. Reference toFigure 18 will show that the over-all trend ofground-water levels in the Central Well Fieldwas rather sharply downward during the yearsbetween 1933 and 1950. There were, of course,minor fluctuations caused by such factors as tem-porary reductions in pumpage, floods, and heavyprecipitation, but the general trend was persist-ently downward. At the end of this period, thecurve showing the cumulative departure fromnormal precipitation had returned from below toabove normal, and conservation measures hadreduced total pumpage to a quantity within theestimated range of safe yield for the aquifer.During the period of 1950 to 1953, the area ex-perienced one flood and river stages were highfor a large proportion of the remaining time; onerecharge pit was placed in operation; pumpagefrom the field was held close to the estimatedsafe range; and, the ground-water levels rose toelevations comparable to those of about 1939 or1940. From 1953 through 1956, the ground-waterlevels again declined and in some cases reachedtheir lowest recorded levels. Precipitation wasbelow normal for three of these four years al-though the cumulative departure curve did notfall below normal until early 1956. The recessionin ground-water levels continued throughout thisperiod in spite of the operation of one rechargepit and despite further reductions in pumpage fromthe well field. Since late 1956, two rechargepits have been operated and ground-water levelsthroughout the Central Well Field have risen rap-idly. This rise in ground-water levels has takenplace in spite of additional deficiencies in pre-cipitation and of annual withdrawals in pumpageapproximately equal to those during the period ofdeclining water levels from 1953 to 1956.
These observed trends and the influences ex-erted by recharge, precipitation, floods, and pump-age are apparent in the remote parts of the CentralWell Field as well as in the immediate vicinityof the recharge pits. It appears logical to con-clude that sufficient water is being recharged bythe two pits to raise directly the ground-waterlevels in the immediate neighborhood; and, at thesame time, to serve as the means of raising thestorage level of naturally infiltered ground waterin more remote parts of the well field.
ARTIFICIAL GROUND-WATER RECHARGEBY INDUSTRIES
The successful operation of the first of theWater Survey's two recharge pits led to the con-struction of similar installations in Peoria. Boththe Bemis Bro. Bag Company and the PeoriaWater Works Company pits are located in theNorth Well Field.
BEMIS BRO. BAG COMPANY
The Bemis Company obtains its water supplyfrom two wells, in both of which the ground-waterlevels were dangerously low in 1955. In addition,the company pumps an estimated 2 mgd of riverwater through its condensers and returns thiswarmed water to the river. Because the wellwater which it uses must be warmed in manu-

36
FIGURE 19 GROUND-WATER SURFACE PROFILE ALONG ILLINOIS RIVER VALLEY, 1933
FIGURE 20 GROUND-WATER SURFACE PROFILE ALONG ILLINOIS RIVER VALLEY, OCTOBER 1951 TO APRIL 1952
FIGURE 21 GROUND-WATER SURFACE PROFILE ALONG ILLINOIS RIVER VALLEY, OCTOBER 1952 TO MAY 1953

37
FIGURE 22 GROUND-WATER SURFACE PROFILE ALONG ILLINOIS RIVER VALLEY, OCTOBER 1953 TO MAY 1954
FIGURE 23 GROUND-WATER SURFACE PROFILE ALONG ILLINOIS RIVER VALLEY, NOVEMBER 1954 TO MAY 1955
FIGURE 24 GROUND-WATER SURFACE PROFILE ALONG ILLINOIS RIVER VALLEY, NOVEMBER 1955 TO MAY 1956

38
FIGURE 25 GROUND-WATER SURFACE PROFILE ALONG ILLINOIS RIVER VALLEY, SEPTEMBER 1956 TO MAY 1957
FIGURE 26 GROUND-WATER SURFACE PROFILE ALONG ILLINOIS RIVER VALLEY, SEPTEMBER 1957 TO MAY 1958
FIGURE 27 GROUND-WATER SURFACE PROFILE ALONG ILLINOIS RIVER VALLEY, OCTOBER 1958 TO MAY 1959

39
FIGURE 28 GROUND-WATER SURFACE PROFILE ACROSS ILLINOIS RIVER VALLEY, 1933
FIGURE 29 GROUND-WATER SURFACE PROFILE ACROSS ILLINOIS RIVER VALLEY, OCTOBER 1951 TO APRIL 1952
FIGURE 30 GROUND-WATER SURFACE PROFILE ACROSS ILLINOIS RIVER VALLEY, OCTOBER 1952 TO MAY 1953

40
FIGURE 31 GROUND-WATER SURFACE PROFILE ACROSS ILLINOIS RIVER VALLEY, OCTOBER 1953 TO MAY 1954
FIGURE 32 GROUND-WATER SURFACE PROFILE ACROSS ILLINOIS RIVER VALLEY, NOVEMBER 1954 TO MAY 1955
FIGURE 33 GROUND-WATER SURFACE PROFILE ACROSS ILLINOIS RIVER VALLEY, NOVEMBER 1955 TO MAY 1956

41
FIGURE 34 GROUND-WATER SURFACE PROFILE ACROSS ILLINOIS RIVER VALLEY, SEPTEMBER 1956 TO MAY 1957
FIGURE 35 GROUND-WATER SURFACE PROFILE ACROSS ILLINOIS RIVER VALLEY, SEPTEMBER 1957 TO MAY 1958
FIGURE 36 GROUND-WATER SURFACE PROFILE ACROSS ILLINOIS RIVER VALLEY, OCTOBER 1958 TO MAY 1959

FIGURE 37 EFFECTS OF RECHARGE AT BEMIS BRO. BAG COMPANY

facturing paper, the Bemis Company designed andconstructed a pit through which it could rechargethe 2 mgd of warm river water which was beingdischarged from the condensers.
The design of this pit was based on the ex-perience gained by the Survey from operation ofPit No. 1. The Bemis pit was constructed in 1955with a ten by fifty-foot bottom, at elevation of437.9 feet, side slopes of three horizontal to onevertical, and a 12-inch layer of pea gravel on thebottom and sides up to a maximum water depthof ten feet. Provisions were made for chlorinatingthe recharge water.
Artificial recharge was begun on December30, 1955, and continued almost without interrup-tion until May 12, 1957. Comparisons of riverstage, pit stage, and temperatures in the twoCompany wells are shown in Figure 37. Duringthis first, long operating period, the pit stagerose slowly and reached a maximum of 444.8 inApril, 1957. The nonpumping ground-water levelsin the wells rose almost fifteen feet by March,1956. Subsequently these levels fluctuated due tovariations in pumpage and spreading of the re-charge effect, but they remained five feet or moreabove the 1955 levels.
Considerable variation was observed in temp-eratures in the two wells. The temperatures inthe nearest well, No. 3, ultimately increased 20°F.over their 1955 values, but the average increasewas about 10°F. The average increase in WellNo. 2 was approximately 4 F.
Infiltration rates in this pit were high and havecontinued at relatively high values. The rate wasmore than 200 feet per day for about two monthsof operation and did not fall below 100 feet perday until after ten months. When recharge wasstopped in 1957 for replacing the pea gravel, therate was 54 feet per day.
Measurements were made to determine theamount of silt penetration in the pea gravel inMay, 1957. The weight of silt found per unitvolume of pea gravel was:
Top 2-inch layer 10.2 lbs. per cubic foot2- to 4-inch depth 7.6 " " " "4- to 6-inch depth 6.6 " " " "6- to 8-inch depth 6.4 " " " "8- to 10-inch depth 6.1 " " " "
Since a cubic foot of pea gravel is estimated asbeing capable of holding 12.5 lbs. of silt, it isevident that some filtering capacity was stillavailable. This pit has since been used periodi-cally according to the demands put upon theground-water reserves.
PEORIA WATER WORKS COMPANY
The Peoria Water Works Company built andoperates a recharge pit in the North Well Field.This company supplies the domestic and someindustrial needs of the community from wells inthe Sankoty, Central, and North Fields. For thewater company pit, emphasis was necessarily
43
placed on the sanitary quality rather than thetemperature of the recharged water. For thisreason, the design and operation of its rechargepit might be considered more conservative.
The Sankoty Well Field was severely over-pumped and artificial recharge in that area wasneeded. However, a test of landflooding there in1953 had proven unsuccessful because the water-bearing strata are overlain by 20 to 40 feet ofclay. Test borings in the North Field near themain well and pumping station revealed sands andgravels directly beneath the topsoil. Therefore,the Water Company built its recharge pit in thislocation. During both the winter season and thehigh demand period in the summer, a rechargerate of 5 mgd was desirable in order to reducepumpage in the Sankoty Field.
This pit was excavated to elevation 446.0 feet.The bottom measures 200 by' 350 feet and thesides slope three feet horizontally to one verti-cally to elevation 460.0. Sand is used for the6-inch thick filtering layer as a means of main-taining the ground-water quality.
Two intake structures have been used, and thelocation of the first was responsible for manyoperational difficulties. The first was locatedat the site of the former Water Company WellNo. 4, near the river bank about 2500 feet up-stream from the Bemis Bro. Bag Company. Aneddy current sweeps past the Bemis plant andcarried paper fibers from it to the Water com-pany's intake. These paper fibers caused seriousclogging of the filtering sand and reduced re-charge to very low rates. During flood periodsthe intake structure was surrounded by water andcould not be properly attended. The Peoria WaterWorks Company built a 10 mgd surface watertreatment plant in 1959, at which time the intakefor the recharge pit was re-located in the nar-rows above Peoria Lake. The problems causedby suspended fibers have been eliminated, and theintake is accessible at all times.
Due to its large size, the Water Company pitrecharges between 3 and 5 mgd when it is in op-eration. However, the unit surface area infiltra-tion rates have been low because the sands usedfor filtering have a lower permeability than peagravel. Comparative sizes and shapes of the fourpits in Peoria are illustrated in Figure 38. Vol-ume-area curves for the four pits, which areuseful in comparing relative unit area infiltrationrates or efficiencies, are shown in Figures 39through 42.
COST OF EXPERIMENTAL ARTIFICIALRECHARGE
Table 5 gives a brief summary of the capitalinvestment and operating costs for the WaterSurvey's recharge project at Peoria. The costfigures have not been prorated to the two pits,and consequently, they reflect more nearly achronological expenditure or investment. For in-stance, the cost of land for Pit No. 1 has not beenseparated from the cost of acquiring land for thelaboratory; the price of the land for Pit No. 2

44
FIGURE 38 COMPARISON OF PIT SIZES
FIGURE 39 VOLUME-AREA CURVES WATER SURVEY PIT NO. 1

FIGURE 40 VOLUME-AREA CURVES WATER SURVEY PIT NO. 2
represents the cost of a grant of easement andnot outright purchase. Operating rather thancapital costs are compared owing to the difficultyof proportioning the land costs and estimatingthe effective life periods of the recharge pits.
In operating pits such as these, economiescould probably be realized through automation, asfull-time attendance by operating personnel wouldnot be required if automatic chlorination, pumpingcontrols, and mechanically cleaned screens couldbe provided. Further, for pits operated com-mercially, it is unlikely that round-the-clock at-tendance would be required as for these researchpits. On the other hand, operating costs for theresearch pits do not reflect the salaries of pro-fessional persons directing the operation.
CONCLUSIONS
The problem of finding a method of rechargeto meet the needs peculiar to Peoria has beensolved. By means of pits, artificial recharge isconducted at high infiltration rates; operating costsare low in comparison to the cost of treating riverwater for direct use; practical methods of main-taining satisfactory infiltration rates have beendeveloped; ground-water temperatures have beenmaintained within desirable limits; and a signifi-cant contribution has been made toward stoppingthe recession of local ground-water levels.
FIGURE 41 VOLUME-AREA CURVES BEMIS BRO. BAG COMPANY PIT
45
FIGURE 42 VOLUME-AREA CURVES
PEORIA WATER WORKS COMPANY PIT
Maximum infiltration rates of 175 feet per dayhave been reached in the experimental Pit No. 2constructed by the Water Survey, and rates higherthan 200 feet per day have been achieved in thepit of Bemis Bro. Bag Company. Mean annualrates for three successive seasons of concurrentoperation of the two Water Survey recharge pitswere between 102.8 and 54.5 feet per day in PitNo. 2 and between 41.2 and 38.7 feet per day inPit No. 1.
Valuable information has been obtained rela-tive to operating procedures and costs. The costsummaries show that the operating cost has beenapproximately two cents per thousand gallons re-charged. This is substantially less than the limitof six cents per thousand gallons which had beenestimated as the maximum to be attractive com-mercially. The unit cost of recharge was re-duced during the years that both pits were operatedfor the reason that the quantity of water rechargedwas increased while the cost of supervision ofoperation remained almost constant. It appearsthat advantage lies with annual replacement offilter media because it enables higher rechargerates. Unit costs per thousand gallons rechargedwere almost identical whether the pit was cleanedannually or operated two or three years betweencleanings.
Experience has demonstrated the ability of peagravel to serve as an effective filtration media,while allowing a practical rate of infiltration overlong periods of time. Bacterial analyses of samplestaken since the pea gravel was first used haveshown no deterioration in sanitary quality of theground water. Repeated use of the pea gravelcaused no significant reduction in the averagedaily recharge rate in Pit No. 1 and resulted inslight reductions in the rate of Pit No. 2. Thepea gravel was replaced after three seasons ofuse because the concentration of silt was approach-ing the saturation limit of its void spaces.
Temporary increases in recharge rate can beobtained by removing part of the accumulated siltwith a suction cleaner. Although the benefits ofsuch cleaning are immediately apparent, they are

46
TABLE 5
COST OF ARTIFICIAL RECHARGE AT PEORIA
short-lived. Availability of personnel, weather when the temperature of the river is lower thanconditions, and time limit the effectiveness of the normal average ground-water temperatures.this method of improving and maintaining the re- As a consequence, the ground-water temperaturescharge rate. are being reduced below those values which were
observed prior to the use of artificial recharge.The observed values listed in Table 4 indicatethis effect reaches as far as 2800 feet from the
The effects of recharge on ground-water tern- pits. The short period of recharge during theperatures have been beneficial in general. Most summer of 1956 produced higher than desirableindustries using ground water from the Central temperatures within 500 feet of the pits but didWell Field prefer cool water. Approximately 80 not result in significant increases beyond thatpercent of the entire recharge has been conducted radius.

47
It appears that artificial recharge with the four In addition to the research and service benefitsPeoria pits has contributed materially to raising derived from the pit method of recharge at Peoria,the ground-water levels in the wellfields in Peoria, valuable information was obtained bearing on theand that continued operation of these pits is essen- potential application of this method in other liketial to maintaining the ground water at desirable areas of the state.levels.
REFERENCES
1. Horberg, L., Suter, Max, and Larson, T. E., 1950, Groundwater in the Peoria Region: IllinoisState Water Survey Bulletin 39.
2. General Assembly of the Illinois State Legislature, 1951, An Act to provide for the establishmentof Water Authorities and to define their powers and duties: Illinois Revised Statutes, Chap. 111-2/3,Sections 223-250, 1959.
3. Illinois State Board of Health, 1901, Sanitary Investigations of the Illinois River and Tributaries:Springfield, Ill.
4. Illinois State Board of Health, 1901-1902, Sanitary Investigation of the Illinois, Mississippi andMissouri Rivers: Springfield, Ill.
5. Sanitary District of Chicago, 1902, Report of Streams Examination: Chicago, Ill.
6. Boruff, C. S., and Buswell, A. M., 1929, Illinois River Studies; 1925-1928: Illinois State WaterSu»vey Bulletin 28.
7. Hurwitz, E., and Barnett, G. R., 1959, Pollution Control on the Illinois Waterway: Journal of theAmerican Water Works Association, Vol. 51, p. 987-994.
8. U. S. Public Health Service, 1927, A Study of the Pollution and Natural Purification of the IllinoisRiver: United States Treasury Department, Public Health Service, Public Health Bulletin No. 171,Washington, D. C.
9. Suter, Max, 1948, Temperature and Turbidity of Some River Waters in Illinois: Illinois StateWater Survey Report of Investigation No. 1.
10. U. S. Public Health Service, 1946, Drinking Water Standards, 1946: Journal of the American WaterWorks Association,- Vol. 38, p. 361-370.
11. Suter, Max, 1957, Fine Screen Designed for River Water: Civil Engineering, Vol. 27, p. 64.
12. Suter, Max, 1952, Report on Peoria Infiltration Pit, 1951-1952: Peoria Association of Commerce,Ill. Mimeo.
13. Suter, Max, 1953, Report on Pepria Infiltration Pit, 1952-1953: Peoria Association of Commerce,Ill. Mimeo.
14. Suter, Max, 1954, Third Annual Report on Operation of Peoria Infiltration Pit, 1953-1954: PeoriaAssociation of Commerce, Ill. Mimeo.
15. Suter, Max, 1955, Fourth Annual Report on Operation of Peoria Infiltration Pit, 1954-1955: PeoriaAssociation of Commerce, Ill. Mimeo.
16. Suter, Max, 1956, Fifth Annual Report on Operation of Peoria Infiltration Pit, 1955-1956: PeoriaAssociation of Commerce, Ill. Mimeo.
17. Suter, Max, 1956, Report on Summer Operation of Pit, Illinois State Water Survey, Peoria Asso-ciation of Commerce, Ill. Mimeo.
18. Suter, Max, 1957, Sixth Annual Report on Operation of Peoria Infiltration Pits, 1956-1957: PeoriaAssociation of Commerce, Ill. Mimeo.

48
19. Suter, Max, and Harmeson, Robert H., 1958, Seventh Annual Report on Operation of Peoria Inliltra-tion Pits, 1957-1958: Peoria Association of Commerce, Ill. Mimeo.
20. Harmeson, Robert H., 1959, Eighth Annual Report on Operation of Peoria Infiltration Pits, 1958-1959:. Peoria Association of Commerce, Ill. Mimeo.
21. Suter, Max, 1956, High-Rate Recharge of Ground Water by Infiltration: Jour. of Amer. WaterWorks Assn., 48(4): 355-360, 1956. Ill. State Water Survey Circular 54.
22. Suter, Max, 1956, The Peoria Recharge Pit; Its Development and Results: Jour, of Irrig. andDrainage Div., Proc. Amer. Soc. Civil Engrs., Paper 1102, Vol. 82, I R 3, p. 1102-1-17.
23. Suter, Max, 1959, Artificial Ground Water Recharge at Peoria, Illinois: Trans. Illinois Acad. ofSciences, Vol. 52, Nos. 3-4, p. 96-99.
24. Heiple, L. R., 1959, Effectiveness of Coarse-Grained Media for Filtration: Journal of the Ameri-can Water Works Association, Vol. 51, p. 749-760.
25. Suter, Max, 1947, Apparent Change in Water Stages During Floods at Peoria, Illinois: Transac-tions American Geophysical Union, Vol. 28, p. 425-437.