article the effect of pharmacist's role on patient
TRANSCRIPT
Article
The Effect Of Pharmacist's Role On Patient Understanding And Satisfaction During The Provision of A Cost-Effective Pharmacist-led Intervention
Manfrin, Andrea
Available at http://clok.uclan.ac.uk/34033/
Manfrin, Andrea ORCID: 0000-0003-3457-9981 (2020) The Effect Of Pharmacist's Role On Patient Understanding And Satisfaction During The Provision of A Cost-Effective Pharmacist-led Intervention. European Journal for Person Centered Healthcare . ISSN 2052-5648
It is advisable to refer to the publisher’s version if you intend to cite from the work.
For more information about UCLan’s research in this area go to http://www.uclan.ac.uk/researchgroups/ and search for <name of research Group>.
For information about Research generally at UCLan please go to http://www.uclan.ac.uk/research/
All outputs in CLoK are protected by Intellectual Property Rights law, includingCopyright law. Copyright, IPR and Moral Rights for the works on this site are retained by the individual authors and/or other copyright owners. Terms and conditions for use of this material are defined in the http://clok.uclan.ac.uk/policies/
CLoKCentral Lancashire online Knowledgewww.clok.uclan.ac.uk
brought to you by COREView metadata, citation and similar papers at core.ac.uk
provided by CLoK

Andrea Manfrin UCLan copyright 2020
1 | P a g e
The Effect Of Pharmacist's Role On Patient Understanding And Satisfaction During
The Provision of A Cost-Effective Pharmacist-led Intervention
ABSTRACT
Rationale, aims and objectives: The aim of this study is to identify the effect of pharmacist's
role on patient understanding and satisfaction during the delivery of a cost-effective
pharmacist-led intervention in asthma patients using partial least squares structural equation
modelling (PLS-SEM).
Methods: A validated questionnaire was used to gather patient views on a pharmacist-led
intervention. A conceptual model was developed for testing 4 hypotheses. H1: What was the
effect of patient understanding on patient satisfaction? H2: What was the effect of pharmacist
role on patient understanding? H3: What was the effect of pharmacist role on patient
satisfaction? H4: What were the in-sample and out-of-sample predictive power of the model?
The study received ethics approval.
Results: Two hundred forty-six patients returned the questionnaire. Construct reliability,
validity, average extracted variance and discriminant validity were confirmed. The values of
the path coefficients and effect sizes suggested that pharmacist's role played a significant part
in the patient understanding, which then influenced patient satisfaction. The in-sample and out-
of-sample predictive powers were moderate. Patient's satisfaction is becoming an integral
component in the health care provision and an element for the evaluation of the quality of
health care. The results have demonstrated the need for further research assessing the link
between pharmacist's role in patient's understanding and satisfaction when delivering cost-
effective pharmacist-led interventions.

Andrea Manfrin UCLan copyright 2020
2 | P a g e
Conclusions: This study highlighted the development and application of a simple conceptual
model, using partial least squares structural equation modelling, for the evaluation of patients'
satisfaction when receiving an effective and cost-effective pharmacist-led intervention.
Keywords: Pharmacist, Intervention, Role, Patient, Understanding, Satisfaction
INTRODUCTION
Asthma is a chronic disease that affects adults and children all over the world [1-3], and it is
responsible for considerable global mortality and health-care costs [4]. One in eight death in
the European Union are from respiratory disease; 600,000 people die every day in the European
Union from respiratory conditions. The total yearly cost of respiratory diseases in the EU
exceeds 380 billion euros and the annual economic burden of asthma 72 billion [5]. Many
studies have advocated the role of pharmacists in asthma care, and although many well-
designed studies ([6-10] have been carried out in asthma; very few provided evidence of
effectiveness [11,12]. A large cluster randomised controlled trial conducted in Italy
demonstrated the effectiveness and cost-effectiveness of the pharmacist-led intervention in
asthma patients [13], and further analysis showed that even the minimal importance different
of the asthma control test (represented by a three-point shift in the ACT score) was cost-
effective [14]. During this project, patients', pharmacists' and GPs' feedback was collected,
and a report and a paper were published [15]. The analysis did not look specifically at the
interaction amongst the pharmacist role, patient understanding and patient satisfaction during
the provision of this bespoke pharmacist-led intervention. Structural equation modelling
(SEM) represents a group of statistical techniques that have become very popular in business
and social sciences, and its ability to model latent variables, to consider various forms of
measurement error, and to evaluate entire theories makes it useful for a different type of

Andrea Manfrin UCLan copyright 2020
3 | P a g e
research [16]. SEMs can be divided into two groups: covariance-based (CB) and variance-
based (VB) SEM. Hair, et al., (2012) suggested that CB-SEM is a confirmatory approach that
focuses on the model's theoretically established relationships and aims at minimising the
difference between the model- implied covariance matrix and the sample covariance matrix
[17]. In contrast, PLS-SEM is a prediction-oriented variance-based approach that focuses on
endogenous target constructs in the model and aims at maximising their explained variance
(for example looking at the coefficient of determination (R2) value) [17].CB-SEM estimates
models parameters using empirical variance-covariance matrix, and it is the method of choice
if the hypothesised model has one or more commons factors. VB-SEM first creates proxy as a
linear combination of observed variables and then estimates the model parameters using these
proxies. VB-SEM is the method of choice if the hypothesised contains composites. According
to McDonald (1996) [18], amongst the VB-SEM methods, Partial Least Squares (PLS) path
modelling is considered the most fully developed, and Hair et al. (2011) defined PLS-SEM
the" Silver Bullet" [19]. PLS-SEM is widely used in different disciplines, such as information
system research, strategic management [20], and marketing [21]. PLS-SEM has been used by
Urbonas et al., (2015) to explore pharmacists' jobs satisfaction and the effects of different
indicators on job satisfaction [22], and more recently by Murshid and Mohaidin (2019) to
explore the influence of pharmacists' expertise on the prescribing decisions of physicians [23].
Thus, the use of SEM is becoming popular in pharmacy practice research, and there are other
studies published in this area [24, 25]. In 2019, Manfrin et al.[26], used PLS-SEM to evaluate
a conceptual model for students' satisfaction with team-based learning. Hannane et al., (2019)
using SEM looked at asthma patients' perception of their care pathway [27]. Hindi et al., (2017)
developed and validated the medicines use review patient satisfaction questionnaire [28]. This
questionnaire was assessed using exploratory factor analysis and themes identified were: 1)
perceptions of the MUR service itself, 2) pharmacist' delivery of the MUR service, 3) the
Andrea Manfrin UCLan copyright 2020
4 | P a g e
consultation room set, 4) and lack of awareness before having an MUR. This questionnaire
presented some similarities to the one developed by Krska et al., (2009) which was used in our
study [29]. To the best of our knowledge, PLS-SEM has not been used to evaluate the
relationships among the role of the community pharmacist, patient understanding and patient
satisfaction during the provision of a cost-effective pharmacist-led intervention.
Aim
To identify the effect of pharmacist's role on patients understanding and satisfaction during the
provision of a bespoke, cost-effective pharmacist-led intervention using PLS-SEM.
Conceptual Model
Bollen in 2002 suggested that a path model is a diagram that displays the hypotheses and
variable relationships estimated in an SEM analysis [30]. Sarstedt et al., (2017) said that the
structural model represents the structural paths between the constructs (variables) [31], whereas
the measurement models represent the relationships between each construct and its associated
indicators. Sarstedt, et al., (2017) added that in PLS-SEM, structural and measurement models,
are also referred to as inner and outer models [31]. For the evaluation of the path and predictors
of patients' satisfaction, PLS-SEM was used, and a conceptual model designed. PLS-SEM can
be used for casual predictive analysis but also for reflective and formative [32]. PLS-SEM is
essentially a non-parametric method; therefore, the data do not need to be normally distributed.
PLS-SEM handles the distribution from the data using bootstrapping to find out the statistical
significance of the p values [33].
In our study, we aimed at using PLS-SEM to show how patient satisfaction is influenced by
pharmacist role and patient understanding and to find out the predictive power for patient
satisfaction. The proposed model was analysed according to the flow chart developed by [31].
The analysis of the model was conducted in different stages:
1) The measurement model aimed at revealing the relationships between latent indicators

Andrea Manfrin UCLan copyright 2020
5 | P a g e
and their variables;
2) The structural model aimed at evaluating the relationships between the latent variables;
3) PLS-SEM predict aimed at identifying the potential predictors for the latent variables.
The conceptual model summarises four hypotheses (H) that this study was aiming to test after
the provision of a bespoke effective and cost-effective pharmacist-led intervention for asthma
patient (Figure 1).
• Hypothesis 1 (H1): What was the effect of patient understanding on patient
satisfaction?
• Hypothesis 2 (H2): What was the effect of pharmacist role on patient understanding?
• Hypothesis 3 (H3): What was the effect of pharmacist role on patient satisfaction?
• Hypothesis 4 (H4): What were the in-sample and out-of-sample predictive power of
the model?
Figure I Conceptual model
The arrows are connecting the circles, and the direction of the arrows represent the hypothesis that we were going
to test. Dotted line refers to a potential less significant path, while solid lines refer to a potentially more significant
path.

Andrea Manfrin UCLan copyright 2020
6 | P a g e
METHODS
Study Design
This is a methodological study.
Population
All the information regarding, the study setting, the selection process of the participants,
inclusion and exclusion criteria and the validated questionnaire used for data collection are
published elsewhere [34, 35] .
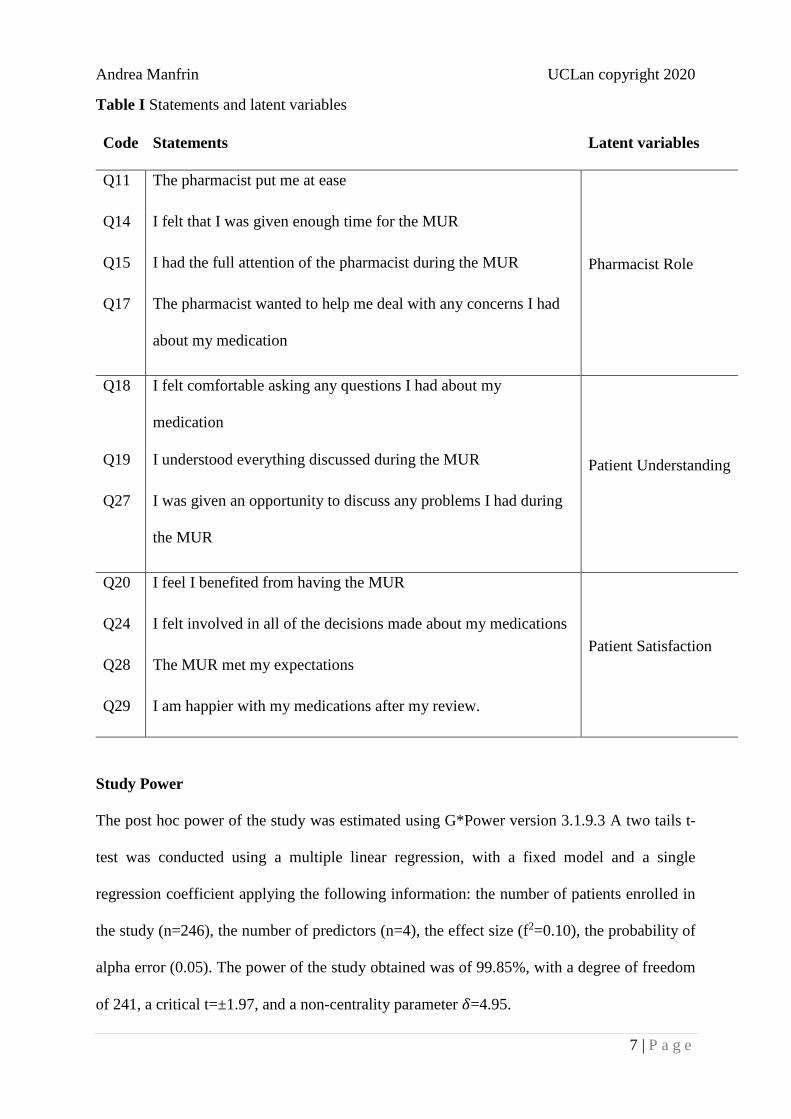
Research Instrument
The research instrument was a validated questionnaire aiming at gathering patient views on the
medicine review service (pharmacist-led intervention) which had different types of questions,
among which 5-point Likert Scale questions (strongly agree, agree, neutral, disagree, strongly
disagree), which were selected and included in this study [34]. Their selection was based on a
pragmatic approach regarding the possible relevance of each question to one of the three
constructs (latent variables): pharmacist role (perceived by patients), patient understanding,
patient satisfaction (Table I).
Andrea Manfrin UCLan copyright 2020
7 | P a g e
Table I Statements and latent variables
Code Statements Latent variables
Q11 The pharmacist put me at ease
Pharmacist Role
Q14 I felt that I was given enough time for the MUR
Q15 I had the full attention of the pharmacist during the MUR
Q17 The pharmacist wanted to help me deal with any concerns I had
about my medication
Q18 I felt comfortable asking any questions I had about my
medication
Patient Understanding Q19 I understood everything discussed during the MUR
Q27 I was given an opportunity to discuss any problems I had during
the MUR
Q20 I feel I benefited from having the MUR
Patient Satisfaction
Q24 I felt involved in all of the decisions made about my medications
Q28 The MUR met my expectations
Q29 I am happier with my medications after my review.
Study Power
The post hoc power of the study was estimated using G*Power version 3.1.9.3 A two tails t-
test was conducted using a multiple linear regression, with a fixed model and a single
regression coefficient applying the following information: the number of patients enrolled in
the study (n=246), the number of predictors (n=4), the effect size (f2=0.10), the probability of
alpha error (0.05). The power of the study obtained was of 99.85%, with a degree of freedom
of 241, a critical t=±1.97, and a non-centrality parameter 𝛿=4.95.
Andrea Manfrin UCLan copyright 2020
8 | P a g e
Data Collection and Cleaning
Data were collected using a paper questionnaire, but because these data were part of a national
project in which all the data were collected using an online platform (Qualtrics), for a matter
of consistency, it was decided to import the data into the same platform. The data set was then
exported and uploaded into SPSS version 21, for data cleaning.
Selection Of The Appropriate Structural Equation Model
Kolmogorov-Smirnov test was used for assessing normality. Data were not normally
distributed, and a covariance-based structural equation model (CB-SEM) was not
recommended according to [20]. Sarstedt et al., (2014) suggested that (VB-SEM) is a more
robust approach than CB-SEM for handling non-parametric data [36]. Therefore, the SPSS
data set was exported as a CVS file, and then uploaded onto SmartPLS (version 3.2.8), which
is a variance-based structural equation model recommended for non-normally distributed data.
Data Analysis
The initial approach was to determine whether the model was formative or reflective and
according to Gudergan et al., (2008) [37] and Bollen and Ting (2000) [38], the procedure of
choice was confirmatory tetrad analysis (CAT). The implemented procedure needed at least
four manifest variables (indicators) for each construct (latent variable). In our model, one of
the constructs (patient understanding) had three manifest variables (indicators, Q18, Q19,
Q20); therefore, it was decided to adopt a pragmatic approach applying a rule of thumb. If the
indicators were interchangeable among themselves, the model was considered reflective, but
if the indicators were not highly correlated and not interchangeable, the model was considered
formative. The evaluation of the model was conducted using a reflective approach.
The use of PLS-SEM allowed analysing the linear relationships between the latent constructs
and the latent variables. Furthermore, PLS-SEM enabled testing several relationships instead
of analysing each relationship individually. According to Henseler et al., (2009), PLS-SEM

Andrea Manfrin UCLan copyright 2020
9 | P a g e
consists of a two-step procedure involving the evaluation of the outer measurement model and
the evaluation of the inner measurement model [39]. The statistical validity of the model was
to assess using the bootstrapping procedure with a statistical significance of p<0.05. This
procedure was repeated for 5000 samples.
Evaluation Of The Outer Model
An iterative algorithm with 300 iterations (PLS algorithm) was used to determine the reliability
(outer loading coefficient), internal consistency, the validity of observed variables. Hair et al.,
(2012) suggested that consistency evaluations are based on single observed and construct
reliability test, while convergent and discriminant validity are used for the assessment of
validity [20].The first step aimed at observing the variables loading coefficients; an outer
loading coefficient, values ≥0.70 was recommended, but values of 0.40 or higher were
considered acceptable for exploratory research, as in our case. Furthermore, indicators with
loading above 0.70 indicate that the construct explains over 50% of the indicator variance [40].
The second step required the evaluation of the internal consistency and reliability using
Cronbach's alpha ≥0.70 as the lower bound, composite reliability (CR≥0.70) using Dijkstra-
Henseler's rhoA (⍴A ) as the indicator of true reliability [41), and Dillon-Goldstein's rhoc (⍴c ) as
the upper bound. These assumptions were suggested by Tenenhaus et al., (2005) [42] and Hair
et al., (2017) [43]. Values of Cronbach's alpha and CR of at least 0.70 are required, although
0.6 are The third step looked at the convergent validity, which measures the extent to which a
construct converges in its indicators by explaining the items' variance [40]. The convergent
validity was assessed using the average variance extracted (AVE) for all items associated with
each construct. AVE was calculated as the mean of the squared loadings for all indicators
associated with a construct. The value of AVE ≥0.50 indicates that on average, the construct
explains over 50% of the variance of its items [44].
Andrea Manfrin UCLan copyright 2020
10 | P a g e
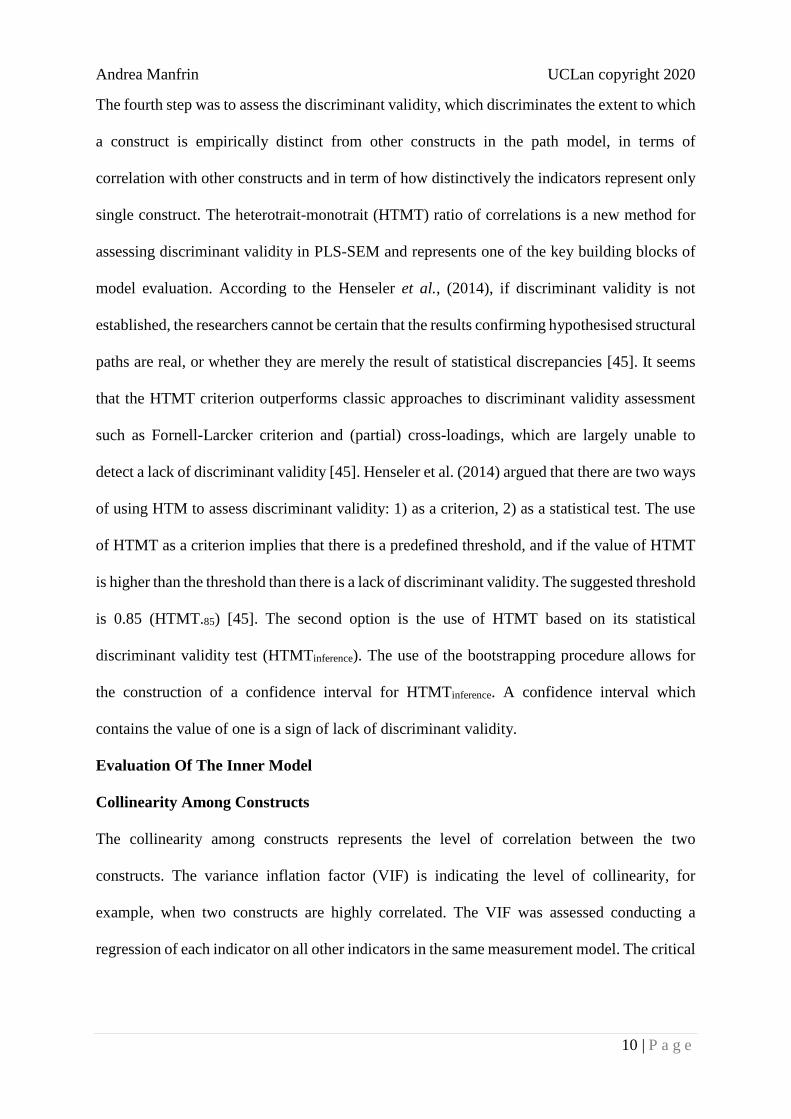
The fourth step was to assess the discriminant validity, which discriminates the extent to which
a construct is empirically distinct from other constructs in the path model, in terms of
correlation with other constructs and in term of how distinctively the indicators represent only
single construct. The heterotrait-monotrait (HTMT) ratio of correlations is a new method for
assessing discriminant validity in PLS-SEM and represents one of the key building blocks of
model evaluation. According to the Henseler et al., (2014), if discriminant validity is not
established, the researchers cannot be certain that the results confirming hypothesised structural
paths are real, or whether they are merely the result of statistical discrepancies [45]. It seems
that the HTMT criterion outperforms classic approaches to discriminant validity assessment
such as Fornell-Larcker criterion and (partial) cross-loadings, which are largely unable to
detect a lack of discriminant validity [45]. Henseler et al. (2014) argued that there are two ways
of using HTM to assess discriminant validity: 1) as a criterion, 2) as a statistical test. The use
of HTMT as a criterion implies that there is a predefined threshold, and if the value of HTMT
is higher than the threshold than there is a lack of discriminant validity. The suggested threshold
is 0.85 (HTMT.85) [45]. The second option is the use of HTMT based on its statistical
discriminant validity test (HTMTinference). The use of the bootstrapping procedure allows for
the construction of a confidence interval for HTMTinference. A confidence interval which
contains the value of one is a sign of lack of discriminant validity.
Evaluation Of The Inner Model
Collinearity Among Constructs
The collinearity among constructs represents the level of correlation between the two
constructs. The variance inflation factor (VIF) is indicating the level of collinearity, for
example, when two constructs are highly correlated. The VIF was assessed conducting a
regression of each indicator on all other indicators in the same measurement model. The critical

Andrea Manfrin UCLan copyright 2020
11 | P a g e
value of VIF is >5, but when is >3 it requires cautions as well. Therefore, low VIF values (<3)
represent good values [19, 46].
Predictive Relevance Of The Model
Two types of predictions were generated and analysed: in-sample and out-of-sample
prediction.
In-sample Predictive Power
The "in sample" prediction was conducted analysing the coefficient of determination (R2) and
the effect size (f2). This analysis provides the explanatory power, using the data set to estimate
the model and predict observation from this data set. The value of R2 measures the variance
that is explained in each endogenous construct, and for this reason, it represents the "in sample
predicting power" (explanatory power) [47, 48]. R2 values range from 0 to 1, they depend on
the discipline, but as rule of thumb R2 ≈0.25 is regarded as weak, R2 ≈0.50 moderate, R2 ≈0.75
strong predictive power respectively [19, 39]. Furthermore, R is a function of the number of
predictor constructs, and the higher is the number of predictors the higher is R2 [46]. The effect
size (f2) assesses how strongly one exogenous construct contributes to explaining a certain
endogenous construct in terms of R2. According to Cohen (1988), the effect size is regarded as
weak (0.02≤f2≤0.15), moderate (0.15≤f2≤0.35), strong (f2≥0.35), respectively [49].
Out-of-sample Predictive Power
The procedure was conducted for assessing the predictive power, which allows the model
estimates to predict new observation (e.g. future observation). For this analysis, the predictive
relevance, also known as predictive power (Q2), was used. The value of Q2 could be within
different ranges, weak (0.02≤ Q2≤0.15), moderate (0.15≤ Q2≤0.35), strong (Q2≥0.35)
predictive power, respectively. Two main procedures can be followed for the calculation of Q2,
the first is blindfolding, and the second is PLSpredict. Sarstedt et al., (2017) suggested that the
value of Q2 using blindfolding does not produce a true measure of out-of-sample prediction as

Andrea Manfrin UCLan copyright 2020
12 | P a g e
blindfolding does not omit entire observations but only data points [31]. If the obtained Q2
values are >0, they are meaningful. Therefore, this value of Q2 can only be partly considered a
measure of out-of-sample prediction because the sample structure remains largely intact in its
computation [31]. Shamueli et al., (2016) introduced a new approach for out-of-sample
prediction, which is now embedded into SmartPLS under the function PLSpredict [50].
PLSpredict rests on the principle of K-fold cross-validation. The procedure splits the data set
into K equal parts (K=10 in our case) and estimate the model K-times on K-1 data sets using r
as the number of repetition (r=10 in our case because it is a good trade-off between accuracy
and running time). In this case if Q2 >0, it means that the model (PLS) outperforms the naivest
benchmark represented by the linear model (LM). Furthermore, an important indication of the
predictive power is represented by the comparison between the root mean squared error
(RMSE) of prediction values obtained with PLSpredict versus the RMSE values obtained with
(LM). If the PLS yields higher prediction errors than the LM model in terms of RMSE for all
values this means no predictive power, the majority (low predictive power), the minority or the
same (medium predictive power) none of the indicators (high predictive power). Therefore, in
our study, we adopted PLSpredict. All the results were deemed to be statistically significant
with p-value<0.05.
Invitation Letter
Italian community pharmacists contacted all their patients (895) who received the pharmacist-
led intervention (medicines use review (MUR)) service and invited them to complete a paper
questionnaire. An invitation and an information letter were given to patients, explaining what
was requested. Patients were asked to bring back the questionnaire in a sealed envelope to the
pharmacy to ensure pharmacists did not see responses; the pharmacists then collected all the
questionnaires and posted them to Medway School of Pharmacy for analysis using individually
sealed envelopes.

Andrea Manfrin UCLan copyright 2020
13 | P a g e
Ethics Approval
Ethical approval was obtained from the Faculty (University of Kent) Research Ethics
Committee (ref. No 024S12/13), as the Principal Investigator's (Andrea Manfrin) base. The
study participants were patients who received the MUR service. Return of the questionnaire to
the pharmacist implied consent for its use in the evaluation.
Data Storage/Confidentiality/Anonymity
In terms of data storage, contact sheets and consent forms containing personal information
have been filed in a secure cabinet separate to any other participant data collected, to which
only the research team could have access. Data obtained from the mail questionnaire have been
coded and stored electronically on a computer system in a directory which is password
protected. All electronic data have been password protected and accessible only by the
researcher. All data were treated following requirements of the Data Protection Act (1998);
they have been anonymised and stripped of any identifiable references to the participants.
RESULTS
Population Demographics
Table 2 presents the demographic profile of the respondents, which is showing the frequency
and the percentage of patients who replied to each statement. Two-hundred and forty-six
patients provided information giving a response rate of 27.5% (246/895); only one patient
failed to identify the location of residence. One patient did not select the gender, leaving 245
valid cases; patients’ gender was represented by 56.7% (n=139) female and 43.3% (n=106)
male. Two-hundred and forty-four patients selected their age and two cases were missing.
Patients' ethnicity was recorded by 244 people leaving only two missing cases. The patient
population was heavily represented by white, 98.4% (n= 240), 1.2% (3) classified themselves
as mixed and 0.4% (n=1) as black. Nearly one patient out of two (44.9%) completed the

Andrea Manfrin UCLan copyright 2020
14 | P a g e
primary and few years of secondary school, only eight patients did not go to school, and only
three cases were missing.
Table II Demographic profile of the respondent patients
Patients characteristics Number (%)
Place of residence
Brescia 76 (31.0)
Pistoia 68 (27.8)
Treviso 63 (25.7)
Torino 38 (15.5)
(Missing 1)
Gender
Male 106 (43.3)
Female 139 (56.7)
(Missing 1)
Age
18-30 20 (8.2)
31-40 20 (8.2)
41-50 26 (10.7)
51-60 48 (19.7)
61-70 51 (20.9)
71-80 58 (23.8)
>80 21 (8.5)
(Missing 2)
Ethnicity
White 240 (98.4)
Black 1 (0.4)
Mixed 3 (1.2)
(Missing 2)
Education
Primary/few years of secondary 109 (44.9)
Secondary completed 73 (30.0)
Bachelor degree 26 (10.7)
College / further education 20 (8.2)
None 8 (3.3)
Still studying 4 (1.6)
Higher degree 3 (1.2)
(Missing 3)
Percentages were calculated on the number of responses

Andrea Manfrin UCLan copyright 2020
15 | P a g e
Figure I Path model generated using the PLS algorithm
The values inside the circles represent the coefficient of determination (R2). The values overlapping the arrows
pointing towards the rectangles represent the outer loading coefficients. The values overlapping the arrows
between the circles (constructs) represent the path coefficients (standardised beta=beta coefficients).
Outer Model
Reliability And Validity
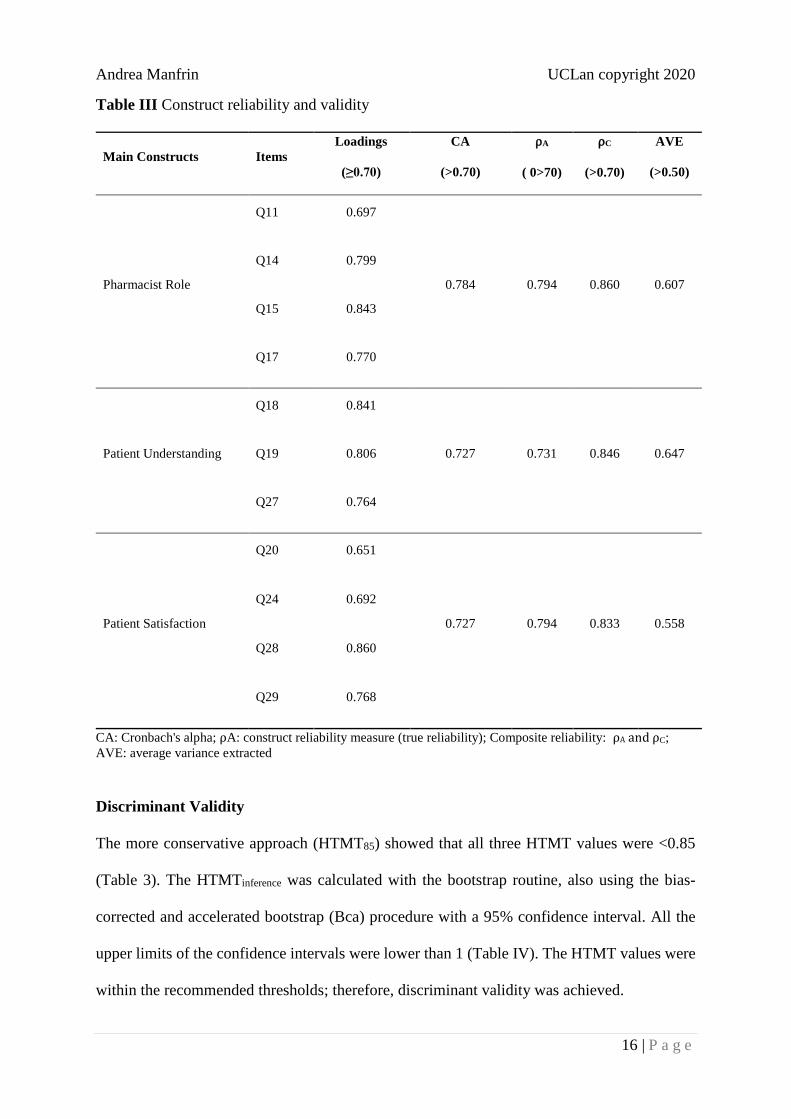
All the values presented in Table 3 have shown that the model has either construct reliability
and validity. Only three out of 11 loading coefficients were just below 0.70 (Q11, Q20 and
Q24). Cronbach's alpha, ⍴A, ⍴C and AVE were all above the recommended thresholds.
Andrea Manfrin UCLan copyright 2020
16 | P a g e
Table III Construct reliability and validity
Main Constructs Items
Loadings
(≥0.70)
CA
(>0.70)
⍴A
( 0>70)
⍴C
(>0.70)
AVE
(>0.50)
Pharmacist Role
Q11 0.697
0.784 0.794 0.860 0.607
Q14 0.799
Q15 0.843
Q17 0.770
Patient Understanding
Q18 0.841
0.727 0.731 0.846 0.647 Q19 0.806
Q27 0.764
Patient Satisfaction
Q20 0.651
0.727 0.794 0.833 0.558
Q24 0.692
Q28 0.860
Q29 0.768
CA: Cronbach's alpha; ⍴A: construct reliability measure (true reliability); Composite reliability: ⍴A and ⍴C;
AVE: average variance extracted
Discriminant Validity
The more conservative approach (HTMT85) showed that all three HTMT values were <0.85
(Table 3). The HTMTinference was calculated with the bootstrap routine, also using the bias-
corrected and accelerated bootstrap (Bca) procedure with a 95% confidence interval. All the
upper limits of the confidence intervals were lower than 1 (Table IV). The HTMT values were
within the recommended thresholds; therefore, discriminant validity was achieved.

Andrea Manfrin UCLan copyright 2020
17 | P a g e
Table IV Discriminant validity
Constructs HTMT
95%
CI
95% BCa
CI
Patient Understanding- Patient
Satisfaction
0.813 (0.683;0.935) (0672;0.925)
Pharmacist Role-Patient
Satisfaction
0.674 (0.540;0.801) (0.532;0.793)
Pharmacist Role- Patient
Understanding
0.846 (0.757;0.929) (0.753;0.926)
HTMT: Heterotrait-monotrait ratio of correlation; CI: Confidence interval; BCa: Bias-corrected and accelerated
bootstrap
The results presented in table 3 and 4 confirmed that the measurements of the reflective model
were valid and reliable.
Inner Model
Collinearity Among Constructs
The analysis of the collinearity among constructs showed that the variance inflation factor
(VIF) between patient understanding and patient satisfaction was 1.73, pharmacist role and
patient satisfaction 1.73 and pharmacist role and patient understanding 1.00. All the VIF values
were well <3; the model did not present collinearity issues.
In-sample Prediction
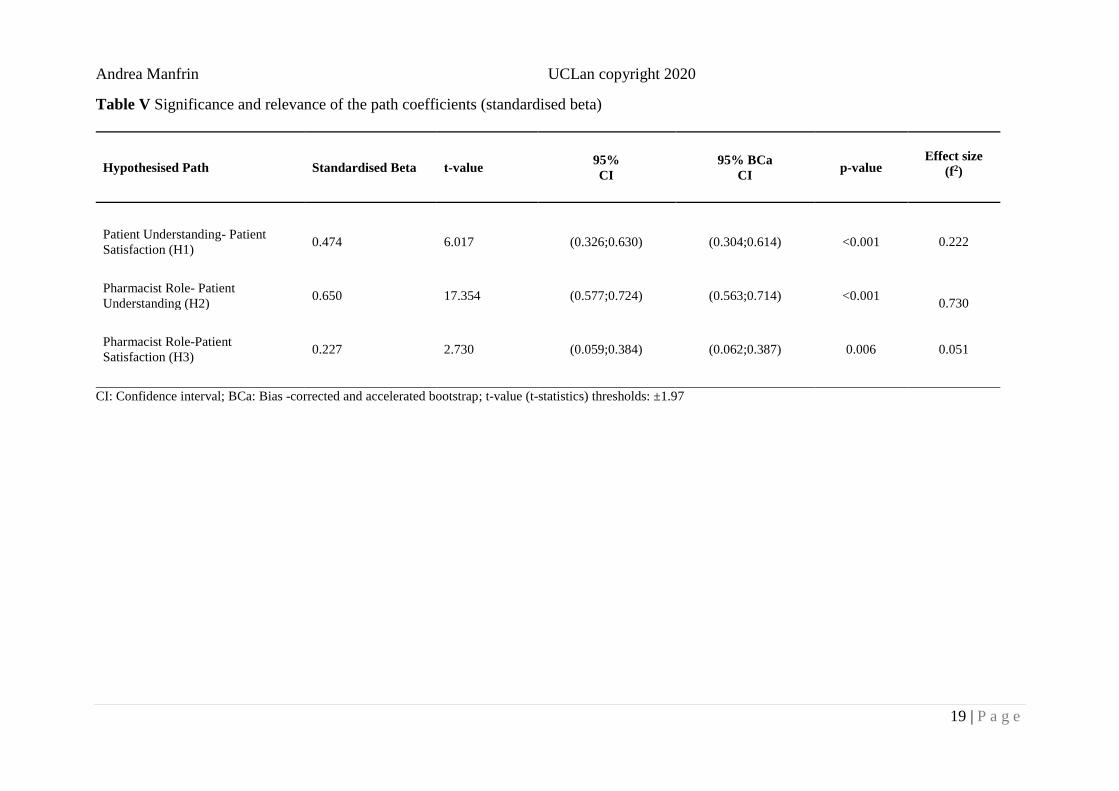
Significance, Relevance And Effect Size Of Path Coefficients
All three path coefficients were positive and statistically significant, the higher was linked with
H2, and the lower with H3 (Table V). The effect sizes were statistically significant and strong
for H2 (f2=0.730; 95% CI 0.498;1.101; p<0.001), moderate for H1 (f2=0.222; 95% CI
0.099;0.436; p=0.012); the effect size was weak and non-statistically significant for H3
(f2=0.051 95% CI 0.003;0.159; p=0.210). The direct effect of pharmacist role on patient
satisfaction was 0.227 (a relationship linking two constructs with a single arrow between the

Andrea Manfrin UCLan copyright 2020
18 | P a g e
two). The indirect effect 0.308 (95% CI 0.204;0.432; p<0.001) (a sequence if relationships with
a least one intervening construct involved). The total effect 0.535 (95% CI 0.433;0.632;
p<0.001) (the sum of the direct effect and all the indirect effects linking two constructs).
In-sample Predictive Power
The R2 value for patient understanding was slightly higher than the one for patient
satisfaction, but both coefficients were statistically significant. Furthermore, the model
showed a moderate in-sample predictive power (Table VI).
Out-of-sample Predictive Power
The predictive power (Q2) values of the PLS analysis were >0 indicating that the model
outperforms the most naïve benchmark (e.g. the indicator means from the analysis sample) of
the linear model (LM). The analysis compared the root mean squared error (RMSE) generated
by PLSpredict with the RMSE of a linear model (LM). Four out of seven RMSE values (Q18,
Q28, Q24, Q29) were lower in the PLSpredict model, and one was equal to the linear model
(LM) (Q19), and three were higher. The results suggested that this model has a medium out-
of-sample predictive power (Table VII).
Andrea Manfrin UCLan copyright 2020
19 | P a g e
Table V Significance and relevance of the path coefficients (standardised beta)
Hypothesised Path Standardised Beta t-value 95%
CI
95% BCa
CI p-value
Effect size
(f2)
Patient Understanding- Patient
Satisfaction (H1) 0.474 6.017 (0.326;0.630) (0.304;0.614) <0.001
0.222
Pharmacist Role- Patient
Understanding (H2) 0.650 17.354 (0.577;0.724) (0.563;0.714) <0.001
0.730
Pharmacist Role-Patient
Satisfaction (H3) 0.227 2.730 (0.059;0.384) (0.062;0.387) 0.006
0.051
CI: Confidence interval; BCa: Bias -corrected and accelerated bootstrap; t-value (t-statistics) thresholds: ±1.97

Andrea Manfrin UCLan copyright 2020
20 | P a g e
Table VI Coefficients of determination (R2)
Main Construct Coefficient of
Determination (R2) t-value
95%
CI
95% BCa
CI p-value
Patient Satisfaction 0.416 7.657 (0.323;0.536) (0.300;0.512) <0.001
Patient Understanding 0.422 8.657 (0.333;0.524) (0.317;0.509) <0.001
Bca: Bias -corrected and accelerated bootstrap; T-value (T Statistics) thresholds: ±1.97

Andrea Manfrin UCLan copyright 2020
21 | P a g e
Table VII Out of sample predictive power
Code Statements RMSE (PLS) Q2 (PLS) RMSE (LM)
Q2 (LM)
Q18 I felt comfortable asking any questions I had about
my medication 0.498 0.353 0.507
0.330
Q28 The MUR met my expectations 0.607 0.250 0.615
0.229
Q27 I was given an opportunity to discuss any problems I
had during the MUR 0.625 0.228 0.622
0.235
Q19 I understood everything discussed during the MUR 0.656 0.210 0.656
0.209
Q29 I am happier with my medications after my review 0.703 0.180 0.708
0.167
Q20 I feel I benefited from having the MUR 0.825 0.107 0.821
0.115
Q24 I felt involved in all of the decisions made about my
medications 0.862 0.051 0.866
0.041
Predictive power according to Q2: 0.02≤Q2<0.15 (Weak); 0.15≤Q2<0.35 (Moderate); ≥0.35 (Strong); RMSE: Root Mean Squared Error; PLS: Partial Least Squares
LM: Linear Model

Andrea Manfrin UCLan copyright 2020
22 | P a g e
DISCUSSION
The number of patients who participated in this study was 246, 57% were female, 43% male.
A conceptual model was designed aiming to test and evaluate four hypotheses; three (H1, H2,
H3) were related to the path coefficients and one (H4) to the in-sample and out-of-sample
predicting power of the model. Three constructs (latent variables) were included in the model,
pharmacist role, patient understanding and patient satisfaction. One construct (patient
understanding) had less than four manifest variables (indicators), and for this reason, it was not
possible to conduct a confirmatory tetrad analysis for assessing the nature of each construct,
whether formative or reflective. Thus, a pragmatic approach was adopted using a reflective
model for the assessment of the outer model and inner model structure. A positive path
coefficient was found for each hypothesis, suggesting that patient understanding had a positive
influence on patient satisfaction (H1), pharmacist role had a positive effect on patient
understanding (H2) and patient satisfaction (H3). In our model, the largest path coefficient was
between pharmacist role and patient understanding (0.650) the smallest was between
pharmacist role and patient satisfaction (0.227) suggesting that patient satisfaction was driven
by patient understanding. The higher effect size (f2) was for pharmacist role and patient
understanding and the smallest for pharmacist role and patient satisfaction, suggesting that the
pharmacists played a major part in patient understanding. Manfrin and Krska (2018) conducted
a study with a large number of patients (n=1711) comparing the number and type of
pharmaceutical care issues (PCI) that pharmacists identified in two different studies using the
same pharmacist-led intervention and found that patient education was the most popular [35].
A PCI is defined as an element of pharmaceutical need which is addressed by the pharmacist
[51, 52]. Patient education is a PCI which represents the need that the patient has to understand;
similar results were found in other studies conducted in Denmark [53], and Germany [54].
Wang et al., (2019) explored the pathways to outpatients' satisfaction with health care in
Andrea Manfrin UCLan copyright 2020
23 | P a g e
Chinese public hospitals using a PLS model [55]. In this study, the patients' experience of
professional competence was strongly related to their satisfaction. In our study, pharmacists'
role had a direct positive influence on patient understanding which was positively linked to
patient satisfaction as well. Amankwah et al., (2019) looked at modelling the mediating effect
of health care healing environment on core health care delivery and patient satisfaction in
Ghana [56]. The data were analysed using SmartPLS, and the procedure was similar to the one
used in our study; they assessed the in-sample predictive power, but not the out-of-sample.
Their finding confirmed that the health care healing environment mediated patient satisfaction.
A study conducted in Qatar which aimed at measuring patients' satisfaction with
pharmaceutical services at a public hospital, established, with statistical evidence, that patient
satisfaction was positively influenced by pharmacist attitude and medication counselling [57].
Another study, conducted in Turkey used SEM and looked at factors affecting patient
satisfaction, suggested that persons with a higher level of education were less satisfied when
compared to those with a lower level of education [58]. In our study, we did not perform this
comparison, but it is important to recognise that the level of education could have a relevant
impact on patient perception and satisfaction as well. In the study conducted in Qatar and
Turkey, the authors used CB-SEM but did not provide justifications for their choice. In our
study, we justified the rationale for using of PLS-SEM.
Strengths and Limitations
This study was aiming at assessing the effect of the pharmacist's role on patient understanding
and patient satisfaction. To the best of our knowledge, this is the first attempt to evaluate these
three dimensions after the provision of an effective and cost-effective pharmacists-led
intervention in asthma patients using PLS-SEM. The conceptual model was simple but robust,
showing the effect of pharmacist's role on the patient's understanding and satisfaction. This
study has some limitations, such as the selection of the questions which was based on a

Andrea Manfrin UCLan copyright 2020
24 | P a g e
pragmatic approach, the number of manifested variables that for one construct was three and
for this reason, it was not possible to perform a confirmatory tetrad analysis for assessing either
the formative or reflective nature of each construct.
Conclusion
It has been suggested that patient satisfaction is becoming an integral component in the health
care provision and an element for the evaluation of the quality of health care [59]. The authors
added that patient satisfaction is used and will be used in the future for performance assessment
and reimbursement. Furthermore, it has been suggested that patient satisfaction could be a
predictor of health-related behaviour [59].
In our study, the role that pharmacists played has demonstrated the positive impact on patient
understanding which has driven patient satisfaction in our model. Our results have uncovered
the needs to conduct further studies assessing the link between the role of the pharmacist,
patient's understanding and satisfaction when delivering effective and cost-effective
pharmacist-led intervention using larger samples and different conditions in primary and
secondary care.
References
1. Masoli, M., Fabian, D., Holt, S., & Beasley, R. (2004). The global burden of asthma:
executive summary of the GINA Dissemination Committee Report. Allergy, 59(5), 469-
478. doi: 10.1111/j.1398-9995.2004.00526.x
2. Global Initiative for Asthma (GINA). Global strategy for asthma management and
prevention. 2014. Available from: http://www.ginas thma.org. [Accessed Jul 2017].
3. Nunes, C., Pereira, A., & Morais-Almeida, M. (2017). Asthma costs and social impact.
Asthma Research And Practice, 3(1). doi: 10.1186/s40733-016-0029-3
4. Pavord, I., Beasley, R., Agusti, A., Anderson, G., Bel, E., Brusselle, G., Cullinan, P.,
Custovic, A., Ducharme, F., Fahy, J., Frey, U., Gibson, P., Heaney, L., Holt, P., Humbert,

Andrea Manfrin UCLan copyright 2020
25 | P a g e
M., Lloyd, C., Marks, G., Martinez, F., Sly, P., von Mutius, E., Wenzel, S., Zar, H., and
Bush, A. (2017). After asthma: redefining airways diseases. The Lancet, 391(10118), 350-
400.
5. European Respiratory Society. European Lung White book. (2016). The economic burden
of lung disease. Available from: http://www.erswhitebook.org/chapters/the-economic-
burden-of-lung-disease/ (2016). [Accessed 10 Sept 2015].
6. Barbanel, D. (2003). Can a self-management programme delivered by a community
pharmacist improve asthma control? A randomised trial. Thorax, 58(10), 851-854.
7. Emmerton, L., Shaw, J., & Kheir, N. (2003). Asthma management by New Zealand
pharmacists: a pharmaceutical care demonstration project. Journal of Clinical Pharmacy
and Therapeutics, 28(5), 395-402.
8. McLean, W., Gillis, J., & Waller, R. (2003). The BC community pharmacy asthma study: a
study of clinical, economic and holistic outcomes influenced by an asthma care protocol
provided by specially trained community pharmacists in British Columbia. Canadian
Respiratory Journal, 10:195–202.
9. Bunting, B., & Cranor, C. (2006). The Asheville Project: Long-Term Clinical, Humanistic,
and Economic Outcomes of a Community-Based Medication Therapy Management
Program for Asthma. Journal of the American Pharmacists Association, 46(2), 133-147
10. Mehuys, E., Van Bortel, L., De Bolle, L., Van Tongelen, I., Annemans, L., Remon, J., &
Brusselle, G. (2008). Effectiveness of pharmacist intervention for asthma control
improvement. European Respiratory Journal, 31(4), 790-799.
11. Armour, C., Bosnic-Anticevich, S., Brillant, M., Burton, D., Emmerton, L., Krass, I.,
Saini, B., Smith, L., & Stewart, K. (2007). Pharmacy Asthma Care Program (PACP)
improves outcomes for patients in the community. Thorax, 62, 496–592.

Andrea Manfrin UCLan copyright 2020
26 | P a g e
12. García-Cárdenas, V., Sabater-Hernández, D., Kenny, P., Martínez-Martínez, F., Faus, M.
& Benrimoj, S. (2013). Effect of a pharmacist intervention on asthma control. A cluster
randomised trial. Respiratory Medicine, 107(9), 1346-1355.
13. Manfrin, A., Tinelli, M., Thomas, T., Krska, J. (2017). A cluster randomised control trial
to evaluate the effectiveness and cost-effectiveness of the Italian Medicines Use Review
(I-MUR) for asthma patients. BMC Health Services Research.
https://doi.org/10.1186/s12913-017-2245-9
14. Tinelli, M., White. J, Manfrin, A. (2018). A novel pharmacist-led intervention secures the
minimal important difference (MID) in Asthma Control Test (ACT) score: better outcomes
for patients and the health care provider. BMJ Open Respiratory Research, 5:e000322.
doi:10.1136/ bmjresp-2018-000322.
15. Manfrin, A., Krska, J. (2018), Pharmacists’ and Patients’ views and feedback on Italian
Medicines Use Review (I-MUR). European Journal for Person Centered Healthcare,
6(2), 286-296.
16. Henseler, J., Hubona, G., Ray P. (2016). Using PLS path modeling in new technology
research: updated guidelines. Industrial Management & Data Systems, 116(1), 2-20.
17. Hair, J., Ringle, C., Sarstedt, M. (2012). Partial Least Squares: The Better Approach to
Structural Equation Modeling? Long Range Planning, 45(5-6), 312-319. DOI:
10.1016/j.lrp.2012.09.011
18. McDonald, R.P. (1996). Path analysis with composite variables. Multivariate Behavioral
Research, 31(2), 239-270.
19. Hair, J., Ringle, C., & Sarstedt, M. (2011). PLS-SEM: Indeed a Silver Bullet. Journal of
Marketing Theory and Practice, 19(2),139-152. DOI: 10.2753/MTP1069-6679190202

Andrea Manfrin UCLan copyright 2020
27 | P a g e
20. Hair, J., Sarstedt, M., Ringle, C., Mena, J. (2012). An assessment of the use of partial least
squares structural equation modeling in marketing research. Journal Of The Academy Of
Marketing Science, 40(3), 414-433. doi: 10.1007/s11747-011-0261-6
21. Hair, J., Sarstedt, M., Pieper, T., Ringle, C. (2012). The Use of Partial Least Squares
Structural Equation Modeling in Strategic Management Research: A Review of Past
Practices and Recommendations for Future Applications. Long Range Planning, 45(5-6),
320-340. doi: 10.1016/j.lrp.2012.09.008
22. Urbonas G, Kubiliene L, Urboniene A. (2015). Pharmacists ‘job satisfaction and its effect
on dispensing precaution taken at community pharmacies. Sveikatos Mokslai (Health Sci
East Eur), 25,17-21. https://doi.org/10.5200/sm-hs.2015.043
23. Murshid, M., & Mohaidin, Z. (2019). Influence of the expertise, collaborative efforts and
trustworthiness of pharmacists on the prescribing decisions of physicians. Journal of
Pharmacy Practice and Research, 49(2),150-161. doi: 10.1002/jppr.1492
24. Takehira, R., Murakami, K., Katayama, S., Nishizawa, K., & Yamamura, S. (2011). A
Structural Equation Model (SEM) for Pharmacist Competencies in Improving Quality of
Life of Cancer Patients: Effect of Missing Values on the SEM. Pharmacology &
Pharmacy, 2, 226-232. doi:10.4236/pp.2011.23031.
25. Nitadpakorn, S., Farris, K., & Kittisopee, T. (2017). Factors affecting pharmacy
engagement and pharmacy customer devotion in community pharmacy: A structural
equation modeling approach. Pharmacy Practice, 15(3), 999-999. doi:
10.18549/pharmpract.2017.03.999
26. Manfrin, A., Apampa, B., & Parthasarathy, P. (2019). A conceptual model for students’
satisfaction with team-based learning using partial least squares structural equation
modelling in a faculty of life sciences, in the United Kingdom. Journal Of Educational
Evaluation For Health Professions, 16, 36. doi: 10.3352/jeehp.2019.16.36
Andrea Manfrin UCLan copyright 2020
28 | P a g e
27. Hannane, A., Misane, L., Devouassoux, G., Colin, C., & Letrilliart, L. (2019). Asthma
patients’ perception on their care pathway: a qualitative study. Npj Primary Care
Respiratory Medicine, 29(1). doi: 10.1038/s41533-019-0121-2
28. Hindi, A., Parkhurst, C., Rashidi, Y., Ho, S., Patel, N., & Donyai, P. (2017). Development
and utilization of the Medicines Use Review patient satisfaction questionnaire. Patient
Preference And Adherence, 11, 1797-1806. doi: 10.2147/ppa.s146991
29. Krska, J., Nesbit, J., Baylie, K. & O’Kane, A. (2009). Patient views on the MUR service.
International Journal of Pharmacy Practice, 17(Supplement 1), A40-A42.
30. Bollen, K. A. (2002). Latent variables in psychology and the social sciences. Annual
Review of Psychology, 53(1), 605–634.
31. Sarstedt, M., Ringle, C. & Hair, J. (2017). Partial Least Squares Structural Equation
Modeling. Handbook of Market Research, 1-40. doi: 10.1007/978-3-319-05542-8_15-1.
32. Calvo-Mora, A., Leal, A., & Roldan, J.L. (2005). Relationships between the EFQM Model
Criteria: A Study in Spanish Universities. Total Quality Management and Business
Excellence, 16(6), 741–770.
33. Hussain, S., Fangwei, Z., Siddiqi, A., Ali, Z., & Shabbir, M. (2018). Structural Equation
Model for Evaluating Factors Affecting Quality of Social Infrastructure Projects.
Sustainability, 10(5), 1415. doi: 10.3390/su10051415
34. Krska, J., Nesbit, J., Baylie, K. & O’Kane, A. (2009). Patient views on the MUR service.
International Journal of Pharmacy Practice, 17(Supplement 1), A40-A42.
35. Manfrin, A., & Krska, J. (2018). Consistency and replicability of a pharmacist-led
intervention for asthma patients: Italian Medicines Use Review (I-MUR). Primary Health
Care Research & Development. https://doi.org/10.1017/S1463423618000580
Andrea Manfrin UCLan copyright 2020
29 | P a g e
36. Sarstedt, M., Hair, J.F., Ringle, C.M., Thiele, K.O., & Gudergan, S.P. (2016). Estimation
issues with PLS and CBSEM: where the bias lies! Journal of Business Research, 69(10),
3998-4010.
37. Gudergan, S. P., Ringle, C. M., Wende, S., & Will, A. (2008). Confirmatory Tetrad
Analysis in PLS Path Modeling, Journal of Business Research, 61(12), 1238-1249.
38. Bollen, K. A., & Ting, K.F. (2000). A Tetrad Test for Causal Indicators, Psychological
Methods, 5(1), 3-22.
39. Henseler, J., Ringle, C., & Sinkovics, R. (2009). The use of partial least squares path
modeling in international marketing. Advances In International Marketing, 277-319. doi:
10.1108/s1474-7979(2009)0000020014
40. Sarstedt, M., Ringle, C., Smith, D., Reams, R. & Hair, J. (2014). Partial least squares
structural equation modeling (PLS-SEM): A useful tool for family business
researchers. Journal of Family Business Strategy, 5(1),105-115.
https://doi.org/10.1016/j.jfbs.2014.01.002
41. Jöreskog, K. G. (1971). Simultaneous factor analysis in several populations.
Psychometrika, 36(4), 409–426
42. Tenenhaus, M., Esposito Vinzi, V., Chatelin, Y.M., & Lauro, C. (2005). PLS path
modeling. Computational Statistics & Data Analysis, 48(1), 159-205.
43. Hair, J.F., Hult, G.T.M., Ringle, C.M. & Sarstedt, M. (2017). A Primer on Partial Least
Squares StructuralEquation Modeling (PLS-SEM), 2nd ed. Thousand Oaks, CA: Sage.
44. Bagozzi, R.P., Yi, Y. (1988). On the evaluation of structural equation models. Journal of
the Academy of Marketing Science, 16(1), 74-94.
45. Henseler, J., Ringle, C., Sarstedt, M. (2014). A new criterion for assessing discriminant
validity in variance-based structural equation modeling. Journal of the Academy of
Marketing Science, 43(1),115-135. doi: 10.1007/s11747-014-0403-8

Andrea Manfrin UCLan copyright 2020
30 | P a g e
46. Hair, J., Risher, J., Sarstedt, M., Ringle, C. (2018). When to use and how to report the
results of PLS-SEM. European Business Review, 31(1), 2-24. DOI 10.1108/EBR-11-
2018-0203
47. Shmueli, G., Koppius, O.R. (2011). Predictive analytics in information systems research.
MIS Quarterly, 35(3), 553-572.
48. Rigdon, E.E. (2012). Rethinking partial least squares path modeling: in praise of simple
methods. Long Range Planning, 45(5-6), 341-358.
49. Cohen, J. (1988), Statistical Power Analysis for the Behavioral Sciences: Lawrence
Erlbaum Associates.
50. Shmueli, G., Ray, S., Velasquez Estrada, J. Chatla, S. (2016). The elephant in the room:
Predictive performance of PLS models. Journal of Business Research, 69(10), 4552-4564.
51. The Scottish Office. (1999). Clinical Pharmacy Practice in Primary Care. National Health
Service in Scotland. Available from:
http://www.elib.scot.nhs.uk/portal/upload/Clin_Pharm_Pract_Prim_Care.pdf
52. Krska, J., Cromarty, J.A., Arris, F,, Jamieson, D., & Hansford, D. (2000). Providing
pharmaceutical care using a systematic approach. Pharmaceutical Journal, 265, 656–60.
53. Herborg, H., Soendergaard, B., Jorgenaen, T., Fonneabaek, L., Hepler, C., Holst, H., &
Froekjaer, B. (2001). Improving Drug Therapy for Patients with Asthma-Part 2: Use of
Antiasthma Medications. Journal Of The American Pharmaceutical Association (1996),
41(4), 551-559. doi: 10.1016/s1086-5802(16)31279-7
54. Schulz, M., Verheyen, F., Mühlig, S., Müller, J., Mühlbauer, K., Knop-Schneickert, E.,
Petermann, F., & Bergmann, K. (2001). Pharmaceutical care services forasthma patients:
a controlled intervention study. The Journal of Clinical Pharmacology, 41, 668–676.
55. Wang, X., Chen, J., Burström, B. & Burström, K. (2019). Exploring pathways to
outpatients’ satisfaction with health care in Chinese public hospitals in urban and rural
Andrea Manfrin UCLan copyright 2020
31 | P a g e
areas using patient-reported experiences. International Journal for Equity in Health, 18(1).
DOI: 10.1186/s12939-019-0932-3.
56. Amankwah, O., Weng-Wai, C., & Mohammed, A. (2019). Modelling the Mediating Effect
of Health Care Healing Environment on Core Health Care Delivery and Patient
Satisfaction in Ghana. Environmental Health Insights, 13, 117863021985211. doi:
10.1177/1178630219852115
57. Fahmi Khudair I., Asif Raza S. (2013). Measuring patients' satisfaction with
pharmaceutical services at a public hospital in Qatar. International Journal of Health Care
Quality Assurance, 26(5), 398-419.
58. Sahin, B., Yilmaz, F., & Lee, K. (2006). Factors Affecting Inpatient Satisfaction:
Structural Equation Modeling. Journal of Medical Systems, 31(1):9-16.
59. Hasan, S., Sulieman, H., Stewart, K., Chapman, C., Hasan, M., & Kong, D. (2013).
Assessing patient satisfaction with community pharmacy in the UAE using a newly-
validated tool. Research In Social And Administrative Pharmacy, 9(6), 841-850. doi:
10.1016/j.sapharm.2012.10.002
Ethics approval and consent to participate
This study was conducted according to the principles expressed in the Declaration of Helsinki
and obtained ethical approval (ref. No 024S12/13) by the University of Kent Faculty of
Sciences Research Ethics Advisory Group for Human Participants.
Consent for publication
Written consent for publishing the results was obtained from patients and pharmacists before
their enrolment in the study.

Andrea Manfrin UCLan copyright 2020
32 | P a g e
Availability of data and material
Data supporting the conclusions of this article can be found in the University of Central
Lancashire (UCLan) Academic Repository (CloK).
Competing interests
The authors declare that they have no competing interests
Funding
The study was funded by the Italian Pharmacists' Federation (FOFI), which played no role in
the study design and the collection, analysis, and interpretation of data and the writing of the
article and the decision to submit it for publication.
Author's contribution
Andrea Manfrin (AM) was the Principal Investigator (PI) who conceived and designed the
study, developed the conceptual model, performed the analysis, drafted the paper and acts as
the guarantor for this study.
Acknowledgements
The author is grateful to the Italian pharmacists, general practitioners and consultants, patients
and all other people who have been involved in this study. The author is deeply thankful to
professor Gordon Becket for editing the manuscript.