article developmental and cellular age direct conversion
TRANSCRIPT

ARTICLE
Developmental and cellular age direct conversion ofCD4+ T cells into RORγ+ or Helios+ colon Treg cellsAlvin Pratama1,2, Alexandra Schnell2, Diane Mathis1,2, and Christophe Benoist1,2
RORγ+ and Helios+ Treg cells in the colon are phenotypically and functionally distinct, but their origins and relationships arepoorly understood. In monocolonized and normal mice, single-cell RNA-seq revealed sharing of TCR clonotypes between theseTreg cell populations, potentially denoting a common progenitor. In a polyclonal Treg cell replacement system, naiveconventional CD4+ (Tconv) cells, but not pre-existing tTregs, could differentiate into RORγ+ pTregs upon interaction with gutmicrobiota. A smaller proportion of Tconv cells converted into Helios+ pTreg cells, but these dominated when the Tconv cellsoriginated from preweaning mice. T cells from infant mice were predominantly immature, insensitive to RORγ-inducingbacterial cues and to IL6, and showed evidence of higher TCR-transmitted signals, which are also characteristics of recentthymic emigrants (RTEs). Correspondingly, transfer of adult RTEs or Nur77high Tconv cells mainly yielded Helios+ pTreg cells,recapitulating the infant/adult difference. Thus, CD4+ Tconv cells can differentiate into both RORγ+ and Helios+ pTreg cells,providing a physiological adaptation of colonic Treg cells as a function of the age of the cell or of the individual.
IntroductionRegulatory T (Treg) cells that express the transcription factor(TF) FoxP3 are important players in maintaining immunologicalhomeostasis in the intestines (Sharma and Rudra, 2018; Russler-Germain et al., 2017; Tanoue et al., 2016). They can be dividedinto two major subsets based on their expression of additionalTFs. The first expresses the nuclear hormone receptor RORγ andthe TF c-Maf (Ohnmacht et al., 2015; Sefik et al., 2015; Yanget al., 2016; Yissachar et al., 2017; Xu et al., 2018; Neumannet al., 2019; Wheaton et al., 2017), which are also key regu-lators for Th17 cells and group 3 innate lymphoid cells (Sawaet al., 2010; Spits and Cupedo, 2012; Ivanov et al., 2006). RORγ+
Treg cells predominate in the colon, and their induction is highlydependent on commensal bacteria through molecular mediatorsthat remain uncertain but may involve cross-talk with the en-teric nervous system (Yissachar et al., 2017). The second subsetexpresses Helios and Gata3 and predominates in the small in-testine (Wohlfert et al., 2011; Schiering et al., 2014; Sefik et al.,2015; Ohnmacht et al., 2015). Accumulation of Helios+ Treg cellsdoes not require the microbiota. Rather, they express the re-ceptor for IL33 (also known as ST2), expand in response to thiscytokine (Schiering et al., 2014; He et al., 2017), and are henceconnected to IL33-inducing stress pathways (Peine et al., 2016;Molofsky et al., 2015). RORγ+ and Helios+ Treg cells have non-redundant functions, as genetic inactivation of RORγ+ Treg cells
results in increased proinflammatory cytokine production atbaseline and in greater susceptibility in colitis models (Sefiket al., 2015; Ohnmacht et al., 2015; Neumann et al., 2019).
The origins of, and the relationship between, RORγ+ andHelios+ Treg cells are still incompletely understood. Helios isoften considered to be a marker for Treg cells generated in thethymus (tTreg cells; Thornton et al., 2010). Although this rela-tion is known to have exceptions (Akimova et al., 2011;Gottschalk et al., 2012), it suggests that colonic Helios+ Treg cellsare tTreg cells, similar to those found in lymphoid organs. Incontrast, the lack of Helios in RORγ+ Treg cells, their inductionby gut bacteria, and their delayed appearance in the gut onlyafter colonization by an adult microbiota led to the initial sug-gestion that this population was peripherally generated Treg(pTreg) cells. Indeed, experimental conversion of FoxP3− con-ventional CD4+ T cells (Tconv cells), in vitro and in vivo, sup-ported this notion (Nutsch et al., 2016; Solomon and Hsieh, 2016;Yang et al., 2018). The two Treg cell subsets should then be quitedistinct in terms of their differentiation pathways, and hence oftheir TCRs. This dichotomy was in line with earlier studiesshowing that microbe-responsive Treg cells were not positivelyselected with any efficiency in the thymus, but appeared only inthe periphery (Lathrop et al., 2011; Geuking et al., 2011; Atarashiet al., 2011). However, several lines of evidence later suggested
.............................................................................................................................................................................1Department of Immunology, Harvard Medical School, Boston, MA; 2Evergrande Center for Immunological Diseases, Harvard Medical School and Brigham and Women’sHospital, Boston, MA.
Correspondence to Diane Mathis and Christophe Benoist: [email protected]; A. Pratama’s present address is Torque Therapeutics, Cambridge, MA.
© 2019 Pratama et al. This article is distributed under the terms of an Attribution–Noncommercial–Share Alike–No Mirror Sites license for the first six months after thepublication date (see http://www.rupress.org/terms/). After six months it is available under a Creative Commons License (Attribution–Noncommercial–Share Alike 4.0International license, as described at https://creativecommons.org/licenses/by-nc-sa/4.0/).
Rockefeller University Press https://doi.org/10.1084/jem.20190428 1
J. Exp. Med. 2019
Dow
nloaded from http://rupress.org/jem
/article-pdf/217/1/e20190428/874910/jem_20190428.pdf by guest on 06 February 2022

more intricate relationships between Helios+ and RORγ+ Tregcells. First, RORγ could be induced in tTreg cells by TCR-mediated activation in vitro in the presence of IL6 (Kim et al.,2017; Yang et al., 2018), which is of potential relevance becauseRORγ+ Treg cells depend on IL6 in vivo (Ohnmacht et al., 2015;Yissachar et al., 2017). Second, using a transgenic mouse modelexpressing a TCR reactive to an antigen of microbial origin,Hsieh and colleagues showed that Tconv cells could be effi-ciently converted in vitro and in vivo by exposure to cognatemicrobial antigen,mostly to RORγ+ Treg cells via a FoxP3+RORγ−
intermediate (Nutsch et al., 2016; Solomon and Hsieh, 2016),thus suggesting that colonic Treg cells of Helios+ and RORγ+
phenotypes might be interconnected.Here, we revisited the relationships between colonic Treg cell
and Tconv populations by exploiting the potential of single-cellRNA sequencing (scRNA-seq) to provide detailed phenotypicand specificity information on colonic T cells from normal mice,and by using a Treg cell replacement strategy to elucidate therelationships between RORγ+ Treg cells, Helios+ Treg cells, andTconv cells. There was substantial sharing of TCRs betweenHelios+ Treg cells and RORγ+ Treg cells, hinting at a commonprecursor. We observed robust conversion from Tconv cells toboth Helios+ and RORγ+ pTreg cells, the balance between the twodepending on the age and maturity of the starting naive Tconvcells. This dichotomy conditioned the sequential colonization bythe two colonic Treg cell populations in developing mice, whichmay thus play temporally complementary roles in immune ho-meostasis in the colon.
ResultsShared TCR specificities between Tconv, RORγ+, and Helios+
Treg cellsIn general, the TCR repertoires of tTreg cell and Tconv cells arenonoverlapping (Hsieh et al., 2004; Pacholczyk et al., 2006;Wong et al., 2007; Liu et al., 2009). Therefore, according to thehypothesis that RORγ+ Treg cells are pTreg cells and that Helios+
Treg cells are tTreg cells, one would expect some overlap be-tween the repertoires of Tconv cells and RORγ+ Treg cells, butnot with Helios+ Treg cells. Consistent with this notion, Solomonand Hsieh (2016) reported mostly distinct TCRα repertoires inRORγ+ versus other Treg cells in mice carrying a single-chainTCRβ transgene with reactivity to a bacterial peptide (Solomonand Hsieh, 2016), although in fact ≤20% of CDR3 motifs werefound in both Treg cell populations. To re-examine this questionin the context of polyclonal repertoires, we leveraged our pre-vious adaptation of the InDrop protocol for scRNA-seq (Zilioniset al., 2017; Zemmour et al., 2018) to obtain both the tran-scriptome and the TCRα and β variable region sequences fromindividual cells. We used the particular context of germ-free(GF) mice monocolonized with an RORγ+ Treg cell–inducingmicrobe (Sefik et al., 2015; Geva-Zatorsky et al., 2017) to facili-tate the TCR repertoire analysis by restricting the potentialantigenic diversity. We thus obtained data that met the usualquality-control criteria (Fig. S1, A and B) for 1,102 CD4+ T cellsfrom the colon lamina propria (LP) 2 wk after monocolonizationwith Bacteroides thetaiotaomicron. The transcriptomes were used
to parse these cells into either the Treg cell or Tconv cell subsets(Fig. 1 A) using the integrated expression of gene sets identifiedin a recent study (DiSpirito et al., 2018; Table S1). Of the 142colonic T cells for which both TCRα and TCRβ sequences couldbe determined unambiguously, we found 14 clonotypes sharedby two or more cells (repetition defined here as identical TCRαand TCRβ V and joining nucleotide sequences). The CDR3 se-quences of these repeated clonotypes included N-region diver-sity, indicating a common origin rather than a recurringrecombination-driven rearrangement (Komori et al., 1993).Some of these repeated clonotypes were found only in RORγ+
Treg cells (Fig. 1 B, top left), but many were shared between twocell types, most often RORγ+ Treg cells and Tconv cells (Fig. 1, Band C; and Table S1). One particularly frequent clonotype wasfound in all three subsets (Fig. 1 B, bottom right). These resultssupport the notion that RORγ+ Treg cells can convert periph-erally from Tconv cells when the inducing microbe is introducedinto GF mice, and also suggest that RORγ+ and Helios+ Treg cellsmight be more closely related developmentally than previouslythought. We also analyzed single Treg cells from colonic LP ofnormal specific pathogen–free (SPF) mice (Zemmour et al.,2018). Although repeated clonotypes were less frequent thanin monocolonized mice, as expected, shared clonotypes werefound in RORγ+ and Helios+ Treg cells (Fig. 1 D and Table S1),generalizing the above observations.
Conventional naive CD4+ T cells differentiate mainly, but notexclusively, into RORγ+ Treg cells in the colonTo directly analyze the relationships between the various T cellpopulations in the colon, we used a novel cell-transfer strategy,opting for several characteristics. First, cell donors were non-transgenic mice, for a broad perspective. Second, we did not useRAG-deficient hosts, in which immunological organs are poorlyformed and Treg cells are unstable (indeed, Nutsch et al. [2016]have demonstrated that alymphoid hosts do not support pTregcell formation); we also wished to avoid irradiated hosts, inwhich damage to the radio-sensitive colonic epithelium wouldconfound the results. Rather, we used a “Treg cell replacement”protocol, wherein Treg cells or Tconv cells originating fromwild-type mice were injected into a Foxp3dtr host, at the sametime as endogenous Treg cells were being eliminated by treat-ment with diphtheria toxin (DT), i.e., before severe auto-inflammatory symptoms of Treg cell deficiency. In practice, wesorted and transferred 106 naive Tconv cells or 105 Treg cellsfrom pooled spleen and LNs of Foxp3gfp reporter mice into con-genically marked Foxp3dtr hosts (Kim et al., 2007) immediatelyafter onset of DT treatment (Fig. 2 A; note that treatment withDT eliminated both RORγ+ and Helios+ Treg cells from the colonof these hosts [Fig. S2 A]). 2 wk after transfer, all donor Tregcells remained FoxP3+ (Fig. 2 A, top) in both the spleen and colon(tabulated in Fig. 2 B). In the colon, these cells maintained anRORγ− Helios+ phenotype, indicating that Helios+ Treg cells donot readily become RORγ+ in spite of a competent microbiota inthe gut of these hosts (Fig. S2 A). In contrast, 30–40% of donorTconv cells converted into pTreg cells (Fig. 2, A and B). In thespleen, almost all of these pTreg cells were RORγ− Helios+; in thecolon, most (∼60%) donor-derived pTreg cells up-regulated
Pratama et al. Journal of Experimental Medicine 2
Time matters for pTreg cells https://doi.org/10.1084/jem.20190428
Dow
nloaded from http://rupress.org/jem
/article-pdf/217/1/e20190428/874910/jem_20190428.pdf by guest on 06 February 2022

RORγ, although 10–20% expressed Helios (Fig. 2, A and B; thesealso expressed Gata3 as expected). Unlike previous studies(Nutsch et al., 2016; Solomon and Hsieh, 2016), we did not ob-serve donor-derived RORγ+ Treg cells in the mesenteric LNs(Fig. S2 B), suggesting that conversion probably occurs directlyin the colonic LP. Donor T cells needed to be naive for conversionto occur effectively in this system, as CD4+ T cells withCD44hiCD62Llo phenotypes yielded few pTreg cells (Fig. S2 C).We assessed the impact of the intestinal microbiota on theseconversion events by also treating recipient mice with a broad-spectrum antibiotic combination of vancomycin, metronidazole,neomycin, and ampicillin (VMNA). The numbers of convertedRORγ+ pTreg cells were severely curtailed by VMNA pretreat-ment of the hosts, and there was also a modest but significantreduction in the numbers of Helios+ pTreg cells (Fig. 2 C). These
results support the notion that RORγ+ and Helios+ pTreg cellscan arise from Tconv cells under the influence of microbes,which is compatible with the TCR sequencing results.
A previous analysis of conversion of microbe-specific T cellsshowed that a FoxP3+ Treg cell population appeared 3 d beforeRORγ+ Treg cells, suggesting that RORγ+ Treg cells may differ-entiate from a FoxP3+RORγ− intermediate (Solomon and Hsieh,2016). To better trace the relationship between Treg cell subsets,we evaluated the kinetics of conversion in our Treg cell re-placement system. The bulk of donor Tconv cells resided in thespleen during the first few days after transfer, but distinct pTregcell populations started to accumulate after day 6 (Fig. 3, A–C;and Fig. S2 D), largely synchronously in the colon and the spleen(Fig. 3, B and C). This timeframe was consistent with results in atransgenic model (Solomon and Hsieh, 2016). The appearance of
Figure 1. Shared TCR clonotypes between Tconv, RORγ+, and Helios+ Treg cells. (A) scRNA-seq was performed to determine both transcriptome andTCRα and β sequences of CD4+ T cells from the colon LP of B. thetaiotaomicron–monocolonized mice. Each cell is shown as a dot on the dimensionalityreduction plot (tSNE), color-coded according to its relative expression of the indicated gene signatures. Based on these profiles, four cell clusters wereidentified (right). (B) Cells expressing one of four recurrent TCRαβ clonotypes; colored dots show their position on the same tSNE plots as in A. V/J alleles andCDR3 sequences are indicated above each plot. (C and D) Repeated TCR clonotypes shared by various T cell subsets in B. thetaiotaomicron–monocolonizedmice (C) or SPF B6 mice (D). Data in C are pooled from two independent experiments.
Pratama et al. Journal of Experimental Medicine 3
Time matters for pTreg cells https://doi.org/10.1084/jem.20190428
Dow
nloaded from http://rupress.org/jem
/article-pdf/217/1/e20190428/874910/jem_20190428.pdf by guest on 06 February 2022
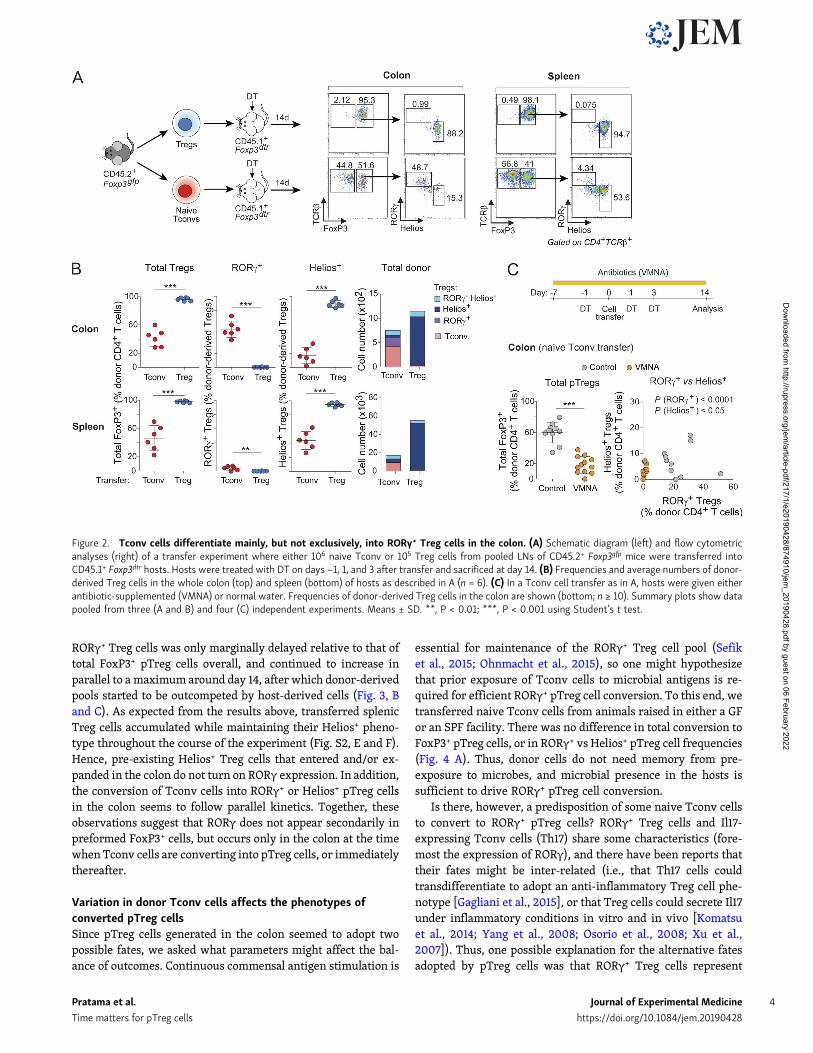
RORγ+ Treg cells was only marginally delayed relative to that oftotal FoxP3+ pTreg cells overall, and continued to increase inparallel to a maximum around day 14, after which donor-derivedpools started to be outcompeted by host-derived cells (Fig. 3, Band C). As expected from the results above, transferred splenicTreg cells accumulated while maintaining their Helios+ pheno-type throughout the course of the experiment (Fig. S2, E and F).Hence, pre-existing Helios+ Treg cells that entered and/or ex-panded in the colon do not turn on RORγ expression. In addition,the conversion of Tconv cells into RORγ+ or Helios+ pTreg cellsin the colon seems to follow parallel kinetics. Together, theseobservations suggest that RORγ does not appear secondarily inpreformed FoxP3+ cells, but occurs only in the colon at the timewhen Tconv cells are converting into pTreg cells, or immediatelythereafter.
Variation in donor Tconv cells affects the phenotypes ofconverted pTreg cellsSince pTreg cells generated in the colon seemed to adopt twopossible fates, we asked what parameters might affect the bal-ance of outcomes. Continuous commensal antigen stimulation is
essential for maintenance of the RORγ+ Treg cell pool (Sefiket al., 2015; Ohnmacht et al., 2015), so one might hypothesizethat prior exposure of Tconv cells to microbial antigens is re-quired for efficient RORγ+ pTreg cell conversion. To this end, wetransferred naive Tconv cells from animals raised in either a GFor an SPF facility. There was no difference in total conversion toFoxP3+ pTreg cells, or in RORγ+ vs Helios+ pTreg cell frequencies(Fig. 4 A). Thus, donor cells do not need memory from pre-exposure to microbes, and microbial presence in the hosts issufficient to drive RORγ+ pTreg cell conversion.
Is there, however, a predisposition of some naive Tconv cellsto convert to RORγ+ pTreg cells? RORγ+ Treg cells and Il17-expressing Tconv cells (Th17) share some characteristics (fore-most the expression of RORγ), and there have been reports thattheir fates might be inter-related (i.e., that Th17 cells couldtransdifferentiate to adopt an anti-inflammatory Treg cell phe-notype [Gagliani et al., 2015], or that Treg cells could secrete Il17under inflammatory conditions in vitro and in vivo [Komatsuet al., 2014; Yang et al., 2008; Osorio et al., 2008; Xu et al.,2007]). Thus, one possible explanation for the alternative fatesadopted by pTreg cells was that RORγ+ Treg cells represent
Figure 2. Tconv cells differentiate mainly, but not exclusively, into RORγ+ Treg cells in the colon. (A) Schematic diagram (left) and flow cytometricanalyses (right) of a transfer experiment where either 106 naive Tconv or 105 Treg cells from pooled LNs of CD45.2+ Foxp3gfp mice were transferred intoCD45.1+ Foxp3dtr hosts. Hosts were treated with DT on days −1, 1, and 3 after transfer and sacrificed at day 14. (B) Frequencies and average numbers of donor-derived Treg cells in the whole colon (top) and spleen (bottom) of hosts as described in A (n = 6). (C) In a Tconv cell transfer as in A, hosts were given eitherantibiotic-supplemented (VMNA) or normal water. Frequencies of donor-derived Treg cells in the colon are shown (bottom; n ≥ 10). Summary plots show datapooled from three (A and B) and four (C) independent experiments. Means ± SD. **, P < 0.01; ***, P < 0.001 using Student’s t test.
Pratama et al. Journal of Experimental Medicine 4
Time matters for pTreg cells https://doi.org/10.1084/jem.20190428
Dow
nloaded from http://rupress.org/jem
/article-pdf/217/1/e20190428/874910/jem_20190428.pdf by guest on 06 February 2022

“exTh17” cells. We tested this hypothesis using Il17 fate-mappingmice (Il17aCregfp × Rosa26tdTomato; Hirota et al., 2011), which havetdTomato+ (tdT+) cells in which the Il17a locus was active at sometime in their past, and a smaller fraction of tdT+GFP+ Th17 cellsin which it is currently active (Fig. 4 B). TdT+ and tdT− Tconvcells from these mice were introduced into the Treg cell re-placement system as above. Interestingly, tdT+ Tconv cellsconverted with lower efficiency than did their tdT− counterparts(Fig. 4 C, left), but their progeny included a markedly higherproportion of RORγ+ Treg cells (Fig. 4 C, right), likely resultingfrom their pre-existing expression of RORγ (Fig. S3 A). Impor-tantly, however, tdT− Tconv cells still gave rise to high pro-portions of RORγ+ Treg cells. Thus, Tconv cells do not need to beex-Th17 to convert into RORγ+ Treg cells. To analyze the rela-tionship further, we examined colonic Treg cells isolated di-rectly from the Il17a fate-reporter mice (Fig. 4 D). All of theHelios+ Treg cells were tdT−, suggesting an origin independentof Th17 cells. Some of the RORγ+ Treg cells were tdT+, in linewith the transfer data, but these cells were clearly a small mi-nority. Thus, while prior activity of the Il17a locus, and mostlikely of Rorc, can predispose Tconv cells to conversion to RORγ+
Treg cells, this is not a prerequisite for most cells.We and others have shown that the proportions of RORγ+ and
Helios+ Treg cells in the colon evolve with age. Virtually all co-lonic Treg cells are Helios+ in neonatal and infantmice, as RORγ+
Treg cells start to appear only at ∼15 d of age in SPF conditions(Sefik et al., 2015; Nutsch et al., 2016). It was assumed that thisswitch is tied to the profound changes in the composition of the
gut microbiota that occur around weaning, and there was evi-dence for this interpretation (Nutsch et al., 2016). Nevertheless,we asked whether Tconv cells from young mice might also bemore inclined than adult Tconv cells to convert into Helios+
pTreg cells. Naive Tconv cells from mice of different ages weretransferred into adult Foxp3dtr recipients, DT-treated as above.Strikingly, naive CD4+ T cells from infant mice (defined here-after as 10–14 d of age), while converting into Treg cells moreefficiently overall than those of adults (Fig. 5 A, left), mostlyturned into Helios+ pTreg cells and were largely refractory toRORγ expression (Fig. 5 A, middle). In contrast, naive T cellsfrom adult mice (35–150 d old) exhibited less Treg cell conver-sion in the same experiments, but predominantly to RORγ+ Tregcells. Interestingly, this transition occurred progressively overtime, rather than abruptly around the weaning period (Fig. 5 A).
To determine whether this difference was Tconv cell–intrinsic, or resulted from intercrine effects, we transferred a1:1 mix of congenically marked naive Tconv cells from adult andinfant mice into Foxp3dtr hosts. The same distinction betweeninfant and adult Tconv cell fates was observed after mixedtransfer: in the same mouse, Tconv cells of infant origin con-verted more efficiently and mostly into Helios+ pTreg cells,while cells of adult origin mainly turned into RORγ+ pTreg cells(Fig. 5 B). Thus, even when being in the same host and in thepresence of the same adult microbiota, there is a strong cell-intrinsic effect controlling the fate of infant or adult Tconv cells.
The Treg cell replacement system was designed to test thefate of polyclonal T cell pools in a nonirradiated host with
Figure 3. Donor Tconv cells up-regulate FoxP3 and RORγ at around the same time in the colon. (A) Representative dot plots of donor CD4+ T cells in thecolon (top) and spleen (bottom) of Foxp3dtr recipients at different days following naive T cell transfer, per Fig. 2 A. (B and C) Frequencies (left) and averagenumbers (right) of donor-derived Treg cells in the colon (B) and spleen (C) of recipients described in A (n ≥ 3 for each time point). Summary plots show datapooled from three independent experiments. Means ± SD.
Pratama et al. Journal of Experimental Medicine 5
Time matters for pTreg cells https://doi.org/10.1084/jem.20190428
Dow
nloaded from http://rupress.org/jem
/article-pdf/217/1/e20190428/874910/jem_20190428.pdf by guest on 06 February 2022

normal lymphoid structures. One caveat, however, is that this isa setting in which conversion to pTreg cells is stimulated by thestrong homeostatic drive to restore Treg cell pools (Kim et al.,
2007; Feuerer et al., 2009), which might influence the outcome.We thus sought to validate our findings using unmanipulated B6mice as hosts. As expected (Yang et al., 2018; Solomon andHsieh, 2016), the extent of pTreg cell conversion was greatlydiminished compared with that of Foxp3dtr hosts, presumablyowing to limitations in niche size (Fig. 5 C and Fig. S3, B–D),which was particularly true after transferring naive Tconv cellsfrom infant donors. Naive T cells from adult donors again gaverise predominantly to RORγ+ Treg cells, with no Helios+ Tregcells whatsoever (Fig. 5 C). Due to the very low cell numbers, thephenotype of pTreg cells derived from Tconv cells of infant micewas difficult to reliably evaluate (Fig. 5 C and Fig. S3 B), butmostappeared to be RORγ−. These data confirm, in a Treg cell–repleteenvironment, the differential ability of infant and adult Tconvcells to become RORγ+ pTreg cells.
Mechanism of differential infant versus adult conversion topTreg cellsHaving found that pTreg cells originating from adult or infantprecursors adopted different phenotypes, we asked whatmolecular parameters might distinguish them. First, we as-sessed whether differentiation of Tconv cells from infant miceinto Helios+ Treg cells is microbe-dependent, as are adultRORγ+ pTreg cells. Naive Tconv cells from adult or infant micewere transferred into Foxp3dtr recipients, half of which weretreated with VMNA as above (Fig. 6 A). In contrast to adultTconv cells, for which both overall conversion and RORγ+
pTreg cell proportions were strongly inhibited by antibiotictreatment as expected, conversion from infant Tconv cells waslargely unaltered and resulted in Helios+ pTreg cells as incontrol mice. This difference confirms that infant Tconv cellsare insensitive to the microbe-derived cues that induce Rorcexpression in adult-derived Tconv cells. The observation alsoimplies that the Helios+ phenotype may be a default pathwayadopted in the absence of, or in the inability to sense, RORγ-inducing cues.
IL6 is important for the generation or maintenance of RORγ+
Treg cells, with a twofold reduction in its absence (Ohnmachtet al., 2015; Yissachar et al., 2017), an effect that can be re-produced in vitro (Kim et al., 2017; Yang et al., 2018). Wecompared the role of IL6 signals in Treg cell conversion frominfant or adult naive T cells using Il6rafl/flxCd4Cre mice. IL6Rdeficiency in naive Tconv cells of adult donors slightly in-creased donor-derived pTreg cell numbers in the colon, con-sistent with reports of pTreg cell inhibition by IL6 (Bettelliet al., 2006; Mangan et al., 2006), but with a significantlylower proportion of RORγ+ Treg cells (and correspondinglymore Helios+ Treg cells; Fig. 6 B). These trends were not ob-served when young donor cells were used, with no differencebetween IL6R-deficient mice and their proficient littermates.Therefore, IL6-mediated signaling is important for conversionof Tconv cells from adult mice into RORγ+ Treg cells, but not forthose from infant mice, possibly because IL6 signaling path-ways are not yet active at this stage. Overall, the differentialsensitivity to microbes and to IL6 suggests that pTreg cellconversion from adult and infant Tconv cells is regulated bydistinct molecular checkpoints.
Figure 4. Variation in donor Tconv cells affects the phenotypes ofconverted pTreg cells. (A) Frequencies of donor-derived Treg cells in thecolon of Foxp3dtr hosts that received naive T cells from SPF or GF mice (n = 6).(B and C) Il17 fate-mapping mice were used as donors in the Treg cell re-placement experiment. (B) Simplified diagram of Il17a and Rosa26 loci in thesemice, and representative dot plot of Tconv cells showing tdT and GFP ex-pression. (C) Transfer strategy and frequencies of donor-derived Treg cells inFoxp3dtr hosts that received 2.5 × 10⁵ tdT−, tdT+, or total Tconv cells (n ≥ 4).(D) TdT expression among RORγ+ and Helios+ colonic Treg cells from Il17afate-mapping mice (n = 4). Summary plots show data pooled from two (A andD) and four (C) independent experiments. Means ± SD. *, P < 0.05; **, P <0.01; ***, P < 0.001 using Student’s t test. IRES, internal ribosome entry site;loxP, locus of X-over P1; CAG, hybrid construct consisting of the cytomega-lovirus enhancer fused to the chicken beta-actin promoter.
Pratama et al. Journal of Experimental Medicine 6
Time matters for pTreg cells https://doi.org/10.1084/jem.20190428
Dow
nloaded from http://rupress.org/jem
/article-pdf/217/1/e20190428/874910/jem_20190428.pdf by guest on 06 February 2022

Why can’t Tconv cells from infant mice give rise to RORγ+ Tregcells?The striking change over time in naive CD4+ T cells’ ability toconvert to RORγ+ Treg cells had significant implication for set-ting the immunoregulatory tone in the colon, so it was impor-tant to decipher the underlying mechanisms. First, we askedwhether the difference might be due simply to the higher pro-portion of “Il17a-experienced” cells in adult mice, which wasreadily evidenced in the Il17a fate-reporter mice (Fig. 7 A).However, when this difference was factored out by sorting onlynaive tdT− Tconv cells from both adult and infant mice, higherproportions of RORγ+ pTreg cells still emerged from Tconv cellsfrom adults relative to infants (Fig. 7 B). Hence the skewedconversion into RORγ+ Treg cells from adult Tconv cells isnot simply due to more abundant Il17a-experienced cells inadult mice.
Young animals naturally possess a high proportion of T cellsthat have recently emerged from the thymus, known as recentthymic emigrants (RTEs; Fink, 2013; Cunningham et al., 2018).RTEs have a distinct phenotype compared with mature naiveT cells; for example, CD4+ RTEs produced less IL2 and IFNγ thantheir mature naive counterparts and had a bias toward T helper(Th) type 2 cell responses (Hendricks and Fink, 2011; Bhaumiket al., 2013; Friesen et al., 2016). Pertinent to this study, RTEs hadan increased tendency to convert into Treg cells, especially whenthe Treg cell niche was empty (Bhaumik et al., 2013; Paiva et al.,
2013), in part due to lower sensitivity to inhibitory cytokineslike IL6 (Paiva et al., 2013) or IFNγ (Bhaumik et al., 2013). Hence,a plausible hypothesis was that the higher number of RTEs inyoung donors caused the difference in RORγ+ versus Helios+
pTreg cells. We labeled RTEs in adult mice by intrathymic FITCinjection (Scollay et al., 1980) and sorted FITC-labeled naiveTconv cells and corresponding FITC− bulk cells from LNs 24 hlater (Fig. 7 C) for Treg cell replacement in DT-treated Foxp3dtr
hosts. 2 wk later, RTEs had converted into Treg cells more ef-fectively than non-RTEs, and they up-regulated Helios instead ofRORγ (Fig. 7 C). Similarly, CD4 single-positive thymocytesshowed a high propensity for pTreg cell differentiation, pre-dominantly to a Helios+ phenotype (Fig. 7 D). Although all donorcells here were from adult mice, the outcome recapitulated theinfant/adult dichotomy, suggesting that the cell-autonomousdecision between Helios+ or RORγ+ pTreg cell fate largelydepends on the developmental maturity of the precursorTconv cells.
In an attempt to elucidate the molecular mechanisms thatdrive immature and mature Tconv cells to different pTreg cellfates, we first measured the expression of FoxP3, RORγ, andHelios on naive Tcells from mice of different ages. There was noage-dependent difference in any of these molecules (Fig. S4 A).For a broader approach, we compared the transcriptomes ofnaive CD4+ T cells from infant and adult mice by low-input RNA-seq (in biological triplicates). The differences (Fig. 8 A) were
Figure 5. Naive T cells from infant mice are predisposed to convert into Helios+ Treg cells in Treg cell–depleted hosts. (A) Frequencies and averagenumbers of donor-derived Treg cells in the whole colon of Foxp3dtr hosts that received naive T cells frommice of different ages (n ≥ 4). (B) A 1:1 mixture of naiveT cells from CD45.1+ adult and CD45.2+ infant donors were transferred into CD45.1/2+ Foxp3dtr hosts. Representative dot plots of colonic Tconv (left) and Tregcells (middle) and frequencies of donor-derived Treg cells (right) are shown. Linked data points are from the same recipients (n = 4). (C) Frequencies of donor-derived Treg cells in the colon of unmanipulated B6 hosts (left) that received naive Tconv cells from adult or infant donors 7 d after transfer (n = 8). Due to lowpTreg cell numbers after transfer of infant Tconv into normal hosts, only frequencies of RORγ+ and Helios+ pTreg cells from adult Tconv cells are shown (right).Summary plots show data pooled from two (B) and four (A and C) independent experiments. Means ± SD. P < 0.0001 using one-way ANOVA (A); *, P < 0.05; **,P < 0.01; ***, P < 0.001 using Student’s t test (B and C).
Pratama et al. Journal of Experimental Medicine 7
Time matters for pTreg cells https://doi.org/10.1084/jem.20190428
Dow
nloaded from http://rupress.org/jem
/article-pdf/217/1/e20190428/874910/jem_20190428.pdf by guest on 06 February 2022

surprisingly extensive (212 and 277 transcripts up- or down-regulated at an arbitrary FoldChange of 2 and false discoveryrate of 0.1). As expected (Boursalian et al., 2004; Houston andFink, 2009), these included differences in maturation markers(Cd24a and H2-Q7). We noted an overexpression in infant Tconvcells of several transcripts indicative of activation through theTCR (Nr4a1, Cd5, Cd69, Dusp2, Dusp4, Myc, and Egr1). This wasfurther evidenced as a shift of a generic T cell activation sig-nature (Wakamatsu et al., 2013; highlighted in Fig. 8 A), andgene set enrichment analysis (GSEA) indicated a higher ex-pression in infant Tconv cells of genes related to mTORC1 sig-naling and of c-Myc targets (Fig. 8, A and B). Since theexpression of Nr4a1 (encodes Nur77; Moran et al., 2011; Baldwinand Hogquist, 2007) and Cd5 (Azzam et al., 1998) reflects thestrength of TCR signals, this difference might suggest that Tconvcells from infant mice perceive trophic TCR signals morestrongly than their adult counterparts.
To follow this lead from the transcriptome data, we usedNur77gfp knock-in mice, in which GFP levels reflect thestrength of TCR stimulation (Moran et al., 2011). Nur77GFPexpression was highest in naive T cells from infant mice anddecreased gradually with age (Fig. 8 C), with a time coursethat evoked the transitions in pTreg cell conversion seen inFig. 5 A. CD5 expression followed a similar trend (Fig. 8 D). Onthe other hand, the early activation gene CD69 seemed to in-crease slightly with age, suggesting that it is not the imme-diate engagement of TCR that underlies the difference, butrather the downstream integration reflected by Nr4a1 and Cd5levels.
Additionally, GSEA showed higher expression in adult Tconvcells of genes belonging to the IL6-JAK-STAT3 pathway (Fig. 8B), consistent with the requirement for IL6Rα in adult Tconv cellconversion (Fig. 6 B) and the higher expression of IL6Rα in adultnaive Tconv cells (Fig. S4 B). Naive CD4+ T cells expressingIL6Rα were predisposed to convert into RORγ+ Treg cells fol-lowing transfer into Foxp3dtr mice (Fig. S4 C). In contrast, theexpression of c-Maf, which has recently been shown to be im-portant for RORγ+ Treg cell differentiation (Xu et al., 2018;Neumann et al., 2019; Wheaton et al., 2017), did not change withage (Fig. 8 D). Similarly, the level of ST2 (the receptor for IL33),which is preferentially expressed by Helios+ Treg cells and im-portant for their expansion and stability (Schiering et al., 2014),remained low in all age groups analyzed (Fig. 8 D). These ob-servations underscore the contribution of IL6 signaling to theage-dependent difference in pTreg cell phenotypes.
To test the significance of these observations and validate therelationship between Tconv cell activation status and the re-sulting pTreg cell phenotypes, we introduced naive Tconv cellsfrom adult Nur77gfp mice into our Treg cell replacement systemafter sorting into three bins according to their intensity of GFPexpression (Fig. 9 A). The extent of Treg cell conversion wasproportional to the expression of GFP in donor cells, with infant-like Nur77GFPhi Tconv cells converting most efficiently toFoxP3+ Treg cells overall (Fig. 9 A, left) and yielding mostlyHelios+ pTreg cells (Fig. 9 A). Conversely, adult-like Nur77GFPlo
cells preferentially converted to RORγ+ pTreg cells. Similartrends were observed in the spleen of these mice, but onlyNur77GFPhi cells gave a substantial extent of pTreg cell
Figure 6. Several checkpoints distinguish infant and adult pTreg cell conversion. (A and B) Frequencies and average numbers of donor-derived Treg cellsin the colon of Foxp3dtr hosts that received naive T cells from infant or adult origin. (A) Recipients were treated, or not, with broad-spectrum antibiotics (perFig. 2 C; n ≥ 5; data for adult donors are the same as in Fig. 2 C). (B) Donor Tconv cells were from Il6rafl/flxCd4Cre (deficient in the IL6 receptor) or control Il6rafl/fl
littermates (n ≥ 3). Data are pooled from two (B) and three (A) independent experiments. Means ± SD. *, P < 0.05; **, P < 0.01; ***, P < 0.001 using Student’st test.
Pratama et al. Journal of Experimental Medicine 8
Time matters for pTreg cells https://doi.org/10.1084/jem.20190428
Dow
nloaded from http://rupress.org/jem
/article-pdf/217/1/e20190428/874910/jem_20190428.pdf by guest on 06 February 2022

conversion there (Fig. S5). Hence, the status of TCR signalingpathways in the naive Tconv cell progenitors determines theconversion into either RORγ+ or Helios+ pTreg cells.
In the experiments reported in Fig. 9 A, Nur77 may simplybe an indicator of the activation status of the cells, but onecould also hypothesize that it directly plays a role in deter-mining the difference in fate of Tconv cells upon conversion topTreg cells, which is plausible given its sizeable transcrip-tional footprint in T cells (Fassett et al., 2012; Liu et al., 2019;Chen et al., 2019). To distinguish between these scenarios, andto ask whether Nur77 can account for the difference betweeninfant and adult Tconv cells, we sorted naive Tconv cells frominfant or adult Nur77gfp mice in a matched window of GFPfluorescence (Fig. 9 B, left). If Nur77 was indeed the causalfactor, equalizing its expression should eliminate the differ-ence in pTreg cell subsets arising from infant and adult do-nors. In fact, while the percentage of total donor-derivedFoxP3+ Treg cells became comparable for infant and adultdonors, the relative proportion of RORγ+ pTreg cells remainedhigher for progeny from adult Tconv than from infant Tconvcells (Fig. 9 B). Hence, it is not Nur77 itself, but rather the cellactivation state that it reflects, that predetermines the
probability of converting Tconv cells to adopt RORγ+ or He-lios+ pTreg cell phenotypes.
DiscussionUsing a combination of TCR-based lineage tracing and directTreg cell replacement experiments, we have revisited the gen-eration of pTreg cells in the colon, focusing in particular on therelationships between the RORγ+ and Helios+ Treg cell subsets.The key conclusions are that naive Tconv cells have the capacityto convert into both RORγ+ and Helios+ Treg cells in the colon,and that the developmental maturity (or cell states) of thestarting Tconv cells determines the phenotype of the resultingpTreg cells. This study provides a new T cell–intrinsic per-spective into the ontogeny and regulation of the two main Tregcell subsets in the colon (Fig. 10).
Since the gut microbiota is important for RORγ+ Treg celldifferentiation, it was widely assumed that the appearance ofcolonic RORγ+ Treg cells around weaning (Nutsch et al., 2016;Sefik et al., 2015) was due solely to the profound changes inmicrobiota that result from the introduction of solid food. Wenow show that there are also T cell–intrinsic differences
Figure 7. Dominance of RTE phenotypes in Tconv cells from infant mice promotes Helios+ pTreg cell conversion. (A) Representative dot plots of LNTconv cells from infant or adult Il17a fate-mapping mice. Frequencies of tdT+ and GFP+tdT+ cells are indicated. (B) Frequencies of donor-derived Treg cells inthe colon of Foxp3dtr hosts that received 106 naive tdT− Tconv cells from infant or adult Il17a fate-mapping mice (n = 6). (C) 2.5 × 10⁵ RTEs and non-RTEs fromadult mice were transferred to Foxp3dtr hosts. Sort strategy (left), and frequencies of donor-derived Treg cells (right) in the colon of hosts (n = 6). (D) LN naiveT cells or CD4+ CD8− FoxP3− thymocytes from adult donors were transferred to Foxp3dtr hosts. Frequencies and average numbers of donor-derived Treg cells(n ≥ 6). Summary plots show data pooled from two independent experiments. Means ± SD. ***, P < 0.001 using Student’s t test.
Pratama et al. Journal of Experimental Medicine 9
Time matters for pTreg cells https://doi.org/10.1084/jem.20190428
Dow
nloaded from http://rupress.org/jem
/article-pdf/217/1/e20190428/874910/jem_20190428.pdf by guest on 06 February 2022

between pTreg cell precursors in infants and adults, and theselikely contribute as well to the developmental timing of RORγ+
Treg cells. These results are not mutually exclusive with thosefrom the Hsieh and Eberl groups, who showed that the envi-ronment of neonatal and infant mice is not conducive to dif-ferentiation of RORγ+ pTreg cells (Nutsch et al., 2016; AlNabhani et al., 2019). Rather, they imply that the temporallydelayed appearance of RORγ+ Treg cells in the colon has tworoots, cell intrinsic (maturation stage of the CD4+ T cells, asreflected by the RTE transcriptome) and cell extrinsic (microbialinfluences). A caveat worth mentioning is that one cannot, in thequantitative comparison between the outcomes of such transferexperiments, distinguish differences in rates of conversion fromdifferences in proliferative expansion and/or competitive fitnessof the cells that result from conversion. Some of the influencesmay be affecting either or both aspects.
For the most part, the temporal shift could be ascribed to theproportion of RTEs among Tconv cell pools, since the biasescould be recapitulated by purifying RTEs from adult mice. RTEs
dominate the Tconv cell pool in infant mice since they take ∼3wk to fully mature (Berzins et al., 1998; Boursalian et al., 2004;Cunningham et al., 2018). What, then, are the differences inTconv cells that underlie the shift in potential? Several cellularcharacteristics of RTEs and/or of Tconv cells from infant micemight contrive to yield Helios+ pTreg cells. First, RTEs are proneto differentiate along the Th2 pathway (Hendricks and Fink,2011), and Helios+ pTreg cells that developed from RTEs or in-fant Tconv cells co-expressed Gata3, the key transcriptionalregulator of Th2 cells (Wan, 2014). Second, RTEs exhibitenhanced proliferation in a lymphopenic environment butcompete less effectively with mature naive counterparts inlympho-replete conditions (Houston et al., 2011), which corre-sponds well to the present observations: greater responsivenessto conversion-inducing cues (IL2?) in the Treg cell–depletedenvironment (Fig. 2) and in lymphopenic conditions (Paivaet al., 2013), and far lower conversion in a lympho-replete en-vironment (Fig. 5). This sensitivity seemed related to theirgreater activation status and to Nur77 levels. The “matched
Figure 8. Molecular differences between infant and adult Tconv cells. (A and B) Low-input RNA-seq was performed on 1,000 LN naive Tconv cells frominfant and adult mice. (A) Differential expression shown as a volcano plot (fold change versus P value). TCR activation signature genes are highlighted in purple.Number of genes and χ2-test P value are indicated. (B) GSEA showing differentially enriched hallmark gene sets. Data are average values of three biologicalreplicates. (C) Nur77-GFP expression on naive T cells from mice of different ages (left) and how they correlate with frequencies of RORγ+ pTreg cells followingTconv cell transfer from mice of different ages (n ≥ 3; RORγ+ frequency data taken from Fig. 5 A). (D)Mean fluorescence intensities of CD5 and c-Maf on naiveT cells, and frequencies of CD69hi and ST2+ among naive T cells from mice of different ages (n ≥ 3). Data are pooled from three independent experiments.Means ± SD. MFI, mean fluorescence intensity; wo, weeks old; Tg, transgenic.
Pratama et al. Journal of Experimental Medicine 10
Time matters for pTreg cells https://doi.org/10.1084/jem.20190428
Dow
nloaded from http://rupress.org/jem
/article-pdf/217/1/e20190428/874910/jem_20190428.pdf by guest on 06 February 2022

Nur77” experiment in Fig. 9 demonstrates that Nur77 is not thecausal factor by itself, and that other elements also distinguishinfant and adult Tconv cells. Third, RTEs seem less attuned tobacterial-derived inducers of RORγ+ Treg cell differentiation,and to the influence of IL6, consistent with a previous reportthat documented a lower sensitivity of RTEs to IL6 (Paiva et al.,2013), possibly linked to lower expression of IL6Rα. The greaterreliance of adult/non-RTE cells on IL6 signals is consistent withtheir heightened expression of the IL6R–STAT3 pathway(Fig. 8).
Our profiling and transfer data point to differences in cellstate as responsible for the varying fates of infant and adultTconv cells. It is also possible that these reflect a gradual changein TCR repertoire, as young cells (infant/RTEs) capable of dif-ferentiation into Helios+ pTreg cells are depleted from the ma-tured pool. A plausible scenario is that higher-affinity TCRs(reflected by high Nur77 expression) preferentially induce He-lios+ pTreg cells, since strong TCR signals have been linked toHelios expression in other T cell contexts (Daley et al., 2013;Gottschalk et al., 2012). However, the quasi-exclusive conver-sion into Helios+ pTreg cells of RTEs, not all of which would beexpected to express high-affinity TCRs, suggests that other el-ements of the cells’ signaling apparatus are at play. It may ratherbe the downstream integration of these TCR-driven signals (e.g.,via differential sensitivity to IL7 or IL6) that determines theoutcome. In addition, Helios expression was already slightlyhigher in Tconv cells from infant than adult mice. As Helios isone of the transcriptional cofactors of FoxP3 that is importantfor its activity (Kwon et al., 2017), Helios expression in thestarting Tconv cells might positively reinforce the Helios+ pTregcell phenotype and dampen the expression of RORγ.
In addition, Il17a-experienced Tconv cells that have ex-pressed Il17a, and perhaps also Rorc, at some point in their pastpreferentially converted to RORγ+ pTreg cells. This is consistentwith the notion that reciprocal exchanges can occur betweenTreg cell and Th17 populations (Gagliani et al., 2015; Komatsuet al., 2014; Yang et al., 2008), and one might speculate that itcorresponds to a more open status of the chromatin at the Rorclocus in Il17a-experienced Tconv cells. However, this pathwayseemed to play a minor contribution to the RORγ+ pTreg cellcompartment overall.
This time-controlled development of the two populations ofcolonic Treg cells may denote an evolutionary advantage to a
Figure 9. Nur77 expression on donor Tconvcells correlates with the phenotypes of con-verted pTreg cells. (A) Naive Tconv cells fromadult Nur77gfp reporter mice were sorted intothree bins before transfer into DT-treatedFoxp3dtr hosts (n = 8), yielding the colon pTregcells shown at right. (B) Naive T cells with anidentical window of Nur77GFP expression weresorted from adult or infant mice (n = 7). Sum-mary plots show data pooled from two (B) andthree (A) independent experiments. Means ± SD.**, P < 0.01 using Student’s t test.
Figure 10. Integrated model. Adult and infant naive Tconv cells differ intheir composition: mostly immature RTEs in infants, and mostly mature naiveT cells in adults, which also contain more Il17a-experienced CD4+ T cells. Bothmature naive (Nur77low) and Il17a-experienced T cells preferentially convertto RORγ+ pTreg cells in the colon. This process is dependent on the presenceof microbes and IL6R-mediated signals. In contrast, RTEs (Nur77high) thatdominate in infant mice are skewed to convert to Helios+ Treg cells, with alesser dependence on gut microbes and IL6R.
Pratama et al. Journal of Experimental Medicine 11
Time matters for pTreg cells https://doi.org/10.1084/jem.20190428
Dow
nloaded from http://rupress.org/jem
/article-pdf/217/1/e20190428/874910/jem_20190428.pdf by guest on 06 February 2022

two-stage process: in early life, Helios+ Treg cells withamphiregulin-mediated barrier-fortifying function (Schieringet al., 2014) are the dominant subset, since there are only afew bacterial species to contend with (most of them Lactobacilluscommensals from breast milk that are controlled by maternalIgA). A contribution to sterile tissue homeostasis may be par-ticularly valuable at a time of rapid tissue growth. Later, RORγ+
pTreg cells become dominant when nutritional input changesradically and brings a far more diverse microbiota, and main-taining immunological tolerance to commensals becomes para-mount. In adults, the potential of colonic Tconv cells to generateboth Helios+ and RORγ+ pTreg cells enables a continued renewalof these pools, as needed in the face of novel microbial chal-lenges or of situations that deplete Treg cell pools. Finally, nichecompetition between the two pTreg cell types may balance theirrelative proportions.
In conclusion, this study provides a better understanding ofthe origins of and relationships between RORγ+ and Helios+ Tregcells in the colon, and highlights the influence of Tconv cellstates in determining the balance of these two pTreg cell fates, inaddition to changes in environmental modulators. The ability tomanipulate these states may prove clinically beneficial in in-ducing a particular pTreg cell subset to restore gut homeostasis.
Materials and methodsMiceB6.CD45.1+, B6.CD45.2+, Foxp3ires-gfp/B6 (or Foxp3gfp; Bettelliet al., 2006), Foxp3tm3(DTR/GFP)Ayr/J (or Foxp3dtr; Kim et al.,2007), Foxp3tm10.1(Casp9,-Thy1)Ayr (or Foxp3thy1.1; Liston et al.,2008), Il17atm1.1(icre)Stck/J (or Il17aCre; Hirota et al., 2011),Gt(ROSA)26Sortm9(CAG-tdTomato)Hze/J (or Rosa26tdTomato; Madisenet al., 2010), Il17atm1Bcgen/J (or Il17agfp), Tg(Cd4-cre)1Cwi/BfluJ (orCD4Cre; Lee et al., 2001), Il6ratm1.1Drew/J (or Il6rafl; McFarland-Mancini et al., 2010), and Tg(Nr4a1-EGFP/cre)820Khog/J (orNur77gfp; Moran et al., 2011) mice were obtained from the JacksonLaboratory. Il17a fate-reporter mice were generated by crossingIl17aCre mice to Rosa26tdTomato, and then to Il17agfp mice. All micewere backcrossed and maintained on the B6 background in ourSPF facility at Harvard Medical School. A GF C57BL/6J breedingnucleus was obtained from L. Bry (Brigham and Women’s Hos-pital, HarvardMedical School. Boston, MA) andmaintained in GFisolators. Gnotobiotic mice were generated by gavaging 4-wk-oldGF mice once with 108 CFU bacteria and housing them in sterileisolators for 2 wk before analysis. Adult (7–10 wk old) and infant(10–14 d old) male and female littermates were used, unless in-dicated otherwise. All experimentation was performed followinganimal protocols approved by the Harvard Medical School Insti-tutional Animal Use and Care Committee (protocol IS00001257).
BacteriaB. thetaiotaomicron (Bthet.ATCC29741) culture was obtainedfrom the American Type Culture Collection.
Antibiotic treatmentFor antibiotic treatment, a mixture of 1 g/liter of ampicillin so-dium salt (Sigma-Aldrich), 1 g/liter of metronidazole (Sigma-
Aldrich), 0.5 g/liter vancomycin hydrochloride (ResearchProducts International), and 1 g/liter neomycin sulfate (ThermoFisher Scientific) plus 2.5 g/liter of the sweetener Equalwere used.
T cell transfersFor Treg cell or Tconv cell transfer, 105 Treg cells or 106 naiveCD4+ Tconv cells were sorted from pooled (inguinal, mesenteric,brachial, axillary, and cervical) LNs of adult (7–10 wk old) orinfant (10–14 d old) CD45.2+ Foxp3gfpmice usingMoFlo (BeckmanCoulter) and were i.v. injected into gender-matched 6–8-wk-oldCD45.1+ Foxp3dtr or B6mice. Treg cells were sorted as DAPI− CD4+
TCRβ+ Foxp3GFP+, whereas naive CD4+ Tconv cells were gatedas DAPI− CD4+ TCRβ+ CD44lo Foxp3GFP−. In certain experiments,recipients were given antibiotic-supplemented water from 7 dbefore transfer until the day of analysis. When GF mice orIl6rafl/fl CD4Cremicewere used as donors, naive CD4+ Tconv cellswere sorted as DAPI− CD4+ TCRβ+ CD44lo CD25−. For CD4+
CD44hi Tconv cell transfer: 0.25 × 10⁶ CD44lo or CD44hi Tconvcells were sorted from pooled spleen and LNs of adult maleCD45.2+ Foxp3gfp mice using MoFlo and were i.v.-injected intomale 6–8-wk-old CD45.1+ Foxp3dtr mice. For Il17aCregfp Ro-sa26tdTomato cell transfer: 0.25 × 10⁶ tdT+ or tdT− Tconv cellswere sorted from pooled spleen and LNs of adult or infant maleCD45.2+ Il17a fate-mapping mice using MoFlo and were i.v.-in-jected into male 6–8-wk-old CD45.1+ Foxp3dtr mice. For RTEtransfer: 0.25 × 10⁶ FITC+ or FITC− naive Tconv cells were sortedfrom pooled LNs of adult male CD45.2+ Foxp3thy1.1 mice usingMoFlo and were i.v.-injected into male 6–8-wk-old CD45.1+
Foxp3dtr mice. For CD4 single-positive thymocytes transfer: 106
T cells were sorted from either thymi or LNs of adult maleCD45.2+ Foxp3gfp mice using MoFlo and were i.v.-injected intomale 6–8-wk-old CD45.1+ Foxp3dtr mice. Thymocytes were gatedas DAPI− CD4+ CD8− TCRβ+ Foxp3GFP−, while LN Tconv cellswere sorted as DAPI− CD4+ TCRβ+ CD44lo Foxp3GFP−. Treg celldepletion was achieved by injecting Foxp3dtr mice i.p. with DT(Sigma-Aldrich) in PBS at 20 ng/g of body weight. DT was in-jected 1 d prior, and 1 and 3 d after, transfer. 1 (for transfer intounmanipulated B6 hosts) or 2 wk (for transfer into Foxp3dtr re-cipients) after transfer, frequencies of donor-derived cells inspleen and colon of recipient mice were analyzed by flowcytometry.
Cell isolation and flow cytometryA single-cell suspension of mouse splenocytes, thymocytes, orLNs was obtained by physical dissociation with a 40-μm cellstrainer (Falcon). For splenocytes, lysis of RBCs was performedwith 1 ml of ACK lysing buffer (Lonza) for 2 min on ice. Lym-phocytes from colonic LP were isolated through a procedureoutlined previously (Sefik et al., 2015). In brief, the entire colonwas incubated in RPMI (Gibco) containing 1 mM dithiothreitol,20mMEDTA, and 2% FCS at 37°C for 15 min to remove epithelialcells. The colon was then minced and dissociated in RPMI con-taining 1.5 mg/ml collagenase II (Gibco), 0.5 mg/ml Dispase(Gibco), and 1% FCS, at 37°C for 45 min with constant stirring.The digested materials were washed and filtered through a 40-μm cell strainer at least twice to obtain a single-cell suspension.
Pratama et al. Journal of Experimental Medicine 12
Time matters for pTreg cells https://doi.org/10.1084/jem.20190428
Dow
nloaded from http://rupress.org/jem
/article-pdf/217/1/e20190428/874910/jem_20190428.pdf by guest on 06 February 2022
Antibody staining was performed in ice-cold buffer (RPMI with2% FCS) for 30 min at a dilution of 1/100 with antibodies to CD5(53–7.3), CD8 (53–6.7), CD25 (PC61), CD44 (IM7), CD45 (30-F11),CD45.1 (A20), CD45.2 (104), CD69 (H1.2F3), CD90.1/Thy1.1 (OX-7), and TCRβ (H57-597; all from BioLegend), IL6Rα (15A7;homemade), and CD4 (RM4-5; Invitrogen). For analysis of TFs,cells were fixed, permeabilized, and intracellularly stained forFoxp3 (FJK-16s), Gata3 (TWAJ), RORγ (AFKJS-9; all from In-vitrogen), c-Maf (sym0F1; eBioscience), and Helios (22F6;BioLegend) according to the manufacturer’s (eBioscience’s) in-structions. Cells were acquired with an LSRII flow cytometer(BD Biosciences) or a MoFlo cell sorter (Beckman Coulter), anddata were analyzed using FlowJo software.
RTE labeling in adult miceIntrathymic injection of FITC has been described in detail pre-viously (Scollay et al., 1980). Briefly, thymic lobes were injectedwith ∼10 μl of 350 μg/ml FITC (Invitrogen), randomly labeling30–60% of thymocytes. Mice were euthanized 24 h later, andlymphocytes from LNs were analyzed by FACS.
RNA-seqBiological triplicates of 103 naive CD4+ T cells (DAPI− CD4+
TCRβ+ CD44lo Foxp3GFP−) from pooled LNs of 10-d-old or 7-wk-old Foxp3gfp mice were double-sorted using MoFlo into 5 μlbuffer TCL (Qiagen) containing 1% 2-mercaptoethanol (Sigma-Aldrich). Smart-Seq2 libraries were prepared by the BroadTechnology Labs and sequenced using the Broad GenomicsPlatform (Picelli et al., 2014). In brief, total RNA was capturedand purified on RNAClean XP beads (Beckman Coulter). Poly-adenylated mRNA was selected using an anchored oligo(dT)primer and reverse-transcribed to cDNA. First-strand cDNAwassubjected to limited PCR amplification followed by transposon-based fragmentation using the Nextera XT DNA Library Prep-aration Kit (Illumina). Samples were then PCR-amplified usingbarcoded primers such that each sample carried a specificcombination of Illumina P5 and P7 barcodes and were pooledbefore sequencing. Paired-end sequencing was performed on anIllumina NextSeq500 using 2 × 25 bp reads. Reads were alignedto the mouse genome (Gencode GRCm38 primary assembly;https://www.gencodegenes.org/mouse/). Transcripts werequantified by the Broad Technology Labs computational pipelinewith Cuffquant version 2.2.1 (Trapnell et al., 2012). Raw readcount tables were normalized by the median of ratios methodwith the DESeq2 package from Bioconductor and then convertedto GCT and CLS format. Poor-quality samples with <3 millionuniquely mapped reads were automatically excluded from nor-malization. Normalized reads were further filtered by minimalexpression and analyzed by Multiplot Studio in the GenePatternsoftware package. Pathway enrichment analysis was performedby querying hallmark gene sets in the Molecular SignaturesDatabase (v6.2; Subramanian et al., 2005) using the GSEA tool.
scRNA-seq library preparation and data analysisscRNA-seq was performed using the InDrop protocol thathas been described in detail elsewhere (Zilionis et al., 2017;Zemmour et al., 2018). In brief, 3 × 10⁴ CD4+ T cells (DAPI− CD4+
TCRβ+) from the colon of 6-wk-old B. thetaiotaomicron–monocolonizedmicewere sorted usingMoFlo into RPMImediumcontaining 2% FCS. Cells were then pelleted by centrifugation at500 g for 5 min and resuspended in PBS containing 15% Opti-Prep Density Gradient Medium (Sigma-Aldrich) at a concen-tration of 80,000 cells/ml. Around 2,000 single cells persample were then encapsulated in droplets of 3–4 nl containinga primer hydrogel bead and the SuperScript III RT buffer (In-vitrogen). RT was performed immediately after encapsulation.After purification of the DNA/RNA duplex with 1.2× AMPureXP beads (Beckman Coulter), second-strand cDNA synthesis(NEB) was performed per the manufacturer’s instructions. Thelibrary was then amplified by in vitro transcription using Hi-Scribe T7 High Yield RNA Synthesis Kit (NEB). After purifica-tion, half of the amplified RNA was used for further processing,while the rest was saved for TCRαβ sequencing. For tran-scriptome analysis, the amplified RNA was fragmented usingthe magnesium RNA fragmentation kit (Ambion) and purifiedusing AMPure Beads (1.2×). RT with random hexamers wasthen performed using PrimeScript RT (Takara Clontech) perthe manufacturer’s instructions. A final PCR using Kapa HiFiHotStart PCR mix (Kapa Biosystems) was performed to amplifythe library and to add the P5-P7 and Illumina index primers.Library size was measured with a High Sensitivity D1000ScreenTape (Agilent Technologies), quantified by quantitativePCR, and sequenced using NextSeq500.
Single-cell demultiplexing was performed against the possi-ble barcode space, and only reads mapping unambiguously andwith less than two mismatches were kept. For each single-celllibrary, reads were mapped to the mouse mm10 transcriptomeusing tophat2. Duplicate reads, those mapping to multiple re-gions, or those having a low alignment score (mapping quality <10) were filtered out. A final matrix with genes in rows and cellsin columnswas then constructed. Datawere then analyzed usingthe Seurat R toolkit (Butler et al., 2018). Briefly, cells were firstfiltered based on the number of unique genes. Cells with <200unique genes were excluded from further analysis. Gene ex-pression values for each cell were then normalized by the totalexpression, multiplied by an arbitrary scale factor of 10,000, andlog-transformed. A principle component analysis was performedon the top 200most variable genes that were expressed in >1% ofthe cells. The number of statistically significant principal com-ponents was determined by comparison with principle compo-nent analysis over a randomized matrix as described previously(Klein et al., 2015). The data were then visualized using thet-distributed stochastic neighbor embedding (tSNE) dimen-sionality reduction algorithm (van der Maaten and Hinton,2008), on the significant PCs. The activated T cell, Treg cell,RORγ+ Treg cell, or Helios+ Treg cell gene signature score foreach single cell was calculated by summing the counts for thegenes identified previously to be up-regulated in that particularsubset (DiSpirito et al., 2018; list of genes provided in Table S1).
Paired single-cell TCRαβ sequencingA detailed version of this protocol has been described previously(Zemmour et al., 2018). The material used for this process wasthe same as for the whole-transcriptome library construction, by
Pratama et al. Journal of Experimental Medicine 13
Time matters for pTreg cells https://doi.org/10.1084/jem.20190428
Dow
nloaded from http://rupress.org/jem
/article-pdf/217/1/e20190428/874910/jem_20190428.pdf by guest on 06 February 2022

taking half of the amplified RNA immediately before the frag-mentation step. In brief, the RNA library was amplified by RTusing T cell receptor alpha variable region (TRAV) or T cell re-ceptor beta variable region (TRBV) external primers (Table S1).After purification with 0.5× AMPure Beads (Beckman Coulter),cDNA was further amplified by PCR using TRAV or TRBV in-ternal primers containing the Illumina PE1 sequence. A secondPCR incorporating the P5 Illumina sequence was then per-formed. The PCR product was again purified and size-selectedtwice with 0.5× AMPure beads. Library size was assessed using aHigh sensitivity D5000 ScreenTape (Agilent Technologies). TheTCRα and TCRβ libraries had an expected size of 1,470 and1,230 bp respectively. Library concentration was determined byquantitative PCR, and sequencing was done using paired-endNano MiSeq.
Similar to the transcriptome analysis, single-cell demulti-plexing was performed against the possible barcode space,and only reads mapping unambiguously and with fewer thantwo mismatches were kept. TCRα and TCRβ alignment (V, D, Jalignment and CDR3 identification) was done individually foreach single cell against the mouse IMGT database (http://www.imgt.org/) using the MiXCR 1.8.1 software (Bolotinet al., 2015). TCRα and TCRβ sequences and transcriptomedata were matched to the same single-cell barcode unambig-uously with fewer than two mismatches. Only single-cellbarcodes with both TCRα and TCRβ sequences (with MiXCRscore > 100) and for which the transcriptome was availablewere kept for further analysis. Single cells were grouped inclonotypes when sharing the same TCRα and TCRβ nucleotidesequences.
Data availabilityRNA-seq data comparing infant versus adult mice and scRNA-seq data of colon T cells have been deposited to the Gene Ex-pression Omnibus database under accession nos. GSE132255 andGSE132573, respectively.
Statistical analysesData were presented as means ± SD. Statistical significance,indicated by asterisks, was determined by Student’s t test (two-tailed, unpaired) or one-way ANOVA using GraphPad Prism 5.0.P values <0.05 were considered significant: *, P < 0.05; **, P <0.01; ***, P < 0.001. χ2 test was used to determine the enrichmentof certain gene signatures in RNA-seq datasets.
Online supplemental materialFig. S1 shows the scRNA-seq quality control analysis. Fig. S2compares the fates of naive, effector Tconv cells, and tTregcells following adoptive transfer into Foxp3dtr recipients. Fig.S3 shows that pre-existing expression of RORγ on Tconv cellsand availability of a Treg cell niche contribute to the dif-ferentiation of RORγ+ pTreg cells. Fig. S4 details the contri-bution of IL6R signaling to RORγ+ pTreg cell conversion. Fig.S5 shows that high expression of Nur77 on Tconv cells cor-relates with Helios+ pTreg cells conversion in the spleen.Table S1 contains additional information on the scRNA-seqexperiment.
AcknowledgmentsWe thank Drs. V. Kuchroo (Il17aCre × Rosa26tdTomato × Il17agfpmice;Evergrande Center for Immunological Diseases, Harvard Medi-cal School and Brigham and Women’s Hospital, Boston, MA), A.Rudensky (Foxp3thy1.1 mice; Memorial Sloan Kettering CancerCenter, New York, NY), and D. Zemmour for insightful dis-cussions, data, and mouse lines, and K. Hattori, G. Buruzula, A.Wood, C. Araneo, K. Seddu, B. Vijaykumar, and L. Yang for helpwith mice, cell sorting, profiling, and computational biology.Cell sorting was at Joslin Flow Core (CF-0003-11-04 andS10OD021740).
This work was supported by grants from the National In-stitutes of Health (RO1-AI51530 and RO1-AI125603) and by theEvergrande Center for Immunological Diseases.
The authors declare no competing financial interests.Author contributions: A. Pratama, D. Mathis, and C. Benoist
designed the research. A. Pratama and A. Schnell performed theresearch. A. Pratama, A. Schnell, D. Mathis, and C. Benoist an-alyzed the data. A. Pratama and C. Benoist wrote the manuscript.
Submitted: 7 March 2019Revised: 21 June 2019Accepted: 17 September 2019
ReferencesAkimova, T., U.H. Beier, L. Wang, M.H. Levine, and W.W. Hancock. 2011.
Helios expression is a marker of T cell activation and proliferation. PLoSOne. 6:e24226. https://doi.org/10.1371/journal.pone.0024226
Al Nabhani, Z., S. Dulauroy, R. Marques, C. Cousu, S. Al Bounny, F. Dejardin,T. Sparwasser, M. Berard, N. Cerf-Bensussan, and G. Eberl. 2019. Aweaning reaction to microbiota is required for resistance to im-munopathologies in the adult. Immunity. 50:1276–1288.e5. https://doi.org/10.1016/j.immuni.2019.02.014
Atarashi, K., T. Tanoue, T. Shima, A. Imaoka, T. Kuwahara, Y. Momose, G.Cheng, S. Yamasaki, T. Saito, Y. Ohba, et al. 2011. Induction of colonicregulatory T cells by indigenous Clostridium species. Science. 331:337–341. https://doi.org/10.1126/science.1198469
Azzam, H.S., A. Grinberg, K. Lui, H. Shen, E.W. Shores, and P.E. Love. 1998.CD5 expression is developmentally regulated by T cell receptor (TCR)signals and TCR avidity. J. Exp. Med. 188:2301–2311. https://doi.org/10.1084/jem.188.12.2301
Baldwin, T.A., and K.A. Hogquist. 2007. Transcriptional analysis of clonaldeletion in vivo. J. Immunol. 179:837–844. https://doi.org/10.4049/jimmunol.179.2.837
Berzins, S.P., R.L. Boyd, and J.F. Miller. 1998. The role of the thymus andrecent thymic migrants in the maintenance of the adult peripherallymphocyte pool. J. Exp. Med. 187:1839–1848. https://doi.org/10.1084/jem.187.11.1839
Bettelli, E., Y. Carrier, W. Gao, T. Korn, T.B. Strom, M. Oukka, H.L. Weiner,and V.K. Kuchroo. 2006. Reciprocal developmental pathways for thegeneration of pathogenic effector TH17 and regulatory T cells. Nature.441:235–238. https://doi.org/10.1038/nature04753
Bhaumik, S., T. Giffon, D. Bolinger, R. Kirkman, D.B. Lewis, C.T. Weaver, andD.A. Randolph. 2013. Retinoic acid hypersensitivity promotes periph-eral tolerance in recent thymic emigrants. J. Immunol. 190:2603–2613.https://doi.org/10.4049/jimmunol.1200852
Bolotin, D.A., S. Poslavsky, I. Mitrophanov, M. Shugay, I.Z. Mamedov, E.V.Putintseva, and D.M. Chudakov. 2015. MiXCR: software for compre-hensive adaptive immunity profiling. Nat. Methods. 12:380–381. https://doi.org/10.1038/nmeth.3364
Boursalian, T.E., J. Golob, D.M. Soper, C.J. Cooper, and P.J. Fink. 2004. Con-tinued maturation of thymic emigrants in the periphery. Nat. Immunol.5:418–425. https://doi.org/10.1038/ni1049
Butler, A., P. Hoffman, P. Smibert, E. Papalexi, and R. Satija. 2018. Integratingsingle-cell transcriptomic data across different conditions, technologies,
Pratama et al. Journal of Experimental Medicine 14
Time matters for pTreg cells https://doi.org/10.1084/jem.20190428
Dow
nloaded from http://rupress.org/jem
/article-pdf/217/1/e20190428/874910/jem_20190428.pdf by guest on 06 February 2022

and species. Nat. Biotechnol. 36:411–420. https://doi.org/10.1038/nbt.4096
Chen, J., I.F. López-Moyado, H. Seo, C.J. Lio, L.J. Hempleman, T. Sekiya, A.Yoshimura, J.P. Scott-Browne, and A. Rao. 2019. NR4A transcriptionfactors limit CAR T cell function in solid tumours. Nature. 567:530–534.https://doi.org/10.1038/s41586-019-0985-x
Cunningham, C.A., E.Y. Helm, and P.J. Fink. 2018. Reinterpreting recentthymic emigrant function: defective or adaptive? Curr. Opin. Immunol.51:1–6. https://doi.org/10.1016/j.coi.2017.12.006
Daley, S.R., D.Y. Hu, and C.C. Goodnow. 2013. Helios marks strongly autor-eactive CD4+ T cells in two major waves of thymic deletion distin-guished by induction of PD-1 or NF-κB. J. Exp. Med. 210:269–285.https://doi.org/10.1084/jem.20121458
DiSpirito, J.R., D. Zemmour, D. Ramanan, J. Cho, R. Zilionis, A.M. Klein, C.Benoist, and D. Mathis. 2018. Molecular diversification of regulatoryT cells in nonlymphoid tissues. Sci. Immunol. 3:eaat5861. https://doi.org/10.1126/sciimmunol.aat5861
Fassett, M.S., W. Jiang, A.M. D’Alise, D. Mathis, and C. Benoist. 2012. Nuclearreceptor Nr4a1 modulates both regulatory T-cell (Treg) differentiationand clonal deletion. Proc. Natl. Acad. Sci. USA. 109:3891–3896. https://doi.org/10.1073/pnas.1200090109
Feuerer, M., Y. Shen, D.R. Littman, C. Benoist, and D. Mathis. 2009. Howpunctual ablation of regulatory T cells unleashes an autoimmune lesionwithin the pancreatic islets. Immunity. 31:654–664. https://doi.org/10.1016/j.immuni.2009.08.023
Fink, P.J. 2013. The biology of recent thymic emigrants. Annu. Rev. Immunol.31:31–50. https://doi.org/10.1146/annurev-immunol-032712-100010
Friesen, T.J., Q. Ji, and P.J. Fink. 2016. Recent thymic emigrants are tolerizedin the absence of inflammation. J. Exp. Med. 213:913–920. https://doi.org/10.1084/jem.20151990
Gagliani, N., M.C. Amezcua Vesely, A. Iseppon, L. Brockmann, H. Xu, N.W.Palm, M.R. de Zoete, P. Licona-Limón, R.S. Paiva, T. Ching, et al.2015. Th17 cells transdifferentiate into regulatory T cells duringresolution of inflammation. Nature. 523:221–225. https://doi.org/10.1038/nature14452
Geuking, M.B., J. Cahenzli, M.A. Lawson, D.C. Ng, E. Slack, S. Hapfelmeier,K.D.McCoy, and A.J. Macpherson. 2011. Intestinal bacterial colonizationinduces mutualistic regulatory T cell responses. Immunity. 34:794–806.https://doi.org/10.1016/j.immuni.2011.03.021
Geva-Zatorsky, N., E. Sefik, L. Kua, L. Pasman, T.G. Tan, A. Ortiz-Lopez, T.B.Yanortsang, L. Yang, R. Jupp, D. Mathis, et al. 2017. Mining the humangut microbiota for immunomodulatory organisms. Cell. 168:928–943.e11. https://doi.org/10.1016/j.cell.2017.01.022
Gottschalk, R.A., E. Corse, and J.P. Allison. 2012. Expression of Helios in pe-ripherally induced Foxp3+ regulatory T cells. J. Immunol. 188:976–980.https://doi.org/10.4049/jimmunol.1102964
He, Z., L. Chen, F.O. Souto, C. Canasto-Chibuque, G. Bongers, M. Deshpande,N. Harpaz, H.M. Ko, K. Kelley, G.C. Furtado, and S.A. Lira. 2017.Epithelial-derived IL-33 promotes intestinal tumorigenesis in Apc Min/+
mice. Sci. Rep. 7:5520. https://doi.org/10.1038/s41598-017-05716-zHendricks, D.W., and P.J. Fink. 2011. Recent thymic emigrants are biased against
the T-helper type 1 and toward the T-helper type 2 effector lineage. Blood.117:1239–1249. https://doi.org/10.1182/blood-2010-07-299263
Hirota, K., J.H. Duarte, M. Veldhoen, E. Hornsby, Y. Li, D.J. Cua, H. Ahlfors, C.Wilhelm, M. Tolaini, U. Menzel, et al. 2011. Fate mapping of IL-17-producing T cells in inflammatory responses. Nat. Immunol. 12:255–263.https://doi.org/10.1038/ni.1993
Houston, E.G. Jr., and P.J. Fink. 2009. MHC drives TCR repertoire shaping,but not maturation, in recent thymic emigrants. J. Immunol. 183:7244–7249. https://doi.org/10.4049/jimmunol.0902313
Houston, E.G. Jr., L.E. Higdon, and P.J. Fink. 2011. Recent thymic emigrantsare preferentially incorporated only into the depleted T-cell pool. Proc.Natl. Acad. Sci. USA. 108:5366–5371. https://doi.org/10.1073/pnas.1015286108
Hsieh, C.S., Y. Liang, A.J. Tyznik, S.G. Self, D. Liggitt, and A.Y. Rudensky.2004. Recognition of the peripheral self by naturally arising CD25+
CD4+ T cell receptors. Immunity. 21:267–277. https://doi.org/10.1016/j.immuni.2004.07.009
Ivanov, I.I., B.S. McKenzie, L. Zhou, C.E. Tadokoro, A. Lepelley, J.J. Lafaille, D.J.Cua, and D.R. Littman. 2006. The orphan nuclear receptor RORgammatdirects the differentiation program of proinflammatory IL-17+ T helpercells. Cell. 126:1121–1133. https://doi.org/10.1016/j.cell.2006.07.035
Kim, J.M., J.P. Rasmussen, and A.Y. Rudensky. 2007. Regulatory T cellsprevent catastrophic autoimmunity throughout the lifespan of mice.Nat. Immunol. 8:191–197. https://doi.org/10.1038/ni1428
Kim, B.S., H. Lu, K. Ichiyama, X. Chen, Y.B. Zhang, N.A. Mistry, K. Tanaka,Y.H. Lee, R. Nurieva, L. Zhang, et al. 2017. Generation of RORγt+
antigen-specific T regulatory 17 cells from Foxp3+ precursors in auto-immunity. Cell Reports. 21:195–207. https://doi.org/10.1016/j.celrep.2017.09.021
Klein, A.M., L. Mazutis, I. Akartuna, N. Tallapragada, A. Veres, V. Li, L.Peshkin, D.A. Weitz, and M.W. Kirschner. 2015. Droplet barcoding forsingle-cell transcriptomics applied to embryonic stem cells. Cell. 161:1187–1201. https://doi.org/10.1016/j.cell.2015.04.044
Komatsu, N., K. Okamoto, S. Sawa, T. Nakashima, M. Oh-hora, T. Kodama, S.Tanaka, J.A. Bluestone, and H. Takayanagi. 2014. Pathogenic conversionof Foxp3+ T cells into TH17 cells in autoimmune arthritis. Nat. Med. 20:62–68. https://doi.org/10.1038/nm.3432
Komori, T., A. Okada, V. Stewart, and F.W. Alt. 1993. Lack of N regions inantigen receptor variable region genes of TdT-deficient lymphocytes.Science. 261:1171–1175. https://doi.org/10.1126/science.8356451
Kwon, H.K., H.M. Chen, D. Mathis, and C. Benoist. 2017. Different molecularcomplexes that mediate transcriptional induction and repression byFoxP3. Nat. Immunol. 18:1238–1248. https://doi.org/10.1038/ni.3835
Lathrop, S.K., S.M. Bloom, S.M. Rao, K. Nutsch, C.W. Lio, N. Santacruz, D.A.Peterson, T.S. Stappenbeck, and C.S. Hsieh. 2011. Peripheral educationof the immune system by colonic commensal microbiota. Nature. 478:250–254. https://doi.org/10.1038/nature10434
Lee, P.P., D.R. Fitzpatrick, C. Beard, H.K. Jessup, S. Lehar, K.W. Makar, M.Perez-Melgosa, M.T. Sweetser, M.S. Schlissel, S. Nguyen, et al. 2001. Acritical role for Dnmt1 and DNA methylation in T cell development,function, and survival. Immunity. 15:763–774. https://doi.org/10.1016/S1074-7613(01)00227-8
Liston, A., K.M. Nutsch, A.G. Farr, J.M. Lund, J.P. Rasmussen, P.A. Koni, andA.Y. Rudensky. 2008. Differentiation of regulatory Foxp3+ T cells in thethymic cortex. Proc. Natl. Acad. Sci. USA. 105:11903–11908. https://doi.org/10.1073/pnas.0801506105
Liu, X., P. Nguyen,W. Liu, C. Cheng,M. Steeves, J.C. Obenauer, J. Ma, and T.L.Geiger. 2009. T cell receptor CDR3 sequence but not recognitioncharacteristics distinguish autoreactive effector and Foxp3(+) regula-tory T cells. Immunity. 31:909–920. https://doi.org/10.1016/j.immuni.2009.09.023
Liu, X., Y.Wang, H. Lu, J. Li, X. Yan, M. Xiao, J. Hao, A. Alekseev, H. Khong, T.Chen, et al. 2019. Genome-wide analysis identifies NR4A1 as a keymediator of T cell dysfunction. Nature. 567:525–529. https://doi.org/10.1038/s41586-019-0979-8
Madisen, L., T.A. Zwingman, S.M. Sunkin, S.W. Oh, H.A. Zariwala, H. Gu, L.L.Ng, R.D. Palmiter, M.J. Hawrylycz, A.R. Jones, et al. 2010. A robust andhigh-throughput Cre reporting and characterization system for thewhole mouse brain. Nat. Neurosci. 13:133–140. https://doi.org/10.1038/nn.2467
Mangan, P.R., L.E. Harrington, D.B. O’Quinn, W.S. Helms, D.C. Bullard, C.O.Elson, R.D. Hatton, S.M. Wahl, T.R. Schoeb, and C.T. Weaver. 2006.Transforming growth factor-β induces development of the T(H)17 lin-eage. Nature. 441:231–234. https://doi.org/10.1038/nature04754
McFarland-Mancini, M.M., H.M. Funk, A.M. Paluch, M. Zhou, P.V. Giridhar,C.A. Mercer, S.C. Kozma, and A.F. Drew. 2010. Differences in woundhealing in mice with deficiency of IL-6 versus IL-6 receptor. J. Immunol.184:7219–7228. https://doi.org/10.4049/jimmunol.0901929
Molofsky, A.B., A.K. Savage, and R.M. Locksley. 2015. Interleukin-33 in tissuehomeostasis, injury, and inflammation. Immunity. 42:1005–1019.https://doi.org/10.1016/j.immuni.2015.06.006
Moran, A.E., K.L. Holzapfel, Y. Xing, N.R. Cunningham, J.S. Maltzman, J. Punt,and K.A. Hogquist. 2011. T cell receptor signal strength in Treg andiNKT cell development demonstrated by a novel fluorescent reportermouse. J. Exp. Med. 208:1279–1289. https://doi.org/10.1084/jem.20110308
Neumann, C., J. Blume, U. Roy, P.P. Teh, A. Vasanthakumar, A. Beller, Y. Liao,F. Heinrich, T.L. Arenzana, J.A. Hackney, et al. 2019. c-Maf-dependentTreg cell control of intestinal TH17 cells and IgA establishes host-microbiota homeostasis. Nat. Immunol. 20:471–481. https://doi.org/10.1038/s41590-019-0316-2
Nutsch, K., J.N. Chai, T.L. Ai, E. Russler-Germain, T. Feehley, C.R. Nagler, andC.S. Hsieh. 2016. Rapid and efficient generation of regulatory T cells tocommensal antigens in the periphery. Cell Reports. 17:206–220. https://doi.org/10.1016/j.celrep.2016.08.092
Ohnmacht, C., J.H. Park, S. Cording, J.B. Wing, K. Atarashi, Y. Obata, V. Ga-boriau-Routhiau, R. Marques, S. Dulauroy, M. Fedoseeva, et al. 2015.MUCOSAL IMMUNOLOGY. The microbiota regulates type 2 immunitythrough RORγt+ T cells. Science. 349:989–993. https://doi.org/10.1126/science.aac4263
Pratama et al. Journal of Experimental Medicine 15
Time matters for pTreg cells https://doi.org/10.1084/jem.20190428
Dow
nloaded from http://rupress.org/jem
/article-pdf/217/1/e20190428/874910/jem_20190428.pdf by guest on 06 February 2022

Osorio, F., S. LeibundGut-Landmann, M. Lochner, K. Lahl, T. Sparwasser, G.Eberl, and C. Reis e Sousa. 2008. DC activated via dectin-1 convert Treginto IL-17 producers. Eur. J. Immunol. 38:3274–3281. https://doi.org/10.1002/eji.200838950
Pacholczyk, R., H. Ignatowicz, P. Kraj, and L. Ignatowicz. 2006. Origin andT cell receptor diversity of Foxp3+CD4+CD25+ T cells. Immunity. 25:249–259. https://doi.org/10.1016/j.immuni.2006.05.016
Paiva, R.S., A.C. Lino,M.L. Bergman, I. Caramalho, A.E. Sousa, S. Zelenay, andJ. Demengeot. 2013. Recent thymic emigrants are the preferential pre-cursors of regulatory T cells differentiated in the periphery. Proc. Natl.Acad. Sci. USA. 110:6494–6499. https://doi.org/10.1073/pnas.1221955110
Peine, M., R.M. Marek, and M. Lohning. 2016. IL-33 in T cell differentiation,function, and immune homeostasis. Trends Immunol. 37:321–333.https://doi.org/10.1016/j.it.2016.03.007
Picelli, S., O.R. Faridani, A.K. Bjorklund, G. Winberg, S. Sagasser, and R.Sandberg. 2014. Full-length RNA-seq from single cells using Smart-seq2. Nat. Protoc. 9:171–181. https://doi.org/10.1038/nprot.2014.006
Russler-Germain, E.V., S. Rengarajan, and C.S. Hsieh. 2017. Antigen-specificregulatory T-cell responses to intestinal microbiota. Mucosal Immunol.10:1375–1386. https://doi.org/10.1038/mi.2017.65
Sawa, S., M. Cherrier,M. Lochner, N. Satoh-Takayama, H.J. Fehling, F. Langa,J.P. Di Santo, and G. Eberl. 2010. Lineage relationship analysis ofRORgammat+ innate lymphoid cells. Science. 330:665–669. https://doi.org/10.1126/science.1194597
Schiering, C., T. Krausgruber, A. Chomka, A. Frohlich, K. Adelmann, E.A.Wohlfert, J. Pott, T. Griseri, J. Bollrath, A.N. Hegazy, et al. 2014. Thealarmin IL-33 promotes regulatory T-cell function in the intestine.Nature. 513:564–568. https://doi.org/10.1038/nature13577
Scollay, R.G., E.C. Butcher, and I.L. Weissman. 1980. Thymus cell migration.Quantitative aspects of cellular traffic from the thymus to the peripheryin mice. Eur. J. Immunol. 10:210–218. https://doi.org/10.1002/eji.1830100310
Sefik, E., N. Geva-Zatorsky, S. Oh, L. Konnikova, D. Zemmour, A.M. McGuire,D. Burzyn, A. Ortiz-Lopez, M. Lobera, J. Yang, et al. 2015. MUCOSALIMMUNOLOGY. Individual intestinal symbionts induce a distinctpopulation of RORγ+ regulatory T cells. Science. 349:993–997. https://doi.org/10.1126/science.aaa9420
Sharma, A., and D. Rudra. 2018. Emerging functions of regulatory T cells intissue homeostasis. Front. Immunol. 9:883. https://doi.org/10.3389/fimmu.2018.00883
Solomon, B.D., and C.S. Hsieh. 2016. Antigen-specific development of mu-cosal Foxp3+RORγt+ T cells from regulatory T cell precursors.J. Immunol. 197:3512–3519. https://doi.org/10.4049/jimmunol.1601217
Spits, H., and T. Cupedo. 2012. Innate lymphoid cells: emerging insights indevelopment, lineage relationships, and function. Annu. Rev. Immunol.30:647–675. https://doi.org/10.1146/annurev-immunol-020711-075053
Subramanian, A., P. Tamayo, V.K. Mootha, S. Mukherjee, B.L. Ebert, M.A.Gillette, A. Paulovich, S.L. Pomeroy, T.R. Golub, E.S. Lander, and J.P.Mesirov. 2005. Gene set enrichment analysis: a knowledge-based ap-proach for interpreting genome-wide expression profiles. Proc. Natl.Acad. Sci. USA. 102:15545–15550. https://doi.org/10.1073/pnas.0506580102
Tanoue, T., K. Atarashi, and K. Honda. 2016. Development and maintenanceof intestinal regulatory T cells. Nat. Rev. Immunol. 16:295–309. https://doi.org/10.1038/nri.2016.36
Thornton, A.M., P.E. Korty, D.Q. Tran, E.A.Wohlfert, P.E. Murray, Y. Belkaid,and E.M. Shevach. 2010. Expression of Helios, an Ikaros transcriptionfactor family member, differentiates thymic-derived from peripherallyinduced Foxp3+ T regulatory cells. J. Immunol. 184:3433–3441. https://doi.org/10.4049/jimmunol.0904028
Trapnell, C., A. Roberts, L. Goff, G. Pertea, D. Kim, D.R. Kelley, H. Pimentel,S.L. Salzberg, J.L. Rinn, and L. Pachter. 2012. Differential gene andtranscript expression analysis of RNA-seq experiments with TopHatand Cufflinks. Nat. Protoc. 7:562–578. https://doi.org/10.1038/nprot.2012.016
van der Maaten, L., and G. Hinton. 2008. Visualizing high-dimensional datausing t-SNE. J. Mach. Learn. Res. 9:2579–2605.
Wakamatsu, E., D. Mathis, and C. Benoist. 2013. Convergent and divergenteffects of costimulatory molecules in conventional and regulatory CD4+
T cells. Proc. Natl. Acad. Sci. USA. 110:1023–1028. https://doi.org/10.1073/pnas.1220688110
Wan, Y.Y. 2014. GATA3: a master of many trades in immune regulation.Trends Immunol. 35:233–242. https://doi.org/10.1016/j.it.2014.04.002
Wheaton, J.D., C.H. Yeh, and M. Ciofani. 2017. Cutting edge: c-Maf is re-quired for regulatory T cells to adopt RORγt+ and follicular pheno-types. J. Immunol. 199:3931–3936. https://doi.org/10.4049/jimmunol.1701134
Wohlfert, E.A., J.R. Grainger, N. Bouladoux, J.E. Konkel, G. Oldenhove, C.H.Ribeiro, J.A. Hall, R. Yagi, S. Naik, R. Bhairavabhotla, et al. 2011. GATA3controls Foxp3+ regulatory T cell fate during inflammation in mice.J. Clin. Invest. 121:4503–4515. https://doi.org/10.1172/JCI57456
Wong, J., R. Obst, M. Correia-Neves, G. Losyev, D. Mathis, and C. Benoist.2007. Adaptation of TCR repertoires to self-peptides in regulatory andnonregulatory CD4+ T cells. J. Immunol. 178:7032–7041. https://doi.org/10.4049/jimmunol.178.11.7032
Xu, L., A. Kitani, I. Fuss, and W. Strober. 2007. Cutting edge: regulatoryT cells induce CD4+CD25-Foxp3- T cells or are self-induced to becomeTh17 cells in the absence of exogenous TGF-β. J. Immunol. 178:6725–6729. https://doi.org/10.4049/jimmunol.178.11.6725
Xu, M., M. Pokrovskii, Y. Ding, R. Yi, C. Au, O.J. Harrison, C. Galan, Y. Bel-kaid, R. Bonneau, and D.R. Littman. 2018. c-MAF-dependent regulatoryT cells mediate immunological tolerance to a gut pathobiont. Nature.554:373–377. https://doi.org/10.1038/nature25500
Yang, X.O., R. Nurieva, G.J. Martinez, H.S. Kang, Y. Chung, B.P. Pappu, B.Shah, S.H. Chang, K.S. Schluns, S.S. Watowich, et al. 2008. Molecularantagonism and plasticity of regulatory and inflammatory T cell pro-grams. Immunity. 29:44–56. https://doi.org/10.1016/j.immuni.2008.05.007
Yang, B.H., S. Hagemann, P. Mamareli, U. Lauer, U. Hoffmann, M. Beckstette,L. Fohse, I. Prinz, J. Pezoldt, S. Suerbaum, et al. 2016. Foxp3(+) T cellsexpressing RORγt represent a stable regulatory T-cell effector lineagewith enhanced suppressive capacity during intestinal inflammation.Mucosal Immunol. 9:444–457. https://doi.org/10.1038/mi.2015.74
Yang, J., M. Zou, J. Pezoldt, X. Zhou, and J. Huehn. 2018. Thymus-derivedFoxp3+ regulatory T cells upregulate RORγt expression under inflam-matory conditions. J. Mol. Med. (Berl.). 96:1387–1394. https://doi.org/10.1007/s00109-018-1706-x
Yissachar, N., Y. Zhou, L. Ung, N.Y. Lai, J.F. Mohan, A. Ehrlicher, D.A. Weitz,D.L. Kasper, I.M. Chiu, D. Mathis, and C. Benoist. 2017. An intestinalorgan culture system uncovers a role for the nervous system inmicrobe-immune crosstalk. Cell. 168:1135–1148.e12. https://doi.org/10.1016/j.cell.2017.02.009
Zemmour, D., R. Zilionis, E. Kiner, A.M. Klein, D. Mathis, and C. Benoist.2018. Single-cell gene expression reveals a landscape of regulatoryT cell phenotypes shaped by the TCR. Nat. Immunol. 19:291–301. https://doi.org/10.1038/s41590-018-0051-0
Zilionis, R., J. Nainys, A. Veres, V. Savova, D. Zemmour, A.M. Klein, and L.Mazutis. 2017. Single-cell barcoding and sequencing using droplet mi-crofluidics. Nat. Protoc. 12:44–73. https://doi.org/10.1038/nprot.2016.154
Pratama et al. Journal of Experimental Medicine 16
Time matters for pTreg cells https://doi.org/10.1084/jem.20190428
Dow
nloaded from http://rupress.org/jem
/article-pdf/217/1/e20190428/874910/jem_20190428.pdf by guest on 06 February 2022