art of conducting visitor research
TRANSCRIPT
Art of Conducting Research
Rahul Jain Product ManagerVWO
Abhishek MandloiProduct ManagerVWO
Dinesh KasliwalCustomer Success ManagerVWO

Ask Questions on Twitter
#AskVWO

A step-by-step approach to increase conversions
Conversion Rate Optimization Process
Research Phase
Tracking metrics and identifying what
parts of conversion funnel need fixing
Hypothesis Phase
Constructing educated hypothesis,
based on your research
Prioritization Phase
Planning and prioritizing your hypothesis
Testing Phase
Testing your hypothesis against the existing
version of the website
Learning Phase
Deploying the winning hypothesis and/or
gathering learning for subsequent tests

We know it can be very frustrating to
figure out what visitors want…1 in 8• So how do you measure the impact of
web testing on organizational learning?
• How do you understand why tests fail?
• How do you keep from constantly
chasing short-term goals? What about
the bigger picture?
Only
creates a major impact on
conversions.
A/B TESTS

Research Potential
1 million monthly traffic
30% bounce rate
700k Qualified Visitors
30% to 70% people are in market to buy
350k Potential buyers
7000 completed orders
343,000 visitors is our opportunity

What are different ways to
research customers?

What are different
ways to research
customers?• Quantitative Methods
• Qualitative Methods
• Technical
• Heuristic

• Web Analytics
• Conversion Funnel Tracking
• Form Analytics
Quantitative Methods
Collecting metrics about users on
how they interact and engage with
your web properties

Quantitative data shows you what is
happening, but why it is happening is
discovered by qualitative tools.
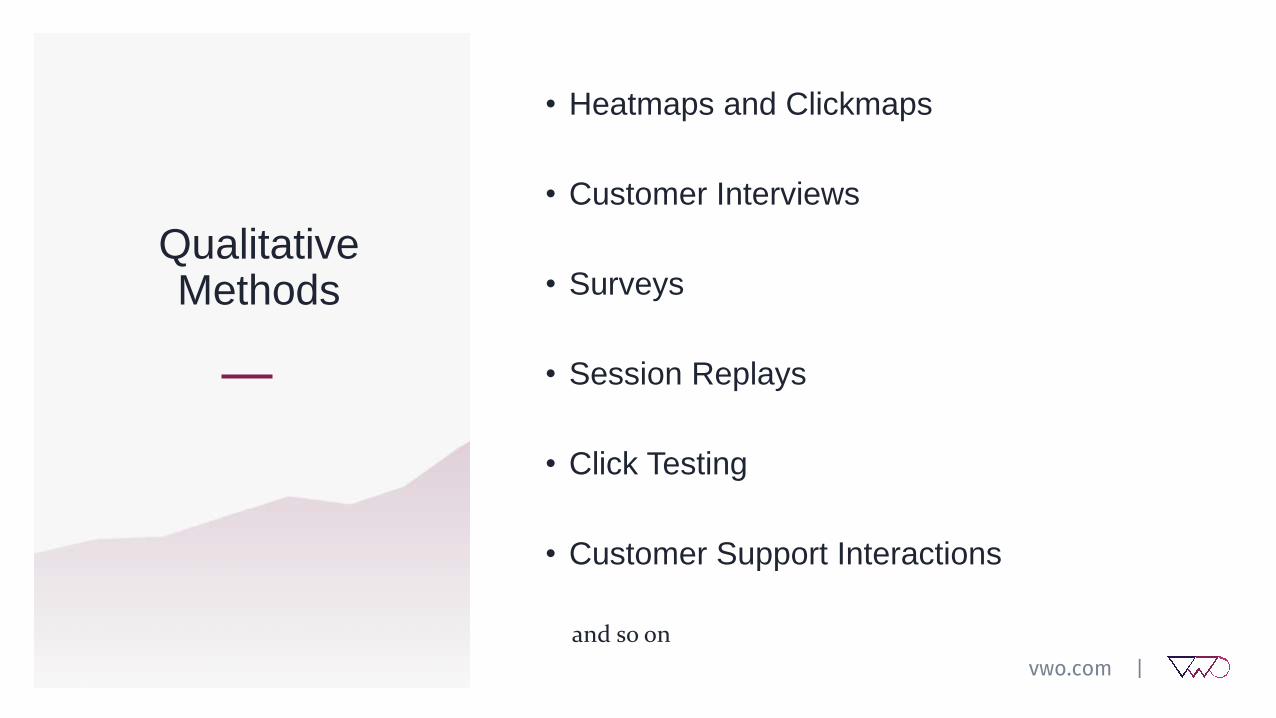
• Heatmaps and Clickmaps
• Customer Interviews
• Surveys
• Session Replays
• Click Testing
• Customer Support Interactions
QualitativeMethods
and so on

Technical Research Heuristic Analysis
Discovering broken
functionality and user
experience
• Browsers
• Devices
• Page load speed
Evaluation of a website by a
usability expert against a set
heuristics to identify potential
conversion barriers.

Challenges with different
research methodologies

Research Challenges
• Keeping close eye on business metrics
• Which methods to chose?
• Understanding and documenting customer’s mind with data and evidence.
• Connecting research tools to derive more value

How VWO overcomes
common research
chal lenges?

OvercomingResearch
Challenges
Keeping close eye on business metrics
1) Define business objectives
2) Create goals in terms of metrics of these
objectives
3) Start with Macro conversions
4) Setup micro conversions that form part of macro
conversions
5) Create funnels of most important pathways
Start Baselining measurements
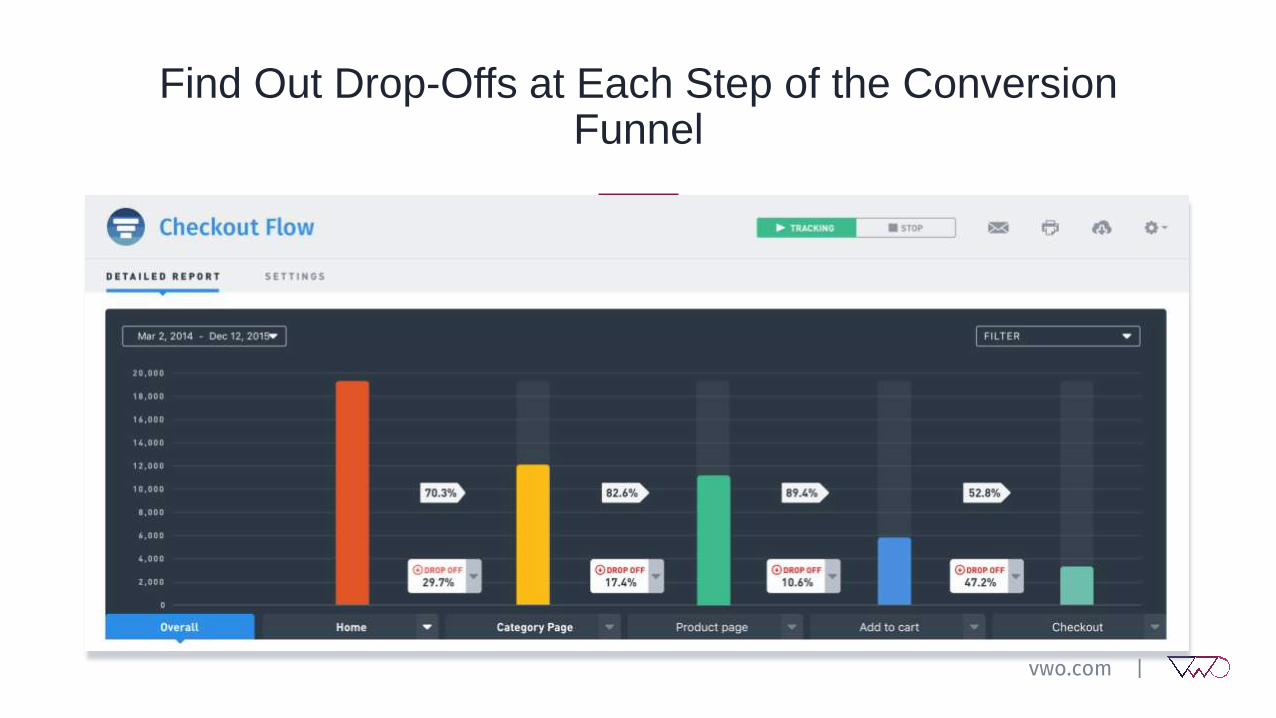
Find Out Drop-Offs at Each Step of the Conversion Funnel
VWO’s Plan layer

OvercomingResearch
Challenges
Which methods to chose?
1) Web analytics
2) Surveys
3) Heatmaps and Clickmaps
4) Visitor Recordings (Session Replays)
5) User Testing
6) Form Analysis
7) Heuristic Analysis (Expert Reviews)
8) Customer Interviews
9) Click testing
10) 5 second test

98% (103) views
Heatmaps
Session Replays
Customer interviews
Surveys
Web analytics
User Testing
Expert Reviews
Click testingFive second test
Card sorting/Tree testing
Form Analytics
Va
lue
of in
sig
hts
Low
High
Difficulty in generating insightsDifficult Easy
Maximum insights with minimum inputs

OvercomingResearch
Challenges
• Understanding and documenting customer’s mind with data and evidence.

OvercomingResearch
Challenges
• Connecting research tools to derive more value

Analyzing Heatmaps and Recordings where users dropped off

Analyzing Recordings where users saw particular variation

Analyzing Recordings where users converted to a particular goal

Adopting the
right process
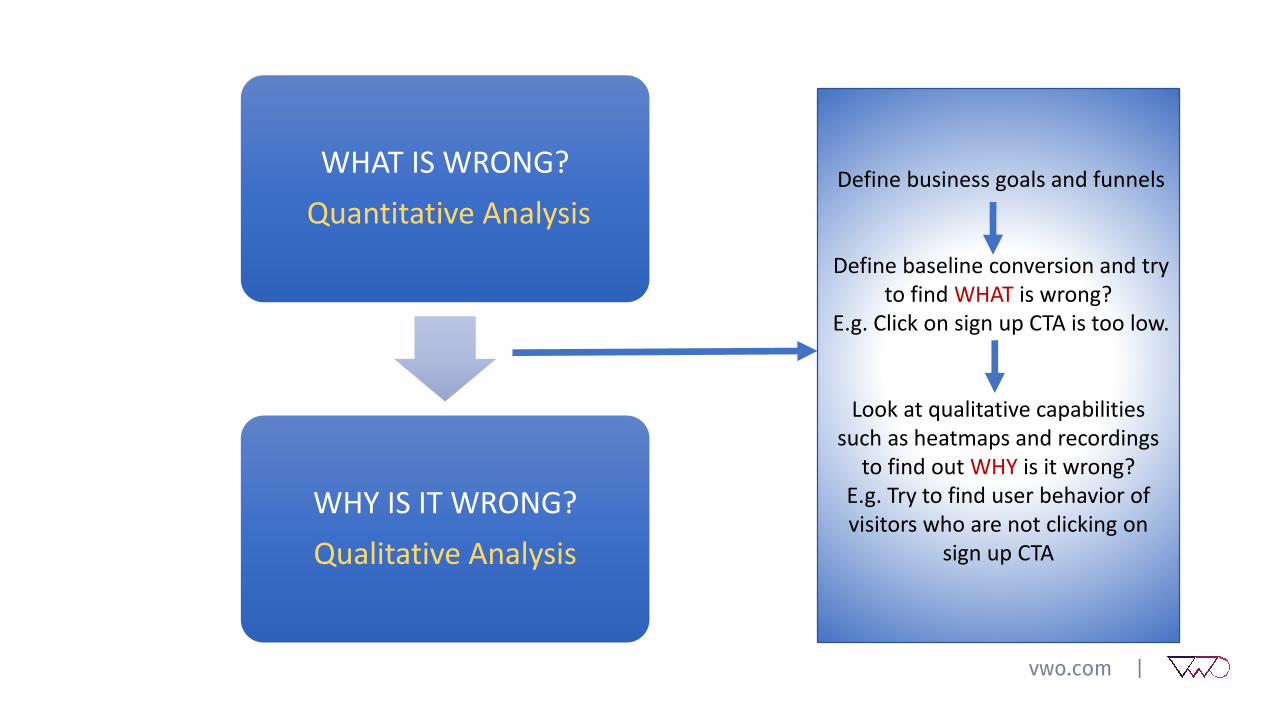
WHAT IS WRONG?
Quantitative Analysis
WHY IS IT WRONG?
Qualitative Analysis
Define business goals and funnels
Define baseline conversion and try to find WHAT is wrong?
E.g. Click on sign up CTA is too low.
Look at qualitative capabilities such as heatmaps and recordings
to find out WHY is it wrong? E.g. Try to find user behavior of visitors who are not clicking on
sign up CTA

Strategy to analyze Session replays
Exit PagesBounce pages
Converted vs Non
converted
Custom data/Labels


Form Analytics
Go beyond tracking form
submission rates. Form
analytics help you
understand how visitors
interact with every form
field. It gives you insights
on where visitors hesitate
and drop off
98% (103) views
58% (61) views
27
%
34
%of the visitors
submitted the form
20.5 seconds
Total time spent on
completing this
field
10.3 seconds
Time spent by
visitors hesitating
to give this data
20
%of the visitors drop
off on this field
of the visitors refill
this field

Heat & Scroll Maps
Find conversion
barriers
Findability/Visitor
Flow
Dead links
Navigation
menus/Hidden
elements
In page funnelEngagement with
content

Conversion barriers
Navigation bar
distracting users from
the primary goal of this
page which is to
download the app

Visitor Flow
A heatmap report of the
HIAA home page revealed
interesting insights—68%
of all clicks on the home
page were on the
Departures tab and only
6% clicked back to the
Arrivals tab

Findability - Navigation menus

In page funnel
A sharp drop-off of 40
%age points happens here
and content below this is
going to be ineffective.
Also acts as a in page
funnel representation

A lot of visitors are clicking
on the cube and its
branches thinking that
these are links.
Dead Links

Discovering visitors’ intent using Surveys
Tirecraft.com conducted an
exit intent survey to
understand why visitors
leave and found out that
non-availability of Pricing is
the biggest reasonI prefer to buy tires in person
There was no pricing information available
I want more information about the tires
I cant buy the tires I want online
Other

vwo.com
Thank you
Q&A