art ii – a s urvey of applicationsneuro.bstu.by/ai/to-dom/my_research/papers-0/for... · 5...
TRANSCRIPT

ARTIFICIAL IMMUNE SYSTEMS:
PART II – A SURVEY OF APPLICATIONS
Leandro Nunes de [email protected]
http://www.dca.fee.unicamp.br/~lnunes
Fernando José Von [email protected]
http://www.dca.fee.unicamp.br/~vonzuben
Technical Report
DCA-RT 02/00
February, 2000

1
Summary
SUMMARY .......................................................................................................................................................................1
INDEX OF FIGURES AND TABLES ............................................................................................................................3
1. INTRODUCTION ...................................................................................................................................................5
1.1 A PIONEER WORK .................................................................................................................................................6
2. ROBOTICS ..............................................................................................................................................................7
2.1 BEHAVIOR ARBITRATION MECHANISMS................................................................................................................7
2.2 EMERGENCE OF COLLECTIVE BEHAVIOR...............................................................................................................9
3. CONTROL.............................................................................................................................................................10
3.1 IDENTIFICATION, SYNTHESIS AND ADAPTIVE CONTROL......................................................................................10
3.2 SEQUENTIAL CONTROL........................................................................................................................................11
4. OPTIMIZATION ..................................................................................................................................................12
4.1 CONSTRAINED OPTIMIZATION .............................................................................................................................12
4.2 MULTI-MODAL OPTIMIZATION ............................................................................................................................13
4.3 COMBINATORIAL OPTIMIZATION (N-TSP PROBLEM)...........................................................................................15
5. NEURAL NETWORK APPROACHES..............................................................................................................17
5.1 SIMILARITIES AND DIFFERENCES.........................................................................................................................17
5.2 A GROWING BOOLEAN COMPETITIVE NETWORK................................................................................................18
5.3 ASSOCIATIVE MEMORY.......................................................................................................................................19
5.4 AN UNORTHODOX NEURAL NETWORK................................................................................................................20
5.5 A MULTI-EPITOPE APPROACH.............................................................................................................................21
6. ANOMALY DETECTION ...................................................................................................................................22
6.1 COMPUTER SECURITY..........................................................................................................................................22
6.2 DNA-BASED NEGATIVE SELECTION ...................................................................................................................23
6.3 VIRUS DETECTION AND ELIMINATION .................................................................................................................24
6.4 IMAGE INSPECTION SYSTEM ................................................................................................................................25
6.5 IMAGE SEGMENTATION........................................................................................................................................26
6.6 NOVELTY DETECTION IN TIME SERIES DATA ......................................................................................................27
7. AGENT-BASED APPROACHES........................................................................................................................28
7.1 NETWORK SECURITY...........................................................................................................................................28
7.2 COMPUTER VIRUS DETECTION AND ELIMINATION ..............................................................................................32
7.3 INTELLIGENT BUILDINGS.....................................................................................................................................33

2
7.4 ADAPTIVE NOISE NEUTRALIZATION ....................................................................................................................34
8. LEARNING............................................................................................................................................................35
8.1 PATTERN RECOGNITION.......................................................................................................................................35
8.2 CONCEPT LEARNING............................................................................................................................................36
8.3 THE BALDWIN EFFECT.........................................................................................................................................38
8.4 GENERATION OF EMERGENT PROPERTIES............................................................................................................38
9. INDUCTIVE PROBLEM SOLVING..................................................................................................................39
9.1 FINITE-STATE AUTOMATON ................................................................................................................................39
9.2 GENETIC PROGRAMMING.....................................................................................................................................40
10. PATTERN RECOGNITION................................................................................................................................41
10.1 A GENERAL APPROACH.......................................................................................................................................41
10.2 SPECTRA RECOGNITION.......................................................................................................................................42
11. COMPUTER MODELS........................................................................................................................................43
11.1 CELLULAR AUTOMATON MODEL.........................................................................................................................43
11.2 MULTI-AGENT MODEL........................................................................................................................................44
11.3 DISEASE PROCESSES............................................................................................................................................45
12. OTHER APPROACHES ......................................................................................................................................46
12.1 OPEN WEBSERVER COORDINATION.....................................................................................................................46
12.2 SCHEDULING........................................................................................................................................................47
12.3 DATA MINING......................................................................................................................................................49
12.4 CLASSIFIER SYSTEMS..........................................................................................................................................51
12.5 SENSOR-BASED DIAGNOSIS.................................................................................................................................52
12.6 THE REFLECTION PATTERN IN THE IMMUNE SYSTEM..........................................................................................53
12.7 EVOLUTION OF GENE LIBRARIES.........................................................................................................................54
12.8 A SELF-IDENTIFICATION PROCESS.......................................................................................................................55
12.9 A SIMULATED ANNEALING MODEL OF DIVERSITY..............................................................................................55
13. WEB SITES ON ARTIFICIAL IMMUNE SYSTEMS AND THEIR APPLICATIONS................................56
14. CONCLUDING REMARKS ................................................................................................................................59
REFERENCES................................................................................................................................................................61

3
Index of Figures and Tables
Figure 1: (a) Environment for testing the consensus-making algorithm based on immune networks. (b) Definition of anantibody.....................................................................................................................................................................8
Figure 2: Immunized computational system structure. BCS corresponds to the base-line computational system(representing an average behavior of the uncertain system), and CCS corresponds to the changeablecomputational system (representing the variable region of the antibody and epitope equivalents).........................11
Figure 3: Encoding scheme for the case of a Fuzzy and a Neural Network building block. The parameter ‘variable’ canassume any linguistic value (altitude, speed, etc.), and ‘relationship’ represents any logical antecedent (AND, OR,etc.) or consequent (THEN). The neural net building block is responsible for describing the network architectureand weight values....................................................................................................................................................11
Figure 4: (a) Example of structural optimization problem studied. (b) Constraint elimination using immune principles..................................................................................................................................................................................13
Figure 5: Flow chart of the immune algorithm................................................................................................................14
Figure 6: The clonal selection algorithm. (a) Block diagram. (b) Step-by-step procedure..............................................15
Figure 7: (a) n-TSP agents. (b) Proposed immune algorithm (IA) for solving the n-TSP problem. Each immune cell setis composed of three kinds of cells, called a macrophage, a B and a T-cell............................................................16
Figure 8: ABNET. (a) Main steps of the learning algorithm. (b) Weights updating procedure.......................................19
Figure 9: Basic features of the network supervised learning algorithm without changing the synaptic connectionstrengths (W ij). When a set of stimuli has been learnt, the system remains in the cycle shown in double linearrows. δ is a predefined threshold..........................................................................................................................20
Figure 10: Anomaly detection algorithm. (a) Generation of valid detector set (censoring). (b) Monitoring of protecteddata..........................................................................................................................................................................23
Figure 11: DNA implementation. (a) Censoring. (b) Monitoring....................................................................................24
Figure 12: Main components of the computer immune system and their relationship.....................................................25
Figure 13: (a) Genetic encoding for the detectors. (b) Suppression of detector C that (partially) covers the same portionof the pattern space. A new detector D is created....................................................................................................26
Figure 14: (a) Architecture of the AIS for computer network security. (b) Life cycle of a detector................................29
Figure 15: Physical architecture of an artificial immune system for network intrusion detection...................................31
Figure 16: Conceptual view of the proposed multi-agent intrusion detection system......................................................31
Figure 17: (a) Diagram of the anti-virus system. (b) Virus neutralization by antibody agent..........................................32
Figure 18: (a) Schematic diagram of the immune algorithm. (b) Immune algorithm for an agent-based architecture....34
Figure 19: (a) The immune system object algorithm. (b) Structure of a B-cell object.....................................................36
Figure 20: B-cell genotype to phenotypic mapping.........................................................................................................37
Figure 21: Non-linear relation between binding value and match score for a bit string of length L = 7 and affinitythreshold ε = 2.........................................................................................................................................................38
Figure 22: Deterministic finite-state automaton subject of learning................................................................................40
Figure 23: Spectra recognition. (a) Evolving specialists. (b) Algorithm for recognition.................................................43
Figure 24: (a) Rules for the proposed cellular automaton model. (b) Steps in the simulation.........................................44
Figure 25: Multi-agent system model..............................................................................................................................45
Figure 26: (a) Structure of an antibody in the iNet. (b) A UML class diagram for a kernel of iNet................................47
Figure 27: Generating an antibody from a set of l gene libraries composed of c components of length s. ......................48
4
Figure 28: Integer-valued encoding for the antigen and antibody molecules, together with the matching function. Amatch between number corresponds to a score of 5 and a don’t care corresponds to a score of 1..........................49
Figure 29: Case-Based Reasoning architecture................................................................................................................50
Figure 30: (a) Structure of a case (antigen or antibody). (b) The match algorithm (see Equation (11))..........................50
Figure 31: An example of evaluation chain for sensor-based diagnosis..........................................................................53
Figure 32: (a) Typical reflective architecture. (b) Sequence diagram for the reflection pattern in the MHC/peptidecomplex recognition................................................................................................................................................54
Figure 33: Process of constructing/expressing an antibody from genetic libraries..........................................................55
Table 1: Relationship between DARS and the immune system.........................................................................................9
Table 2: Trade-off between the immune system and the intelligent control strategy.......................................................11
Table 3: Comparison between the immune algorithm and the immune system...............................................................14
Table 4: Immune cells and molecules and their roles in the n-TSP problem solving.......................................................16
Table 5: Relationship between the biological immune system and the proposed neural network model.........................21
Table 6: Components of the immune system that satisfy the requirements for the development of an efficient intrusiondetection system (IDS)............................................................................................................................................30
Table 7: Relationship between the network intrusion detection system and the immune system. IDS: IntrusionDetection System.....................................................................................................................................................30
Table 8: Comparison of machine learning approaches. SO: Self-Organizing, U: Unsupervised, NTE: Negative TrainingExamples, OS/IN: One Shot/Incremental, SY: Symbolic, NT: Noise Tolerant, XOR: XOR problem...................36
Table 9: Mapping between the automata approach and the biological immune system...................................................40
Table 10: Analogy between the genetic programming and the biological immune system.............................................41
Table 11: Immunogenetic spectra recognition.................................................................................................................42
Table 12: Tentative comparison between the AIS and classifier systems........................................................................51
Table 13: Comparison of the major components of a classifier system and an immune system......................................51
5
ARTIFICIAL IMMUNE SYSTEMS:PART II – A SURVEY OF APPLICATIONS
Leandro Nunes de [email protected]
Fernando José Von [email protected]
Technical ReportDCA-RT 02/00February, 2000
1. Introduction
The first part of this report (De Castro & Von Zuben, 1999) is intended to present the basic theory
and concepts necessary for the development of immune-based systems. It brings an instructive
introduction to the mammal immune system and depicts its most relevant aspects from the
viewpoint of engineering. Mechanisms like the clonal selection theory, the immune response along
with its affinity maturation process and the immune network hypothesis are emphasized. A few
computational algorithms were developed and applied to several different types of problems in
order to demonstrate how principles gleaned from the immune system can and must be used in the
design of engineering tools for solving complex tasks. In addition, it is introduced an emerging area
of research, called immune engineering. The immune engineering is comprised of several strategies,
like artificial immune systems, immune-based systems, immunogenetic approaches, etc., and is
supposed to include any technique developed using ideas from immunology.
In this second part of the report, it will be assumed that the reader is familiar with the immune
system, so that no description about the basic immunological phenomena will be presented. If it is
the case, the first part of the report might be consulted. In this text, we are going to make a brief
description of several applications that used immune metaphors, or mechanisms, to solve problems
which are usually dealt with artificial intelligence (AI) techniques. Artificial intelligence strategies
were developed aiming at finding solutions to a broad class of problems, named complex problems,
which could not be resolved by traditional methods, like linear, non-linear, multi-objective and
dynamic programming, search trees, graph theory etc. As will be seen, some of the methods
presented in this text constitute hybrid approaches, where AI techniques, like neural networks, fuzzy
systems and most influentially evolutionary strategies, were combined with immune phenomena
and/or metaphor leading to the emergence of new computational paradigms.

6
Our goal is to bring together many works involving the immune system as far as to list and
detach the main characteristics and potential applicability of each of the methods presented. Very
few details about the applications themselves and their results are given, instead a brief description,
focusing on the coding schemes, evaluation functions and how the methods are viewed under an
immune perspective are the contents of this text.
The methods are distributed by subject and/or application, but even if some of them might
belong to more than one class, it will be put into a single category. The illustrations were taken or
adapted from the original works presented in the listed literature, and some explanations might
simplify the original ones in order to make this report a comprehensive survey. At last, to keep the
original terminology and lists of symbols used by each author, we did not follow any standard in
our descriptions.
1.1 A Pioneer Work
The paper by Farmer et al. (1986) is considered the pioneer work relating the immune system to
other artificial intelligence approaches. They described a dynamical model for the immune system
based upon the immune network hypothesis. This model consisted of a set of differential equations,
together with a threshold to remove useless antibody types, and genetic operators to introduce new
ones. They showed that the equations of motion for the immune system and a proposed learning
classifier system assume the same form, illustrating that these equations can have a broad utility for
learning.
In fact, they were right with relation to the application of their model for solving engineering
problems. As will be seen along this text, their “artificial immune system” served as a source of
inspiration for several other immune-based strategies.
The immune cell and molecules were represented as binary strings of various lengths. An
antibody molecule was represented by its epitope and paratope, concatenated in a single string.
To model the fact that two molecules may react in more than one way, strings are allowed to
match complementarily in any possible alignment. Equation (1) specifies the matrix of matching
specificities mij
∑ ∑
+−∧+=
k njiij snpkneGm ,1)()( (1)
where G(x) = x for x > 0 and G(x) = 0 otherwise, ei(n) is the n-th bit of the i-th epitope, pj(n) is the
n-th bit of the j-th paratope, ∧ corresponds to the complementary matching rule (XOR operation),

7
and s is a matching threshold. If matches occur in more than one alignment, their strengths are
summed.
To model the network dynamics, it is assumed N antibody types with concentrations {x1,...,xN}
and n antigens with concentrations {y1,...,yn}. The set of differential equations
,21 1
11
i
N
j
n
jjijijiij
N
jjijii xkyxmxxmkxxmcx −
+−= ∑ ∑∑
= ==
� (2)
where the first term represents the stimulation of the paratope of an antibody type i by the epitope of
an antibody j. The second term represents the suppression of antibody of type i when its epitope is
recognized by the paratope of type j. The parameter c is a rate constant that depends on the number
of collisions per unit time and the rate of antibody production stimulated by a collision. Constant k1
represents a possible inequality between stimulation and suppression. The third term models the
antigen concentrations and the last term models the tendency of cells to die (natural death rate, k2).
Genetic operators, like crossover, point mutations and inversion were used to generate new
antibody types.
2. Robotics
Robots can be defined as programmable, multifunctional manipulators designed to move material,
parts, tools, or specialized devices through various programmed motions for the performance of a
variety of tasks. Nowadays, one of the most difficult tasks in robotics is the so-called autonomous
navigation problem, where a robot, or a set of robots, has to perform certain tasks without any
external guidance. In this section, we will describe how immune principles are being applied to the
autonomous navigation problem.
2.1 Behavior Arbitration Mechanisms
The main works of Ishiguro et al. (1996, 1997) and Watanabe et al. (1998, 1999) focused on the
development of a dynamic decentralized consensus-making mechanism based on the immune
network theory. In their approach, “intelligence” was expected to emerge from mutual interactions
among agents (called competence modules) and between a robot and its environment. The open
questions they tried to solve were the construction of a mechanism that realizes appropriate
arbitration (decision) among multiple modules and how to prepare these modules. Their method
was evaluated on a garbage-collecting problem taking into account self-sufficiency (autonomy), i.e.
a robot had to collect a set of garbage and put it inside a garbage can without running out of energy
(battery level). Figure 1(a) illustrates the problem.

8
The robot, called immunoid, was assumed to consume energy at every time step, when loaded
with garbage and when it collided with obstacles. The antigens were responsible for informing the
existence of garbage (direction), obstacle (direction) and home base (direction and distance), and
also the current internal energy level. A pair of desirable condition/action rules was assigned to the
paratope of each antibody, and the ID-number of the interacting antibodies was assigned to their
idiotopes (see Figure 1(b)). The desirable condition is the same as the antigen. The antibody
concentration level allowed the selection of the antibodies for a given antigen. Such a scheme made
the antibodies responsible for the correct acting of the robot. Their model included the concepts of
dynamics, responsible for the variation of the concentration level of antibodies, and metadynamics,
which maintained the appropriate repertoire of antibodies by incorporating new types and removing
useless ones. The concentration of the i-th antibody (ai) was given by Equation (3):
,))1(5.0exp(1
1)1(
,)(�.)(.
)(
11
+−+=+
−+−= ∑∑
==
tAta
takmamtamdt
tdA
ii
i
N
jiikik
N
jjji
i
(3)
where N is the number of antibodies, α and β are positive constants, mji and mi denote affinities
between Ab j and Ab i and between the detected antigens and Ab i, respectively. The first and
second terms indicate stimulation and suppression from other antibodies, while the third term
represents stimulation from the antigen. The fourth term corresponds to the natural death rate. The
equation in the bottom is a squashing function aiming at ensuring the stability of the concentration.
Garbage
Robot
Garbage can Battery charger
Far
Middle
Near
Desirable Interacting antibodiescondition and degree of interaction
Action
Paratope Idiotope
(a) (b)
Figure 1: (a) Environment for testing the consensus-making algorithm based on immune networks.(b) Definition of an antibody.

9
2.2 Emergence of Collective Behavior
For a collective behavior to emerge, a set of agents must communicate with each other and with
their environment. The objective of the system proposed by Jun et al. (1999) and Lee et al. (1999)
was that a set of robots (agents) found and carried out tasks spread along a given environment. They
used the clonal selection principle, together with the immune network theory and B-T-cell
interactions to cooperatively control and select a group of behavior strategies for Distributed
Autonomous Robotic Systems (DARS). The executing process of their method had to be robust
enough to overcome dynamic changes in environmental conditions. The behavior of each robot had
to be stimulated and/or suppressed by other robots.
In the DARS system, the robots have to individually understand the objective of the system, the
environment, the behavior of other robots etc., and decide their own behavior autonomously to
cooperate with other agents aiming at establishing and maintaining the order of the whole system.
No central control is supposed to exist. The clonal selection algorithm was used for transmitting
high quality strategies among robots, while the immune network of antibodies controlled the
interactions among individual robots and the B-T-cell interactions regulated the adaptability of the
agents to the changing environment. Table 1 summarizes the relationship between DARS and the
immune system.
To improve the adaptability of their system, the authors proposed a modified set of immune
network equations that took into account the functions of a helper T cell and a suppressor T cell:
Table 1: Relationship between DARS and the immune system.
DARS Immune System
Environment Antigen
Strategy of Action Antibody
Robot B-cell
Control Parameter T-cell
Adequate Stimulus
Inadequate Suppression
Excellent Robot Plasma cell
Inferior Robot Inactivated cell

10
),())(1(�)(
,))1(5.0exp(1
1)1(
,)()1(�.
)(.
)1()(11
tStgtc
tSta
tsktcgsmN
tsmN
tStS
iii
ii
i
N
jiiikik
N
jjjiii
−=+−+
=+
−−−+−+−= ∑∑
==(4)
where Si is the stimulus for antibody i, si is the concentration of antibodies, mij is the mutual
stimulus coefficient, gi is the affinity of Ab i with the antigen, α, β and η are positive constants and
k is the natural death rate. ci is the concentration of T-cells that control the concentration of
antibodies. Depending upon gi and Si, ci will take the role of a helper or suppressor T-cell.
3. Control
In modern control engineering a lot of effort is put into designing robust control algorithms that can
meet the steadily increasing demands for high performance. The immune system learning
mechanisms, like clonal selection and affinity maturation, together with its network dynamics,
suggest successful applications of these metaphors to the control theory.
3.1 Identification, Synthesis and Adaptive Control
Krishnakumar et al. (1995) and Krishnakumar & Neidhoefer (1997a,b, 1999) defined the
Immunized Computational Systems (ICS) that used the immune system metaphor along with
computational (both hard and soft computing) techniques to attempt to reproduce the robustness and
adaptability of a biological immune system. The strategy was tested on an autonomous aircraft
control problem.
Their system constituted a hybrid structure whose building blocks, mimicking the immune
building blocks, were composed of artificial neural networks, fuzzy systems and evolutionary
algorithms. Their immune metaphor focused on the clonal selection principle, together with the
affinity maturation of the immune response. Table 2 depicts their viewpoint of the trade-off
between the immune system and the intelligent control theory. Figure 2 depicts the basic structure
of their immunized computational system.
They used messy strings to form a population of CCS (changeable computational systems),
which represented the Ag and Ab equivalents. Figure 3 exemplifies a few types of information that
could be inserted in the strings that represented the immune molecules. A collection of building
blocks was assembled together in order to generate a population of computational systems, which
were subject to evolution through genetic operators and selection.

11
Table 2: Trade-off between the immune system and the intelligent control strategy.
Immune Response Intelligent Control
Antigen is present in the system Disturbance is present in the system
Innate immunity is the first line of defense Robust feedback control (non-adaptive)
Ag presentation (by macrophages) cause T-cell response (adaptation)
A utility function translates the disturbancesinto an error function and presents it to thecritic which starts the adaptation process
T-cells activate B-cell response (adaptation)to counteract antigen
The adaptive critics modify the controllerparameters to counteract disturbances
For certain types of Ag, the B-cells aretriggered without the help of T-cells but stillwith the help of some APC’s
For certain classes of disturbances, thecontroller is adapted directly based on autility measure
LearningSystem
ComputationalBuildingBlocks
ExploratorySystem
UncertainSystem
BCS
CCS
Figure 2: Immunized computational system structure. BCS corresponds to the base-line computationalsystem (representing an average behavior of the uncertain system), and CCS corresponds to the changeablecomputational system (representing the variable region of the antibody and epitope equivalents).
Variable Relashionship Variable ‘From’ Unit Weight Value ‘To’ Unit
Fuzzy Building Block Neural Net Building Block
Figure 3: Encoding scheme for the case of a Fuzzy and a Neural Network building block. The parameter‘variable’ can assume any linguistic value (altitude, speed, etc.), and ‘relationship’ represents any logicalantecedent (AND, OR, etc.) or consequent (THEN). The neural net building block is responsible fordescribing the network architecture and weight values.
3.2 Sequential Control
Finding a proper execution sequence for a set of actuators such that the system achieves a desired
state from a known initial state is the main goal of a sequential control approach. Ootsuki &
Sekiguchi (1999) proposed a method for determining control sequences of a sequential control plant
based on the immune system. They used the Petri Nets formalism and the immune network theory to
develop their model.

12
The discrete dynamic behavior of the components of a sequential control plant was modeled as
state machines structured as Petri nets. Hence, the determination of control sequences became
equivalent to the determination of firing sequences for the Petri net models, which were
decomposed into several sub-problems. The objective function of each sub-problem was set to
satisfy constraints and minimize the objective function of a distributed (immune) network. The
dynamics of the system was controlled by a set of differential equations, which described the
interactions among the network elements. Their approach was compared to a conventional one, and
its performance was superior for larger models with distributed characteristics and high degree of
freedom in its components.
4. Optimization
Optimization is the task of finding the absolutely best set of admissible conditions to achieve a
certain objective, formulated in mathematical terms. Problems in optimization arise in a broad area
of applications. This section will present immune-based systems specially designed to solve
constrained, multi-modal and combinatorial optimization problems.
4.1 Constrained Optimization
Hajela & Lee (1996), Hajela et al. (1997) and Hajela & Yoo (1999), described the implementation
of a constrained genetic search to simulate the mechanics of a biological immune system. The
authors argued that the immune system capabilities of performing schema (pattern) recognition and
adaptation could be used advantageously to improve the performance of genetic algorithms in
structural optimization problems. Their work focused on two aspects: using the immune system
capabilities to enhance the convergence of a GA approach, and handling the design of constraints in
the GA based optimization. Their approach was applied to the problem of optimally designing a 10-
bar truss structure for minimum weight and with pre-defined allowable constraints on maximum
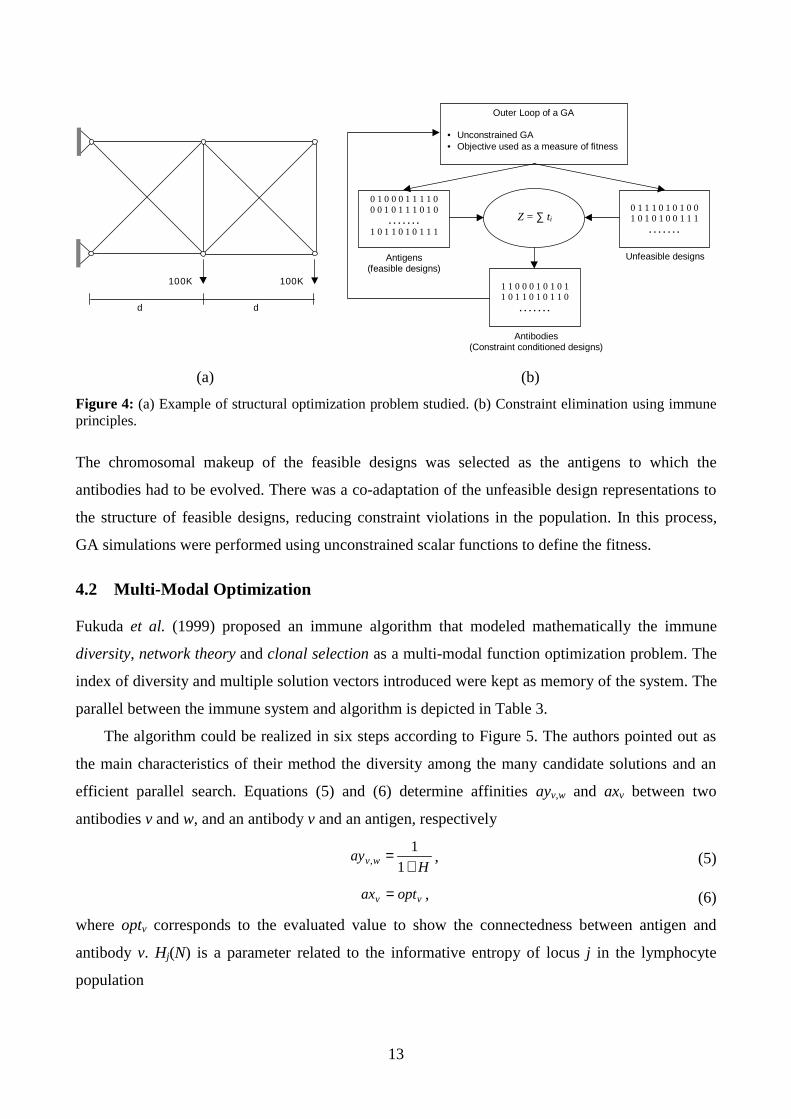
stresses of tension and compression in the bar elements (see Figure 4(a) for an illustration).
Like the majority of GA applications, they used a binary encoding for the strings representing
the immune components (antigens and antibodies). The fitness of an individual was determined by
its ability to recognize either a specific or a broad group of antigens, given by a function that
measured the number of matching bits between a pair of strings: Z = ∑ ti, where ti = 1 if there was a
match in the i-th location of the two strings, and 0 otherwise. The process of handling constraints in
their algorithm is depicted in Figure 4(b).
13
100K 100K
d d
Outer Loop of a GA
• Unconstrained GA• Objective used as a measure of fitness
0 1 0 0 0 1 1 1 1 00 0 1 0 1 1 1 0 1 0
. . . . . . .1 0 1 1 0 1 0 1 1 1
0 1 1 1 0 1 0 1 0 01 0 1 0 1 0 0 1 1 1
. . . . . . .
1 1 0 0 0 1 0 1 0 11 0 1 1 0 1 0 1 1 0
. . . . . . .
Z = ∑ ti
Antigens(feasible designs)
Unfeasible designs
Antibodies(Constraint conditioned designs)
(a) (b)
Figure 4: (a) Example of structural optimization problem studied. (b) Constraint elimination using immuneprinciples.
The chromosomal makeup of the feasible designs was selected as the antigens to which the
antibodies had to be evolved. There was a co-adaptation of the unfeasible design representations to
the structure of feasible designs, reducing constraint violations in the population. In this process,
GA simulations were performed using unconstrained scalar functions to define the fitness.
4.2 Multi-Modal Optimization
Fukuda et al. (1999) proposed an immune algorithm that modeled mathematically the immune
diversity, network theory and clonal selection as a multi-modal function optimization problem. The
index of diversity and multiple solution vectors introduced were kept as memory of the system. The
parallel between the immune system and algorithm is depicted in Table 3.
The algorithm could be realized in six steps according to Figure 5. The authors pointed out as
the main characteristics of their method the diversity among the many candidate solutions and an
efficient parallel search. Equations (5) and (6) determine affinities ayv,w and axv between two
antibodies v and w, and an antibody v and an antigen, respectively
Hay wv +
=1
1, , (5)
vv optax = , (6)
where optv corresponds to the evaluated value to show the connectedness between antigen and
antibody v. Hj(N) is a parameter related to the informative entropy of locus j in the lymphocyte
population

14
Table 3: Comparison between the immune algorithm and the immune system.
Immune System Immune Algorithm
Antigen Problem to be solved
Antibody Best solution vector
Recognition of antigen Identification of the problem
Production of antibody from memory cells Recalling a past successful solution
Lymphocyte differentiation Maintenance of good solutions (memory)
T-cell suppression Elimination of surplus candidate solutions
Proliferation of antibody Use of genetic operators to create new antibodies
Recognition of problem
Production of candidatesolutions
Function and diversityevaluation
Production of newvariables (GA)
Selection of variables
Storage of local-optimaas memory cells
Figure 5: Flow chart of the immune algorithm.
,)(1
)(
, log )(
1
1i,,
∑
∑
=
=
=
−=
M
jj
S
jijij
NHM
NH
ppNH
(7)
where N is the size of the antibodies, S the variety of allele and pi,j the probability that locus j is
allele i.
De Castro & Von Zuben (2000a) presented a clonal selection algorithm, which took into
account the affinity maturation of the immune response, in order to solve complex problems, like
learning and multi-modal optimization. Their algorithm constitutes an implementation of the
biological processes and does not account for any mathematical sophistication to enhance its
performance in particular tasks.

15
Maturate
Pr
M
Select
Clone
Pn
C
C*
(1)
(2)
(3)
(4)
(5)
Re-select
Nd(6)
(1) Generate a set (P) of candidate solutions, composed of the subset ofmemory cells (M) added to the remaining (Pr) population (P = Pr + M);
(2) Determine (Select) the n best individuals of the population (Pn), basedon an affinity measure;
(3) Reproduce (Clone) these n best individuals of the population, givingrise to a temporary population of clones (C). The clone size is anincreasing function of their affinity;
(4) Submit the population of clones to a hypermutation scheme, wherethe hypermutation is proportional to their affinity. A maturatedantibody population is generated (C*);
(5) Re-select the improved individuals from C* to compose the memoryset M. Some members of P can be replaced by other improvedmembers of C*;
(6) Replace d antibodies by novel ones (diversity introduction). The loweraffinity cells have higher probabilities of being replaced.
(a) (b)
Figure 6: The clonal selection algorithm. (a) Block diagram. (b) Step-by-step procedure.
The main features of the clonal selection theory they modeled were:
• generation of new random genetic changes, subsequently expressed as diverse antibody
patterns by a form of accelerated somatic mutation;
• phenotypic restriction and retention of one pattern to one differentiated cell (clone);
• proliferation and differentiation on contact of cells with antigens.
Their algorithm runs in six steps, according to Figure 6(a) and (b). This strategy was applied to
a simple instance of the travelling salesman problem, a binary character recognition task and a
multi-modal function optimization problem.
4.3 Combinatorial Optimization (n-TSP Problem)
The travelling salesman problem (TSP) is one of the most known and studied combinatorial
optimization problems. Simply stated, the travelling salesman must visit every city in his territory
exactly once and then return to the starting city. The question is: given the cost of travel between all
cities, which is the tour with smallest cost? For sake of simplicity, the reader must consider as cost,
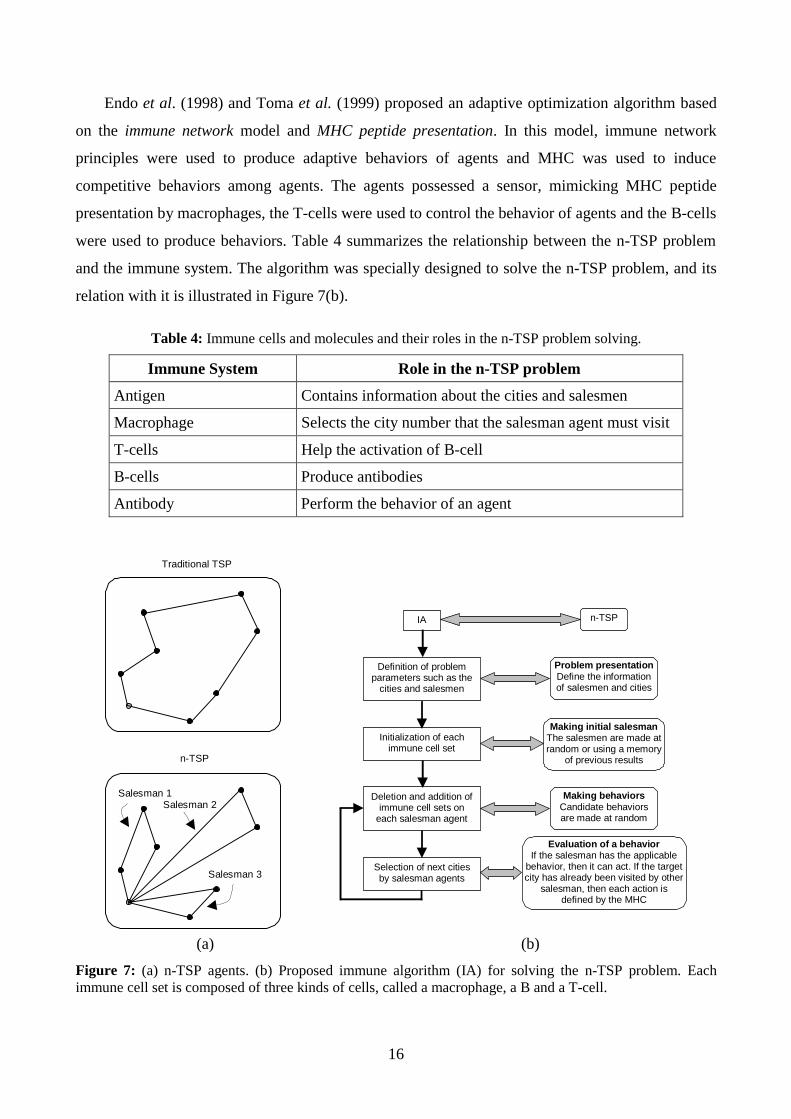
basically the length of the itinerary traveled by the salesman. The n-th agents TSP (n-TSP) is an
extension of the traditional TSP problem, where n salesmen are available for finding the minimal
tour. The salesmen might perform independent routes and start from the same base city. Figure 7(a)
depicts the relationship between the traditional TSP and the n-TSP problem.
16
Endo et al. (1998) and Toma et al. (1999) proposed an adaptive optimization algorithm based
on the immune network model and MHC peptide presentation. In this model, immune network
principles were used to produce adaptive behaviors of agents and MHC was used to induce
competitive behaviors among agents. The agents possessed a sensor, mimicking MHC peptide
presentation by macrophages, the T-cells were used to control the behavior of agents and the B-cells
were used to produce behaviors. Table 4 summarizes the relationship between the n-TSP problem
and the immune system. The algorithm was specially designed to solve the n-TSP problem, and its
relation with it is illustrated in Figure 7(b).
Table 4: Immune cells and molecules and their roles in the n-TSP problem solving.
Immune System Role in the n-TSP problem
Antigen Contains information about the cities and salesmen
Macrophage Selects the city number that the salesman agent must visit
T-cells Help the activation of B-cell
B-cells Produce antibodies
Antibody Perform the behavior of an agent
Traditional TSP
Salesman 1Salesman 2
Salesman 3
n-TSP
IA
Definition of problemparameters such as the
cities and salesmen
Initialization of eachimmune cell set
Deletion and addition ofimmune cell sets on
each salesman agent
Selection of next citiesby salesman agents
n-TSP
Problem presentationDefine the informationof salesmen and cities
Making initial salesmanThe salesmen are made atrandom or using a memory
of previous results
Making behaviorsCandidate behaviorsare made at random
Evaluation of a behaviorIf the salesman has the applicable
behavior, then it can act. If the targetcity has already been visited by other
salesman, then each action isdefined by the MHC
(a) (b)
Figure 7: (a) n-TSP agents. (b) Proposed immune algorithm (IA) for solving the n-TSP problem. Eachimmune cell set is composed of three kinds of cells, called a macrophage, a B and a T-cell.

17
The system operated as follows: first macrophages acquired a city number at random and presented
it to the T and B-cells. If a T-cell recognized this number, it tried to help B-cells. If T and B-cells
recognized the same number, the B-cell produced an antibody and traveled. Then MHC was
changed.
5. Neural Network Approaches
Artificial Neural Networks (ANN) are computational tools originally designed to model the human
brain aiming at producing an “intelligent behavior”. Several similarities and differences between the
nervous system and the immune network theory have been identified, suggesting that one field of
research might have much to gain from one another. This section will start depicting the points in
common and disagreements between the two approaches. A few neural network and hybrid models
will also be presented.
5.1 Similarities and Differences
The nervous system is commonly decomposed into sensory and motor parts. An analogous
separation into recognition and effector functions can be made in the immune system, where
effector mechanisms lead to the elimination of the antigens. In neural systems, assimilation of
memories appears to be achieved by alteration of the strengths of connections between neurons,
rather than changes within the neurons themselves. Further, the brain allows memories to be
addressable by content, so that the frequent death of individual neurons does not drastically affect
the performance of the brain as a whole. The immune system possess a cross-reactive memory that
is observed when an individual develops a memory to one antigen and is challenged with a related,
but different one (Hoffmann, 1986; Ada & Nossal, 1987; Smith et al., 1997). The cross-reactive
memory, clonal expansion and programmed cell death rates allow the immune system to
dynamically allocate resources as needed in a distributed environment (Dasgupta, 1999a).
Some important common features, as basic cognitive mechanisms, shared by the neural
networks and the immune system, are of great interest, and can be described as follows
(Jerne, 1974; Hoffmann, 1986; Hoffman et al., 1986; Vertosick & Kelly, 1989, 1991; Dasgupta,
1997, 1999a):
• both systems consist of an enormous number and diversity of cells. In humans, the immune
system consists of roughly 1012 lymphocytes (B and T cells), and the central nervous system
consists of about 1010 neurons.

18
• the individual cells are highly specialized in their functions and present great diversity of
receptors.
• the immune system recognizes and responds to complementary shapes of a great variety of
large molecules. The nervous system recognizes and responds to different kinds of patterns,
like visual, auditory and sensory stimuli.
• the synaptic strengths between neurons can be excitatory (stimulating) or inhibitory
(depressing), giving rise to many different activity patterns. The inter-lymphocyte
interactions via cell-cell contact, or via chemical mediators have varying strengths which
can be helping or suppressing.
• both systems exhibit memory, early impressions leave a particularly deep and lasting
imprint into the network. Patterns of synaptic strengths constitute a memory that is auto-
associative and non-hereditary. Some activated lymphocytes become special memory cells
that are content-addressable, and non-hereditary.
• in the nervous system, a combination of global/local learning rules occurs, while changes in
lymphocyte concentration constitute the mechanisms for learning within the immune
system.
• definite recognition can be achieved with a threshold affinity. The immune and nervous
systems share this property.
5.2 A Growing Boolean Competitive Network
De Castro & Von Zuben (2000b) developed a growing Boolean competitive network based on the
clonal selection principle and some cognitive characteristics of the immune system. The main
features of the proposed algorithm are: competitive learning, automatic generation of the network
architecture and binary representation of the connection strengths (weights).
Figure 8(a) depicts the overall steps of their algorithm. The main loop of the competitive
strategy can be summarized as follows:
1. choose an antigen (input pattern) Ag according to its probability density distribution P(Ag).
2. determine the highest affinity cell k, according to Equation (8).
3. update the weight vector wk of the most stimulated cell.
4. increment the concentration level τj for the selected cell (j = k).
5. label the cell k with highest affinity with input Aga, and attribute va = k.
kkk AbAg −= maxarg . (8)

19
Neurons (k)
Competition
Split Prune
Weightupdate
Winner Inactive neuron
Input patterns
1 0 0 0 1 0 1 1
0 0 1 1 1 1 1 0
0 1 1 1 0 1 1 0
Ag
Abk (Affinity: 5)
Ag
Abk (Affinity: 7)
1 0 0 0 1 0 1 1
Updating (α = 2)
(a) (b)
Figure 8: ABNET. (a) Main steps of the learning algorithm. (b) Weights updating procedure.
The weights updating is a guided search, such that the weights become a more perfect complement
of the antigens, and is similar to a multi-point mutation usually employed in evolutionary search
algorithms (see Figure 8(b)). α is called the hypermutation rate and is directly related to the
capability of performing the affinity maturation of a given antibody.
This network was successfully applied to several problems, such as binary character
recognition, major logic decision and pattern classification.
5.3 Associative Memory
An associative memory can be seen as an irregular hypersurface in a space containing valleys,
corresponding to memorized patterns. The local minima of the function that describe this surface
are called attractors, which represent the stored patterns.
Abbattista et al. (1996) presented an associative memory model for storing and retrieving noisy
patterns based on the immune network theory. They tried to increase the memory capacity and
retrieval performance, of a variation of the discrete Hopfield network (Hopfield, 1984) by exploring
the recruitment mechanism of the immune network. This mechanism was used to define a
population of points on an L-dimensional space representing a hypersurface. The best points of this
population were taken as the attractors. Like in the discrete Hopfield network case, this algorithm is
composed of a learning (storing) phase and a recall phase.
Their algorithm was applied to a bipolar dataset in which the affinities were measured via the
Hamming distance between individuals. Some results were presented with relation to the storage
capacity of their model, and its performance compared to the Hopfield network for a single
example, demonstrating a superior error-correction capability of their model.

20
5.4 An Unorthodox Neural Network
Hoffmann (1986) and Hoffmann et al. (1986) used the analogy between the immune system network
theory and the central nervous system network to formulate an unorthodox neural network model.
The immune system was viewed, in their network theory, as an N-dimensional system
containing a very large number of singular points representing attractors. Learning in this system
corresponded to transitions to stable steady states with higher “survival” values. The strength of
interaction between any two clones remained fixed. This was in contrast to the traditional view of
learning in the central nervous system, according to which the process involves changes in the
strengths of synaptic connections between neurons. This led to the denomination “unorthodox
neural network”. Figure 9 illustrates the basic features of their network learning algorithm. Table 5
summarizes the relationship between their neural network model and the biological immune system
properties.
No
Yes No
Yes Yes
Generate:Wij
Stimulus vectorsResponse vectors
Set stimulus strengthto a base value
Generate a randomsequence for the
application of the stimuli
Increase stimulusstrength S
Select next stimulusSleep, applystimulus
Correctresponse
Is S > δ
Is sequencecomplete
Apply same stimulus
No
Figure 9: Basic features of the network supervised learning algorithm without changing the synapticconnection strengths (W ij). When a set of stimuli has been learnt, the system remains in the cycle shown indouble line arrows. δ is a predefined threshold.
21
Table 5: Relationship between the biological immune system and the proposed neural network model.
Immune System Neural Network Model
Clone Neuron
Size of a clone Rate of firing a neuron
Number of clones Number of neurons
Stimulation/suppression of a clone Stimulation/suppression of a neuron
Stable steady states (long-term immunity) Singular points (attractors)
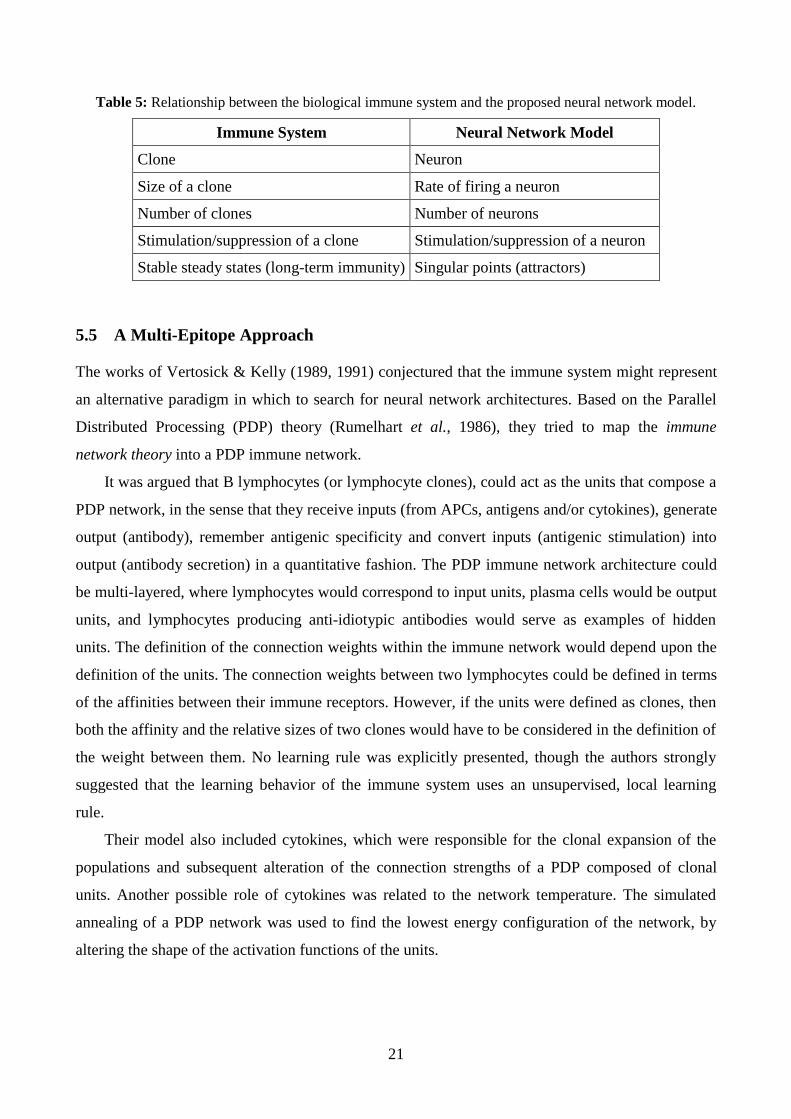
5.5 A Multi-Epitope Approach
The works of Vertosick & Kelly (1989, 1991) conjectured that the immune system might represent
an alternative paradigm in which to search for neural network architectures. Based on the Parallel
Distributed Processing (PDP) theory (Rumelhart et al., 1986), they tried to map the immune
network theory into a PDP immune network.
It was argued that B lymphocytes (or lymphocyte clones), could act as the units that compose a
PDP network, in the sense that they receive inputs (from APCs, antigens and/or cytokines), generate
output (antibody), remember antigenic specificity and convert inputs (antigenic stimulation) into
output (antibody secretion) in a quantitative fashion. The PDP immune network architecture could
be multi-layered, where lymphocytes would correspond to input units, plasma cells would be output
units, and lymphocytes producing anti-idiotypic antibodies would serve as examples of hidden
units. The definition of the connection weights within the immune network would depend upon the
definition of the units. The connection weights between two lymphocytes could be defined in terms
of the affinities between their immune receptors. However, if the units were defined as clones, then
both the affinity and the relative sizes of two clones would have to be considered in the definition of
the weight between them. No learning rule was explicitly presented, though the authors strongly
suggested that the learning behavior of the immune system uses an unsupervised, local learning
rule.
Their model also included cytokines, which were responsible for the clonal expansion of the
populations and subsequent alteration of the connection strengths of a PDP composed of clonal
units. Another possible role of cytokines was related to the network temperature. The simulated
annealing of a PDP network was used to find the lowest energy configuration of the network, by
altering the shape of the activation functions of the units.

22
6. Anomaly Detection
The normal behavior of a system is often characterized by a series of observations over time. The
problem of detecting novelties, or anomalies, can be viewed as finding deviations of a characteristic
property in the system.
6.1 Computer Security
The problem of protecting computers from viruses, unauthorized users, etc., constitutes a rich field
of research for anomaly (or change) detection systems. Forrest et al. (1994) compared the problem
of protecting computer systems to that of learning to distinguish between self and non-self. They
described a change-detection strategy based upon the thymic negative selection intrinsic to our
immune system.
Their algorithm runs in two phases. In the first phase, a set of detectors is generated according
to Figure 10(a) and, in the second phase, the protected data is monitored by comparing them with
the generated detectors (see Figure 10(b)). If the number of contiguous bits in common between two
strings is greater than or equal to r, then the strings are said to match each other. The authors also
presented equations estimating the probability that a match occurred at at least r-contiguous
positions between two random strings and the change-detection probability for different
configurations of the system.
The main observations about this algorithm were:
1. its tunable with relation to the probability of detection;
2. the size of the detector does not necessarily grow with the number of strings being
protected;
3. the probability of detection increases exponentially with the number of independent
detection algorithms;
4. detection is symmetric; and
5. there is an exponential cost of generating detectors with relation to the size of the self set.
In order to overcome the main drawback of the above-mentioned strategy (item 5), D’haeseleer et
al. (1996) proposed two novel detector-generating algorithms which run in linear time with respect
to the size of the input. They also discussed how to set parameters for the algorithms, like repertoire
sizes, probabilities of match and failure in detection, practical issues and rules of thumb for r-
contiguous bit matching rules. The algorithms run in two phases and are based on dynamic
programming. In the first algorithm a counting recurrence problem for the number of unmatched
strings in S was solved.

23
Self Strings(S)
GenerateRandom
Strings (R0)Match Detector Set
(R0)
Reject
No
Yes
No
Yes
Detector Set(R)
ProtectedStrings (S)
Match
NonselfDetected
(a) (b)
Figure 10: Anomaly detection algorithm. (a) Generation of valid detector set (censoring). (b) Monitoring ofprotected data.
The second phase was responsible for the generation of strings unmatched by S. The second
algorithm possessed the same second phase as the first one, with the difference that it tried to select
the detectors placing them as far apart as possible, aiming at achieving a better coverage of the
string space with the same number of detectors.
6.2 DNA-Based Negative Selection
DNA computation is based upon hydrogen bonding based matchings, called hybridizations,
between Watson-Crick complementary pairs, A-T (Adenine-Thymine) or C-G (Cytosine-Guanine).
A single strand (an oligonucleotide) will bind other oligonucleotides that match most closely its
sequence under the operation of Watson-Crick complementation.
Deaton et al. (1997) reduced the change detection algorithm of Forrest et al. (1994) (briefly
discussed in the previous section), to the problem of detecting changes in strings. In their DNA
implementation, template matching hybridization reactions between DNA oligos were used to
detect change.
The censoring and monitoring algorithms presented in Figure 10 were studied with techniques
from molecular biology. Figure 11 depicts the DNA based negative selection algorithm. For details
concerning DNA computation, refer to Adleman (1994).

24
Self strands
GenerateRandomStrands
Hybridization
Detectorstrands
DS exonuclease
Detectorarray
Protectedstrands Hybridization
Non-selfdetected
Yes by fluorescence
No
(a) (b)
Figure 11: DNA implementation. (a) Censoring. (b) Monitoring.
6.3 Virus Detection and Elimination
In the system developed by Kephart (1994), a set of antibodies to previously not encountered
computer viruses or worms (agents) was generated so as to promote a faster and stronger response
to future infecting agents. He was also concerned about minimizing the risk of an autoimmune
response, in which the computer immune system would mistakenly identify legitimate software as
being undesirable.
A particular virus was recognized via an exact or fuzzy match to a relatively short sequence of
bytes occurring in the virus (called a “signature”). The process by which the proposed computer
immune system established whether new software contained a virus had several stages. Integrity
monitors, which used checksums to check for any changes to programs and data files, had a notion
of self that was: any differences between the original and current versions of any file were flagged,
as were any new program. However, evidence of a non-self entity was not by itself enough to
trigger a computer immune response. Mechanisms that employed the complementary strategy of
“knowing the enemies” were also brought into play.
The capture of a virus sample by decoy programs (kept at different strategic areas in memory)
was somewhat analogous to the ingestion of antigen by antigen presenting cells. In the computer
immune system, the infected decoys were then processed by another component of the immune
system, called a signature extractor, so as to develop a recognizer for the virus.

25
Detect Anomaly
Scan for known viruses
Capture samples using decoys
Extract Signature(s)
Add signature(s) to databases
Add removal infoto database
Segregatecode/data
AlgorithmicVirus Analysis
Send signals toneighbor machines
Remove Virus
Figure 12: Main components of the computer immune system and their relationship.
The computer immune system had an additional task that was not shared by its biological analog: it
had to attempt to extract from the decoys information about how the virus attached to its host, so
that infected hosts could be repaired (if possible). Hence, the system automatically developed both a
recognizer and a repair algorithm appropriate to the virus.
Viral self-replication was dealt with self-replication, in the sense that, detection of a virus by a
single computer could trigger a wave of kill signals that propagated along the path taken by the
virus, destroying the virus in its wake. Figure 12 depicts the main components and their respective
function within the immune system discussed in the present section.
Other sources of reference from the same author concerning computer virus detection and
elimination can be found in Kephart et al. (1997, 1999).
6.4 Image Inspection System
Aisu & Muzutani (1996) proposed an immunological learning system aiming at integrating the
distributed search of new agents and constraint relaxation among them. Their work was based on
those of Farmer et al. (1986), Forrest et al. (1994) and D’haeseleer et al. (1996). They applied
immune network dynamics, based upon a dynamic equation, to study the interactions among
antibodies and between antibodies and antigens. The dynamic equation took into account the
stimulation and suppression among antibodies, their stimulation by antigens and a natural death rate
(see Equation (9)).

26
1 0 0 1 1 1 0 1 0 1 4
Covered nonself patterns
Affinity thresholdSelf
A B
C
Pattern space
Self
A B
D
Pattern space
(a) (b)
Figure 13: (a) Genetic encoding for the detectors. (b) Suppression of detector C that (partially) covers thesame portion of the pattern space. A new detector D is created.
Their system consisted of distributed antibodies, named detectors, which reacted to non-self
patterns. Each detector was an independent agent doing checks in parallel, with the limited role of
detecting their assigned non-self patterns. They used a Hamming shape-space to study cell-cell
interactions, but their detectors (antibodies) contained the affinity threshold embodied in the last
position (allele) of the string. The combination of a diversity generation mechanism and suppression
resulted in redundancy avoidance among the coverage of each detector. Figure 13(a) depicts their
encoding scheme and Figure 13(b) represents how the suppression term of Equation (9) can assist in
the problem of eliminating detectors that cover the same portion of the pattern (antigen) space.
The algorithm works as follows:
• generate an initial set of detectors;
• generate a new detector randomly or by using mutation and add it to the detectors set;
• evaluate the detectors, eliminating those self-recognizing ones;
• renew the concentration of detectors using the dynamic equation given by (9);
• delete detectors with concentration level bellow a given threshold.
i
N
jjiij
N
jjiji
N
jjiiji xKyxmxxmKxxmcx 2
1
',
1,
11, −
+−= ∑∑∑
===
� . (9)
The first term represents the stimulation of antibody i by other antibodies, the second term
represents the suppression of antibody i when it is recognized by other antibodies. The third term
corresponds to the antigenic stimulation of Ab i, and the fourth term is the natural death rate.
6.5 Image Segmentation
The pattern recognition task performed by the immune system has much in common with the aerial
image segmentation problem. This was studied by McCoy & Devarajan (1997), who used a

27
negative selection algorithm to construct a set of detectors that weeds out everything but the desired
class.
Their algorithm assumed a discrete feature space represented by an L-digit bit string generated
from images extracted from single band infrared-sensors of road pixels. A string m = <0...010...0>
contains a digit 1 (in position k) indicating the region of feature space for the target pattern. The
detectors were produced according to the rule: generate random binary strings, if position k is 0, add
the string to the population. If the logical OR of the population constitutes the exact complement of
m, stop. This procedure generates the non-self detectors set, and if none of the population has any
bit in common with the test string, then it belongs to the target class.
The authors compared the results achieved by their artificial immune system and those obtained
by genetic programming, concluding that both methods are suitable for parallel implementation but
the new one is expected to adapt more readily to changes in its sample data, being dynamically
adjustable. They also argued that finding a population of detectors that covers non-self features is
easier than finding a single optimal detector, since there are many ways to arrive at an acceptable
solution.
6.6 Novelty Detection in Time Series Data
Dasgupta & Forrest (1996) proposed a novelty detection algorithm for time series data, based on the
previously discussed negative-selection algorithm introduced by Forrest et al. (1994) and
D’haeseleer et al. (1996).
Their algorithm can be summarized as follows:
• collect sufficient time series data to exhibit the normal behavior of a system;
• determine the range of variation of data and perform a binary encoding according to the
desired precision;
• select a suitable window (concatenation of a fixed number of data points) size which
captures the regularities of interest;
• slide the window along the time series, in non-overlapping steps, and store the encoded
string for each window as self, from which detectors will be generated;
• generate a set of detectors that do not match any of the self strings;
• once a unique set of detectors is generated from the normal database of patterns, it can
probabilistically detect any change (or abnormality) in patterns of unseen data;
• while monitoring the system, use the same encoding scheme for the new data patterns. If a
detector is activated, a change in behavior has occurred and an alarm might signal.

28
The authors reported results for two data sets: a simulated cutting dynamics of a milling
operation and a synthetic signal. They observed that the number of r-contiguous bits chosen by the
matching function was responsible for tuning the reliability of detection against the risk of false
positives. In a later work (Dasgupta & Forrest, 1999), the authors presented a more detailed
discussion about the same artificial immune system.
7. Agent-Based Approaches
An agent is anything that can be viewed as perceiving its environment through sensors and acting
upon that environment through effectors. The immune system is composed of an enormous set of
cells, molecules and organs, which can be viewed as immune agents distributed all over our bodies.
7.1 Network Security
Forrest et al. (1997) and Hofmeyr & Forrest (1999, 2000) have been pursuing the problem of
developing an artificial immune system that is distributed, robust, dynamic, diverse and adaptive,
with applications to computer network security.
In their system, the several immune system cells and molecules were simplified by the
definition of a basic type of detector that combined useful properties from these elements. The
detector cell had several different possible states, roughly corresponding to thymocytes, naive B-
lymphocytes and memory B-lymphocytes. The detectors were represented by bit strings of a given
length, and a small amount of state, as depicted in Figure 14(a). Detection was performed by a
string match process that took into account the number of r-contiguous bits between two strings.
The definition of self (tolerization period) was performed by the negative selection algorithm
described in Forrest et al. (1994). The maturation of naive detectors into memory detectors, together
with the negative selection, were responsible for the learning part of the system (see Figure 14(b)).
The authors used permutation masks to achieve diversity of detectors.
The authors reported results of a computer network intrusion-detection application, but
suggested that this artificial immune system can be successfully applied to other classes of
networks, including social nets, organizations, networks of markets and neurological or ecological
networks.
Based on these works and those described in Section 7.1, Kim & Bentley (1999a,b) are
working on the development of a network intrusion detection system inspired in the immune
system.

29
Datapath triple(20.20.15.7, 31.14.22.87, ftp)
Broadcast LAN
ip: 31.14.22.87port: 2000
Internal host
External host
ip: 20.20.15.7 port: 22
Host
Activationthreshold
Cytokinelevel
Permutationmask
Detectorset
immature memory activated # matches
0100111010101000110......101010010
Detector
(a)
Randomly created
Immature
Mature & Naive
Death
Activated
Memory
No match duringtolerization
010011100010.....001101
Exceed activationthreshold
Don’t exceedactivation threshold
No costimulation Costimulation
Match
Match duringtolerization
(b)
Figure 14: (a) Architecture of the AIS for computer network security. (b) Life cycle of a detector.
In Kim & Bentley (1999a), the authors reviewed and assessed the analogy between the human
immune system and network intrusion detection systems. They aimed at unraveling the significant
features of the IS that would be successfully applied to the task of detecting intrusions in computer
networks. Upon their analysis, they identified three fundamental requirements for the derivation of
the design goals for network-based intrusion detection, named distribution, self-organization and
being lightweight. Table 6 describes the immune system components and functions that satisfy the
three requirements listed.

30
Table 6: Components of the immune system that satisfy the requirements forthe development of an efficient intrusion detection system (IDS).
Characteristic of an IDS Immune System
Immune networkDistribution
Unique antibody sets
Gene library evolution
Negative selectionSelf-Organization
Clonal selection
Approximate binding
Memory cellsLightweight
Gene expression
Table 7: Relationship between the network intrusion detection system and the immune system.
Network Environment Immune System
Primary IDS Bone marrow and thymus
Local hosts Secondary lymph nodes
Detectors Antibodies
Network intrusions Antigens
Normal activities Self
Abnormal activities Non-Self
In a further work (Kim & Bentley, 1999b), the authors proposed a Negative Selection Algorithm
(NSA) with niching for network intrusion detection. They also suggested that an overall artificial
immune model for network intrusion detection would be comprised by three distinct evolutionary
stages: 1) negative selection, 2) clonal selection and 3) gene library evolution. Table 7 shows how
they related the immune system with their network environment, and Figure 15 presents the
physical architecture of their system (IDS corresponds to Intrusion Detection System).
The negative selection algorithm with niching simply replaces the random generation of
detectors by the evolution of detectors towards non-self. In phase 1), the modified NSA was used to
build self profiles, which were encoded in an appropriate data representation. In phase 2), the NSA
with niching started generating detectors. After that, new self profiles were built by parsing newly
captured network packets. In the third phase, the detector patterns in each detector set were
compared to the patterns in each corresponding new self profiles. If the similarity between any
detector pattern and new self pattern is above a pre-defined threshold, an alarm signal is given.

31
Router
Primary IDS
Secondary IDS
Detectors
Communicator
Communication flow
Network packets
Figure 15: Physical architecture of an artificial immune system for network intrusion detection.
In a recent work, Dasgupta (1999b) proposed an agent-based system for intrusion/anomaly
detection and response in networked computers. In his approach, the immunity-based agents
roamed around the nodes and routers monitoring the situation of the network. The most appealing
properties of this system were: mobility, adaptability and collaboration. The immune agents were
able to interact freely and dynamically with the environment and each other.
Figure 16 depicts the types of agents employed and their hierarchical coordination. The
decision/action agents could assume the forms of helper, killer or suppressor agents, like in the case
of T-cells. The communicating agents corresponded to lymphokines, secreted by T-cells to regulate
the immune response. Some of the monitoring agents worked in the complement space for
monitoring changes (non-self), while others had the knowledge of known intrusions.
Monitoringagents
Monitoringagents
Network Environment
Communicating agents Communicating agents
ActionAgents
ActionAgents
ResponsesResponses
Figure 16: Conceptual view of the proposed multi-agent intrusion detection system.

32
7.2 Computer Virus Detection and Elimination
Okamoto & Ishida (1999a,b) proposed a distributed approach to computer virus detection and
neutralization by autonomous and heterogeneous agents. This system detected viruses by matching
a self information (like the first few bytes of the head of a file, the file size and path, etc.) against
the current host files. Viruses were neutralized by overwriting the self information on the infected
files and the recovering was attained by copying the same file from other uninfected hosts through
computer network. Figure 17 depicts the whole anti-virus system and the virus neutralization
mechanism.
Their system was composed of the following types of agents:
• detection/neutralization agents, named antibody agents;
• killer agents (mimicking killer T-cells) responsible for removing the altered files that were
neutralized by antibody agents;
• copy agents that sent and received requests for copying uninfected files over the computer
network; and
• control agents (mimicking helper T-cells) responsible for controlling the process of the anti-
virus system.
Recovery system
Detection/neutralization system
Antibodyagent
Controlagent
Memory
CPU
Host A
Recovery system
ExternalMemory
Killeragent
Copyagent
Detection/neutralization system
Antibodyagent
Controlagent
Memory
CPU
Host B
ExternalMemory
Killeragent
Copyagent
Top of original code
Original code
Top of originalcode
Antibody agent
Virus code
Original code
Overwrite
(a) (b)
Figure 17: (a) Diagram of the anti-virus system. (b) Virus neutralization by antibody agent.

33
According to the authors, the main drawbacks of their approach were the critical determination of
the size of the head part to be used by the antibody agent (a too long head could be very memory
consuming, while a too small one could be ineffective), and the recovery through the network, that
could cause deadlock or secondary infection.
7.3 Intelligent Buildings
The principle of building an automation system is to regard each device of this system as an
information processing unit, and to execute control actions by transmitting messages among them.
A set of microprocessors is used to transform the devices into information processing units. The
term intelligent buildings, or smart buildings, is being used to describe automated buildings, where
technology is used to realize rather complex functions, like water, gas and energy management,
security, remote control, transportation and communication (within the building and with the
outside world).
Dilger (1996) proposed an agent-based security system for intelligent home technology aiming
at improving the technical facilities of a home. The security system was modeled similarly to the
natural immune system in two ways: it was self-organized and capable of producing a flexible
reaction according to the degree of danger. The sensors and actuators of the house were regarded as
stationary agents simply defined based on states and rules. An interesting point of this security
system was the fact that not only the presence of a burglar was detected by the sensors, but also
outside events, like thunderstorms, etc.
The agents were defined according to the following syntactical scheme:
• device <name of the device type, e.g. motion detector, alarm, etc.>
• type <class of device>
• parameters <list of parameters that could be manipulated by the device>
• constants <list of constants>
• variables <list of local variables>
• state1,…,staten
A state had the following form:
• status <value of the state>
• list of rules
In a later work, Dilger (1997) proposed the use of an evolutionary process to optimize the behavior
of the system, i.e. to tune its relevant parameters. In addition, he pointed out several aspects of
immune-based systems that were contained in the intelligent home, like self-definition and

34
maintenance. He regarded the situations (presence of burglars, weather, etc) as antigens, and the
specifications of situations in the rules as antibodies, activated by certain antigens (situations). The
Jerne immune network idea was brought up by the interconnection scheme of the agents composing
the security system.
7.4 Adaptive Noise Neutralization
Based upon the immune properties of diversity, self-tolerance and memory of non-self, Ishida
(1996c) developed an agent-based immune algorithm with possible applications to noise
neutralization, group task achievement, model adjustment and decision making.
The author detached as one of the most striking characteristics of his algorithm its super
adaptability, not only to a changing environment but also to a changing self (own system). The
algorithm worked in three steps:
• generation of diversity;
• establishment of self-tolerance;
• memory of non-self.
Figure 18(a) presents a general outline of the algorithm. Figure 18(b) depicts a schematic
diagram of the immune algorithm for an agent-based architecture. The author suggested an
encoding scheme as those used by the traditional applications of a genetic algorithm.
3. Memory of non-self(driving parameter changes)
2. Establishment of self-tolerance(driving structural changes)
SYSTEM(self)
ENVIRONMENT(non-self)
1. Diversity generation(driving continuous changes)
Reference
Reference
SENSITIZATIONMemory of non-self
Diversity generator
SELF
Ref
eren
ce
FILTERINGEstablishment of self-tolerance
NON-SELF
Reproduction andaffinity maturation
(a) (b)
Figure 18: (a) Schematic diagram of the immune algorithm. (b) Immune algorithm for an agent-basedarchitecture.

35
8. Learning
Learning is usually addressed to the processes of acquiring knowledge from experience and
abstracting this knowledge to solve new, previously unseen problems. The process of immunizing
(through vaccination, for example) is a clear example of an immune learning mechanism. Similar
strategies can be used to solve problems like pattern recognition, concept learning, etc.
8.1 Pattern Recognition
Hunt & Cooke (1996) proposed a formal architecture for an artificial immune system (AIS) that
was evaluated in pattern recognition problems. The key features of the immune system they
explored were the genetic mechanisms used to construct antibodies, the clonal selection and affinity
maturation of the immune response, the immune content addressable memory, the matching
mechanisms of the immune system and its network self-organizing properties.
They used an object-oriented approach such that their algorithm was composed of a set of
intercommunicating objects, like a bone marrow object, a network of B-cell objects and an antigen
population. There was a main algorithm as illustrated in Figure 19(a). The most complex concept in
their AIS was the B-cell object (see Figure 19(b)). The antibodies possessed a paratope representing
the antigenic pattern they match and the antigens had a single epitope. The stimulation level of a B-
cell object, given by Equation (10), took into account the strength of the match between an antibody
and its neighbors (first term), its enmity for its neighbors (second term), the Ag-Ab affinity (third
term), and the natural death rate (fourth term). ki (i = 1,...,3) are constant values corresponding to
possible inequalities between stimulation and suppression. A somatic hypermutation was used to
increase the affinity between the B-cell objects and the antigens. The stimulation level and somatic
hypermutation were determined based on a variation of the model proposed by Farmer et al. (1986).
31 1
211
),(),(),( kyamkxpamkxeamcnstimulatioN
j
n
jj
N
jj −
+−= ∑ ∑∑
= ==(10)
As conclusions, the authors suggested that the proposed AIS has great potential for being
applied to areas like classification, prediction, diagnosis and data mining.
The limitations and problems identified in this version of the ISYS system, led to the design of
the JISYS system (Hunt et al., 1999), which is a Java-based implementation of the ISYS system.
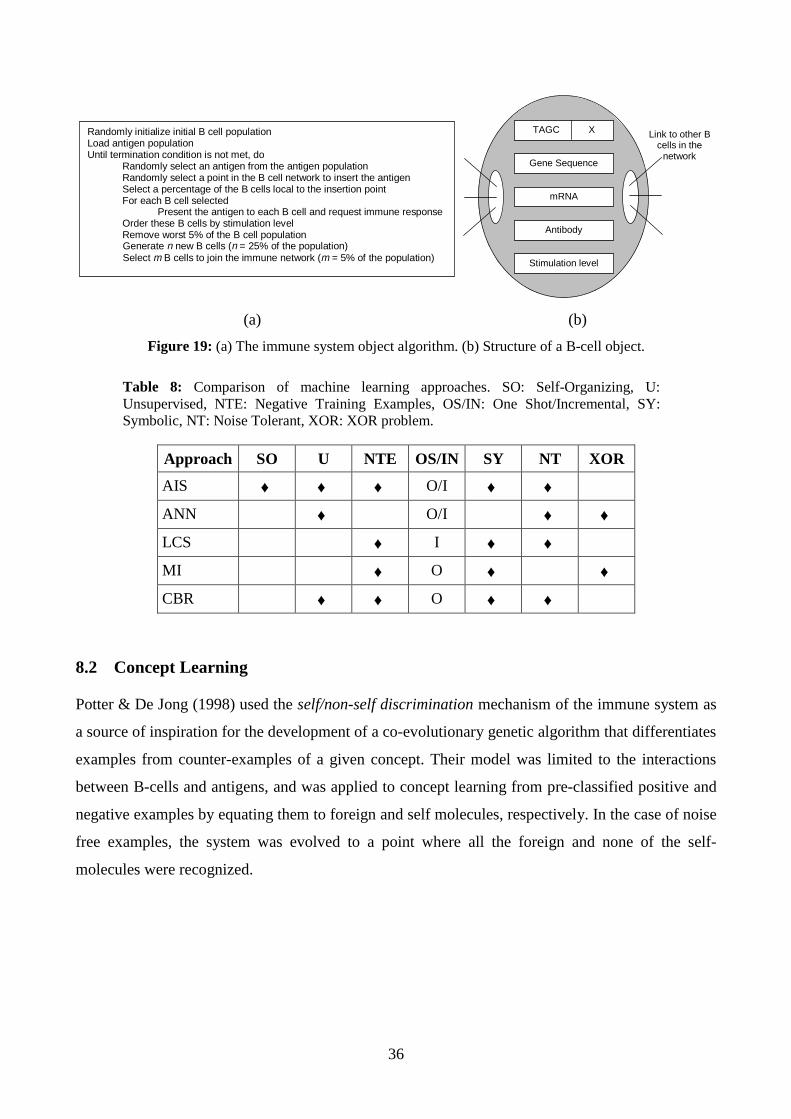
36
Randomly initialize initial B cell populationLoad antigen populationUntil termination condition is not met, do
Randomly select an antigen from the antigen populationRandomly select a point in the B cell network to insert the antigenSelect a percentage of the B cells local to the insertion pointFor each B cell selected
Present the antigen to each B cell and request immune responseOrder these B cells by stimulation levelRemove worst 5% of the B cell populationGenerate n new B cells (n = 25% of the population)Select m B cells to join the immune network (m = 5% of the population)
Link to other Bcells in the
network
TAGC X
Gene Sequence
mRNA
Antibody
Stimulation level
(a) (b)
Figure 19: (a) The immune system object algorithm. (b) Structure of a B-cell object.
Table 8: Comparison of machine learning approaches. SO: Self-Organizing, U:Unsupervised, NTE: Negative Training Examples, OS/IN: One Shot/Incremental, SY:Symbolic, NT: Noise Tolerant, XOR: XOR problem.
Approach SO U NTE OS/IN SY NT XOR
AIS ♦ ♦ ♦ O/I ♦ ♦
ANN ♦ O/I ♦ ♦
LCS ♦ I ♦ ♦
MI ♦ O ♦ ♦
CBR ♦ ♦ O ♦ ♦
8.2 Concept Learning
Potter & De Jong (1998) used the self/non-self discrimination mechanism of the immune system as
a source of inspiration for the development of a co-evolutionary genetic algorithm that differentiates
examples from counter-examples of a given concept. Their model was limited to the interactions
between B-cells and antigens, and was applied to concept learning from pre-classified positive and
negative examples by equating them to foreign and self molecules, respectively. In the case of noise
free examples, the system was evolved to a point where all the foreign and none of the self-
molecules were recognized.

37
01001000 1001110101110001011001100 1100000011111010100110101
Genome
threshold pattern mask
0100100##1001#####10##0.28
Activation threshold Antibody
Figure 20: B-cell genotype to phenotypic mapping.
In this model, a B-cell consisted of an antibody type and a real-valued activation threshold that
represented the binding strength required to initiate an immune response. The representation
employed was based on the work of Forrest et al. (1993), where a binary schema represented an
antibody and simple binary strings represented antigens. The matching function returned the
percentage of matching bits between Ag-Ab, which was used to compute the binding strength.
Figure 20 illustrates the genotype to phenotype mapping of B-cells. The antibody schema was
produced from binary patterns and mask genes. A mask bit of ‘0’ produced a “don’t-care” schema
value. The real-valued activation threshold was generated from an 8-bit threshold gene. A co-
evolutionary genetic algorithm was used to evolve the B-cells such that individuals from multiple
non-interbreeding species collaborated to solve a target problem. Each species (collection of B-cells
having similar antibodies) represented only a partial solution. The fitness of a B-cell was
determined by adding it to a “serum” composed of the current best B-cells. Foreign and self-
molecules were then presented to the serum. If the Ag-Ab binding strength exceeded its activation
threshold, then the antibody successfully recognized the antigen. The fitness of the B-cell was
defined as the number of foreign molecules recognized by all the antibodies in the serum, minus the
number of self-molecules flagged as foreign. The final solution consisted of the best B-cell from
each species.
The results of this approach were compared to a sophisticated symbolic inductive learning
system, called AQ, applied to a congressional voting record data set. The authors suggested that
their strategy was capable of producing a more concise description of the concepts than the AQ
method, with similar predictive accuracy, and argued that it happens due to the more flexible
strategy employed by the co-evolutionary immune model.

38
8.3 The Baldwin Effect
The Baldwin effect proposes that learning or acquiring useful characteristics during a lifetime
would cause succeeding generations to have higher probabilities of acquiring this same
characteristics, even though the characteristics themselves are not genetically propagated.
Hightower et al. (1996) used a binary model of the immune system, together with the clonal
selection principle and affinity maturation of the immune response to study the influence of
learning in the evolution of the genetic representation of antibodies. Antibodies and antigens were
simply represented as binary strings of same length and the match score given by the XOR
operation (Hamming distance) taken between the two strings, i.e. the number of complementary
bits. The binding value was a non-linear (sigmoidal) function of the match score (see Figure 21 for
an illustration).
By varying the learning rate (somatic mutation rate), they showed the presence of the Baldwin
effect, in the sense that learning accelerates evolution by allowing it to discover which individuals
are nearest to the threshold of success. The authors suggested that the Baldwin effect disappeared
when the non-linear binding function was replaced by a linear one.
0 1 2 3 4 5 6 7
0.2
0.4
0.6
0.8
1.0
Match score
Bin
din
g V
alu
e
0.0
(L − ε)
Figure 21: Non-linear relation between binding value and match score for a bit string of length L = 7 andaffinity threshold ε = 2.
8.4 Generation of Emergent Properties
In order to study the generation of complexity shown in higher living organisms, Nagano &
Yonezawa (1999) proposed a generative physical model constructed on complex systems based on
a primitive immuno-defense system. The authors suggested that the origin of self-organization and
ordered complexity are equivalent to the establishment of a “self system”, and hence can be

39
achieved by the generation of a self-recognition (self/non-self discrimination) mechanism and a
punctuated equilibrium hypotheses.
The individuals of a non-self set were composed of DNA sequences and matched against an
initial self-set of DNA sequences. Then, they were subjected to a genetic algorithm in order to
observe the generation of complexity and the correlation among the DNA sequences and the
self/non-self discrimination problem.
According to the authors, the most relevant results taken from their experiments were:
• the self/non-self recognition mechanism generated complexity and adaptability;
• due to the recognition mechanism, the self system was maintained regardless environmental
fluctuations;
• each self system and population had properties of punctuated complexity and correlation;
and
• each self system showed an adaptive behavior.
9. Inductive Problem Solving
Inductive learning, or inductive problem solving, is essentially a search problem. Slavov &
Nikolaev (1998) and Nikolaev et al. (1999) introduced enhanced evolutionary strategies based on
this new approach.
9.1 Finite-State Automaton
Slavov & Nikolaev (1998) proposed an evolutionary search algorithm based on a discrete version of
a model of the immune network dynamics. The algorithm alternates continuously in cycles of three
search phases, from oscillatory through asymptotic to chaotic, and the system self-regulates.
The authors applied their immune algorithm to solve an instance of the intractable finite-state
automata induction problem (see Figure 22 for an illustration of a finite-state automaton subject of
learning). Individual automata were associated with lymphocyte clones, the examples were assumed
to be the antigens, and the fitness of the automaton was given by its concentration. The proliferation
of an automaton (clone) was function of two factors: the degree of recognized examples (antigens),
and the interactions among the automata (clones). Table 9 presents the trade-off between their
immune algorithm and the biological immune system.
The fitness function, responsible for controlling the immune algorithm, took into account the
fitness of the automaton at each generation, the antigen score, the automaton turnover, the network
excitation and a proliferation function.

40
q0
q1
q5
q2
q3
q4
1
1 1
0 0
0 0
1 1
1
0
0
Figure 22: Deterministic finite-state automaton subject of learning.
Table 9: Mapping between the automata approach and the biological immune system.
Automata Identification Immune System
Finite-state automata Lymphocyte clone
Fitness of the automata Concentration of a clone
Recognizing capacity of the automaton Binding capability of the clone
Complementarity in the automata’s behavior Interaction between lymphocytes
Example Antigen
Power of an example Antigen concentration
All automata in the population Immune network
The authors suggested that their algorithm supports more variety in the population than the standard
genetic algorithm, due to a greater number of Ag-Ab complexes in the repertoire, i.e. more
individuals with different qualities.
9.2 Genetic Programming
Nikolaev et al. (1999), introduced an immune version of Genetic Programming (GP). In this
immune GP version (iGP), the progressive search was controlled by a dynamic fitness function,
based on an analogy with a model of the immune network dynamics. The programs were reinforced
with rewards for matched important examples and stimulated to match different examples. The
fitness function consisted of two dynamic models that exerted influence on each other: a model for
propagating programs that recognized more important examples, and a model for changing the
importance of examples with relation to the number of programs that recognize it. The analogy
between the genetic programming and the biological immune system is presented in Table 10.
The authors applied their method to a machine-learning task and a time series prediction
problem. The machine-learning considered the computational induction as a problem of finding a
function f from a given set of examples {(x1,y1),…, (xN,yN)}, and the time series prediction was
regarded as the inductive problem of identifying regularities among a given series of points:

41
Table 10: Analogy between the genetic programming and the biological immune system.
Genetic Programming Immune System
Program Lymphocyte clone
Fitness of the program Concentration of a clone
Fitness proportional selection Clonal selection process
Complementarity in the recognition potential of two programs Interaction between two antigens
Example Antigen
Importance of an example Antigen concentration
All programs in the population Immune network
…,xt, xt+1,… sampled at discrete time intervals. The performance of the proposed algorithm was
compared with a traditional GP system that uses multivariate trees representation models. The only
difference between the two methods is that the iGP uses a dynamic fitness measure inspired in a
model of the immune network dynamics.
The results presented demonstrated that the immune version attained fitter programs
maintaining higher population variety (diversity) on the machine-learning and time series prediction
problems tested.
10. Pattern Recognition
Pattern recognition is the research area that studies the operation and design of systems that
recognize patterns in data. It encloses sub-disciplines like discriminant analysis, feature extraction,
error estimation, cluster analysis, grammatical inference and parsing (sometimes called syntactical
pattern recognition). Important application areas are image analysis, character recognition, speech
analysis, man and machine diagnosis, person identification and industrial inspection.
10.1 A General Approach
A binary immune system model was used by Forrest & Perelson (1992) and Forrest et al. (1993) in
order to study the pattern recognition and learning that takes place at the individual and species
level in the immune system. A genetic algorithm was used to study the maintenance of diversity and
generalization capability of this bit string model of the immune system, where generalization means
the detection of common schemas that are shared among many antigens.
The authors used a simple binary encoding for the molecules (Ag and Ab) and the match
function performed the sum of complementary bits between the strings. One interesting aspect of

42
this work was the use of a don’t care (*) character in the definition of the antigen molecules, i.e., the
strings were constructed over the alphabet {0,1,*}. This way, it was possible to study the GA’s
ability to detect common patterns (schemas) in the antigen population without at the same time
requiring the model to differentiate between multiple incompatible antigen types.
The results presented showed that the GA could evolve an antibody type that matched multiple
antigens through the identification of a common schema. In addition, by matching an antigen with
multiple antibodies and then giving the fitness score to the best matched antibody, it was shown that
a population could be evolved and maintained that contained representatives of different antibodies.
Thus multiple peaks could be discovered and maintained in this population with this matching and
scoring schemes. The mathematical results were presented in Smith et al. (1993).
10.2 Spectra Recognition
A general form of a chemical reaction maps a set of reactants (R) into a set of products (P). By
using a binary representation, Dasgupta et al. (1999) described each of the reactants and products
for spectra recognition. Each bit in the string corresponded to a peak occurrence within an equal
length of wavenumbers.
The relationship between their immunological terminology and the developed spectra
recognition algorithm is described in Table 11. Equation (11) represents the match function between
two bit strings.
.),(
,),(1
iiiii
n
iiiii
chchW
TchWbF
+=
≥= ∑= (11)
where bi is the i-th bit value of the n-th bit in the string; T is the pre-defined threshold; Wi(hi,ci) is
the weight of the i-th bit as a function of the presence of a peak hi and a characteristic property ci.
Table 11: Immunogenetic spectra recognition.
Immune system Spectra Recognition
Self Set of starting reactants R before chemical or photochemical reactions
Non-self Set of products due to reaction
Antigen Any of the products P
Antibody Any evolved population which uniquely recognized a single product
Matching A match occurs if the Ag-Ab similarity exceeds a certain threshold T
Matching function Measures how well two spectra match, according to Equation (11)
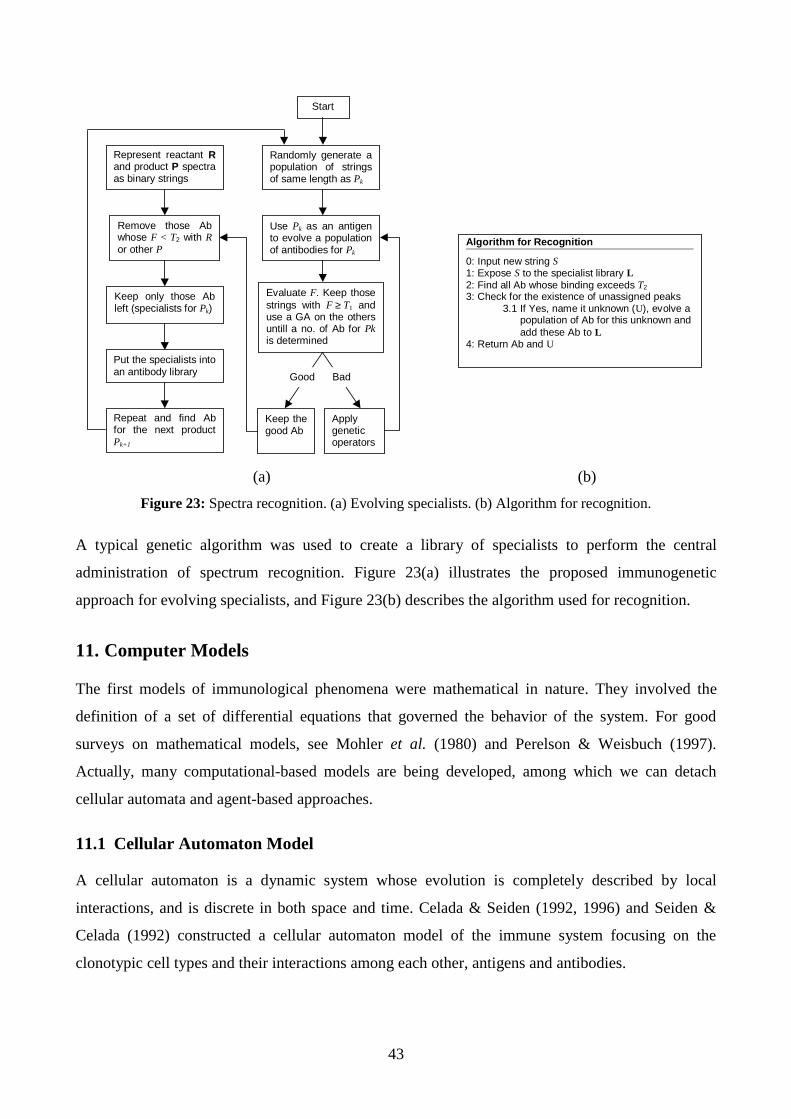
43
Randomly generate apopulation of stringsof same length as Pk
Use Pk as an antigento evolve a populationof antibodies for Pk
Evaluate F. Keep thosestrings with F ≥ T1 anduse a GA on the othersuntill a no. of Ab for Pkis determined
Keep thegood Ab
Applygeneticoperators
Start
Represent reactant Rand product P spectraas binary strings
Remove those Abwhose F < T2 with Ror other P
Keep only those Ableft (specialists for Pk)
Put the specialists intoan antibody library
Repeat and find Abfor the next productPk+1
Good Bad
Algorithm for Recognition
0: Input new string S1: Expose S to the specialist library L2: Find all Ab whose binding exceeds T2
3: Check for the existence of unassigned peaks3.1 If Yes, name it unknown (U), evolve a population of Ab for this unknown and add these Ab to L
4: Return Ab and U
(a) (b)
Figure 23: Spectra recognition. (a) Evolving specialists. (b) Algorithm for recognition.
A typical genetic algorithm was used to create a library of specialists to perform the central
administration of spectrum recognition. Figure 23(a) illustrates the proposed immunogenetic
approach for evolving specialists, and Figure 23(b) describes the algorithm used for recognition.
11. Computer Models
The first models of immunological phenomena were mathematical in nature. They involved the
definition of a set of differential equations that governed the behavior of the system. For good
surveys on mathematical models, see Mohler et al. (1980) and Perelson & Weisbuch (1997).
Actually, many computational-based models are being developed, among which we can detach
cellular automata and agent-based approaches.
11.1 Cellular Automaton Model
A cellular automaton is a dynamic system whose evolution is completely described by local
interactions, and is discrete in both space and time. Celada & Seiden (1992, 1996) and Seiden &
Celada (1992) constructed a cellular automaton model of the immune system focusing on the
clonotypic cell types and their interactions among each other, antigens and antibodies.

44
1. They consist of a discrete lattice of sites2. They evolve in discrete time steps3. Each site takes on a finite set of possible values4. The value of each site evolves according to a probabilistic rule5. The rules for the evolution of a site depend only on the site
itself6. Entities move from site to site. At the end of each time step the
entities are allowed to diffuse to adjacent sites
Start time step
Inject antigens
Let T cells stimulate APCs and B cells
Delete overage cells
Let antibody bind antigen and antibodyLet B cell bind antigen and antibodyLet APC bind antigen and antibody/antigen complexes
Anergize B cells
Delete antigens, antibodies and complexes
Create new cells and age cells
Differentiate multiplied B cells into plasma and memory cells
Create antibodies
Move cells and molecules
End time step
(a) (b)
Figure 24: (a) Rules for the proposed cellular automaton model. (b) Steps in the simulation.
Their model included B and T-cells, each of which possessing a receptor represented as a binary
string of L bits with a fixed, directional reading frame. A T-cell possessed a single L-bit receptor,
while a B-cell had an L-bit receptor plus an L-bit MHC molecule. Non-specific antigen presenting
cells were also added, with the same MHC’s as the B-cells. Antigens were represented by a number
of L-bit segments corresponding to the epitopes and peptides. Epitopes were defined as the portion
of an antigen that is recognized by a B-cell receptor and peptides the portion of the antigen that can
be bound by an MHC molecule and recognized by an appropriate T-cell. Antibodies were taken to
have the same form as antigens, and had a paratope that was identical to the receptor of the B-cell
that secreted them. There were two types of interaction between system elements. The first type was
governed by specificity and the second one was non-specific, and took place between an APC cell
and antigens or antigen-antibody complexes. The main rules for their cellular automaton model are
depicted in Figure 24(a) and the steps in the simulation are shown in Figure 24(b). Figure 24(b)
gives a more general idea of all the types of features embodied in their model.
This model was further extended to include infectious virus and cytotoxic T lymphocytes, i.e., a
cellular response (Bezzi et al., 1997). Bernaschi et al. (1998) presented a parallel implementation of
the Celada-Seiden automaton discussed above.
11.2 Multi-Agent Model
Ballet et al. (1997) simulated a human secondary humoral response with a multi-agent system
to study the kinetics of the antibody proliferation with several types of antigenic substances, like
death antigens, poorly recognizable antigenic substances, proliferative antigens and antigenic
substances directed against one of the immune system agents.
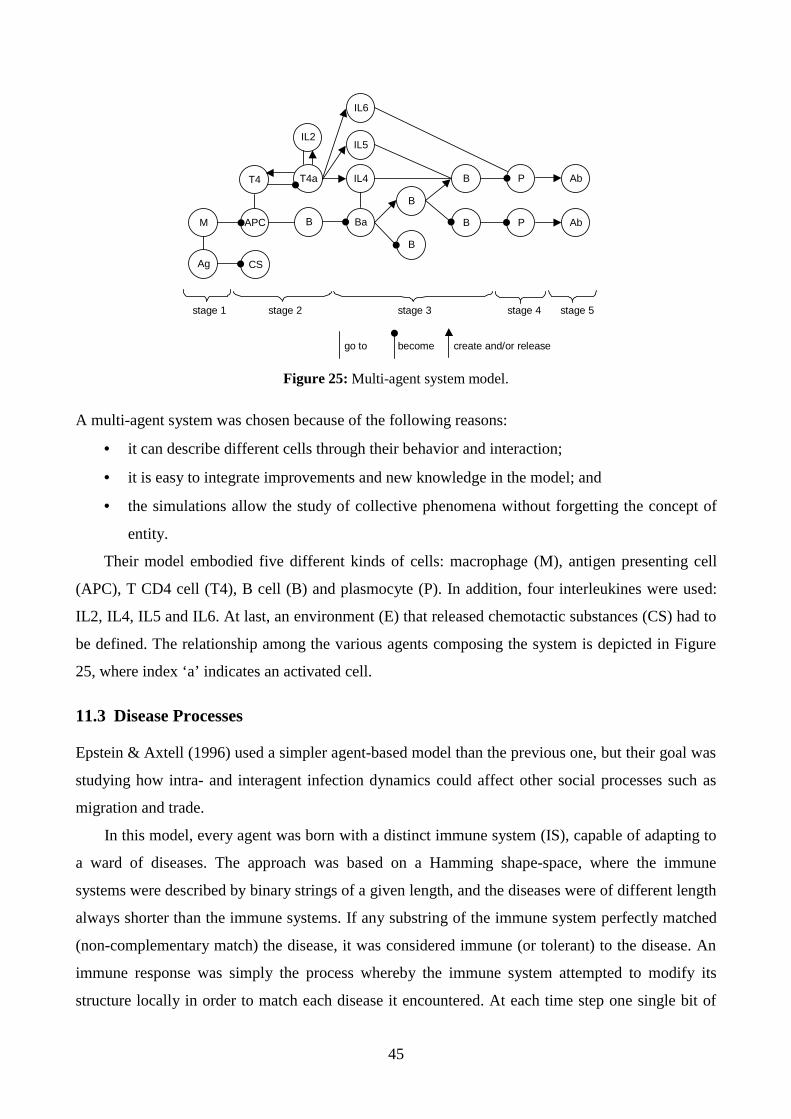
45
IL6
B
B
B
B
P
P
Ab
Ab
Ag
M APC
T4
CS
T4a
IL2
B
IL4
IL5
Ba
stage 1 stage 2 stage 3 stage 4 stage 5
go to become create and/or release
Figure 25: Multi-agent system model.
A multi-agent system was chosen because of the following reasons:
• it can describe different cells through their behavior and interaction;
• it is easy to integrate improvements and new knowledge in the model; and
• the simulations allow the study of collective phenomena without forgetting the concept of
entity.
Their model embodied five different kinds of cells: macrophage (M), antigen presenting cell
(APC), T CD4 cell (T4), B cell (B) and plasmocyte (P). In addition, four interleukines were used:
IL2, IL4, IL5 and IL6. At last, an environment (E) that released chemotactic substances (CS) had to
be defined. The relationship among the various agents composing the system is depicted in Figure
25, where index ‘a’ indicates an activated cell.
11.3 Disease Processes
Epstein & Axtell (1996) used a simpler agent-based model than the previous one, but their goal was
studying how intra- and interagent infection dynamics could affect other social processes such as
migration and trade.
In this model, every agent was born with a distinct immune system (IS), capable of adapting to
a ward of diseases. The approach was based on a Hamming shape-space, where the immune
systems were described by binary strings of a given length, and the diseases were of different length
always shorter than the immune systems. If any substring of the immune system perfectly matched
(non-complementary match) the disease, it was considered immune (or tolerant) to the disease. An
immune response was simply the process whereby the immune system attempted to modify its
structure locally in order to match each disease it encountered. At each time step one single bit of

46
the infected immune system was changed in order to reduce its Hamming distance from the
infection, a process called “learning”.
An interesting aspect of this work was that the agents infected could pass the diseases to some
of their neighbors, and also the diseases were able of “stealing” metabolic capacity of their hosts, a
behavior like that of biological parasites. This would cause different behaviors in the “sick” agents.
Two types of rules controlled the system.
1. Agent immune response rules:
• if the disease is a substring of the IS then end, else go to the following step;
• the substring in the agent IS having the smallest Hamming distance from the disease is
selected and the first different bit switched.
2. Agent disease transmission rule:
• for each neighbor, a disease that currently afflicts the agent is selected at random and given
to the neighbor.
12. Other Approaches
The approaches presented in this section are all those that did not take part in the previous sections,
but are considered relevant (and were available for the authors) for bringing new insights into the
theory of artificial immune systems.
12.1 Open WebServer Coordination
Open WebServer is an adaptive web server and a framework for building a versatile server, which
reifies various system execution policies in a web server as metaobjects. Each metaobject represents
a policy for concurrency, I/O event dispatching, protocol filtering, connection management,
caching, logging and service redundancy (Suzuki & Yamamoto (2000a,b)).
The works of Suzuki & Yamamoto (2000a,b) focused on the development of a Java-based
framework for building an artificial immune network, called iNet. The iNet was used to design a
policy coordination facility from the immunological point of view, where the system current
conditions represented the antigens, and each quality-of-service (QoS) policy management was
regarded as an antibody.
The structure of an antibody is shown in Figure 26(a), and Figure 26(b) depicts a class diagram
showing the kernel of the iNet. The dynamics of the network was determined by a differential
equation, based on that defined by Farmer et al. (1986) and further extended by Ishiguro et al.
(1996, 1997) (see Section 2.1).
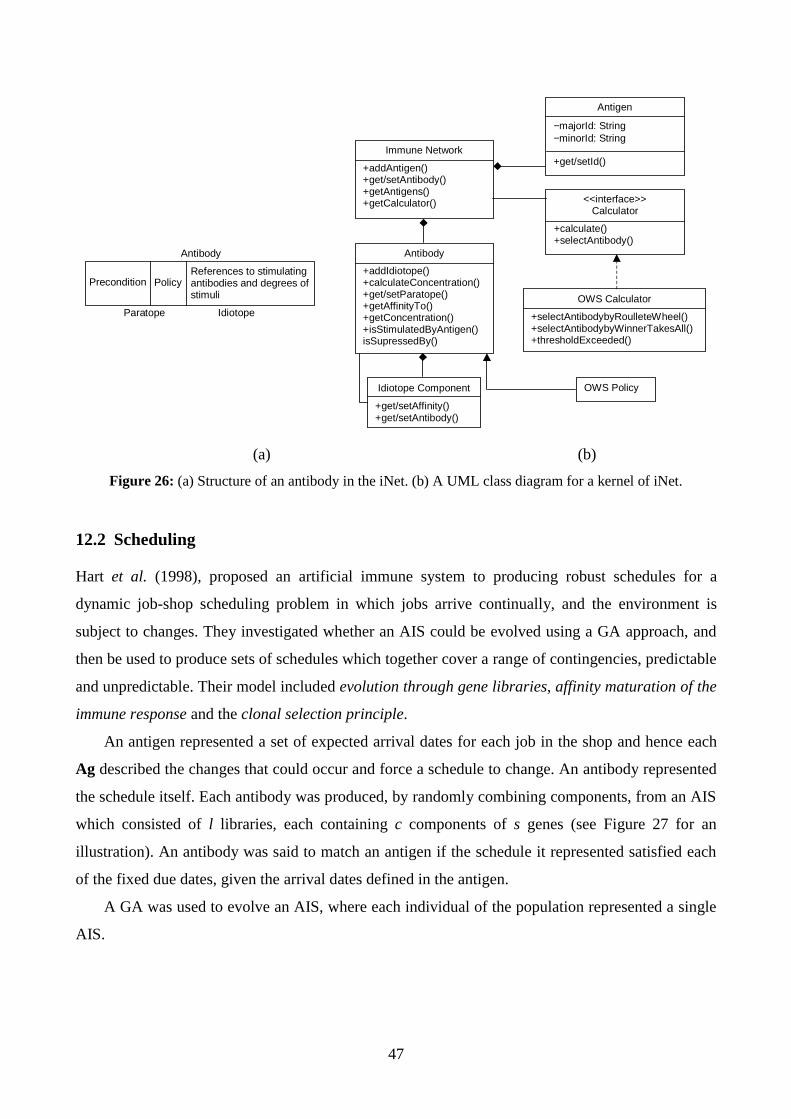
47
References to stimulatingantibodies and degrees ofstimuli
Policy
Antibody
Paratope Idiotope
Precondition
Antigen
−majorId: String−minorId: String
+get/setId()
<<interface>>Calculator
+calculate()+selectAntibody()
OWS Calculator
+selectAntibodybyRoulleteWheel()+selectAntibodybyWinnerTakesAll()+thresholdExceeded()
Immune Network
+addAntigen()+get/setAntibody()+getAntigens()+getCalculator()
Antibody
+addIdiotope()+calculateConcentration()+get/setParatope()+getAffinityTo()+getConcentration()+isStimulatedByAntigen()isSupressedBy()
Idiotope Component
+get/setAffinity()+get/setAntibody()
OWS Policy
(a) (b)
Figure 26: (a) Structure of an antibody in the iNet. (b) A UML class diagram for a kernel of iNet.
12.2 Scheduling
Hart et al. (1998), proposed an artificial immune system to producing robust schedules for a
dynamic job-shop scheduling problem in which jobs arrive continually, and the environment is
subject to changes. They investigated whether an AIS could be evolved using a GA approach, and
then be used to produce sets of schedules which together cover a range of contingencies, predictable
and unpredictable. Their model included evolution through gene libraries, affinity maturation of the
immune response and the clonal selection principle.
An antigen represented a set of expected arrival dates for each job in the shop and hence each
Ag described the changes that could occur and force a schedule to change. An antibody represented
the schedule itself. Each antibody was produced, by randomly combining components, from an AIS
which consisted of l libraries, each containing c components of s genes (see Figure 27 for an
illustration). An antibody was said to match an antigen if the schedule it represented satisfied each
of the fixed due dates, given the arrival dates defined in the antigen.
A GA was used to evolve an AIS, where each individual of the population represented a single
AIS.

48
Expressed antibody
C1 C2 C3 C4
C components per library
l lib
rarie
s
L11 L12 L13 L14
L21 L22 L23 L24 L11 L22 L33
L31 L32 L33 L34
Figure 27: Generating an antibody from a set of l gene libraries composed of c components of length s.
The fitness of each individual (AIS) was calculated by the expression:
• express N antibodies at random and decode them into schedules;
• select K antigens at random, with replacement;
• for each k (k = 1,...,K) calculate its match-score and assign k the best match-score;
• average the K scores to give the overall fitness for the individual.
The authors modeled the affinity maturation of the antibody repertoire in the following way:
after a match-score for an antibody had been calculated, the antibody was mutated at random in M
positions, and the match-score recalculated. If the match-score improved, then the original antibody
was assigned this new match-score. The clonal selection was used to create C clones of the best
individual of the population, which were subjected to a hypermutation mechanism.
They concluded that the fittest schedules were obtained at low mutation rates, and high sizes of
the initial population (N) and number of clones (C).
In a later work, Hart & Ross (1999) proposed a scheduling application of an artificial immune
system, called PRAIS (Pattern Recognising Artificial Immune System). In their system, sudden
changes in the scheduling environment required the rapid production of new schedules. Their model
operated in two phases. A first phase comprising the immune system analogy in conjunction with a
genetic algorithm, in order to detect common patterns amongst scheduling sequences frequently
used by a factory. In phase II, some of the combinatorial features of the natural immune system
were modeled to use the detected patterns to produce new schedules, either from scratch or by
starting from a partially completed schedule.
Their system was based on the works of Forrest et al. (1993) and Smith et al. (1993), with
several additions and modifications. An antigen (Ag) was considered to represent a sequence of
jobs on a particular machine, represented by an integer string of length L1. An antibody (Ab) of
length L2 (L2 < L1) represented a short sequence of jobs that is common to more than one schedule.

49
Antigen 1 2 3 4 5 6 7 8 9 Match-score
3 4 6 7 8 * 1 3 4 6 7 8 * 1
Antibody 3 4 6 7 8 * 10 + 1 = 11 3 4 6 7 8 * 15 + 1 = 16 Best Score
Figure 28: Integer-valued encoding for the antigen and antibody molecules, together with the matchingfunction. A match between number corresponds to a score of 5 and a don’t care corresponds to a score of 1.
The Ab could contain don’t care alleles ‘*’, to facilitate incomplete matching, and the fitness
function constituted a modified version of the emergent fitness sharing function, in which the
degree of generalization or specialization exhibited by the evolved antibodies could be controlled
by altering some pre-defined parameters. The Ag-Ab match score took into account the presence of
don’t cares and the string lengths. If the string were of different lengths, the match-score was
calculated for every possible alignment position, and the highest score found returned. Figure 28
illustrates the strings and their match function.
They focused on controlling the evolution of the population aiming at varying both the
diversity of the antibodies produced, and the extent of the coverage of the antigen universe. They
showed that the antibodies evolved could be used to reconstruct the set of original schedules that the
immune system had been exposed to, and also to construct schedules that had not been seen
previously.
12.3 Data Mining
Data mining, or knowledge discovery in databases, is related to the process of identifying novel,
valid and potential patterns in data, where the critical issue is the extraction of knowledge from the
given dataset. Hunt et al. (1995) and Hunt & Fellows (1996) illustrated how the immune system is
inherently case-based and how it relies on its content addressable memory and a general pattern
matcher to help in the identification process of new situations that are similar to past situations.
They constructed a case memory inspired in the immune system and network theory and showed
that its pattern recognition, learning and memory acquisition operations could support a Case-
Based Reasoning (CBR) system.
Figure 29 illustrates the basic architecture of a CBR system (Aamodt & Plaza, 1994). The cases
can contain any kind of information, e.g. the profile of a person, indicating its age, marital status,
income, etc. In the system proposed by Hunt et al. (1995), an immune network represented the
constructed case-base, where similar cases occupied neighboring regions in the network, and the
new cases represented the antigens. Figure 30(a) illustrates the kind of encoding scheme used by the
authors, and Figure 30(b) depicts their matching algorithm. Notice that the matching function took
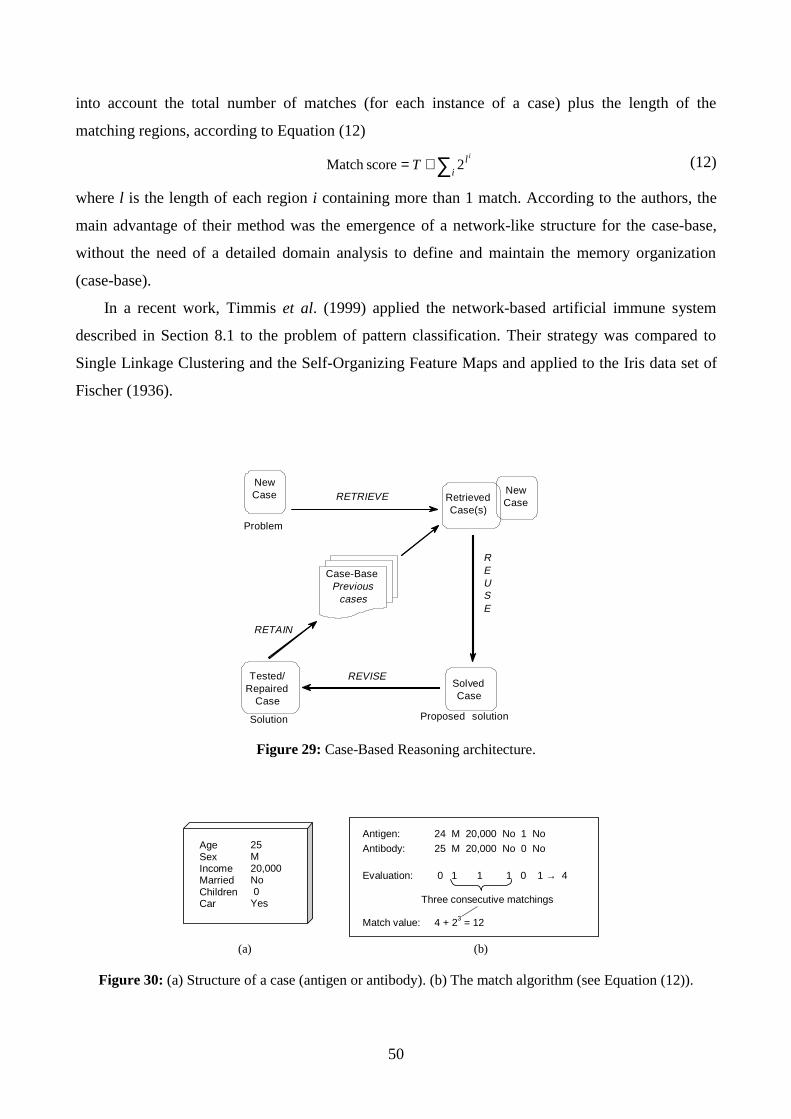
50
into account the total number of matches (for each instance of a case) plus the length of the
matching regions, according to Equation (12)
∑+=i
l i
T 2score Match (12)
where l is the length of each region i containing more than 1 match. According to the authors, the
main advantage of their method was the emergence of a network-like structure for the case-base,
without the need of a detailed domain analysis to define and maintain the memory organization
(case-base).
In a recent work, Timmis et al. (1999) applied the network-based artificial immune system
described in Section 8.1 to the problem of pattern classification. Their strategy was compared to
Single Linkage Clustering and the Self-Organizing Feature Maps and applied to the Iris data set of
Fischer (1936).
NewCase
SolvedCase
Tested/Repaired
Case
RETRIEVE
Case-BasePrevious
cases
REUSE
REVISE
RETAIN
NewCaseRetrieved
Case(s)
Problem
Proposed solutionSolution
Figure 29: Case-Based Reasoning architecture.
AgeSexIncomeMarriedChildrenCar
25M20,000No 0Yes
Antigen: 24 M 20,000 No 1 No
Antibody: 25 M 20,000 No 0 No
Evaluation: 0 1 1 1 0 1 → 4
Three consecutive matchings
Match value: 4 + 23 = 12
(a) (b)
Figure 30: (a) Structure of a case (antigen or antibody). (b) The match algorithm (see Equation (12)).

51
12.4 Classifier Systems
Forrest & Hofmeyr (1999) pointed out a set of similarities and differences between their artificial
immune system, described in Hofmeyr & Forrest (1999, 2000) and briefly discussed in Section 7.1,
and the classifier systems. Although the authors suggested that the mapping between their AIS and
classifier systems is not 1-1, a tentative comparison was performed according to Table 12.
Table 12: Tentative comparison between the AIS and classifier systems.
Classifier Systems Artificial Immune Systems
Classifier condition Detector
Classifier action Isotypes
1,0,* matching r-contiguous bits
Classifier strength Immature, mature, activated and memory states
Message list Network traffic (datapath triples)
Competition for packets Bidding for messages
More specific match wins More specific match wins
Support Activation threshold
Message intensity Sensitivity level
Bucket brigade Affinity maturation
Genetic algorithm, triggering Random detectors, negative selection
Table 13: Comparison of the major components of a classifier system and an immune system.
Classifier Systems Artificial Immune Systems
Classifier Antibody type
Condition Epitope
Action Paratope
Strength Concentration
Specificity Specificity
Tax Dissipation term
Payoff Antigen reduction
External message Antigen
Message list All paratopes and antigens
Economy Concentration update rule
Performance function Rate of antigen removal
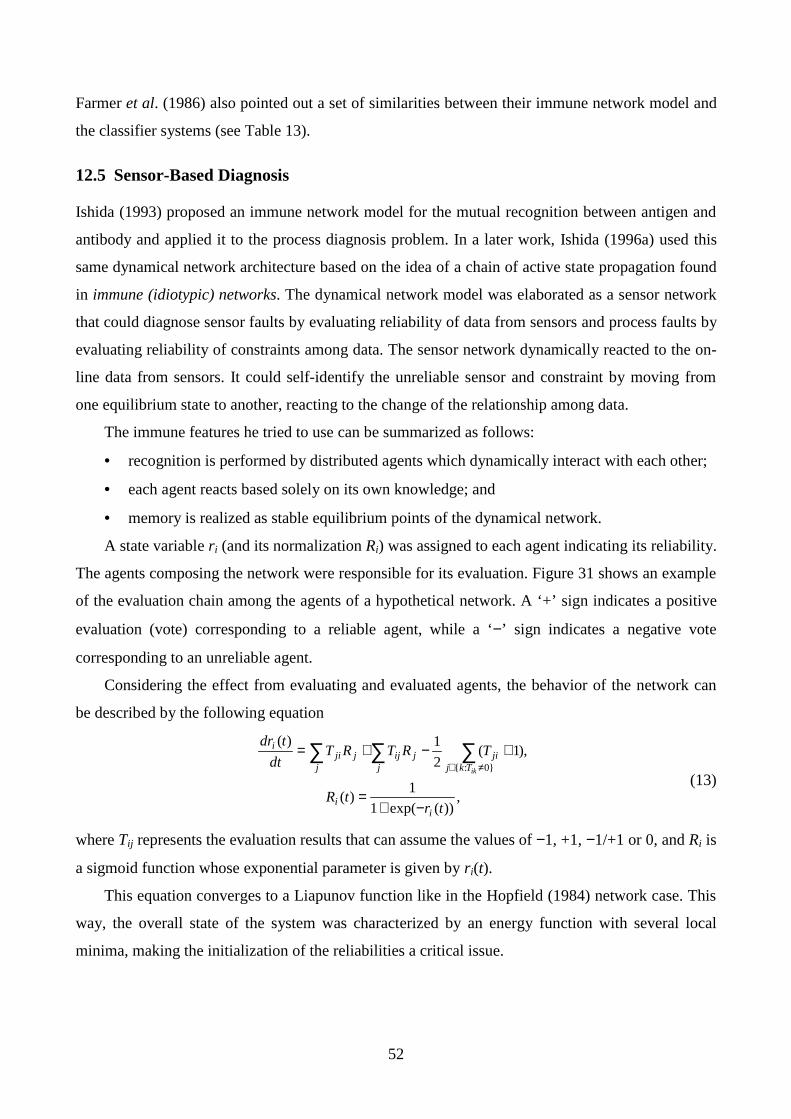
52
Farmer et al. (1986) also pointed out a set of similarities between their immune network model and
the classifier systems (see Table 13).
12.5 Sensor-Based Diagnosis
Ishida (1993) proposed an immune network model for the mutual recognition between antigen and
antibody and applied it to the process diagnosis problem. In a later work, Ishida (1996a) used this
same dynamical network architecture based on the idea of a chain of active state propagation found
in immune (idiotypic) networks. The dynamical network model was elaborated as a sensor network
that could diagnose sensor faults by evaluating reliability of data from sensors and process faults by
evaluating reliability of constraints among data. The sensor network dynamically reacted to the on-
line data from sensors. It could self-identify the unreliable sensor and constraint by moving from
one equilibrium state to another, reacting to the change of the relationship among data.
The immune features he tried to use can be summarized as follows:
• recognition is performed by distributed agents which dynamically interact with each other;
• each agent reacts based solely on its own knowledge; and
• memory is realized as stable equilibrium points of the dynamical network.
A state variable ri (and its normalization Ri) was assigned to each agent indicating its reliability.
The agents composing the network were responsible for its evaluation. Figure 31 shows an example
of the evaluation chain among the agents of a hypothetical network. A ‘+’ sign indicates a positive
evaluation (vote) corresponding to a reliable agent, while a ‘−’ sign indicates a negative vote
corresponding to an unreliable agent.
Considering the effect from evaluating and evaluated agents, the behavior of the network can
be described by the following equation
,))(exp(1
1)(
,)1(2
1)(
}0:{
trtR
TRTRTdt
tdr
ii
j Tkjjijij
jjji
i
ik
−+=
+−+= ∑ ∑∑≠∈
(13)
where Tij represents the evaluation results that can assume the values of −1, +1, −1/+1 or 0, and Ri is
a sigmoid function whose exponential parameter is given by ri(t).
This equation converges to a Liapunov function like in the Hopfield (1984) network case. This
way, the overall state of the system was characterized by an energy function with several local
minima, making the initialization of the reliabilities a critical issue.

53
1
2 34
5
+
+
+
+ +
− −
−
Figure 31: An example of evaluation chain for sensor-based diagnosis.
12.6 The Reflection Pattern in The Immune System
Reflection is a design principle that allows a system to have an explicit representation of itself such
that it makes it easy to adapt the system to a changing environment. The base units of computation
in object-oriented systems are the objects (or baseobjects). The reflection pattern generally
introduces the notion of object/metaobject separation. A metaobject can track and control certain
aspects of baseobjects. A set of metaobjects is called a metalevel, or metaspace, and a set of
baseobjects is called a baselevel. In contrast to reflection, reification is the process that makes
something accessible when it is normally unavailable in the baselevel. Figure 32(a) illustrates a
typical reflective architecture. The reflection design can be used to draw rules of interactions among
objects of any object-oriented approach, including programming languages, leading to a better
comprehension and modeling of great variety of phenomena.
Suzuki & Yamamoto (1998) argued that the antigen recognition and elimination mechanism is
an example of the immune reflective capability. The self/non-self discrimination problem was made
equivalent to that of reflecting self in a mirror and comparing it with a foreign component. Under
this perspective, MHC molecules would play the role of the mirror that T-cells could refer to in
order to recognize intracellular pathogens. In the context of the reflection pattern, MHC molecules
corresponded to metaobjects, while APCs and other lymphocytes were baseobjects because MHC
controls the major immune phenomena including the recognition of intracellular pathogens by T-
cells and activation of B-cells. Figure 32(b) presents a sequence diagram for the reflection pattern
with the example of a simplified intracellular (Peptide/MHC complex) immune recognition.

54
Reification Reflection
Baselevel objects
Metalevel objects
Baselevel
Metalevel
1: Search foreignorganisms ()
3: Get Peptide MHCComplex ()
2: Find Peptide MHCComplex ()
4: Compare with ()
: T cell : TCR : APC : MHC
Baseobjects Metaobject
(a) (b)
Figure 32: (a) Typical reflective architecture. (b) Sequence diagram for the reflection pattern in theMHC/peptide complex recognition.
12.7 Evolution of Gene Libraries
Hightower et al. (1995) and Perelson et al. (1996) used a genetic algorithm and a binary model of
the immune system to study the effects of evolution on the genetic encoding for antibody
molecules. One feature of their encoding was that not all genes found in the genotype (total
collection of gene segments) were expressed in the phenotype (expressed antibody molecules).
The genetic material for one antibody molecule is stored in five separate component libraries.
Producing one antibody molecule begins with a random selection of a genetic component from each
of the libraries. In their model, the bit string representing the genotype of an individual was divided
into four equal-size libraries of antibody segments as shown in Figure 33. Within each library there
were eight elements, represented as bit strings of length sixteen, so each individual genome had a
total of 512 bits. The expressed antibodies had a length of 64 bits.
The experiments showed that the GA could optimize complex genetic information, being able
to organize the structure of the antibody libraries. They also showed that selection pressure
operating on the phenotype as a whole could translate to selection pressure acting on individual
genes, even though not all genes were expressed in the phenotype.
Oprea & Forrest (1998) used a similar representation as the one described above to explore
how the survival probability of an individual scales with the size of its germline-encoded antibody
repertoire, and extended this analysis to antibody-pathogen matching rules that might be more
realistic (Oprea & Forrest, 1999).

55
One individual genome equals four libraries
Library 1 Library 2 Library 3 Library 4
A1 A2 A3 A4 A5 A6 A7 A8 B1 B2 B3 B4 B5 B6 B7 B8 C1 C2 C3 C4 C5 C6 C7 C8 D1 D2 D3 D4 D5 D6 D7 D8
A3 D5C8B2
A3 D5C8B2
A3 B2 C8 D5
= four 16-bit segments
= one 64-bit string
Expressed antibody
Figure 33: Process of constructing/expressing an antibody from genetic libraries.
Their results indicated that the scaling relation between fitness and the size of the evolved antibody
library was only a variant of the scaling relation obtained with random libraries of same size. It was
also argued that the increase in addition of antibodies to the germline-encoded repertoire did not
result in a directly proportional increase in the survival probability of an individual, what could be
an explanation for why the V-region libraries in various species do not seem to number more than
approximately one hundred genes.
12.8 A Self-Identification Process
Ishida (1996b) presented a brief survey of applications of immunologically inspired algorithms and
posed the immune system as a self-identification process.
His immunological design paradigm was stated as:
• agents should be designed so that they can be specified by the self information (program) as
well as environmental conditions. Rather than incorporating all the functions needed, the
program triggered by environmental conditions worked to specify the agent to fit the
condition;
• a field should be designed to drive the addition or the self-reproduction of agents and to
drive the specification process of each agent. It should also restrict the behavior of agents
so that some of them do not disturb the harmony of the others.
12.9 A Simulated Annealing Model of Diversity
De Castro & Von Zuben (2000c) presented a simulated annealing approach aiming at generating a
dedicated pool of candidate solutions that best covered the search-space. Their strategy assumed no
a priori knowledge about the problem and produced a fixed-size set of potential candidates based
only on the representation of the task. The algorithm induced diversity in a population by

56
maximizing an energy function that takes into account the Hamming distance between binary
strings. Its potential to machine-learning applications and extension to Euclidean spaces were also
discussed.
They considered a Hamming shape-space, where molecules were represented by binary strings
of various lengths and the Ag-Ab interactions were measured by the Hamming distance between
these molecules. The cost (energy) function proposed for the SA model allowed the detection of
self-recognizing individuals and also the maximization of the Hamming distance among them:
≠
=otherwise,0
,1),( ji xx
jiD , (14)
),(2
),( 2 jiHDNl
jiF×
= , (15)
( )∑ ∑=
≠+=
+×=N
i
N
ijj
jiFjiDE1 11
),(),(2
100. (16)
D(i,j) is a square, symmetric matrix responsible for the self/nonself discrimination, and xi,
i = 1,...,N, represents the members of the antibody population. It is composed of ones or zeros only,
where a 0 indicates self-recognizing individuals and a 1 represents unique members (see Equation
(14)). Matrix F(i,j) is also a square, symmetric matrix that contains the Hamming Distance (HD)
among all individuals in the population (see Equation (15)). Equation (16) is the percentile energy
of the whole Ab repertoire, and is equal to 100% when there are no self-recognizing individuals in
the population and their distance is maximal.
13. Web Sites on Artificial Immune Systems and Their Applications
In this section we are going to list some Web Sites (mostly personal Home Pages) in which to
search for material on the artificial immune system and their applications. Most of these sites
contain references available for download. They are ordered aplphabeticlly and a brief description
of the research area of each site is given.
Derek J. Smith:• Immune Response to Virus• Cross-Reactivity• Associative Memoryhttp://www.cs.unm.edu/~dsmith/
57
Dipankar Dasgupta:• Immune System Survey• Novelty Detection (Negative Selection)• Book on Artificial Immune Systems and Their Applicationshttp://www.msci.memphis.edu/~dasgupta
Emmah Hart:• Schedulinghttp://www.dai.ed.ac.uk/daidb/people/homes/emmah/research.html
Immune System Modelling and Simulation Group• Immune System Modelling and Simulationhttp://www.cs.princeton.edu/~stevenk/http://www.zpr.Uni-Koeln.DE/~filippo/
ISYS project:• Formal Artificial Immune System• Immune Network Theory• Application to Fraud Detectionhttp://www.aber.ac.uk/~dcswww/ISYS/http://www.aber.ac.uk/~jit93/http://www.aber.ac.uk/~jot/ISYS/http://www.aber.ac.uk/~jjh/isys/ISYS.html
Jungwon Kim:• Negative Selection• Intrusion Detectionhttp://www.cs.ucl.ac.uk/staff/J.Kim/
Junichi Suzuki:• iNet for Open WebServer• Reflection PatternURL: http://www.yy.cs.keio.ac.jp/~suzuki/project/immunity/index.html
Leandro de Castro and Fernando J. Von Zuben:• Hybrid Approaches (neural networks and genetic algorithms)• Learning & Optimization• Pattern recognition and classificationhttp://www.dca.fee.unicamp.br/~lnuneshttp://www.dca.fee.unicamp.br/~vonzuben
Mihaela Oprea:• Immune response dynamics• Evolution of immune receptor librarieshttp://www.santafe.edu/~mihaela/

58
Nikolai Nikolaev:• Inductive problem solving with immune networkshttp://www.aubg.bg/faculty/cs/nikolaev/
Pascal Ballet• Development of multi-agent systems to model immune phenomenahttp://www.enib.fr/~ballet/
Patrik D'haeseleer:• Change Detection (Negative Selection)• Theoretical Immunologyhttp://www.cs.unm.edu/~patrik/
Prabhat Hajela• Structural optimizationhttp://www.rpi.edu/~hajela
Stephanie Forrest:• Immune System Modeling• Computer Immunologyhttp://www.cs.unm.edu/~forrest/
Steven A. Hofmeyr:• Computer Immunology• Network Intrusion Detectionhttp://www.cs.unm.edu/~steveah/
System Sciences Laboratory (SS)• Diagnosis• Noise Controlhttp://genesis.aist-nara.ac.jp:80/work/papers/1996-e.html
Yoshitero Ishida:• Agent-based approacheshttp://genesis.aist-nara.ac.jp:80/~ishida/bcsE.html
Yuji Watanabe• Behavior Arbitration Mechanism for Autonomous Mobile Robothttp://www.bioele.nuee.nagoya-u.ac.jp/~yujihttp://www.bioele.nuee.nagoya-u.ac.jp/~kon

59
14. Concluding Remarks
It can be seen from the applications presented and models discussed, that the immune system is
particularly interesting for solving problems in distributed and dynamic environments. It was our
main intention to provide the reader with a wide source of potential applications and inspiration for
the immune-based approaches.
Like the Artificial Neural Network field, its noticeable that the Artificial Immune Systems also
lead to the development of different techniques, each one mapping a different mechanism of the
system. As examples we can detach the Clonal Selection Algorithm proposed by De Castro & Von
Zuben (2000a), the Negative Selection Algorithm introduced by Forrest et al. (1994), and the
Artificial Immune Networks as proposed by Farmer et al. (1986). These various mechanisms are
generally used for solving different types of problems. Immune network models are suitable to deal
with dynamic environments, while algorithms based upon the clonal selection principle are
adequate to solve optimization problems, and the negative selection strategies are successfully
applied to anomaly (or intrusion) detection tasks.
A great variety of encoding schemes and match functions was found. There seems to be no
limit for the information to be inserted in the genotype (and/or phenotype) of an individual, the
difficulty residing only in the problem of dealing with this information. The definition of match
functions, encoding schemes and equations for controlling the dynamics of the system are problem
dependent and may usually be defined in many different ways.
It can be perceived that there is no consensus within the scientific community of a unique,
formal artificial immune system. As proposed in the first part of this report (De Castro & Von
Zuben, 2000a), the techniques that are being named artificial immune systems (AIS), immune-
based systems, negative selection algorithms, artificial immune networks, etc. all together lead to
the emergence of a new and unique field of research, baptized immune engineering.
The references presented show that the last few years were committed by a great amount of
interest and work in the AIS from many different areas of research, from medical to computer
sciences. Characteristics of the immune system like uniqueness, distribution, pathogen recognition,
imperfect detection, reinforcement learning and memory are very suitable for the development of
systems which are dynamic, distributed, self-organized and autonomous. The areas of application
are as wide as the potentialities of the system.

60
Acknowledgements
Leandro Nunes de Castro would like to thank FAPESP (Proc. n. 98/11333-9) for the financial
support. Fernando Von Zuben would like to thank FAPESP (Proc. n. 98/09939-6) and CNPq (Proc.
n. 300910/96-7) for their financial support.
References
[1] Aamodt, A. & Plaza, E. (1994), “Case-Based Reasoning: Foundational Issues, MethodologicalVariations, and Systems Approaches”, AI Communications, 7(1), pp. 39-59.
[2] Abbattista, F., G. Di Gioia, G. Di Santo & A. M. Farinelli (1996), “An Associative Memory Basedon the Immune Networks”, 2nd. Online Workshop on Evolutionary Computation, Nagoya, Japan.
[3] Ada, G. L. & Nossal, G. (1987), “The Clonal Selection Theory”, Scientific American, 257(2), pp. 50-57.
[4] Adleman, , L. M. (1994), “Molecular Computation of Solutions to Combinatorial Problems”, Science,266, pp. 1021-1024.
[5] Aisu, H. & Mizutani H. (1996), “Immunity-Based Learning – Integration of Distributed Search andConstraint Relaxation”, In Proc. of the IMBS’96.
[6] Ballet, P., Tisseau, J. & Harrouet, F (1997), “A Multiagent System to Model an Human HumoralResponse”, In Proceedings of the IEEE SMC’97, pp. 357-362.
[7] Bernaschi, M., Castiglione, F. & Succi, S. (1998), “A Parallel Simulator of the Immune Response”,Lect. Notes in Computer Sc., 1401, pp. 163-172.
[8] Bezzi, M., Celada, F., Ruffo, S. & Seiden, P. E. (1997), “The Transition Between Immune andDisease States in a Cellular Automaton Model of Clonal Immune Response”, Physica A, 245(1-2), pp.145-163.
[9] Celada, F. & Seiden, P. E. (1996), “Affinity Maturation and Hypermutation in a Simulation of theHumoral Immune Response”, Eur. J. Immunol., 26, pp. 1350-1358.
[10] Celada, F. & Seiden, P. E. (1992), “A Computer Model of Cellular Interaction in the ImmuneSystem”, Imm. Today, 13, pp. 56-62.
[11] Dasgupta, D., (1999a), Artificial Immune Systems and Their Applications, Ed., Springer-Verlag.
[12] Dasgupta, D., (1999b), “Immunity-Based Intrusion Detection System: A General Framework”, InProc. of the 22nd NISSC.
[13] Dasgupta, D., Cao, Y. & Yang, C. (1999), “An Immunogenetic Approach to Spectra Recognition”,Proc. of GECCO’99, pp. 149-155.
[14] Dasgupta, D. & Forrest, S. (1999), “Artificial Immune Systems in Industrial Applications”, In Proc.of the IPMM'99.
[15] Dasgupta, D., (1997), “Artificial Neural Networks and Artificial Immune Systems: Similarities andDifferences”, Proc. of the IEEE SMC, 1, pp. 873-878.
[16] Dasgupta, D. & Forrest, S. (1996), “Novelty Detection in Time Series Data Using Ideas FromImmunology”, In Proc. of the ISCA’96.
[17] Deaton, R., Garzon, M. Rose, J. A., Murphy, R. C., Stevens Jr., S. E. & Franceschetti, D. R.(1997), “A DNA based Artificial Immune System for Self-Non-self Discrimination”, In Proc. of theIEEE SMC’97, pp. 862-866.
[18] De Castro, L. N. & Von Zuben, F. J. (2000a), “The Clonal Selection Algorithm with EngineeringApplications”, submitted to GECCO’00.

61
[19] De Castro, L. N. & Von Zuben, F. J. (2000b), “A Growing Boolean Competitive Network UsingIdeas From Immunology”, submitted to a Neural Network journal.
[20] De Castro, L. N. & Von Zuben, F. J. (2000c), “A Simulated Annealing Approach to IncreaseDiversity in a Binary Model of the Antibody Repertoire”, submitted to the Evolutionary Computationjournal.
[21] De Castro, L. N. & Von Zuben, F. J. (1999), “Artificial Immune Systems: Part I – Basic Theory andApplications”, Technical Report – RT DCA 01/99, pp. 89.
[22] D’haeseleer, P., S. Forrest & P. Helman (1996), “An Immunological Approach to ChangeDetection: Algorithms, Analisys and Implications”, Proc. of the IEEE Symposium on ComputerSecurity and Privacy.
[23] Dilger, W. (1997), “Descentralized Autonomous Organization of the Intelligent Home According tothe Principle of the Immune System”, Proc. of the IEEE SMC’97, pp. 351-356.
[24] Dilger, W. (1996), “The Immune System of the Smart Home”, In Y. Ishida (ed.), Workshop Notes 4,Proc. of the ICMAS’96, pp. 72-81.
[25] Endo, S., Toma, N. & Yamada, K. (1998), “Immune Algorithm for n-TSP”, In Proc. of the IEEESMC’98, pp. 3844-3849.
[26] Epstein J. & Axtell R. (1996), “Disease Processes”, In Growing Artificial Societies, MIT Press, pp.138-152.
[27] Farmer, J. D., Packard, N. H. & Perelson, A. S. (1986), “The Immune System, Adaptation, andMachine Learning”, Physica 22D, pp. 187-204.
[28] Fischer, R. A. (1936), “The Use of Multiple Measurements in Taxonomic Problems”, AnnualEugenics, 7(II), pp. 179-188 (Available for download in URL 1).
[29] Forrest, S. & Hofmeyr, S. A. (1999), “John Holland's Invisible Hand: An Artificial ImmuneSystem”, Presented at the FESTSCHIRIFT.
[30] Forrest, S., Hofmeyr S. A. & Somayaji A. (1997), “Computer Immunology”, Communications of theACM, 40(10), pp. 88-96.
[31] Forrest, S., A. Perelson, Allen, L. & Cherukuri, R. (1994), “Self-Nonself Discrimination in aComputer”, Proc. of the IEEE Symposium on Research in Security and Privacy, pp. 202-212.
[32] Forrest, S., Javornik, B., Smith, R. E. & Perelson, A. S. (1993), “Using Genetic Algorithms toExplore Pattern Recognition in the Immune System”, Evolutionary Computation, 1(3), pp. 191-211.
[33] Forrest, S. & A. Perelson (1992), “Computation and the Immune System”, SIGBIO Newsletter,Association for Computing Machinery, 12(2), pp. 52-57.
[34] Fukuda, T., Mori, K. & Tsukiama, M. (1999), “Parallel Search for Multi-Modal FunctionOptimization with Diversity and Learning of Immune Algorithm”, In (Ed.) D. Dasgupta, ArtificialImmune Systems and Their Applications, Springer-Verlag, pp. 210-220.
[35] Hajela, P., & Yoo, J. S. (1999), “Immune Network Modelling in Design Optimization”, In New Ideasin Optimization, (Eds.) D. Corne, M. Dorigo & F. Glover, McGraw Hill, London, pp. 203-215.
[36] Hajela, P., Yoo, J. & Lee, J. (1997), “GA Based Simulation of Immune Networks - Applications inStructural Optimization”, Journal of Engineering Optimization.
[37] Hajela, P., & Lee, J. (1996), “Constrained Genetic Search via Schema Adaptation: An ImmuneNetwork Solution”, Structural Optimization, 12(1), pp. 11-15.
[38] Hart, E. & Ross, P. (1999), “An Immune System Approach to Scheduling in ChangingEnvironments”, Proc. of GECCO’99, pp. 1559-1566.
[39] Hart, E., Ross, P. & Nelson, J. (1998), “Producing Robust Schedules Via An Artificial ImmuneSystem”, In Proc. of the ICEC'98.
[40] Hightower, R. R., Forrest S. & Perelson, A. S. (1996), “The Baldwin Effect in the Immune System:Learning by Somatic Hypermutation”, In R.K. Belew and M. Mitchel (Edc.), Adaptive Individuals inEvolving Populations, Addison-Wesley, Reading, MA, pp. 159-167.

62
[41] Hightower R. R., Forrest, S. A & Perelson, A. S. (1995), “The Evolution of Emergent Organizationin Immune System Gene Libraries”, In L. J. Eshelman (Eds.), Proc. of the Sixth Int. Conf. on G.As.,Morgan Kaufmann, San Francisco, CA, pp. 344-350.
[42] Hoffmann, G. W. (1986), “A Neural Network Model Based on the Analogy with the ImmuneSystem”, J. theor. Biol., 122, pp. 33-67.
[43] Hoffmann, G. W., Benson, M. W., Bree, G. M. & Kinahan, P. E. (1986), “A Teachable NeuralNetwork Based on an Unorthodox Neuron”, Physica 22D, pp. 233-246.
[44] Hofmeyr S. A. & Forrest, S. (2000), “Architecture for an Artificial Immune System”, submitted toEvolutionary Computation.
[45] Hofmeyr S. A. & Forrest, S. (1999), “Immunity by Design: An Artificial Immune System”, Proc. ofGECCO’99, pp. 1289-1296.
[46] Hopfield, J. J. (1984), “Neurons with Graded Response Have Collective Computational PropertiesLike Those of Two-State Neurons”, Proc. Natl. Acad. Sci. USA, 81, pp. 3088-3092.
[47] Hunt, J. E., Timmis, J., Cooke, D. E., Neal, & King, C. (1999), “JISYS: The Development of AnArtificial Immune System for Real World Applications”, In (Ed.) D. Dasgupta, Artificial ImmuneSystems and Their Applications, Springer-Verlag, pp 157-186.
[48] Hunt, J. E. & Cooke, D. E. (1996), “Learning Using an Artificial Immune System”, Journal ofNetwork and Computer Applications, 19, pp. 189-212.
[49] Hunt, J. E. & Fellows, A. (1996), “Introducing an Immune Response into a CBR system for DataMining”, In BCS ESG'96 Conference and published as Research and Development in Expert SystemsXIII.
[50] Hunt, J. E., Cooke, D. E. & Holstein, H. (1995), “Case Memory and Retrieval Based on the ImmuneSystem”, First International Conference on Case Based Reasoning, Published as Case-BasedReasoning Research and Development, Ed. Manuela Weloso and Agnar Aamodt, Lecture Notes inArtificial Intelligence 1010, pp 205 -216.
[51] Ishida, Y. (1996a), “An Immune Network Approach to Sensor-based Diagnosis by Self-Organization”, Complex Systems, 10, pp. 73-90.
[52] Ishida, Y. (1996b), “The Immune System as a Self-Identification Process: A Survey and a Proposal”,In Proc. of the IMBS’96.
[53] Ishida, Y. (1996c), “Agent-Based Architecture of Selection Principe in the Immune System”, In Proc.of the IMBS’96, pp. 92-104.
[54] Ishida, Y. (1993), “An Immune Network Model and Its Applications to Process Diagnosis”, Systemsand Computers in Japan, 24(6), pp. 646-651.
[55] Ishiguro, A., Watanabe, Y. & Kondo, T. (1997), “A Robot with a Decentralized Consensus-MakingMechanism Based on the Immune System”, In Proc. ISADS’97, pp. 231-237.
[56] Ishiguro, A. Watanabe, Y., Kondo, T., Shirai, Y. & Uchikawa, Y. (1996), “Immunoid: A Robotwith a Decentralized Behavior Arbitration Mechanisms Based on the Immune System”, In Proc. of theIMBS’96.
[57] Jun, J.-H., Lee, D.-W. & Sim, K.-B., (1999), “Realization of Cooperative and Swarm Behavior inDistributed Autonomous Robotic Systems Using Artificial Immune System”, In Proc. IEEE SMC’99,4, pp. 614-619.
[58] Kephart, J. O., Sorkin, G. B., Swimmer, M. & White S. R. (1999), “Blueprint for a ComputerImmune System”, In Artificial Immune Systems and Their Applications, (Ed.) D. Dasgupta, Springer-Verlag, pp. 241-261.
[59] Kephart, J. O., Sorkin, G. B. & Swimmer, M. (1997), “An Immune System for Cyberspace”, Proc.of the IEEE SMC’97, pp. 879-884.
[60] Kephart, J. O. (1994), “A Biologically Inspired Immune System for Computers”, In (Eds.) R. A.Brooks & P. Maes, Artificial Life IV Proceedings of the Fourth International Workshop on theSynthesis and Simulation of Living Systems, MIT Press, pp. 130-139.

63
[61] Kim, J. & Bentley, P. (1999a), “The Human Immune System and Network Intrusion Detection”, InProc. of the EUFIT’99 (CD-ROM).
[62] Kim, J. & Bentley, P. (1999b), “Negative Selection and Niching by an Artificial Immune System forNetwork Intrusion Detection”, In Proc. of GECCO’99, pp. 149-158.
[63] KrishnaKumar, K. & Neidhoefer, J. (1999), “Immunized Adaptive Critics for an AutonomousAircraft Control Application”, In (Ed.) D. Dasgupta, Artificial Immune Systems and TheirApplications, Springer-Verlag, pp. 221-241.
[64] KrishnaKumar, K. & Neidhoefer, J. (1997a), “Immunized Adaptive Critics for Level 2 IntelligentControl”, Proc. of the IEEE SMC’97, 1, pp. 856-860.
[65] KrishnaKumar, K. & Neidhoefer, J. (1997b), “Immunized Neurocontrol”, Expert Systems withApplications, 13(3), pp. 201-214.
[66] KrishnaKumar, K. Satyadas, A. & Neidhoefer, J. (1995), “An Immune System Framework forIntegrating Computational Intelligence Paradigms with Applications to Adaptive Control”, InComputational Intelligence A Dynamic System Perspective, (Eds.) M. Palaniswami, Y. Attikiouzel, R.J. Marks II, D. Fogel and T. Fukuda, IEEE Press, pp. 32-45.
[67] Lee, D-W., Jun, H-B. & Sim, K-B. (1999), “Artificial Immune System for Realization ofCooperative Strategies and Group Behavior in Collective Autonomous Mobile Robots”, In Proc. ofthe AROB'99 (International Symposium on Artificial Life and Robotics), pp. 232-235.
[68] McCoy, D. F. & Devaralan, V. (1997), “Artificial Immune Systems and Aerial ImageSegmentation”, Proceedings of the SMC’97, pp. 867-872.
[69] Mohler, R. R., Bruni, C. & Gandolfi, A. (1980), “A Systems Approach to Immunology”, Proc. ofthe IEEE, 68(8), pp. 964-989.
[70] Nagano, S. & Yonezawa, Y., (1999), “Generative Mechanism fo Emergent Properties Observed withthe Primitive Evolutional Phenomena by Immunotic Recognition”, In Proc. IEEE SMC’99, vol. I, pp.223-228.
[71] Nikolaev, N. I., Iba, H. & Slavov, V. (1999), “Inductive Genetic Programming with ImmuneNetwork Dynamics”, In Advances in Genetic Programming 3, MIT Press, chapter 15, pp. 355-376.
[72] Okamoto, T. & Ishida, Y. (1999a), “A Distributed Approach to Computer Virus Detection andNeutralization by Autonomous and Heterogeneous Agents”, In Proc of the ISADS’99, pp. 328-331.
[73] Okamoto, T. & Ishida, Y. (1999b), “Multiagent Approach Against Computer Virus: An Immunity-Based System”, In Proc. of the AROB’99, pp. 69-72.
[74] Ootsuki, J. T. & Sekiguchi, T. (1999), “Application of the Immune System Network Concept toSequential Control”, In Proc. IEEE SMC’99, 3, pp. 869-874.
[75] Oprea, M. & Forrest, S. (1999), “How the Immune System Generates Diversity: Pathogen SpaceCoverage with Random and Evolved Antibody Libraries”, In Proc. of the GECCO’99, 2, pp. 1651-1656.
[76] Oprea, M. & Forrest, S. (1998), “Simulated Evolution of Antibody Gene Libraries Under PathogenSelection”, In Proc. of the IEEE SMC’98.
[77] Perelson, A. S. & Weisbuch, G. (1997), “Immunology for Physicists”, Rev. of Modern Physics,69(4), pp. 1219-1267.
[78] Perelson, A. S., Hightower, R. & Forrest, S. (1996), “Evolution and Somatic Learning of V-RegionGenes”, Research in Immunology, 147, pp. 202-208.
[79] Potter, M. A. & De Jong K. A. (1998), “The Coevolution of Antibodies for Concept Learning”, InProc. of the 5th ICPPSN, pp. 530-539.
[80] Rumelhart, D. E., McClelland, J. L. & The PDP Research Group, eds. (1986), “ParallelDistributed Processing”, Cambridge MIT Press.
[81] Seiden, P. E. & Celada, F. (1992a), “A Model for Simulating Cognate Recognition and Response inthe Immune System”, J. theor. Biol., 158, pp. 329-357.

64
[82] Slavov, V. & Nikolaev, N. I. (1998), “Immune Network Dynamics for Inductive Problem Solving”, VPPSN, pp. 712-721.
[83] Smith, D. J., Forrest, & Perelson, S. A. (1993), “Searching for diverse, cooperative populations withgenetic algorithms”, Evolutionary Computation, 1, pp. 127-149.
[84] Suzuki, J. & Yamamoto, Y. (2000a), “A Decentralized Policy Coordination facility in OpenWebServer”, submitted to SPA’00.
[85] Suzuki, J. & Yamamoto, Y. (2000b), “iNet: A Configurable Framework for Simulating ImmuneNetwork”, submitted to IEEE SMC’00.
[86] Suzuki, J. & Yamamoto, Y. (1998), “The Reflection Pattern in the Immune System”, In Proc. ofOOPSLA’98, workshop on Non-Software Examples of Software Architecture.
[87] Timmis, J., Neal, M. & Hunt, J. (1999), “Data Analysis Using Artificial Immune Systems, ClusterAnalysis and Kohonen Networks: Some Comparisons”, In Proc. IEEE SMC’99, 3, pp. 922-927.
[88] Toma, N., Endo, S. & Yamada, K. (1999), “Immune Algorithm with Immune Network and MHC forAdaptive Problem Solving”, In Proc. IEEE SMC’99, 4, pp. 271-276.
[89] ___URL 1: Repository of Machine-Learning Databases of the University of Irvine, California. URL:ftp://ftp.ics.uci.edu/pub/machine-leraning-databases
[90] Vertosick, F. T. & Kelly, R. H. (1991), “The Immune System as a Neural Network: A Multi-epitopeApproach”, J. theor. Biol., 150, pp. 225-237.
[91] Vertosick, F. T. & Kelly, R. H. (1989), “Immune network theory: a role for parallel distributedprocessing?”, Immunology, 66, pp. 1-7.
[92] Watanabe, Y., Ishiguro, A., Shirai, Y. & Uchikawa, Y. (1998), “Emergent Construction BehaviorArbitration Mechanism Based on the Immune System”, In Proc. ICEC’98, pp. 481-486.
[93] Watanabe, Y., Ishiguro, A. & Uchikawa, Y. (1999), “Descentralized Behavior ArbitrationMechanism for Autonomous Mobile Robots Using Immune Network”, In (Ed.) D. Dasgupta, ArtificialImmune Systems and Their Applications, Springer-Verlag, pp. 187-209.