arkansas prescription monitoring program annual report … · 2 executive summary background this...
TRANSCRIPT

Annual Report
January-December 2015
Arkansas Prescr ipt ion Moni tor ing Program

TABLE OF CONTENTS
EXECUTIVE SUMMARY ...................................................................................... 2
LIST OF TABLES AND FIGURES
Table 1: Number of authorized users by type ................................................... 3
Figure 1: Number of queries by prescribers and dispensers
(Jan to Dec 2015) ............................................................................... 4
Figure 2: Number of monthly queries by licensing boards and
law enforcement (Jan to Dec 2015) .................................................... 4
Figure 3: States that share PMP data with Arkansas ......................................... 5
Figure 4: Recipients seeing seven (7) or more physicians and
Seven (7) or more pharmacies in a 90-day period .............................. 6
Figure 5: Quantity of doses dispensed to 7 X 7 “doctor shoppers” .................... 6
Table 2: Example of opioid conversion factor ................................................... 7
Figure 6: Adult recipients of painkillers > 100 MED ........................................... 7
Figure 7: Distribution of number of prescriptions by product type
Reported to the Arkansas PMP (Jan to Dec 2015) ............................. 8
Table 3: Top five drugs distributed in Arkansas (Jan to Dec 2015)................... 8
Figure 8: Hydrocodone doses dispensed per capita in 2015 ............................. 9
Figure 9: Oxycodone doses dispensed per capita in 2015 ................................ 9
Figure 10: Oxymorphone doses dispensed per capita in 2015 ............................ 9
Figure 11: Buprenorphine doses dispensed per capita in 2015 ........................... 9
INTRODUCTION .................................................................................................. 3
DATABASE ACCESS DATA ............................................................................... 4
MULTIPLE STATE DATA EXCHANGE ............................................................... 5
PRESCRIPTION DATA ........................................................................................ 6
PROGRAM CONTACTS .................................................................................... 10
2
Executive Summary
Background
This report addresses activities of the Arkansas Prescription Monitoring Program (PMP) for the
calendar year 2015. It includes statistical data, operations updates and legislative changes that
affect the program.
Data Highlights:
The use of the PMP by stakeholders continued to move in a positive direction. The number of
registered users increased in 2015 by 22%. The number of queries made by prescribers and
pharmacists increased 33% and 36%, respectively. The number of queries made by law
enforcement increased 117%. The number of “doctor shoppers” or “multiple provider
episodes” (seeing 7 or more prescribers and 7 or more pharmacies in a 90 day period) decreased 22%. The number of doses of hydrocodone dispensed in 2015 decreased 10% compared to 2014. This is encouraging due to hydrocodone being the top dispensed opioid in the state.
Legislative Acts:
Act 1208 of 2015 allowed prescribers and dispensers to assign delegates to access the Arkansas PMP data on their behalf. The goal is to increase usage of the program and to enhance user
workflow. Delegate access was initiated in late December 2015.
Act 901 of 2015 allowed access to the program by a new type of law enforcement user; certified law enforcement prescription drug diversion investigator. Access is granted after completion of
certified training by the investigator and his/her agency head.

3
Introduction
Act 304 of 2011 authorized the Arkansas Prescription Drug Monitoring Program
(PMP).
Arkansas law states that each dispenser shall submit, by electronic means, information regarding each prescription dispensed for a controlled substance. Each time a controlled substance is dispensed to an individual, the dispenser shall submit the information required by Arkansas law to the central repository weekly for the previous week, Sunday through Saturday.
The Arkansas Department of Health (ADH) shall establish and maintain procedures to ensure that
the privacy, confidentiality, and security of patient information collected, recorded, transmitted, and
maintained is not disclosed except as provided in Act 304.
The goals of the PMP:
To enhance patient care by providing prescription monitoring information that will ensure
legitimate use of controlled substances in health care.
To help curtail the misuse and abuse of controlled substances.
To assist in combating illegal trade in and diversion of controlled substances.
To enable access to prescription information by practitioners, law enforcement agents, and other
authorized individuals and agencies.
The number of authorized PMP users increased between January and December 2015 (Table 1).
PMP User Type Jan 2015 Dec 2015 Percent Change
Physician 1895 2209 17%
Osteopathic Physician 151 175 16%
Podiatrist 20 24 20%
Physician Assistant 127 153 20%
Advanced Practice Nurse 696 944 36%
Optometrist 4 10 150%
Dentist 323 381 18%
Veterinarian 9 14 56%
Pharmacist 1897 2187 15%
Delegate 0 129 129%
Law Enforcement 44 71 61%
Licensing Board 4 4 0%
TOTALS 5170 6301 22%
Table 1: Number of Authorized Users of the Arkansas Prescription Monitoring Program Database by Type, Arkansas, 2015

4
Figure 1: Number of Queries to the Prescription Monitoring Program Database by Prescribers
and Pharmacists — Arkansas, January—December, 2015
Figure 2: Number of Monthly Queries by Licensing Boards and Law Enforcement
(Jan to Dec 2015)
Licensing board and law enforcement queries have fluctuated over time and are a small number of
the total queries made to the PMP. (Figure 2).
Database Access
Querying the Arkansas PMP for controlled substance history reports provides the user with data to
make more informed decisions. The total number of PMP queries increased steadily over 2015
(Figure 1). Queries made by prescribers drove most of the increases seen since January, 2015.

5
Interstate Data Sharing
ACT 304 authorizes the Arkansas PMP to share controlled substance prescription data with other
states. Most states begin the program by sharing data with neighboring or border states. Arkansas
shares data with 16 other states including four of our border states; Oklahoma, Louisiana,
Tennessee, and Mississippi. Texas has recently passed legislation allowing them to share data with
other states. Missouri has not passed PMP legislation and therefore does not have a PMP.
The Red States in Figure 3 are the states with which Arkansas currently shares data. The goal is for
all states and territories to share data by 2020. State laws that bar or restrict data sharing must
change in order to reach the goal.
Figure 3: States that Share Controlled Substance Prescription Data with Arkansas,
December, 2015

6
The total number of doses of controlled substances dispensed to “doctor shoppers” (recipients visiting
seven or more physicians and seven or more pharmacies in 90 days) decreased in 2015 (Figure 5).
Prescription Data
Monitoring “doctor shopping” (visiting multiple prescribers and multiple pharmacies) by recipients is a
key way to evaluate the effectiveness of a prescription monitoring program. The Arkansas PMP has
made progress in reducing the number of “doctor shoppers” in Arkansas. The number of recipients
visiting seven (7) or more physicians and seven (7) or more pharmacies in a 90-day period.
Figure 4: Controlled Substance Recipients Seeing Seven (7) or More Physicians and Seven
(7) or More Pharmacies in a 90-day Period — Arkansas, January 2014—December 2015
Figure 5: Quantity of Doses Dispensed to 7 X 7 “Doctor Shoppers” — Arkansas, January
2014—December 2015

7
Morphine Equivalent Dose (MED)
Potency varies among the different opioids. In order to standardize comparison of opioid potency,
morphine equivalent dose is used. Morphine equivalent dose is the dose of a particular opioid that
is equal to that of morphine. It is calculated as follows:
MED = Opioid dosage x quantity x conversion factor / days supply
For example, a recipient with a prescription for 90 tablets of oxycodone 30 mg three times a day is
receiving a MED = 135 mg per day.
Risk of opioid overdose and death has been shown to increase at doses above 100 MED per day
(CDC Guideline for Prescribing Opioids for Chronic Pain-US, 2016, MMWR, Vol. 65, March 15,
2016).
Tracking the number of individuals that receive a daily MED >100 mg/day is a valuable indicator
of opioid prescribing practice change. Figure 6 below shows a positive change in risky opioid
prescribing in Arkansas.
OPIOID CONVERSION FACTOR
Fentanyl 2.4
Hydrocodone 1
Oxycodone 1.5
Figure 6: Adult Recipients of >100 Morphine Equivalent Doses, Arkansas, January 2015—
December 2015
Table 2: Example of Opioid Conversion to Morphine Equivalent Dose (MED)
8
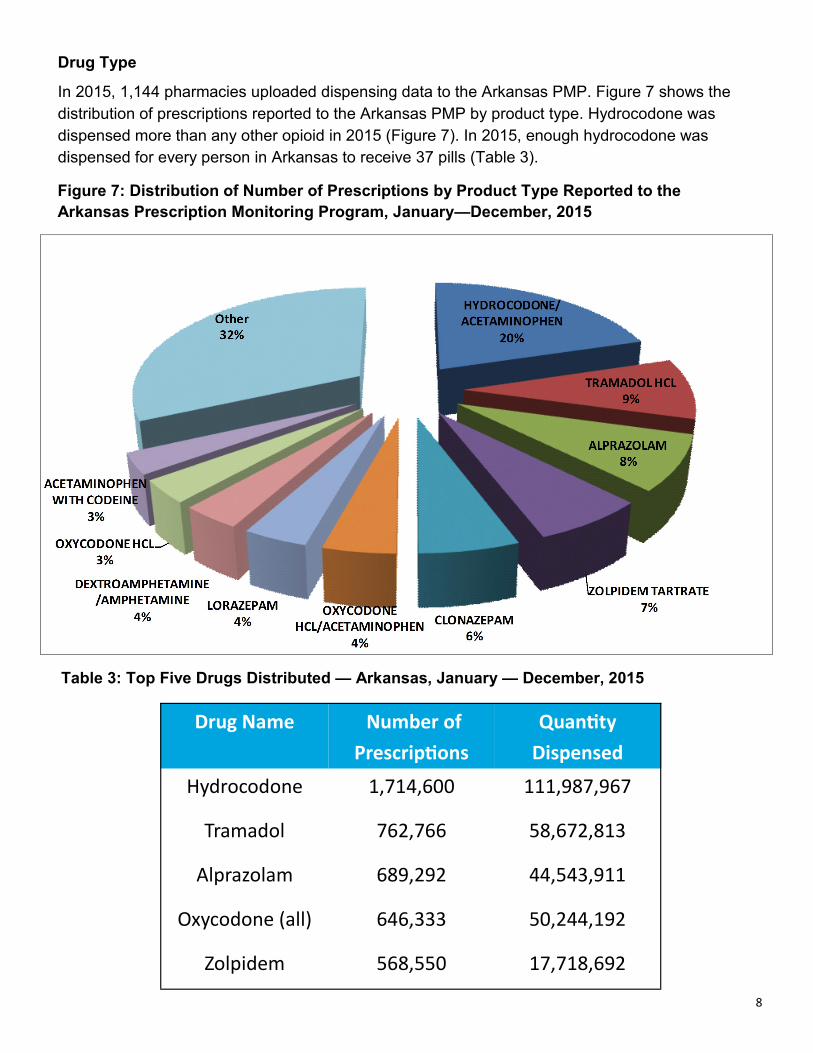
Drug Type
In 2015, 1,144 pharmacies uploaded dispensing data to the Arkansas PMP. Figure 7 shows the
distribution of prescriptions reported to the Arkansas PMP by product type. Hydrocodone was
dispensed more than any other opioid in 2015 (Figure 7). In 2015, enough hydrocodone was
dispensed for every person in Arkansas to receive 37 pills (Table 3).
Figure 7: Distribution of Number of Prescriptions by Product Type Reported to the
Arkansas Prescription Monitoring Program, January—December, 2015
Table 3: Top Five Drugs Distributed — Arkansas, January — December, 2015
Drug Name Number of
Prescriptions
Quantity
Dispensed
Hydrocodone 1,714,600 111,987,967
Tramadol 762,766 58,672,813
Alprazolam 689,292 44,543,911
Oxycodone (all) 646,333 50,244,192
Zolpidem 568,550 17,718,692

9
Geographic Distribution
The amount and type of prescription opiates dispensed in Arkansas varies widely by county.
Hydrocodone is the most dispensed prescription opiate in the state. Rates of hydrocodone use vary
from 20 doses per capita in Lincoln County to 65 doses per capita in Pike County (Figure 8). The
potential also exists for oxycodone to be misused or diverted because of its potency and popularity.
Like hydrocodone, oxycodone use varies by county (Figure 9). Oxymorphone is a powerful opiate
painkiller that has a high potential for abuse. Pockets of high use are scattered throughout Arkansas
(Figure 10). Buprenorphine is used to treat opiate addiction. Buprenorphine use is concentrated in
central Arkansas (Figure 11). A complete set of maps showing county-level rates of prescription drug
use is available at http://www.arkansaspmp.com/
Figure 8: Hydrocodone Doses
Dispensed per Capita, Arkansas, 2015
Figure 9: Oxycodone Doses
Dispensed per Capita, Arkansas, 2015
Figure 10: Oxymorphone Doses
Dispensed per Capita, Arkansas, 2015
Figure 11: Buprenorphine Doses
Dispensed per Capita, Arkansas, 2015

10
Program Contacts:
Denise Robertson, Program Administrator,
501-683-3960
Kelly Kendall, Program Administrative Specialist,
501-661-2332
Jonathan Aram, Program Epidemiologist,
501-280-4398
Arkansas PMP Contact Information:
Arkansas Department of Health
Arkansas Prescription Monitoring Program
4815 West Markham Street, Slot 25
Little Rock, AR 72205
Phone: 501-683-3960
Arkansas PMP Website:
http://www.arkansaspmp.com/