arizona climate summary - arizona state climate office climate summary april 2016 ... the system...
TRANSCRIPT
1
Arizona Climate Summary April 2016
Summary of conditions for March 2016
March 2016 Temperature and Precipitation Summary
March 1st – 15th: March began with a high pressure ridge off southern California and a low pressure system off the
northern California coast. The ridge brought warm temperatures to Arizona, with highs in the mid to upper 80s in the
southwest deserts. Over the next 5 days the ridge slowly broke down, lowering temperatures and allowing the low
pressure system to advance down the California coast. The system brought rain and snow to northern California and
some rainfall to southern California. Arizona finally received some precipitation on the 6th through the 9th. Totals
included 0.19” at Bisbee-Douglas, 0.12” at Davis Monthan AFB, 0.11” at Elgin, 0.22” at Flagstaff, 0.20” at the Grand
Canyon, 0.06” at Kingman, 0.18” at Nogales, 0.03” at Page, 0.70” at Prescott, 0.11” at Tucson, 0.02” at Window Rock,
0.02 at Alpine, 0.41” at Coronado National Monument, 0.30” at Douglas, 0.19” at Seligman, and 0.12” at Williams.
Phoenix and most of central Arizona had no precipitation. The storm was relatively warm and no snow was reported in
the state. On the 10th high pressure briefly returned and on the 11th and 12th another low pressure system moved through
across northern Arizona, bringing 0.3” of snow to Bellemont near Flagstaff, and rainfall amounts from 0.02” to 0.21”
across northern Arizona. High temperatures dropped from the 90s on the 10th and 11th to the low 80s in the southwest
deserts during the storm. The coldest nighttime temperatures at the higher elevations fell to the mid-teens. Bellemont
had 15oF on the 13th. The 14th was dry across the state, but another system passed through quickly on the 15th dropping
0.32” of rain on Canyon de Chelly.
March 16th – 31st: The warming trend that began on the 13th continued through the 22nd. High temperatures reached the
90s in the southwest deserts and the mid 60s at the higher elevations. Nighttime temperatures ranged from near 60oF in
the deserts to near 20oF at the higher elevations. On the 23rd another cold front passed through Utah and Colorado,
dropping our temperatures slightly, but no additional precipitation fell in Arizona until the 29th. Temperatures remained
in the upper 80s in the deserts and the upper 50s across northern and eastern Arizona. By the 29th another low pressure
system crossed Utah, Colorado and northern Arizona dropping light precipitation across the northern plateau. Only 0.1”
of snow was reported at Bellemont. It was an extremely dry March for the state, and much warmer than normal.
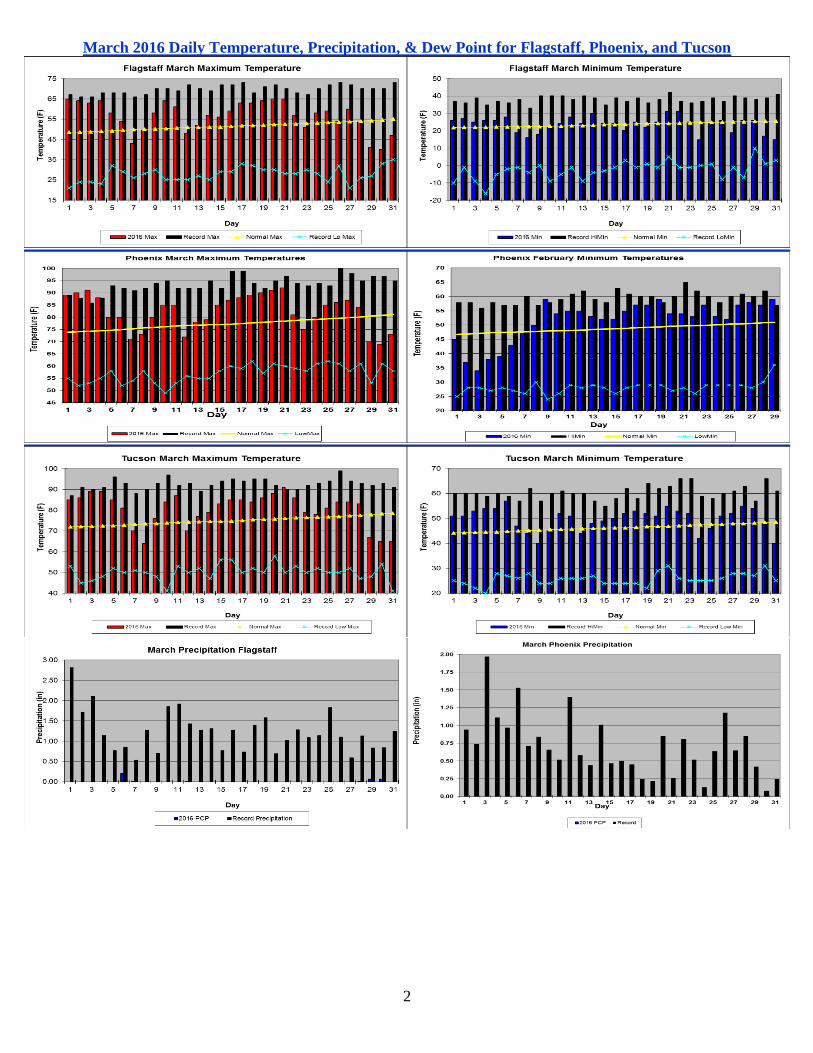
In This Issue: Overview of March, graphs of the March daily maximum and minimum temperatures, precipitation,
mean daily dew points for Flagstaff, Phoenix, and Tucson; March climate statistics, maps of mean monthly maximum
and minimum temperatures, precipitation, dew points, wind speeds for March; and graphs of the mean March
temperature and precipitation for the period of record for Tucson, Phoenix, and Flagstaff, graphs of the cumulative
precipitation for the calendar year for Flagstaff, Phoenix, and Tucson. Climate calendars for Flagstaff, Phoenix, Tucson,
Prescott, Winslow and Yuma, including daily and monthly normals and extremes, for each month of the year, can be
downloaded directly from the State Climate website. See p.19 of this report for calendar abbreviations.
Data are preliminary and are from the National Weather Service Forecast Offices in Flagstaff, Phoenix and Tucson.
**Note: The discrepancy between the Statewide Temperature and Precipitation values for Phoenix, Flagstaff and
Tucson and the daily values in their graphs are due to the reporting times. Statewide Temperature and Precipitation
values are taken at 5pm, while official daily records at the airports are taken from Midnight to Midnight.
Dr. Nancy J. Selover, State Climatologist
http://azclimate.asu.edu 480-965-6265
Edited by Nancy J. Selover & Kira Frost
© 2016 Arizona State Climate Office
2
March 2016 Daily Temperature, Precipitation, & Dew Point for Flagstaff, Phoenix, and Tucson

3
4
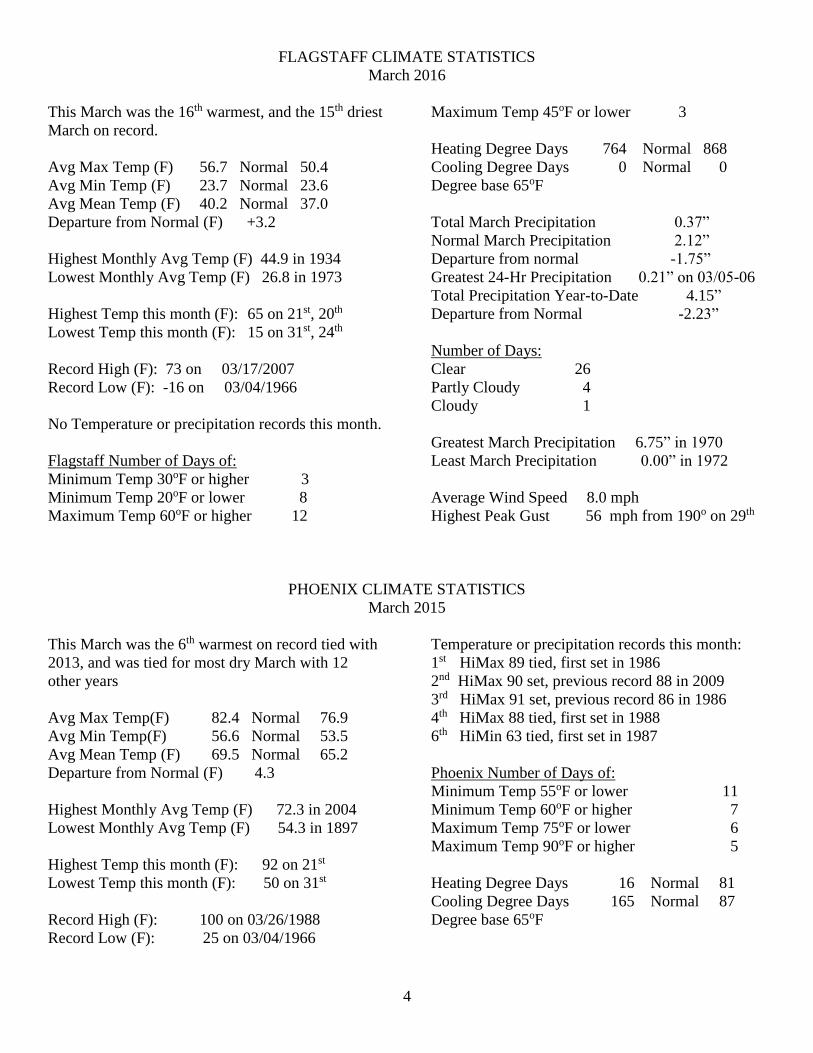
FLAGSTAFF CLIMATE STATISTICS
March 2016
This March was the 16th warmest, and the 15th driest
March on record.
Avg Max Temp (F) 56.7 Normal 50.4
Avg Min Temp (F) 23.7 Normal 23.6
Avg Mean Temp (F) 40.2 Normal 37.0
Departure from Normal (F) +3.2
Highest Monthly Avg Temp (F) 44.9 in 1934
Lowest Monthly Avg Temp (F) 26.8 in 1973
Highest Temp this month (F): 65 on 21st, 20th
Lowest Temp this month (F): 15 on 31st, 24th
Record High (F): 73 on 03/17/2007
Record Low (F): -16 on 03/04/1966
No Temperature or precipitation records this month.
Flagstaff Number of Days of:
Minimum Temp 30oF or higher 3
Minimum Temp 20oF or lower 8
Maximum Temp 60oF or higher 12
Maximum Temp 45oF or lower 3
Heating Degree Days 764 Normal 868
Cooling Degree Days 0 Normal 0
Degree base 65oF
Total March Precipitation 0.37”
Normal March Precipitation 2.12”
Departure from normal -1.75”
Greatest 24-Hr Precipitation 0.21” on 03/05-06
Total Precipitation Year-to-Date 4.15”
Departure from Normal -2.23”
Number of Days:
Clear 26
Partly Cloudy 4
Cloudy 1
Greatest March Precipitation 6.75” in 1970
Least March Precipitation 0.00” in 1972
Average Wind Speed 8.0 mph
Highest Peak Gust 56 mph from 190o on 29th
PHOENIX CLIMATE STATISTICS
March 2015
This March was the 6th warmest on record tied with
2013, and was tied for most dry March with 12
other years
Avg Max Temp(F) 82.4 Normal 76.9
Avg Min Temp(F) 56.6 Normal 53.5
Avg Mean Temp (F) 69.5 Normal 65.2
Departure from Normal (F) 4.3
Highest Monthly Avg Temp (F) 72.3 in 2004
Lowest Monthly Avg Temp (F) 54.3 in 1897
Highest Temp this month (F): 92 on 21st
Lowest Temp this month (F): 50 on 31st
Record High (F): 100 on 03/26/1988
Record Low (F): 25 on 03/04/1966
Temperature or precipitation records this month:
1st HiMax 89 tied, first set in 1986
2nd HiMax 90 set, previous record 88 in 2009
3rd HiMax 91 set, previous record 86 in 1986
4th HiMax 88 tied, first set in 1988
6th HiMin 63 tied, first set in 1987
Phoenix Number of Days of:
Minimum Temp 55oF or lower 11
Minimum Temp 60oF or higher 7
Maximum Temp 75oF or lower 6
Maximum Temp 90oF or higher 5
Heating Degree Days 16 Normal 81
Cooling Degree Days 165 Normal 87
Degree base 65oF
5
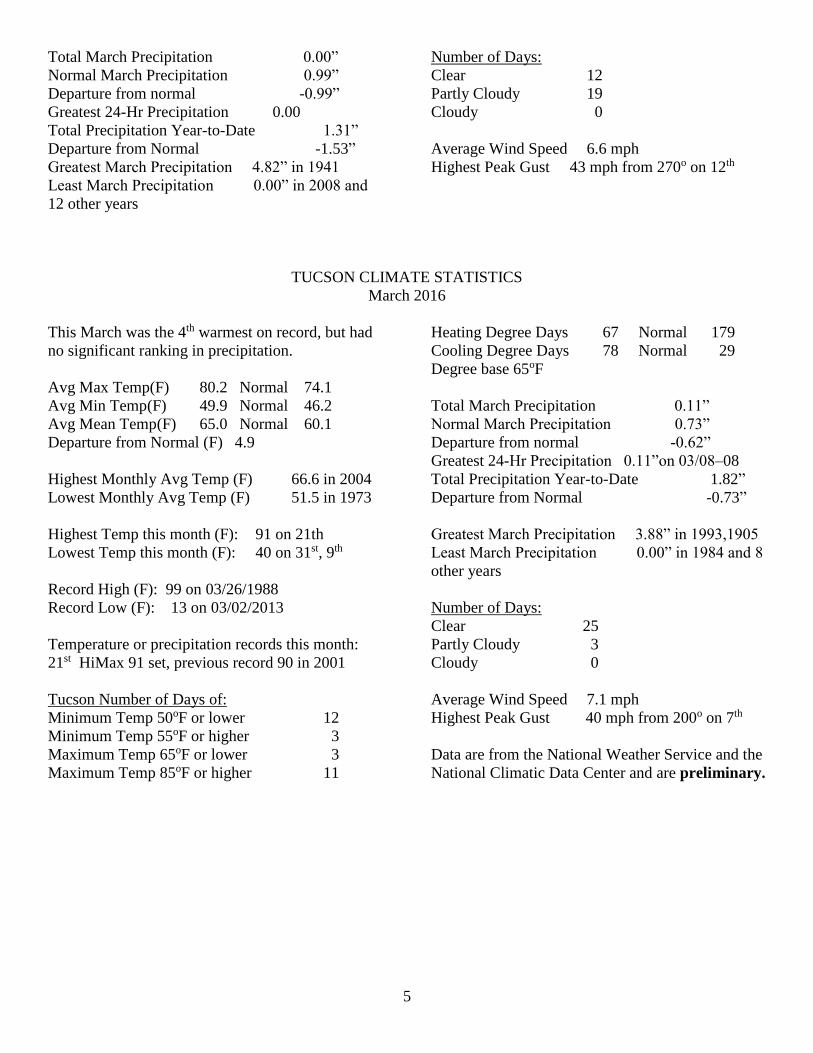
Total March Precipitation 0.00”
Normal March Precipitation 0.99”
Departure from normal -0.99”
Greatest 24-Hr Precipitation 0.00
Total Precipitation Year-to-Date 1.31”
Departure from Normal -1.53”
Greatest March Precipitation 4.82” in 1941
Least March Precipitation 0.00” in 2008 and
12 other years
Number of Days:
Clear 12
Partly Cloudy 19
Cloudy 0
Average Wind Speed 6.6 mph
Highest Peak Gust 43 mph from 270o on 12th
TUCSON CLIMATE STATISTICS
March 2016
This March was the 4th warmest on record, but had
no significant ranking in precipitation.
Avg Max Temp(F) 80.2 Normal 74.1
Avg Min Temp(F) 49.9 Normal 46.2
Avg Mean Temp(F) 65.0 Normal 60.1
Departure from Normal (F) 4.9
Highest Monthly Avg Temp (F) 66.6 in 2004
Lowest Monthly Avg Temp (F) 51.5 in 1973
Highest Temp this month (F): 91 on 21th
Lowest Temp this month (F): 40 on 31st, 9th
Record High (F): 99 on 03/26/1988
Record Low (F): 13 on 03/02/2013
Temperature or precipitation records this month:
21st HiMax 91 set, previous record 90 in 2001
Tucson Number of Days of:
Minimum Temp 50oF or lower 12
Minimum Temp 55oF or higher 3
Maximum Temp 65oF or lower 3
Maximum Temp 85oF or higher 11
Heating Degree Days 67 Normal 179
Cooling Degree Days 78 Normal 29
Degree base 65oF
Total March Precipitation 0.11”
Normal March Precipitation 0.73”
Departure from normal -0.62”
Greatest 24-Hr Precipitation 0.11”on 03/08–08
Total Precipitation Year-to-Date 1.82”
Departure from Normal -0.73”
Greatest March Precipitation 3.88” in 1993,1905
Least March Precipitation 0.00” in 1984 and 8
other years
Number of Days:
Clear 25
Partly Cloudy 3
Cloudy 0
Average Wind Speed 7.1 mph
Highest Peak Gust 40 mph from 200o on 7th
Data are from the National Weather Service and the
National Climatic Data Center and are preliminary.
6
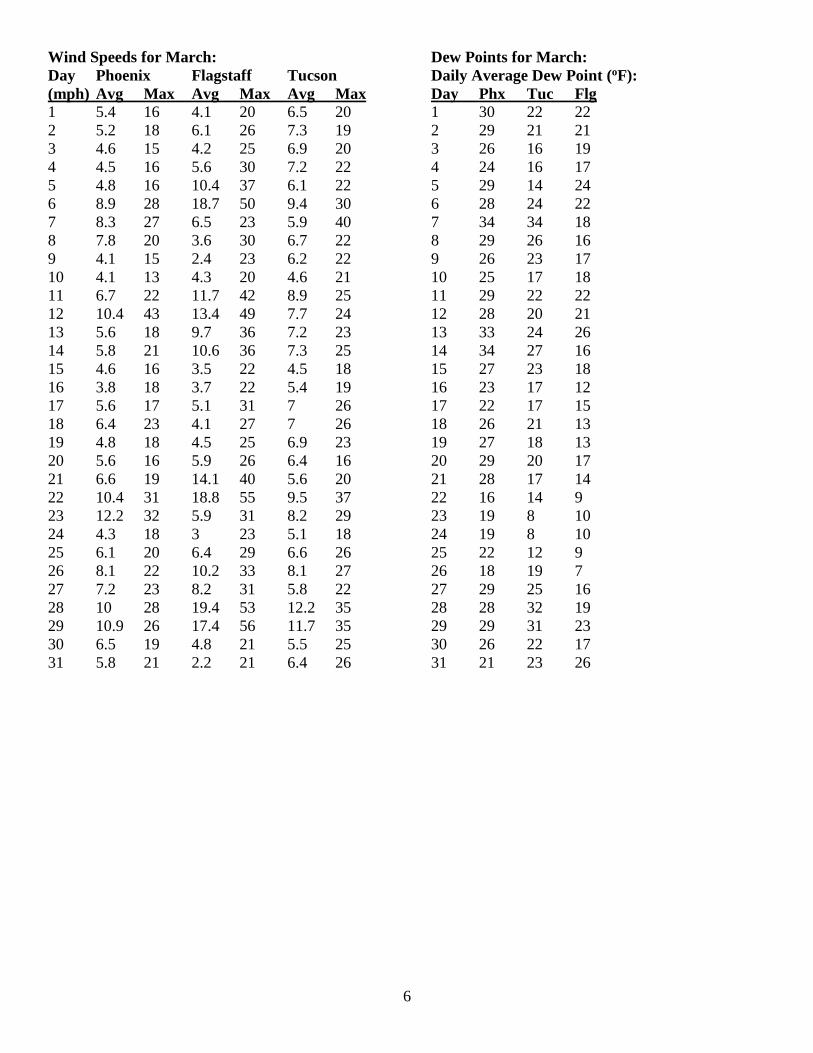
Wind Speeds for March:
Day Phoenix Flagstaff Tucson
(mph) Avg Max Avg Max Avg Max
1 5.4 16 4.1 20 6.5 20
2 5.2 18 6.1 26 7.3 19
3 4.6 15 4.2 25 6.9 20
4 4.5 16 5.6 30 7.2 22
5 4.8 16 10.4 37 6.1 22
6 8.9 28 18.7 50 9.4 30
7 8.3 27 6.5 23 5.9 40
8 7.8 20 3.6 30 6.7 22
9 4.1 15 2.4 23 6.2 22
10 4.1 13 4.3 20 4.6 21
11 6.7 22 11.7 42 8.9 25
12 10.4 43 13.4 49 7.7 24
13 5.6 18 9.7 36 7.2 23
14 5.8 21 10.6 36 7.3 25
15 4.6 16 3.5 22 4.5 18
16 3.8 18 3.7 22 5.4 19
17 5.6 17 5.1 31 7 26
18 6.4 23 4.1 27 7 26
19 4.8 18 4.5 25 6.9 23
20 5.6 16 5.9 26 6.4 16
21 6.6 19 14.1 40 5.6 20
22 10.4 31 18.8 55 9.5 37
23 12.2 32 5.9 31 8.2 29
24 4.3 18 3 23 5.1 18
25 6.1 20 6.4 29 6.6 26
26 8.1 22 10.2 33 8.1 27
27 7.2 23 8.2 31 5.8 22
28 10 28 19.4 53 12.2 35
29 10.9 26 17.4 56 11.7 35
30 6.5 19 4.8 21 5.5 25
31 5.8 21 2.2 21 6.4 26
Dew Points for March:
Daily Average Dew Point (oF):
Day Phx Tuc Flg
1 30 22 22
2 29 21 21
3 26 16 19
4 24 16 17
5 29 14 24
6 28 24 22
7 34 34 18
8 29 26 16
9 26 23 17
10 25 17 18
11 29 22 22
12 28 20 21
13 33 24 26
14 34 27 16
15 27 23 18
16 23 17 12
17 22 17 15
18 26 21 13
19 27 18 13
20 29 20 17
21 28 17 14
22 16 14 9
23 19 8 10
24 19 8 10
25 22 12 9
26 18 19 7
27 29 25 16
28 28 32 19
29 29 31 23
30 26 22 17
31 21 23 26
7
The
8
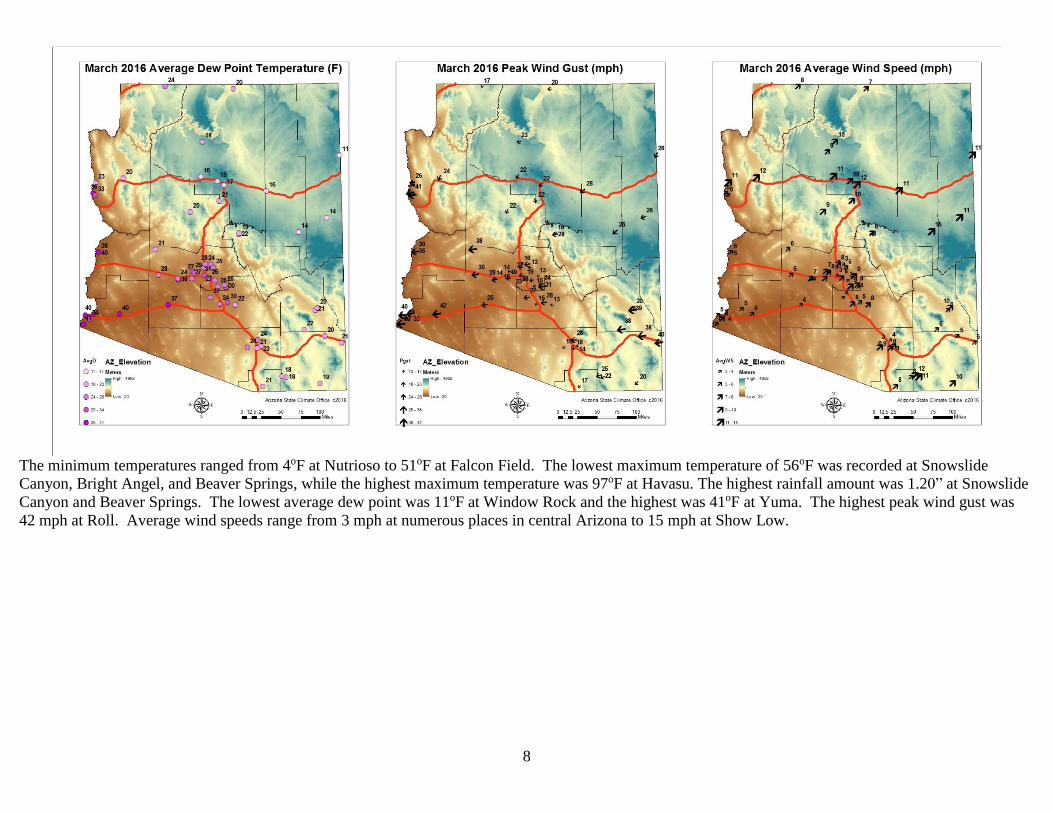
The minimum temperatures ranged from 4oF at Nutrioso to 51oF at Falcon Field. The lowest maximum temperature of 56oF was recorded at Snowslide
Canyon, Bright Angel, and Beaver Springs, while the highest maximum temperature was 97oF at Havasu. The highest rainfall amount was 1.20” at Snowslide
Canyon and Beaver Springs. The lowest average dew point was 11oF at Window Rock and the highest was 41oF at Yuma. The highest peak wind gust was
42 mph at Roll. Average wind speeds range from 3 mph at numerous places in central Arizona to 15 mph at Show Low.
9
T
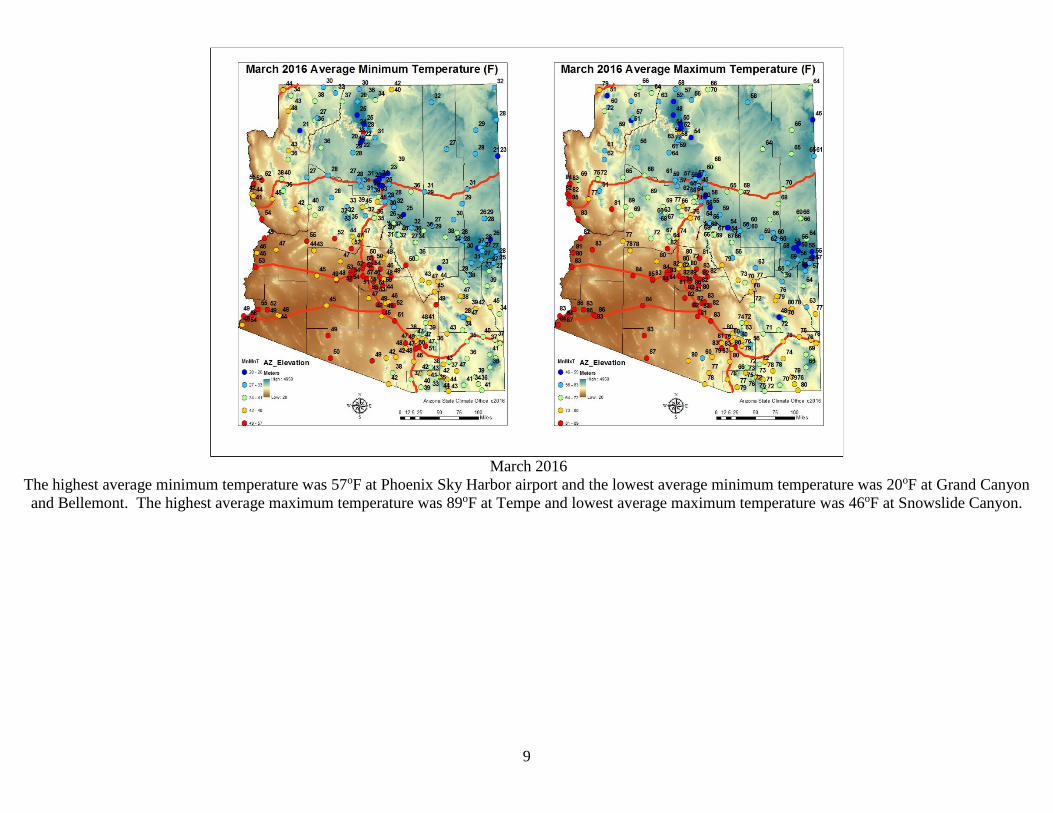
March 2016
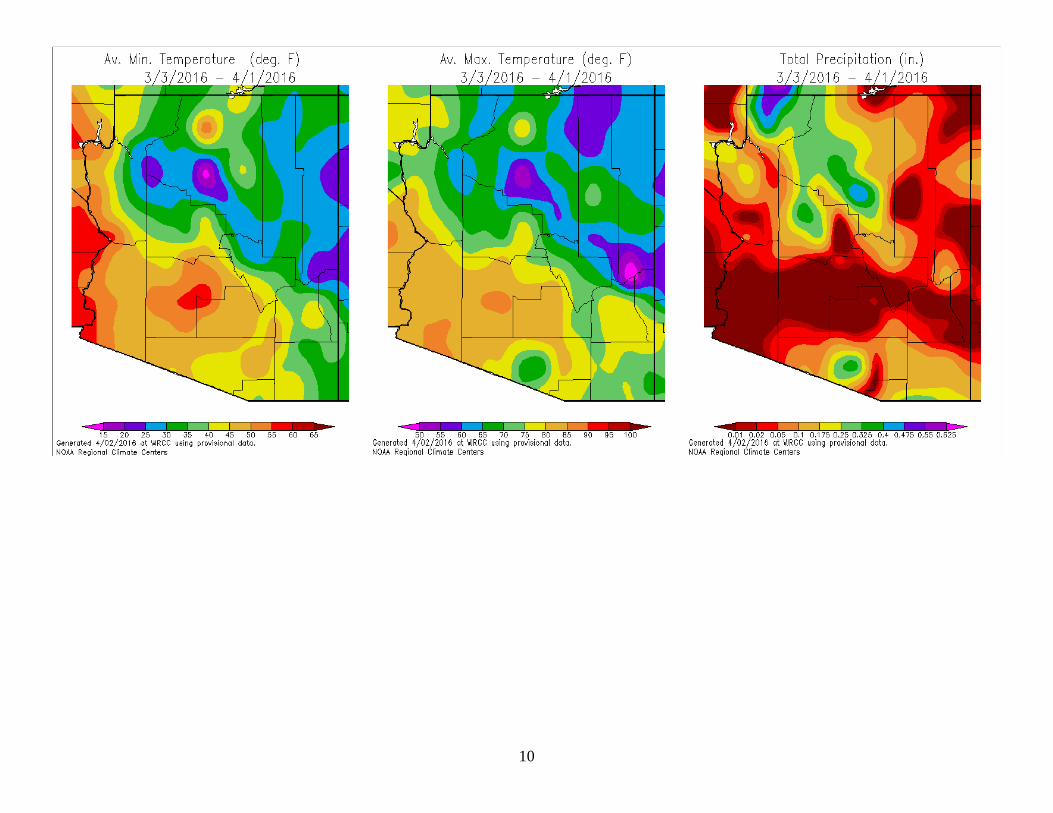
The highest average minimum temperature was 57oF at Phoenix Sky Harbor airport and the lowest average minimum temperature was 20oF at Grand Canyon
and Bellemont. The highest average maximum temperature was 89oF at Tempe and lowest average maximum temperature was 46oF at Snowslide Canyon.
10
11
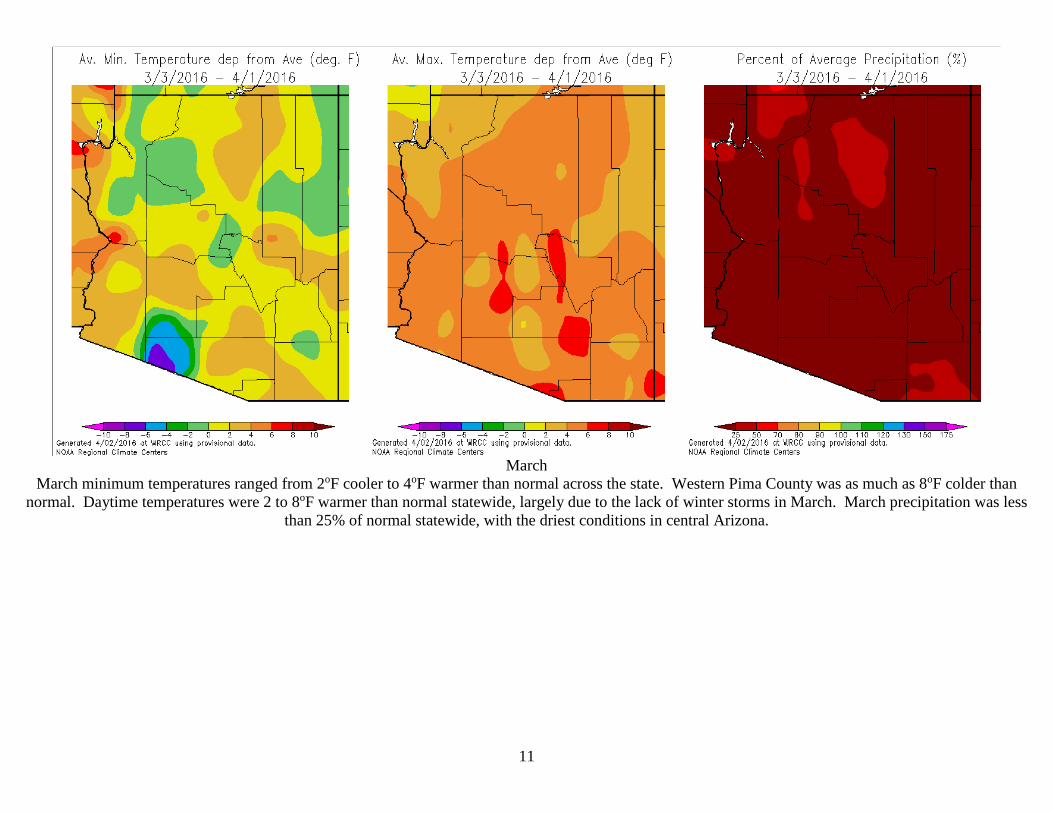
March
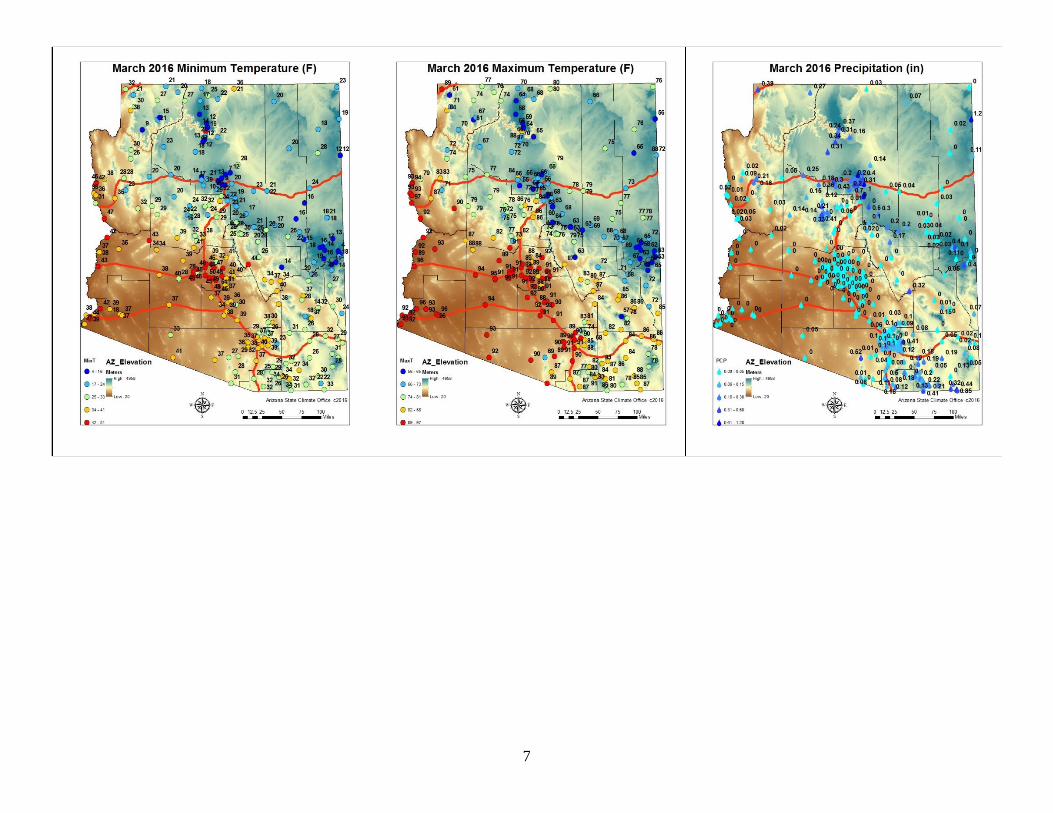
March minimum temperatures ranged from 2oF cooler to 4oF warmer than normal across the state. Western Pima County was as much as 8oF colder than
normal. Daytime temperatures were 2 to 8oF warmer than normal statewide, largely due to the lack of winter storms in March. March precipitation was less
than 25% of normal statewide, with the driest conditions in central Arizona.
12

13
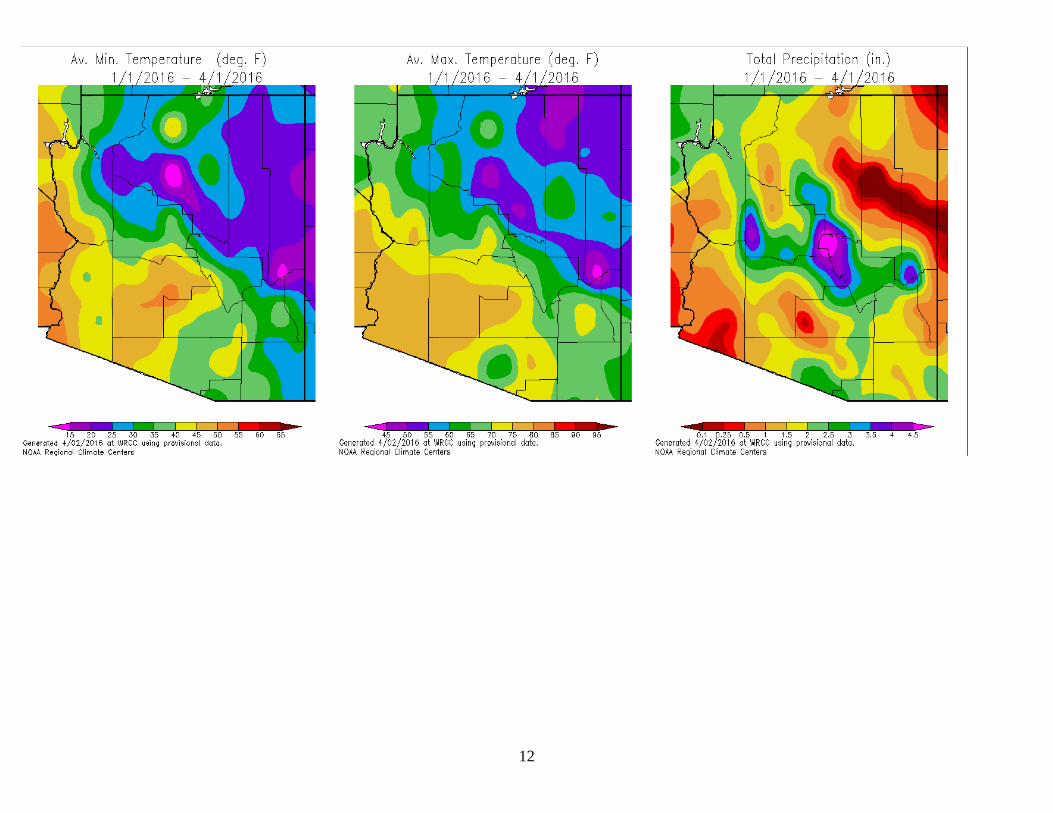
Calendar Year 2016
Calendar year minimum temperatures varied from 3oF warmer to 2oF colder than normal across Arizona. Gila and southern Mohave County saw temperatures
6oF warmer than normal, and western Pima County was 3oF colder than normal. Daytime temperatures were 2 to 6oF warmer than average statewide. Since
the end of January, the state has been much warmer than normal during the daytime. Precipitation is now below 70% of normal for central and southern
Arizona and below 50% of normal across the Colorado Plateau, as well as Yuma, southern Mohave and western Pinal counties.

14
15
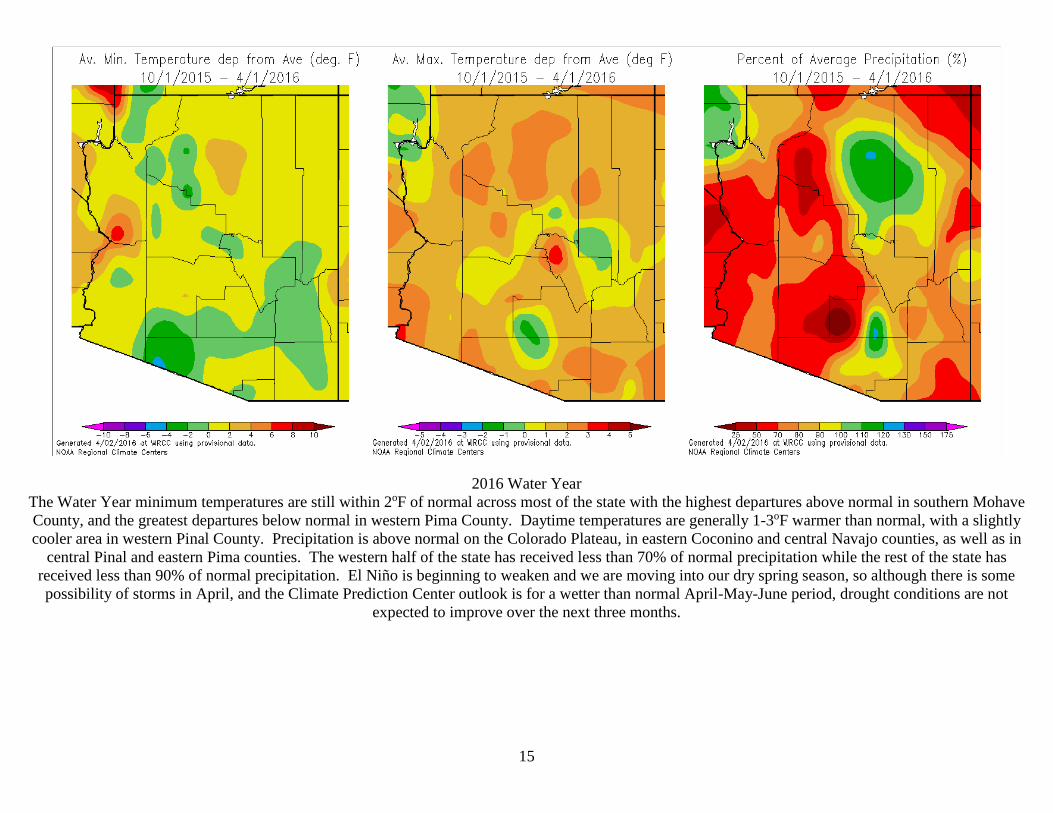
2016 Water Year
The Water Year minimum temperatures are still within 2oF of normal across most of the state with the highest departures above normal in southern Mohave
County, and the greatest departures below normal in western Pima County. Daytime temperatures are generally 1-3oF warmer than normal, with a slightly
cooler area in western Pinal County. Precipitation is above normal on the Colorado Plateau, in eastern Coconino and central Navajo counties, as well as in
central Pinal and eastern Pima counties. The western half of the state has received less than 70% of normal precipitation while the rest of the state has
received less than 90% of normal precipitation. El Niño is beginning to weaken and we are moving into our dry spring season, so although there is some
possibility of storms in April, and the Climate Prediction Center outlook is for a wetter than normal April-May-June period, drought conditions are not
expected to improve over the next three months.
16
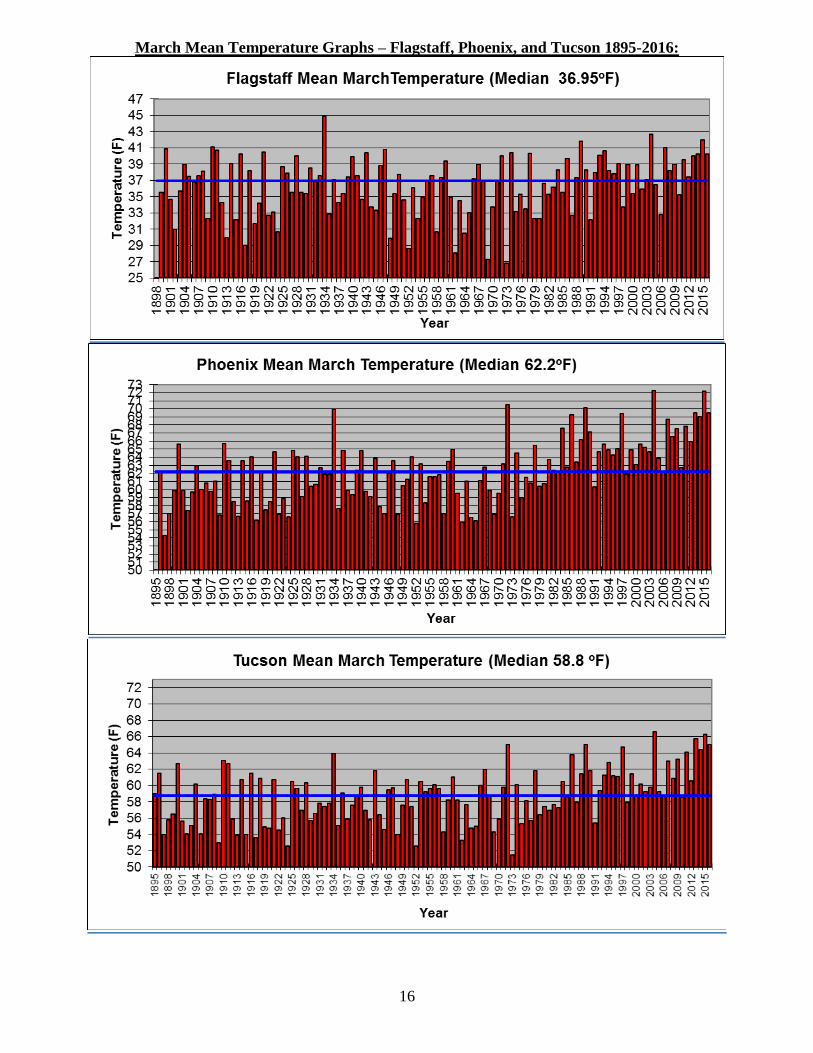
March Mean Temperature Graphs – Flagstaff, Phoenix, and Tucson 1895-2016:
17
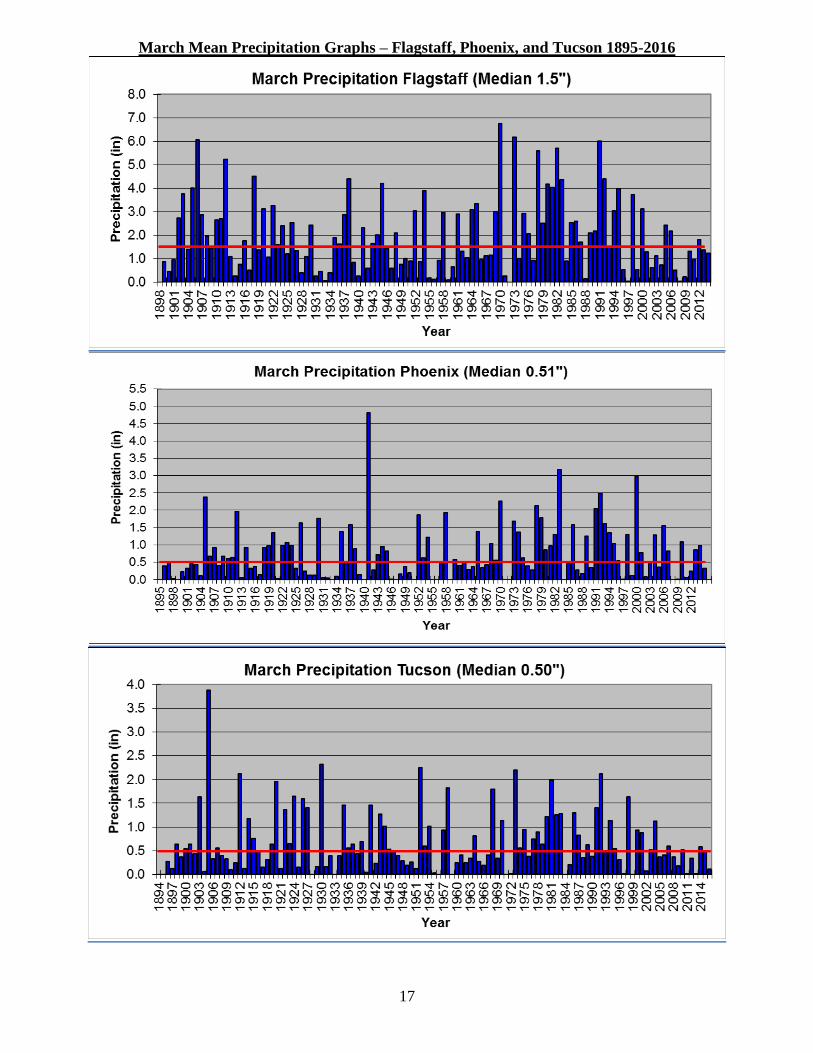
March Mean Precipitation Graphs – Flagstaff, Phoenix, and Tucson 1895-2016

18
2016 Cumulative Precipitation Graphs – Flagstaff, Phoenix and Tucson:
Flagstaff is 2.18” below normal, Tucson is just 0.71” below normal, and Phoenix is 1.58” below normal.

19
The downloadable normals and extremes calendars use the following abbreviations:
NORM = 30 year (1971-2000) average value (degrees Fahrenheit (F))
OBS = The temperature observation for that day this year
AVG = Average daily temperature
HI MAX = Highest maximum temperature for that day (F)
LO MAX = Lowest maximum temperature for that day (F)
LO MIN = Lowest minimum temperature for that day (F)
HI MIN = Highest minimum temperature for that day (F)
Mx PCP = Maximum precipitation for that day (inches)
Mx SNO = Maximum snowfall for that day (inches)