are you suprised ? - front page | world food...
TRANSCRIPT

Food Insecurity Atlas of Madhya Pradesh and Chhattisgarh
i
World Food Programme India
Draft / December 2000

Contents
Page NoForeword iExecutive summary ivList of maps viList of tables viiList of Box and Graphs viii
CHAPTER – I Analytical Framework 11.1 Objectives of the Study 21.2 The Study Plan 2
CHAPTER - II Methodology 32.0 Choice of Indicators 32.1 Rationale for the Choice of Indicators 42.2 Database for Building the Indicators 72.3 Making the Indicators Scale Free and Composition 132.4 Classification of the Districts 142.5 Limitations of the Data Base 14
CHAPTER – III Developmental Dynamics of Madhya Pradesh3.1 Food Availability in Madhya Pradesh 16
3.1a Physiography and climate affecting food production 163.1b Moisture availability in Madhya Pradesh 183.1c Food availability 20
3.1d Consumption pattern in Madhya Pradesh 22 3.2 Food Accessibility 22
3.2a Gender dimension of accessibility 243.3 Absorption and Status of Nutrition in Madhya Pradesh 253.4 Environmental Degradation and Food Insecurity 27
CHAPTER – IV Food Insecurity and Development Dynamics: An Inter District Analysis
4.1 Sustenance Insecurity 294.1a Population supported by cereal production 294.1b Seasonality in cereal production 304.1c Inadequacy of safety net systems 314.1d Composite sustenance insecurity index 32
ii

4.2 Disaster 334.2a Cattle & crop loss owing to natural disaster 334.2b Disaster proneness 344.2c Composite disaster vulnerability index 35
4.3 Deprivation 364.3a House holds below poverty line 364.3b Scheduled Caste population 374.3c Scheduled Tribe population. 384.3d Net migration 414.3e Illiteracy 434.3f Agricultural labourer 444.3g Percentage of working children 454.3h Composite deprivation index 47
4.4 Gender Inequality 484.4a Disparity in literacy 484.4b Disparity in infant mortality rate 494.4c Disparity in under 5 mortality rate 504.4d Sex ratio 514.4e Composite gender inequality index 52
4.5 Malnutrition and Mortality 534.5a Infant mortality rate 534.5b Under 5 mortality rate 554.4c Prevalence of malnutrition 564.5d Population supported by Anganwadi Center 574.5e Composite malnutrition and mortality index
4.5f Composite vulnerability index with all broad categories 58 59
CHAPTER – V Interdependency and Composite Vulnerability Scenario
60
5.1 An Analysis of the Interdependence of the Indicators 60 5.2 Identification of Core Indicators 62
CHAPTER –VI Household Level Coping Strategy6.1 Household Level Coping Strategy
64
64
iii
Annexures
Annexure I Data Source
66
Annexure II Additional Indicators 68Annexure III BibliographyAnnexure IV Tables
7173
iv
EXECUTIVE SUMMARY
Food insecurity in the state of Madhya Pradesh can be attributed to factors such as fluctuating
weather conditions often leading to severe droughts, undulating terrain with little or no capacity
for conserving soil moisture, steep slopes with high surface runoff, unavailability of drought
resistant variety of quality seeds coupled with unavailability of livelihood opportunities. The
Human development indicators such as literacy, health, and poverty reflected an all time low,
with the result that the state was labeled "Bimaru" along with the other states of Bihar, Rajasthan
and Uttar Pradesh. The inefficient public distribution system also added to the inadequacy and
uncertainty of food supply in Madhya Pradesh.
The objective of the present study, “Vulnerability Analysis and Mapping” is to identify the food
insecure areas and the cause behind this insecurity. This would help The World Food Programme
(WFP) to strategically locate contiguous areas of intervention for providing food assistance. The
study also helps in identifying clusters for the preparation of vulnerability profiles through
community level assessment, which is the second phase of the Vulnerability Analysis and
Mapping (VAM) project.
The Vulnerability Analysis and Mapping of Food Insecure areas of Madhya Pradesh, as the title
suggests, clearly involves identification and location of food insecure areas spatially. The
indicators chosen for the study directly or indirectly capture three basic aspects of food insecurity
namely food availability, accessibility and utilisation. For the computation of the vulnerability of
the community all the indicators were made unidirectional so that a higher value indicates higher
vulnerability. Thus, the sex ratio was calculated as males per 1,000 females.
This study not only analyses the secondary data but also looks into various articles and reports on
Madhya Pradesh, which give an insight into the actual food insecurity situation prevailing in the
state and tries to justify and supplement the findings of the secondary data analysis. It also tries
to analyse the developmental dynamics of Madhya Pradesh in comparison to the national
scenario.
v

The broad category of sustenance insecurity shows that the Chhattisgarh area is more vulnerable
compared to the western districts. However, safety net coverage is greater in the eastern tribal
districts.
The Nimar Plains and the southern part of the largest state of the country is perennially prone to
drought conditions and is more vulnerable to food insecurity as the standing crops wither owing
to long dry spells. The Central Narmada Valley and Chhattisgarh Plains are in a better position.
However, the cattle loss owing to natural disaster is not a common phenomenon in Madhya
Pradesh.
The study rightly recognises the tribal districts of the state to be the most deprived ones
characterised by a greater percentage of households that live below the poverty line, high
incidence of child labour, and low literacy rate. The Nimar Plains, Bastar Plateau, the Northern
Chhattisgarh hills, Bundelkhand and Satpura Hills are deprived compared to the northern Malwa
and Vindhya plateaus.
After measuring all the individual indicators, the broad categories were constructed which
projected five components of food insecurity: sustenance, disaster, deprivation, gender inequality
and malnutrition and mortality. These five broad categories were then clubbed together to reflect
the composite food insecurity scenario of Madhya Pradesh.
Interdependency of the indicators was analysed to identify the most critical indicator causing
food insecurity in the state. The also tries to project the indigenous coping mechanism of
households during lean months and crisis months.
vi

List of Maps
(I) Location Map of Madhya Pradesh A) Index MapB) Block Map of Madhya PradeshC) Agro-Climatic Zones of Madhya Pradesh
1. Population Supported by Cereal Production2. Seasonality in Cereal Production3. Inadequacy of Safety Net System4. Sustenance Insecurity Index5. Cattle and Crop Loss due to Disaster6. Disaster Proneness 7. Disaster Index8,8A. Households below Poverty Line (District and Block Map)9,9A. Distribution of Scheduled Caste Population (District and Block Map)10,10A. Distribution of Scheduled Tribe Population (District and Block Map)11. Net Migration 12,12A. Illiteracy Rate (District and Block Map)13,13A. Concentration of Agricultural Labourer (District and Block Map)14. Working Children 15. Deprivation Index16,16A. Gender Disparity in Literacy (District and Block Map)17. Gender Disparity in Infant Morality Rate18. Gender Disparity in under 5 Morality Rate19. Sex Ratio20. Gender Inequality Index21. Infant Mortality Rate22. Under 5 Mortality Rate23. Prevalence of Malnutrition among under 5 Years24. Population supported by Anganwadi Centre25. Mortality and Malnutrition Index26. Composite Vulnerability Index with all Broad Categories27. Composite Vulnerability Index with Selected Indicators
vii
List of Tables
1A) Production and area under cereals (1993-94 to 1997-98)1B) Food availability index with ICMR base 1C) Allotment and distribution of food grains in Madhya Pradesh1Di) State - wise calorie intake1Dii) Percentage of malnourished children2) Population supported per 100 quintals of cereal production (1993-94 to 1997-983) Seasonality of cereal production in thousand tonnes (1997-98)4) Inadequacy of safety net system5) Composite sustenance score6) Cattle and crop loss due to disaster7) Disaster proneness7A) Drought prone blocks8) Composite disaster proneness9) Households below poverty line 9A) District-wise BPL census-199710 Distribution of scheduled caste population10A, 11A, 13A, 14A and 17A: Block Level data11) Distribution of scheduled tribe population12) Net migration13) Illiteracy rate14) Percentage of agricultural labourers15) Percentage of working children 15A) Percentage of male - female working children16) Composite deprivation index17) Disparity in literacy18) Gender disparity in infant mortality rate 199119) Gender disparity in under 5 mortality rate 199120) Sex ratio of 0-16 age group (1991)21) Composite gender disparity index22) Infant mortality rate22A) Trend of infant mortality rate in Madhya Pradesh23) Under 5 mortality rate 199124) Prevalence of malnutrition25) Population supported by anganwadi centre26) Composite mortality and malnutrition index27) Composite vulnerability index28) Co-relation matrix29) Composite vulnerability index with selected indicators.
viii

List of Box and Graphs
BoxBox 1. List of indicators
Box 2. List of newly formed districts
Box 3. Agro-climatic regions of Madhya Pradesh
Box 4. Forest Area
GraphsGraph 1. Change in area and production under cereal - Madhya Pradesh
Graph 2. Crop wise production in Madhya Pradesh
Graph 3. Allotment and distribution of foodgrains in Madhya Pradesh (1993-1997)
Graph 4. Cereal production in Madhya Pradesh (1993-94 to 1998-99)
Graph 5. Trend of infant mortality rate in Madhya Pradesh.
ix

EXECUTIVE SUMMARY
Food insecurity in the state of Madhya Pradesh can be attributed to factors such as fluctuating
weather conditions often leading to severe droughts, undulating terrain with little or no capacity
for conserving soil moisture, steep slopes with high surface runoff, unavailability of drought
resistant variety of quality seeds coupled with unavailability of livelihood opportunities. The
Human development indicators such as literacy, health, and poverty reflected an all time low,
with the result that the state was labeled "Bimaru" along with the other states of Bihar, Rajasthan
and Uttar Pradesh. The inefficient public distribution system also added to the inadequacy and
uncertainty of food supply in Madhya Pradesh.
The objective of the present study, “Vulnerability Analysis and Mapping” is to identify the food
insecure areas and the cause behind this insecurity. This would help The World Food Programme
(WFP) to strategically locate contiguous areas of intervention for providing food assistance. The
study also helps in identifying clusters for the preparation of vulnerability profiles through
community level assessment, which is the second phase of the Vulnerability Analysis and
Mapping (VAM) project.
The Vulnerability Analysis and Mapping of Food Insecure areas of Madhya Pradesh, as the title
suggests, clearly involves identification and location of food insecure areas spatially. The
indicators chosen for the study directly or indirectly capture three basic aspects of food insecurity
namely food availability, accessibility and utilisation. For the computation of the vulnerability of
the community all the indicators were made unidirectional so that a higher value indicates higher
vulnerability. Thus, the sex ratio was calculated as males per 1,000 females.
This study not only analyses the secondary data but also looks into various articles and reports on
Madhya Pradesh, which give an insight into the actual food insecurity situation prevailing in the
state and tries to justify and supplement the findings of the secondary data analysis. It also tries
to analyse the developmental dynamics of Madhya Pradesh in comparison to the national
scenario.
10

The broad category of sustenance insecurity shows that the Chhattisgarh area is more vulnerable
compared to the western districts. However, safety net coverage is greater in the eastern tribal
districts.
The Nimar Plains and the southern part of the largest state of the country is perennially prone to
drought conditions and is more vulnerable to food insecurity as the standing crops wither owing
to long dry spells. The Central Narmada Valley and Chhattisgarh Plains are in a better position.
However, the cattle loss owing to natural disaster is not a common phenomenon in Madhya
Pradesh.
The study rightly recognises the tribal districts of the state to be the most deprived ones
characterised by a greater percentage of households that live below the poverty line, high
incidence of child labour, and low literacy rate. The Nimar Plains, Bastar Plateau, the Northern
Chhattisgarh hills, Bundelkhand and Satpura Hills are deprived compared to the northern Malwa
and Vindhya plateaus.
After measuring all the individual indicators, the broad categories were constructed which
projected five components of food insecurity: sustenance, disaster, deprivation, gender inequality
and malnutrition and mortality. These five broad categories were then clubbed together to reflect
the composite food insecurity scenario of Madhya Pradesh.
Interdependency of the indicators was analysed to identify the most critical indicator causing
food insecurity in the state. The also tries to project the indigenous coping mechanism of
households during lean months and crisis months.
11
Chapter-I
ANALYTICAL FRAMEWORK
Food insecurity is the lack of access to enough food. There are two kinds of food insecurity:
chronic and transitory. Chronic food insecurity is a continuously inadequate diet caused by the
inability to acquire food. It affects households that persistently lack the ability either to buy
enough food or to produce their own. Transitory food insecurity is a temporary decline in a
household's access to enough food. It results from instability in food prices, food production
household incomes and, in its worst form, it produces famine.
India has the largest number of food-insecure people in the world. About 40 per cent of the
people in India live in chronic poverty with extremely limited access to food. With the
population crossing the billion mark, India faces a daunting challenge of maintaining food
security. In India, the most vulnerable to malnutrition are those people who live in states prone to
natural disasters, and in areas where there is rapid degradation of natural resources and rural
areas that have limited access to mainstream development or food from the public distribution
system.
Since its inception the World Food Programme, is keen to provide the most appropriate
interventions to enhance food security of the poorest. WFP uses food to enable those caught in
the hunger trap to access the developmental initiatives. It also strives to enable households,
which can no longer depend on the natural resources for their food security, to make a shift to
more sustainable livelihoods.
Presently, the focus of assistance of WFP is directed towards poor children and women to meet
their special nutritional and health needs and towards the scheduled castes and tribes who depend
upon degraded natural resources for their food security.
The objective of halving the number of people who do not have adequate access to food can be
met through a strategic approach. For this WFP needs to: (a) accurately identify food insecure
areas and hungry populations, (b) design food aid interventions that effectively address the needs
of these people, and (c) improve the assistance of food to them
12

1.1 OBJECTIVES OF THE STUDY
The Vulnerability Analysis and Mapping (VAM) Unit allows WFP to improve the effectiveness
of its programme by having a better understanding of the nature and the structure of food
security and vulnerability to food insecurity. It would also help the country office in decision
making and effective monitoring.
The maps prepared through of VAM would serve as an advocacy tool to highlight the deprived
persons, deprived locations and deprived situations. The composite food insecurity map for a
region would help in identifying vulnerable districts so that WFP's attention can be focused in
those districts and on people therein.
The objective of the study is to assess the current vulnerability of the blocks/districts of Madhya
Pradesh on the basis of 20 individual indicators as well as on the basis of the five broad
categories of indicators.
The map generated through this exercise would depict the relative level of food insecurity among
the different blocks/districts in the state of Madhya Pradesh where WFP provides assistance.
These maps will be used by WFP for programme formulation, decision making and monitoring.
1.2 THE STUDY PLAN
The study clearly involves three tasks. The first task includes the following:
a) Collection of secondary data from the state head quarters and corresponding
nodal departments.
b) Overview of relevant literature and identification of indicators
c) Choice of suitable methods for aggregation of indicators, and
c) Preparation of the vulnerability index
The second task involves thematic presentation of the information compiled.
The third and final task is to analyse the data and maps and to interpret the emerging scenario
with the help of the relevant literature.
13
Chapter-II
METHODOLOGY
2.0 CHOICE OF INDICATORS
The 20 indicators chosen for the study under five broad categories are as follows: Box 1: List of indicators.
Broad Categories Individual IndicatorsSustenance Insecurity 1. Population supported by cereal production.
2. Seasonality in cereal production.3. Inadequacy of safety net system.
Disasters 4. Cattle and crop loss index5. Disaster proneness
Deprivation 6. Population below poverty line7. Scheduled caste population index 8. Scheduled tribe population index9. Net migration index10. Illiteracy index11. Agricultural labourer index12. Working children index
Gender Inequality 13. Gender disparity in literacy14. Gender disparity in infant mortality rate15. Gender disparity in under 5 mortality rate16. Sex ratio
Malnutrition 17. Infant mortality rate (IMR)& Mortality 18. Under 5 mortality rate (CMR)
19. Prevalence of malnutrition20. Population supported by anganwadi centre
The time series and latest data for computation for all the indicators has been collected mainly
from secondary sources available primarily from the Census Report, Agricultural Statistics,
Economic Survey, and reports from relevant departments of the Government of Madhya Pradesh.
A survey of literature has been conducted to support and supplement the computed data for all
the indicators and related issues.
14

2.1 RATIONALE FOR THE CHOICE OF INDICATORS
In an interdependent socio-economic structure, it is difficult to identify the indicators that are
either the causes or the effects of food insecurity. Within a time frame, very often "causes"
becomes the effects and vice versa. But nonetheless for the purpose of analysis, the above
mentioned indicators have been clubbed under three broad sections, capturing three basic aspects
of food insecurity namely (i) food availability, (ii) accessibility and utilisation and (iii)
absorption of food resulting in physical manifestations. Food availability leads to food access
and access leads to food absorption. This distinction helps us to separate the causes of food
insecurity and attack them differently. Also certain indicators pertaining to availability can be
perceived as indicators of accessibility and vice versa. However, for this study the choice of
indicators was arbitrary.
Food availability depends upon food production. To capture the scenario of food availability
'Population supported by cereal production' has been taken into consideration. Seasonal
availability of food is a crucial aspect of food security since a majority of people do not stock
foodgrains and thus could be susceptible to seasonal shortages. This behaviour is largely
prompted by the shortage of surpluses from their own farm produce. During lean months they
meet their requirements from either market purchases (on credit) or by migrating in search of
employment. In view of this "Seasonality" has been included in this analysis.
Low availability of food may also occur owing to natural disasters such as droughts, floods and
hailstorms. Thus 'crop and cattle loss due to natural disaster' and ' disaster proneness' adversely
affect the availability of food. Drought adversely affects the accessibility of food by destroying
crop and cattle and thereby leading to the fall in family income. In view of this, we have taken
two indicators of 'cattle and crop loss due to disaster' and 'disaster proneness of a district' into
account.
Other than the production of food, the safety net coverage provided by the state also ensures food
supply. The public distribution system (PDS), government supported employment assurance
schemes (EAS), the food-for-work programmes launched by various organisations, and the
anganwadi centres constitute the various channels through which the vulnerable sections of
society are taken care of. To identify the adequacy of the safety net and their spatial distribution
15

'inadequacy of safety net' and 'population supported by the anganwadi centres' has been included
in the analysis. Unreliable data on the public distribution system prevented its use in the study.
However, proxy indicators such as intervention of WFP and CARE and the EAS have been taken
up.
Food availability leads to food access. Food insecurity is caused by lack of accessibility or
affordability. Access refers to the ability of people to acquire sufficient food. In the state where
livelihood opportunities are low, people are generally poor. Poverty normally leads to poor
sanitation, poor nutrition and poor access to food. Households, which are below the poverty line
and have no asset as a buffer, are more vulnerable to risks. Thus households below the poverty
line were considered for the study.
Scheduled tribes and the scheduled caste households are vulnerable to the risk of food
accessibility both owing to their low purchasing power and poor livelihood. The economic
occupation they are engaged in, its nature and level does not permit them to have adequate funds
to secure food. Again, they are concentrated in a place, which has low access to capital assets. In
view of their vulnerability towards accessibility, concentration of scheduled caste and scheduled
tribes have been included in the study.
In an agrarian economy the agricultural labourers are the ones with little or no access to land.
The small and marginal farmers also have no land to fall back on during the lean season. Their
chance of ensuring food for their family becomes very bleak in comparison to the cultivators.
However, the unavailability of authentic estimate of the landless labourers has led us to take up
agricultural labourers as a proxy indicator.
Migration is an indirect manifestation of inadequate food in an area. Non-availability of off-farm
employment during the crisis months induces people to migrate. Inter-state migration is difficult
to acquire and only intra-state migration was considered for the study.
One of the coping mechanisms of the chronic food inadequate households is sending children to
earn their livelihood in the labour market. Thus, higher incidence of child labour clearly indicates
insecurity of food. Concentration of child labour was included for measuring the degree of
insecurity.
Education has an important bearing through many channels on accessibility. The possibility of
obtaining employment is greater once a person is educated. Literacy increases the ability or
16
entitlement of people to understand government programmes or benefit from such programmes.
Literacy also has a bearing on nutrition by ensuring a balanced diet. The concentration of
illiterates suggests lesser accessibility to food. In view of this, illiteracy rate of the districts has
been chosen.
Female literacy has a direct bearing on the food security of a household. Low literacy levels
among women gets reflected in the poor status of health. They become less exposed and
receptive to information on improved health practices and less assertive in demanding quality
health services. The gender dimensions of food insecurity gets manifested through gender
inequality in infant morality rate (IMR), under 5 mortality rate, and sex ratio. During times of
economic hardship, women often assume the burden of adjustment. They absorb shocks to the
household welfare by expanding their already tightly stretched working day and by sacrificing
their own portions of food for children. This often results in the detriment of women's health and
nutrition.1
Sex ratio, however, is not a very unambiguous indicator. Generally high male ratio in a district is
not desired. But from the developmental perspective, high female ratio may be a manifestation of
food insecurity where males are pushed out to the developed districts to ensure their livelihood.
However, to assess the gender dimension of food insecurity, disparity in literacy, disparity in
IMR, disparity in under 5 mortality rate and sex ratio were taken up for this study.
It is very difficult to collect data on utilisation of food at the household level. Amartya Sen has
suggested that given the present database it is convenient to look at manifestation of utilization
than utilisation itself. Lower utilisation of food gets manifested through higher prevalence of
malnourishment, IMR and under 5 mortality rate. Therefore these indicators were adopted for the
study.
1 IFPRI, IFPRI Report discovers severe gender inequalities in agriculture, nutrition and food allocation, Agnes R. Quisumbirg, Lynn R Brown, Hilary Sims Feldstien, IFPRI web site,2000.
17

2.2 CONSTRUCTION OF INDICATORS
The first step towards the process is to measure the individual indicators that have been selected
for the study. The individual indicators are not the conventional ones often used to measure
socio-economic conditions, but deviate to give a clear picture of vulnerability. They are all
negative indicators. For example, total literacy data has been transformed into total illiteracy data
to project the situation that 'higher the value, higher the vulnerability'.
The measurement of all indicators involved the collection of data on at least two components for
comparison. For instance, the indicator on inadequacy of the safety net system involves
collection of data on the latest WFP and CARE intervention, person days generated through the
EAS and data on agricultural labour. The data on the person days generated by the EAS was
available for the year 2000, whereas the data on agricultural labourer was available for 1991.
Thus, in order to make them compatible the population of agricultural labourers was projected
for the year 2000.
Population Supported by Cereal Production
This variable has been measured as the number of people supported by 100 quintal of cereals
produced in the district assuming that the total cereal production is distributed equally amongst
the population. Here, the market mechanism and governmental intervention are not considered.
In an open economy with a significant role of trading and with the presence of welfare
interventions such as the public distribution system and the Integrated Child Development
Scheme (ICDS) the pressure of population on each unit of crop produced gets reduced. All this
has not been reflected in this measurement. However, from the total cereal production an
amount of 12.5 per cent has been deducted as loss owing to seed, feed and storage . According to
the norm, 100 quintals of cereals should support 49 persons for a year. (In an ideal situation 206
kg of cereals should support one person for one year)2. The variable indicates the population
pressure on each unit of crop.
The data on cereal production used here is an average of five consecutive years (1993-94 to
1997-98) and has been collected for 45 districts of Madhya Pradesh.3 The production data for the
2 Indian Council for Medical Research (ICMR) norm. 3 Commissioner of Land Records & Settlement, Basic Agricultural Statistics, Gwalior, Madhya Pradesh, 1999.
18
new districts has been calculated by using the data of area under cereals and the productivity of
the parent district. The data on the total population for 61 districts have been collected from the
web site put up by the Government of Madhya Pradesh on the Internet. The population for each
district has been projected for 1995 to make it compatible with the production data.
Seasonality
Seasonality in cereal production is defined as the ratio of the rabi and kharif cereals as a
percentage to total cereal production and has been calculated as 1minus (second crop / first crop).
The data on cereal production here is also a five-year average (1993-94 to 1997-98). The rabi
crops and kharif crops were grouped and then compared. Values nearer to 0 show equal
dependency on both the growing season and are shown in green in the map. Dependency on one
season reflects vulnerability and hence is represented in red, with values moving away from 0.
Inadequacy of the Safety Net
For measuring this indicator three sets of data were collected. These included: (i) WFP and
CARE intervention in the districts, (ii) person days generated through employment assurance
scheme (EAS) and (iii) total agricultural labourers in the district. The presence of WFP or CARE
in each district has been given a dummy value of 1, whereas districts with no presence of WFP
or CARE have been given a dummy value of, 0. The data on EAS in the case of 45 districts for
the year 2000 was collected from the Ministry of Rural Development. The data was available in
number of person days generated through EAS. As per the scheme a person is entitled to get a
maximum of 96 days of employment. But to expand the outreach of the scheme and to bring
more beneficiaries under its fold the person days vary from 26-30 or more. It is also a problem to
keep a record on how many persons got employment under the scheme as data is available only
on person days. To make the data on agricultural labourer compatible, it was projected for the
year 2000. For our study the outreach of the scheme was calculated to find the person days
generated per agricultural labourer. The values were then made unit free by dividing each
district data by the mean. Both the values of EAS and the WFP and CARE intervention were
added up and inadequacy of safety net system was calculated by finding the reciprocal for each
computed value.
19

Cattle and Croploss owing to Disaster
The time series data on affected cattle (measured as loss of cattle) and affected crop (measured in
hectares of land affected) has been provided by the Revenue Department, Madhya Pradesh for 45
districts. Cattle loss was calculated as per cent affected to total livestock population of the
district. (excluding the dog and poultry population). The data on livestock population was
collected from the Agricultural Statistics, Land Records and Settlement Commissioner, Gwalior,
Madhya Pradesh. The crop loss has been calculated as per cent of crop loss in hectares to the net
sown area of the district. This data has been worked out from an average of four to five years
relating to the period of 1995 to 1998-99.
Disaster Proneness
Disaster proneness has been calculated as the percentage of area under the Drought Prone Area
Programme (DPAP) blocks to total area of the district. This data has been collected from the
Directorate of Rural Development.
Households below poverty line
The data on households below the poverty line was collected from the District Poverty Initiative
Programme and was calculated as percentage to total rural households in the districts. Unlike the
1992-93 survey where annual household income of Rs. 11,000/- or less was taken as the basis for
delineating the poor households, expenditure incurred by a family was the basis in the 1997 -98
survey. The families whose per person per month expenditure is Rs. 245.70 or less has been
considered as household residing below the poverty line. The standard of living of the
households has been considered and not the income. Block level data for this indicator was,
however, not available.
Scheduled Caste and Scheduled Tribe
The percentage of scheduled caste and scheduled tribe population has been calculated in relation
to total population of the districts and both the district and block level data has been collected
from the web site of Madhya Pradesh on the Internet for 61 districts (1991).
Net Migration
20

The data has been collected from the Census of India 1991 and is available for 45 districts for
both males and females. The data only reflects the inter-district migration. For our study net-
migration index has been measured as:
Out-migration to other districts – In-migration from other districts of MP
Total population of the district
Illiteracy
The block and district level data for literacy has been collected from the Madhya Pradesh web
site for 61 districts. The percentage of literates has been converted into percentage of illiterates to
ensure the unidirectional characteristic of the data where “higher the value, higher will be the
vulnerability”.
Agricultural Labourers
The block and district level data has been collected from the Madhya Pradesh web site for
61districts and has been calculated as a per cent to total primary workers (cultivators, agricultural
labourers, forestry and mining) of the district.
Child Labour
The data on child labour was collected from the Census of India, 1991 for 45 districts. The
children of school going age of 6-14 of all industrial categories was considered and was
calculated as per cent to total children in the district of 6-14 age group. The computed per cent of
the parent district was repeated for the newly formed districts.
Disparity in Literacy
Disparity in literacy is usually measured as the number of female literates as against male
literates. But in the case in order to reflect vulnerability, the disparity has been measured as
follows:
Per cent of male literates to total male population
Per cent of female literates to total female population
A higher value will indicate females as more vulnerable.
Disparity in Infant Mortality Rate
21
Disparity in infant mortality rate is measured as female infant mortality rate / male infant
mortality rate. A higher value indicates a higher rate of death among female infants.
Disparity in Under 5 Mortality Rate
Disparity in under 5 mortality rate is measured as female child mortality rate / male child
mortality rate. Higher the number higher will be the number of female child deaths.
Sex Ratio
Sex ratio is generally measured as the number of females per 1,000 males. The data thus
computed generally reveals a better situation with higher value. But since all the indicators for
this study needs to be unidirectional, this indicator here has been computed as males per 1,000
females, revealing that higher the value more the vulnerability. A higher sex ratio (male/female)
indicates greater socio-cultural disparity against women resulting in female foeticide and neglect
of the girl child. Thus, here sex ratio is positively related with vulnerability.
For this study, the male-female population of only age group 0 – 16 year has been considered.
This data will be devoid of any distortions caused owing to economic factors. In general, the
males belonging to the age group 16 years and above move out of the district to earn a
livelihood. Considering the total population for computation would give a biased scenario and
would lead to wrong interpretation of the actual situation.
Infant Mortality Rate and Under 5 Mortality Rate
Infant mortality rate is measured as the death of children below the age of one year per 1,000 live
births.
Under 5 mortality rate is measured as death of children under five years of age per 1,000 live
births.
This data is available at the district level from the vital registration system. But owing to poor
quality of birth registration, data provided are not reliable. Thus, the mechanism of sample
registration system (SRS) emerged in India for the purpose of planning. SRS provides estimates
at the state level only.
22

Data on mortality exactly up to four years of age is not available. Thus, mortality up to five years
is used for estimating the situation of mortality among children.
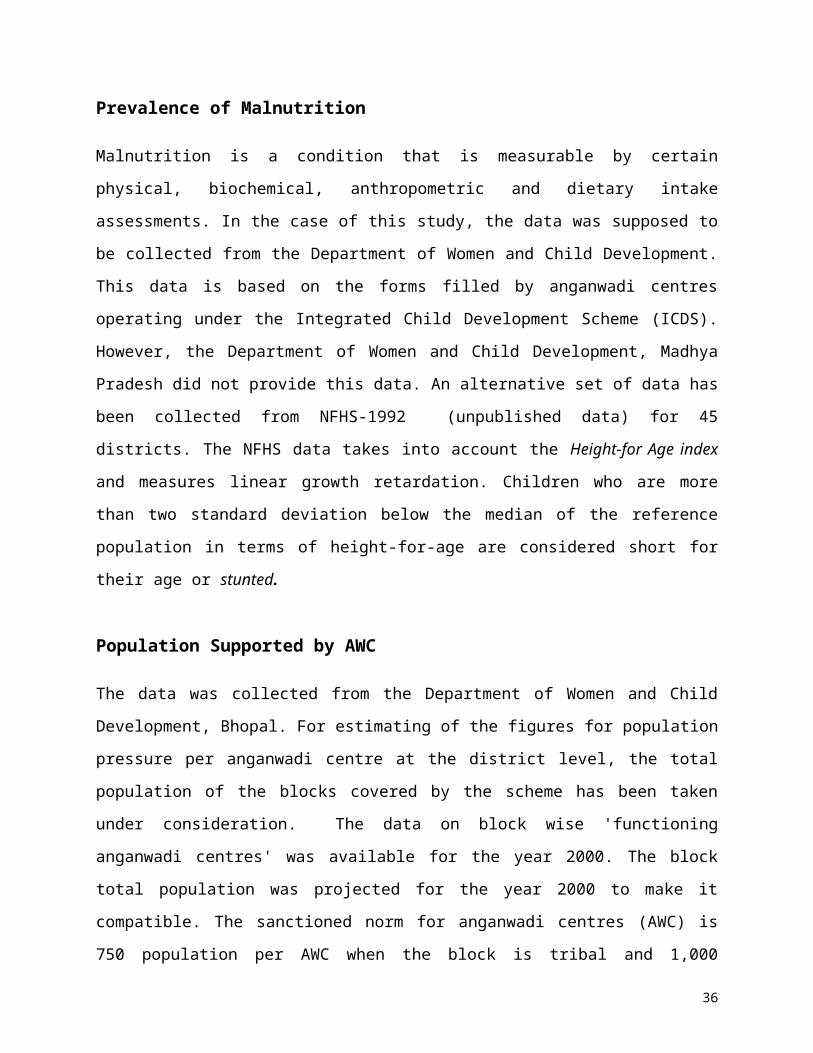
Prevalence of Malnutrition
Malnutrition is a condition that is measurable by certain physical, biochemical, anthropometric
and dietary intake assessments. In the case of this study, the data was supposed to be collected
from the Department of Women and Child Development. This data is based on the forms filled
by anganwadi centres operating under the Integrated Child Development Scheme (ICDS).
However, the Department of Women and Child Development, Madhya Pradesh did not provide
this data. An alternative set of data has been collected from NFHS-1992 (unpublished data) for
45 districts. The NFHS data takes into account the Height-for Age index and measures linear
growth retardation. Children who are more than two standard deviation below the median of the
reference population in terms of height-for-age are considered short for their age or stunted.
Population Supported by AWC
The data was collected from the Department of Women and Child Development, Bhopal. For
estimating of the figures for population pressure per anganwadi centre at the district level, the
total population of the blocks covered by the scheme has been taken under consideration. The
data on block wise 'functioning anganwadi centres' was available for the year 2000. The block
total population was projected for the year 2000 to make it compatible. The sanctioned norm for
anganwadi centres (AWC) is 750 population per AWC when the block is tribal and 1,000
population per AWC when the blocks are dominated by non-tribal population.
23

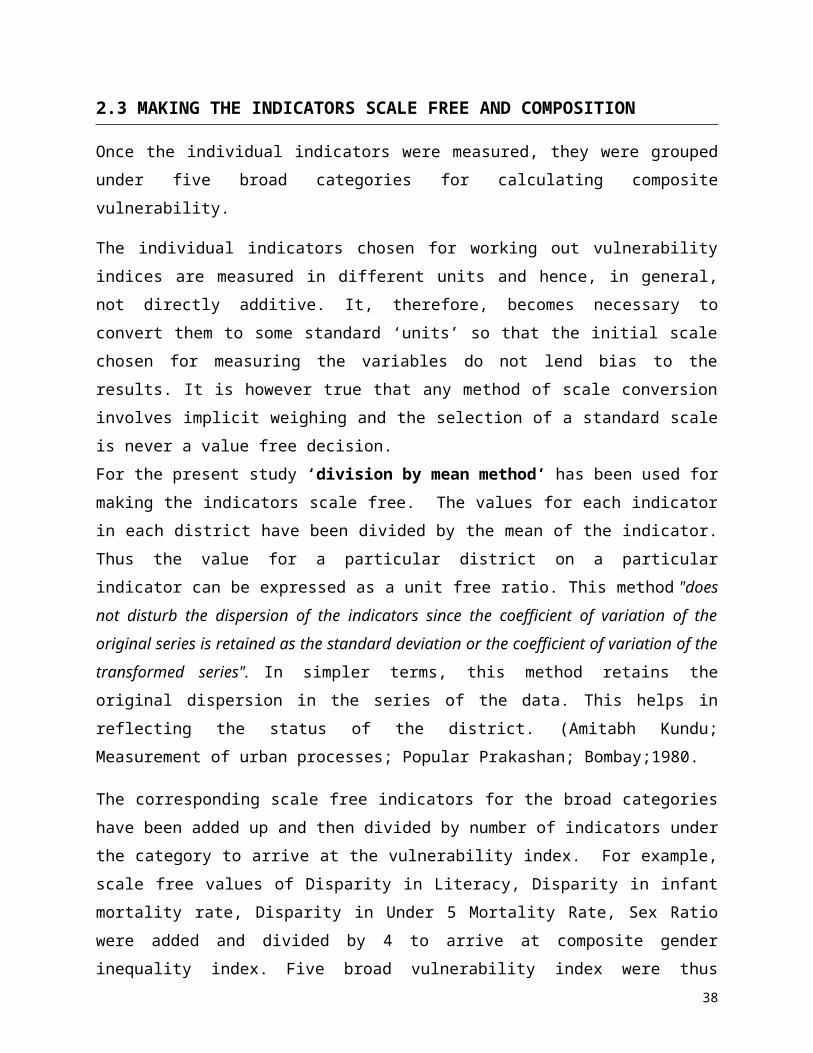
2.3 MAKING THE INDICATORS SCALE FREE AND COMPOSITION
Once the individual indicators were measured, they were grouped under five broad categories for calculating composite vulnerability.
The individual indicators chosen for working out vulnerability indices are measured in different units and hence, in general, not directly additive. It, therefore, becomes necessary to convert them to some standard ‘units’ so that the initial scale chosen for measuring the variables do not lend bias to the results. It is however true that any method of scale conversion involves implicit weighing and the selection of a standard scale is never a value free decision. For the present study ‘division by mean method’ has been used for making the indicators scale free. The values for each indicator in each district have been divided by the mean of the indicator. Thus the value for a particular district on a particular indicator can be expressed as a unit free ratio. This method "does not disturb the dispersion of the indicators since the coefficient of variation of the original series is retained as the standard deviation or the coefficient of variation of the transformed series". In simpler terms, this method retains the original dispersion in the series of the data. This helps in reflecting the status of the district. (Amitabh Kundu; Measurement of urban processes; Popular Prakashan; Bombay;1980.
The corresponding scale free indicators for the broad categories have been added up and then divided by number of indicators under the category to arrive at the vulnerability index. For example, scale free values of Disparity in Literacy, Disparity in infant mortality rate, Disparity in Under 5 Mortality Rate, Sex Ratio were added and divided by 4 to arrive at composite gender inequality index. Five broad vulnerability index were thus formulated. These are – (i) sustenance insecurity, (ii) disaster proneness, (iii) deprivation index, (iv) gender inequality index and (v) malnutrition and mortality index. However, while composing sustenance insecurity and malnutrition and mortality index, inadequacy of safety net system and population supported by the anganwadi centres were not considered. These indicators are intervention variables controlling the food insecurity and thus do not reflect vulnerability.
To get the overall picture of each district in terms of food insecurity and vulnerability, the unit free value of all the five broad categories was added up and divided by 5. The score thus obtained was then mapped. To understand the contribution of each indicator towards vulnerability a detailed analysis on the interrelationship of the individual indicators was done. This has helped in understanding, selecting and finalising the key indicators that are manifestations of food insecurity at Madhya Pradesh. The unit free values of these indicators were summed up for each district to arrive at a composite score and with the help of a suitable range the districts have been grouped. Higher value districts indicate more vulnerability and need for intervention.
24

2.4 CLASSIFICATION OF THE DISTRICTS
All the individual indicators have been thematically mapped. The thematic mapping has been
carried out on equal range methodology, with red colour representing the most vulnerable
situation while orange and yellow representing progressively lesser vulnerability, and green
representing the least vulnerable situations.
The collated inputs for the various indicators, exhibited peak values at the highest and the lowest
ends, thus due re-appropriation has been carried out, for balancing the peaks, for a realistic
presentation of the vulnerability scenario.
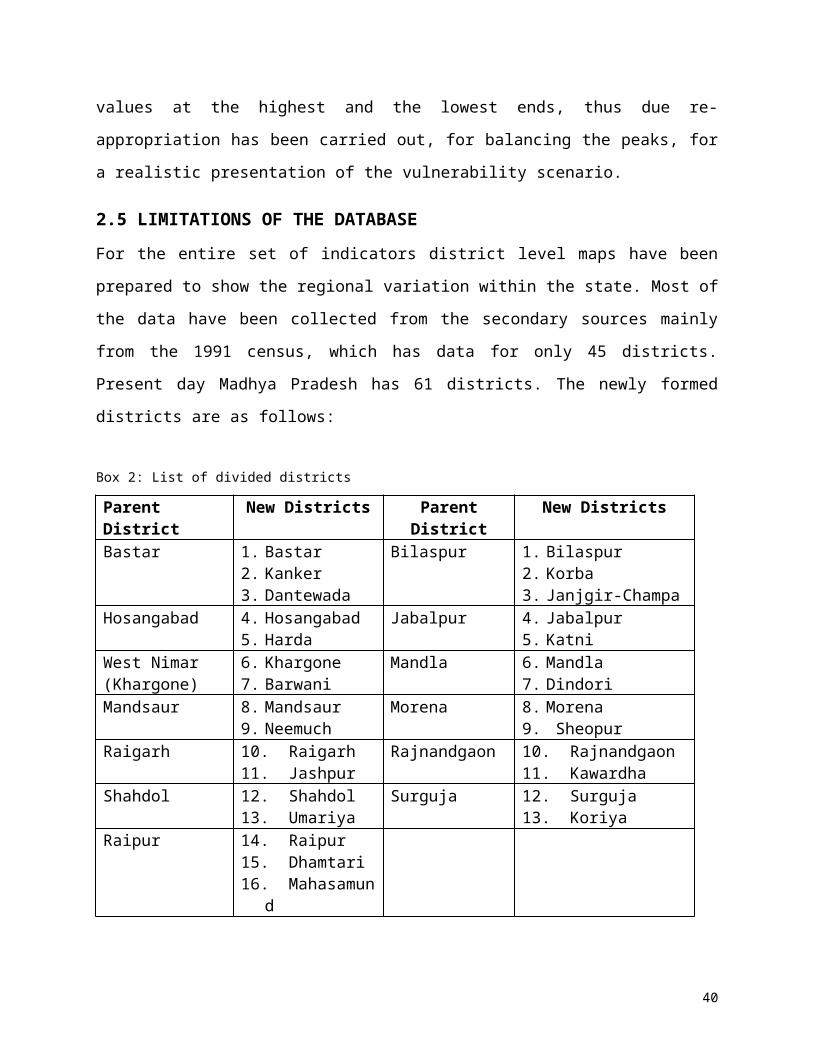
2.5 LIMITATIONS OF THE DATABASE
For the entire set of indicators district level maps have been prepared to show the regional
variation within the state. Most of the data have been collected from the secondary sources
mainly from the 1991 census, which has data for only 45 districts. Present day Madhya Pradesh
has 61 districts. The newly formed districts are as follows:
Box 2: List of divided districts
Parent District New Districts Parent District New DistrictsBastar 1. Bastar
2. Kanker3. Dantewada
Bilaspur 1. Bilaspur2. Korba3. Janjgir-Champa
Hosangabad 4. Hosangabad5. Harda
Jabalpur 4. Jabalpur5. Katni
West Nimar (Khargone)
6. Khargone7. Barwani
Mandla 6. Mandla7. Dindori
Mandsaur 8. Mandsaur9. Neemuch
Morena 8. Morena9. Sheopur
Raigarh 10. Raigarh11. Jashpur
Rajnandgaon 10. Rajnandgaon11. Kawardha
Shahdol 12. Shahdol13. Umariya
Surguja 12. Surguja13. Koriya
Raipur 14. Raipur15. Dhamtari16. Mahasamund
The data for all the indicators are not available for the newly formed districts. For those
indicators the data of the parent district has been repeated for the newly formed district.
25

The block level data for all the pre-selected indicators are not available at the state level head
quarters and it is cost ineffective and time consuming for one to go and collect data from the
block and district level. A block level map of a few indicators whose data was readily available
has been done. The block level maps have been prepared for rural areas only.
26
Chapter-III
DEVELOPMENTAL DYNAMICS OF MADHYA PRADESH
3.1 FOOD AVAILABILITY IN MADHYA PRADESH
Agriculture is the single largest sector of the economy and employs over 76 per cent of the labour force. About 43.7 per cent area of the state is cultivable. Madhya Pradesh is predominantly a kharif growing state. Kharif accounts for about 61 per cent whereas rabi crops account for about 39 per cent area out of the total cropped area in the state. The major crops grown in the state are paddy, wheat, maize and jowar among cereals, gram, tur, urad, and moong among pulses, while soyabean, groundnut and mustard among oilseeds. Commercial crops such as cotton and sugarcane and other horticulture crops are also grown in the state.
At present Madhya Pradesh occupies a central place among the major agricultural states of the country having a national rank of I for the percentage of national crop production in India for soyabean, gram, pulses, guava, green peas, linseed, garlic and all oilseeds.
3.1a Physiography and climate affecting food production in Madhya Pradesh
Madhya Pradesh, the biggest hill-locked state of India, is situated in the middle of the country. (Map- I, A, B, , Location Map, Index Map, & Block Map of Madhya Pradesh). The undulating topography of the state is characterised by low hills, narrow valleys, plateaus and plains and separates the fertile Gangetic plains from the broad tableland of the Deccan Plateau.
The western part of the state has fertile black soil. Eastern Madhya Pradesh is a less fertile area with red and yellow soil deriving from Kadappa, Dharwad and Gondwana rocks. The northern part has a mixture of red black and yellow soil. The high mountains contain laterite soil.
The climate of Madhya Pradesh is varied. The state has three main seasons: (a) winter season from mid-October to mid-February, (b) dry summer season from mid-February to mid-June, and (c) humid summer season or rainy season from mid-June to mid-October. The temperature increases in the month of February and peaks in May-June. The winter in these areas is also severe.
27

The major part of the rainfall in the state is caused by monsoons coming from the southwest. The peculiarity of monsoons in the state is their uncertainty. The rainy season usually starts in mid-June and ends in mid-October but sometimes there are rains in December-January as well. Winter rainfall, although infrequent and scanty, is important for rabi crops such as wheat, gram, barley and oilseeds.
The state can be divided into 12 agro-climatic regions and 5 crop zones. The district wise classification along with soil type and normal rainfall range is given below. (See Box 2) (Map: C, Agro Climatic Regions of Madhya Pradesh)
Box 3: Agro-climatic regions
Sl. No
CROP ZONES
AGRO CLIMATIC REGIONS
SOIL TYPE RAINFALL RANGE (M.M.)
DISTRICT COVERED
1 Rice Zone Chhattisgarh plains including Balaghat districts
Red & yellow (medium)
1200 to 1600 Raipur, Durg, Rajnandgaon, Bilaspur, Raigarh part Bastar & Balaghat
2 Rice Zone Bastar plateau -do- 1400 to 1600 Most Bastar3 Rice Zone Northern Hill region of
ChhattisgarhRed & yellow (Medium black and sketal / medium light)
1200 to 1600 Surguja, Shahdol, Sidhi and Parts of Mandla
4 Wheat Rice Zone
Kymore Plateau & Satpura Hills
Mixed red and black soils (Medium)
1,000 to 1400 Rewa, Satna, Panna(Partly), Seoni and Katni tehsil of Jabbalpur
5 Wheat Zone Central Narmada Valley
Deep black soil 1200 to 1600 Jabalpur ( except Katni) Narsinghpur and Hosangabad
6 Wheat Zone Vindhya Plateau Medium black & deep black medium heavy
1200 to 1400 Bhopal, Sehore, Raisen, vidisha, Guna, Sagar & Damoh
7 Wheat Jowar Gird Region Alluvial light 800 to 1,000 Gwalior, Bhind (except Pichore and Karera Tehsil of Shivpuri District)
8 Wheat Jowar Bundelkhand Mixed red and black medium
800 to 1400 Chhattarpur, Datia, Tikamgarh, part of Panna, Karera and Pichore tehsils of Shivpuri
9 Wheat Jowar Satpura Shallow black medium 1,000 to 1200 Betul & Chhindwara10 Cotton Jowar Malwa Plateau Medium black
medium800 to 1200 Mandsaur, Ratlam, Ujjain,
Dewas,Indore, Shajapur, rajgarh, Dhar(except Kukshi & Manawar Tehsils)
11 Cotton Jowar Nimar Plains -do- 800 to 1,000 Khandwa, Khargone, Kukshi & Manawar tehsils of Dhar
12 Cotton Jowar Jhabua Hills Medium black skeletal light / medium
800 to 1,000 Jhabua district
Source : www.mp.nic.in/agriculture
28

The crop production and availability depends upon gross cropped area and moisture availability for crop production. The gross cropped area under cereals in the state has been fluctuating between 12.40 and 12.84 million hectares during the period 1993-94 to 1997-98. This has in some way influenced the cereal production in the state. (See graph 1)
Graph 1
3.1b Moisture Availability in Madhya PradeshNarmada, Mahanadi, Mahi, Tapti, Chambal, Betwa, Sone, Wainganga, Indravati, Sabri Ken and Pench are the main perennial rivers in Madhya Pradesh. The Narmada is the biggest river and the lifeline of Madhya Pradesh. Estimated annual run-off from the above watersheds is about 150 MAF. It is estimated that about 70 per cent of this run-off that is 105 MAF can be harnessed for irrigation. Annual ground water recoverable from recharge has been assessed as 26 MAF. 4 Yet the state is predominantly rainfed.
Madhya Pradesh has the highest proportion of India's dry land districts within its area. According to the National Bureau of Soil Survey and Land Use Planning (NBSS-LUP), most of Madhya Pradesh has a growing season of 150-180 days. About 31.6 per cent of the net sown area in the state has irrigation facilities through canals, tanks and wells. Even if the ultimate irrigation potential from surface and groundwater sources were realised, over 55 per cent of the net sown area in Madhya Pradesh would still remain dependent on uncertain rainfall. On the basis of rainfall and irrigation availability Madhya Pradesh typifies two different scenarios of agricultural development: the near stagnation in the relatively high rainfall eastern region and the increasingly unsustainable tubewell led agricultural development in the hard rock regions of the country. 5
4 www.mp.nic.in/irrigation. MP web site 5 The Madhya Pradesh Human Development Report, Govt. of Madhya Pradesh,1998.
29
Source: Basic Agricultural Statistics (Annex-IV Table-1A)

In eastern Madhya Pradesh, 85-90 per cent of rainfall is received during the months of June to September. This rainfall exceeds the potential evapo transpiration (PET) during the period mid-June to early October. From mid-October onwards PET exceeds rainfall and the stored moisture gets gradually exhausted. Soil remains dry during the months of December to May. Thus a critical constraint to rice production in Chhattisgarh is the moisture regime. In the absence of irrigation, the rice crop is highly prone to agricultural droughts, the probability of which is estimated to be once in three years. 6
The Western Madhya Pradesh is characterised by semi arid and dry sub-humid climates. The rainfall is highly seasonal, 90 per cent of it being concentrated during the period June to September, with the total number of rainy days ranging between 40-50 days. The cropping pattern is highly diversified and has undergone dramatic changes over time with a remarkable shift from food crops to cash crops. Soya bean, cotton and other commercial crops are predominant. With the introduction of rain-fed dry land agriculture there has been a substantial rise in the area under irrigation and cropping intensity.
In the west, surface irrigation has very low potential as the rainfall is low. The exploitation of ground water in this area is still very much within the limits of replenishment as per the 1991 status. However the region being a hard rock region, replenishment of ground water can pose a problem if exploitation of water exceeds replenishment.
In terms of area under foodgrains and yield per hectare, the position of Madhya Pradesh vis-à-vis some other states is not very encouraging.
State Area '000 Ha Production '000 tns. Yield Kg/Ha.Madhya Pradesh 17823.4 17410.5 977Andhra Pradesh 6393.1 10939.7 1711Maharashtra 13161.1 9708.7 738Punjab 5879.0 21148.9 3597Uttar Pradesh 20637.2 41828.6 2027
For improving yield levels, one has to preserve moisture available. To cope with the production fluctuations owing to climatic vagaries the state has intensified agricultural research for developing better high yielding strains. Development of suitable production technology and package approach for different crops is also being under taken. Massive soil and water conservation measures and irrigation development through crop substitution and crop area diversification has also been taken up.
6 Ibid.30
3.1c Food Availability
Despite all the limitations of low yields and rain-fed agriculture, Madhya Pradesh seems to be in a fairly comfortable position as far as food availability is concerned. It produces around 16
million tonnes of foodgrains and contributes about 9 million tonnes to the national buffer stocks.
Graph 2
Source : Basic Agricultural Statistics.
Food production is the main determinant of availability in a state. Madhya Pradesh has an average per capita availability of 25.12 kg vis-à-vis Punjab at 74.90 kg and Kerala at 17.95 kg, at the two ends of the scale.7
Madhya Pradesh produces a variety of cereals, pulses and oilseeds. The state is deficient in the production of foods such as sugar, tubers, fruits, vegetable, eggs and fish. Madhya Pradesh also produces sufficient amount of milk. (Annexure -IV, Table 1B)8
Madhya Pradesh seem to produce enough of cereals as well as pulses for its population, There is no shortage of basic food availability as in the case of Kerala, Tamil Nadu, Gujarat and Maharashtra. The public distribution system normally takes care of the availability and consumption of the
7 Ministry of Agriculture, “ Bulletin of Food Statistics” – 1999-20008 The food availability is calculated after deducting 13 per cent of production for seed feed and wastage in respect of cereals, tubers, pulses, vegetables, 70 per cent in respect of Oil seeds, 50 per cent in respect of fruits. There was no wastage for milk, eggs and fish and sugar. In respect of eggs as each egg is considered as equivalent to 125 GMS of edible portion. These quantities are converted into per capita per day availability levels, using projected population of 2000. Deliberate under estimation is to take into account the possible stagnation in production. These quantities are compared with Indian council of Medical research norms of food intake. Accordingly the surplus and deficit are estimated for each food item.
31

lower income groups. The off-take from the system is very low in the state . (See Graph 3). The analysis of NSS data (1986-87) reveals that 90.9 per cent of the rural households did not purchase from the PDS at all. Of the remaining, 4.8 per cent of rural households were partially dependent on the system and 4.3 per cent made all their purchases from the PDS. The corresponding percentage for urban areas is 12.1 per cent and 5.3 per cent respectively.9
Graph 3
Source: Directorate of food and Civil Supplies, Bhopal, 2000 (Annex IV, 1C).
In Madhya Pradesh, the distribution of foodgrains through the PDS had gone down from 585 thousand metric tonnes in 1993 to 323 thousand metric tonnes in 1995. However, during the subsequent period the PDS distribution fluctuated between 578 and 621 thousand metric tonnes.
Off take of wheat and rice is more amongst the below poverty level population than above the poverty line population. About 31 per cent of the allotted wheat and 15 per cent of the allotted rice is distributed to the above poverty line population (APL) population whereas 67 per cent of allotted wheat and 70 per cent of allotted rice is distributed to the below poverty line (BPL) population.10 The reason for this lower off take than the allotment by the BPL can either be because of inefficient management, poor outreach of services or because of the under utilisation of the service.
9 Swaminathan Madhura, “Weakening Welfare-- The Public Distribution of Food in India, Left word Books, 2000).10 Data of Feb'2000, supplied by Directorate of Food & Civil Supplies, Vindhyachal Bhavan, Bhopal
32

3.1d Consumption pattern in Madhya Pradesh
The average levels of cereal consumption are 473.33 grams per capita per day in Madhya Pradesh, as against 420 grams recommended by the ICMR.11 Consumption of pulses is high at 32 grams per day, compared to the norm of 40 grams. Except for Himachal Pradesh, all the other states in the country have very low levels of pulse consumption. Comparatively, consumption of pulses is high in Madhya Pradesh, as the state produces more than its requirement. Surprisingly, the intake of fat and oilseed is very low at about 10 grams per capita per day as against the ICMR norm of 22 grams per capita per day, though the oilseed production in Madhya Pradesh is high. Consumption of milk is also well below the norm at 82 grams as against the norm of 150 grams. The food basket of Madhya Pradesh is less diversified and intake of nutritive items such as egg, milk, vegetables and fruits are lower.
3.2 FOOD ACCESSIBILITY IN MADHYA PRADESH
Food insecurity is caused by lack of accessibility or affordability. Access refers to the ability of people to acquire sufficient food. In the state where livelihood opportunities are low, people are generally poor. With a population of 66 million (1991 Census) Madhya Pradesh is one of the poorest states in the country. The percentage of population living below the poverty line is estimated to be about 40.6 per cent of the rural population. Some of the districts seem to have more than 50 per cent of the population below the poverty line. Approximately 77 per cent of the population lives in the rural areas in the state, compared with 74 per cent for all India.
Accessibility to food in Madhya Pradesh is also hindered by very low literacy level in the state. According to the 1991 Census, the literacy rate was 44 per cent in the state, compared with 52 per cent for the whole country. According to sex, literacy rates were 58 per cent for males and 29 per cent for females in Madhya Pradesh. The literacy rate is very low in the rural areas. It is as low as 35.9 per cent in the rural areas. Female literacy in rural areas is as low as 19.7 per cent according to the census of 1991.12 Enrolment of children in primary schools is also very low. A large percentage is school dropouts. A survey conducted by the Government of Madhya Pradesh, in connection with universalising primary education has found that the scattered habitation pattern of the tribal areas deny access to primary education.
The occupational distribution of the rural population in Madhya Pradesh reveals that 22.57 per cent of the holdings are less than half hectare in size. The percentage itself is not very high 11 The Consumption figures are take from the NSS 50th round on consumption expenditure and quantity of consumption.12 Madhya Pradesh Human Development Report 1998 page 94.
33
compared to many other states. However, since the land fertility is very low, these farmers experience severely insecure livelihoods. The percentage of landless labour households is only 12.7 per cent in Madhya Pradesh. However, those dependent upon agricultural labour as their main occupation are as high as 35.6 per cent.13 Added to the problem of dependence on low yielding lands is the problem of drought. Drought in Madhya Pradesh is greater owing to the
dependence on rainfall and its uneven spread, rather than the lack of rainfall or deficient rainfall.
Madhya Pradesh has the largest tribal population in the country. The population of scheduled tribes in the state works out to 23.7 per cent of total population as compared to 8 per cent for the whole country. The scheduled castes accounted for 15 per cent of the population of Madhya Pradesh compared with 17 per cent for the whole country as per the 1991 Census.
The Human Development Report of Madhya Pradesh reveals that the literacy rates of scheduled tribes is 21.5 per cent which is less that that of the total literacy of the state. Female literacy among scheduled tribes is as low at 10 per cent compared to 29 per cent for the state. The percentage of households below povertyline is also high in the tribal districts.
The special feature of the tribal areas in Madhya Pradesh is that about half of the area is covered with forest and has an altitude between 1,000-3000 feet. The terrain, which the tribals cultivate, is highly undulating and is prone to soil erosion. Sparseness of population, scanty communication system and inadequate infrastructure are some special features of the tribal areas. This situation coupled with the low level of literacy raises a real problem towards extending developmental programmes to a majority of the tribes. Again, their occupational status also prevents them from ensuring that they have enough funds for securing food.
Lack of accessibility to food in a household gets reflected in the coping mechanism that the household adopts. To supplement the family income, chronic food insecure families send their children to the labour market. Madhya Pradesh is one of the Indian States where the incidence of child labour is high (6.30per cent), with the number of working children exceeding one million.
There are about 12 child labour endemic districts in Madhya Pradesh which include Bastar, Raipur, Surguja, Bilaspur, Rajanandgaon, West Nimar, Raigarh, Mandla, Jhabua, Durg, Betul and Chindwara.
In Madhya Pradesh, the National Child Labour Project is operating in Bilaspur, Durg, Mandsaur, Rajnandgaon and Surguja. The projects are specific, and time bound where priority is given to the withdrawal and rehabilitation of children engaged in hazardous employment. The key
13 NSS report on Employment and unemployment, 1993-9434
elements are: providing employment to parents of child labour; expanding formal and non-formal education; promoting school enrollment through various incentives such as payment of stipends and stepping up the enforcement of the prohibition of child labour.14
Industrially, Madhya Pradesh is less developed compared with some other states of India. However, the state has entered the era of high tech industries such as petrochemicals, electronics, telecommunications, automobiles, etc. This predominantly agricultural state is better known for its vast mineral resources India's largest and richest deposits of iron ore, coal, tin, bauxite, and most recently diamonds, are in Madhya Pradesh. The state also has rich mineral reserves of copper, dolomite, fire clay, kaolin, limestone, manganese, quartzite, silica, phosphorite etc.
Most of the employment generated such as technical and supervisory jobs during the course of the industrialization of the region has gone to immigrants from the more developed parts of India. Local people, especially the poor are disadvantaged in terms of education and other resources to benefit from the industrialization of the state. Thus, lack of livelihood for the unskilled labour in the rural area result in migration to urban and semi-urban areas or to other states as contract labour. Inadequate income from agriculture in the rabi season and drought induces migration of families for livelihood. A WFP study has shown that even women in Jhabua migrate to Gujarat for a period of 3- 5 months to work on brick kilns, construction work and grass cutting and harvesting.
3.2A GENDER DIMENSION OF ACCESSIBILITY
Hunger does not only mean lack of food. It is a form of deprivation and marginalisation, which manifests itself in reduced decision making with respect to food production, access to food and poor nutrition and health care leading to low absorption of food.
Out of the total number of persons employed in food production related activities, nearly 76 per cent are women. 28.8 per cent are cultivators but a large number, 46.59 per cent being employed as labourers. It has been estimated that in Madhya Pradesh, 68 per cent of all adult women earners are wage earners, as against 44 per cent for men (the data for India as a whole being 42.8 per cent for women wage earners and 35 per cent for men).15 The wage rates for women agricultural labourers is Rs 14 per day which is lower than the male wage rate of Rs 18 per day (both the figures being lower than the all India average of Rs.16 per day for women and Rs 23 per day for men). This suggests that women are not just deprived of an asset base ensuring decision making in food availability but are also subject to discrimination in being awarded value
14 A childhood for every child, V.V. Giri National Labour Institute15 NSS 50th Round, Employment and unemployment
35
for their labour.
These gender biases can manifest themselves at the household level resulting in reduced intra-household food availability to women. A recent WFP study in Jhabua 16shows that women eat last and often eat much less than the others in the households.
The sex ratio of the population (number of females per 1,000 males) for the year 1991 was 931 as against 927 for all India. In the case of children under 16 the sex ratio shows a more realistic picture since it is less influenced by migration which happens to be male dominated. It follows a similar trend showing 926 girls per 1,000 boys. This suggests that there exist a preference for males, responsible for low availability of health care and nutrition for the girl child resulting in their high infant mortality rate.
3.3 MADHYA PRADESH IN THE NATIONAL ECONOMY IN TERMS OF NUTRITION RELATED ASPECTS
Lack of livelihood access and food access results in nutritional deficiencies in adults and children. The indicators of child nutrition such as infant mortality, child mortality, stunting, underweight, anaemia etc. are highly prevalent in Madhya Pradesh.
A major problem in Madhya Pradesh is its high mortality rate. This indicates lack of health facilities and also lack of accessibility to nutritious food. The IMR was 133 per 1,000 live births as against 79 for the country. The pattern of life expectancy in the state is quite contrary as compared to the rest of the country, where males live longer than females.
The percentage of severely underweight children in the age group of 1-5, are the highest in Madhya Pradesh at 33 per cent (about 19 per cent as per the NFHS report). In the other states such as Kerala and Tamil Nadu, the percentage is no more than 15-16 per cent. Severely stunted children are as high as 40 per cent, while 75 per cent of the children below three years are anaemic; only 22.4 per cent of the children are immunised.
About 54.3 per cent of the married women in the fertility age group are anaemic, 64 per cent of the women are married before the age of 18. Health professionals attend to only 29.8 per cent of the births17. Only 10 per cent of the children in the age group 6 years and below receive the supplementary nutrition packets distributed by the ICDS.
Adult nutrition is also very dismal. The maternal mortality is 567 per thousand, which is among the highest in the country, next only to Orissa, in 1992. 53 per cent of the adults suffer from
16 Qualitative findings of the WFP-FIVP, Jhabua, Madhya Pradesh17 NFHS report of Madhya Pradesh,1992
36

chronic energy deficiency, as per the NNMB data. Life expectancy is the lowest in the country at
52 years.
The percentage of boys under the age of four suffering from severe malnutrition is 17.6per cent while for girls in the same age group it is 20.4per cent.18 The immunization data shows that only 53per cent of the children in the state of Madhya Pradesh received all the eight doses of vaccines against four illness (DPT, polio, BCG and measles) with gender disparity of 0.92 indicating that fewer girl children have access to immunization. The incidence of morbidity among the female population is also high. The prevalence rate of short duration major morbidity (diarrhoea, cough and cold) is higher among women than men. The short duration morbidity prevalence rate (estimated over a 30-day period) among women is 213 as against 195 per 1,000 population for men.19
Madhya Pradesh is a state that has the second highest incidence of diarrhoea (91 per cent) and second lowest level of knowledge among mothers about ORS indicating a lack of access to basic health education. Madhya Pradesh has a high incidence of stunting (more than 40 per cent) among children in the age group 0-4 years. One of the causes of stunting is low birth weight, which is directly linked to maternal nutrition during pregnancy. An examination of the National Nutrition Monitoring Bureau (NNMB) data, ICDS and other data reveal briefly the following features about nutrition.
Taking average nutritional status of households, severe malnutrition is more prevalent in Madhya Pradesh along with the eastern states of India, Uttar Pradesh and Kerala.
The nutritional status of scheduled castes and tribes was substantially lower than the recommended minimum in Madhya Pradesh.
The incidence of acute malnutrition is definitely high among children, especially in the age group 0-3 years in almost all states, it being higher in tribal tracts. In a number of states, the percentages of children with adequate calorific protein intake were much lower than the corresponding percentage for households. Children of scheduled castes and tribes in all cases where data was available, suffer from a high incidence of malnutrition. ( Annexure IV, Table: 1D i &,ii )
3.4 ENVIRONMENTAL DEGRADATION AND FOOD INSECURITY
Environmental degradation, soil degradation and climate change can influence the yield of cereals. Unsustainable livelihood, over exploitation of natural resources and agricultural practices may often lead to potential food insecurity. Salinity, soil degradation, soil erosion and desertification arise owing to unsustainable practices.
18 A. Shariff, “Human Development Report” , NCAER19 Ibid
37
Box -4: Forest area
Area Madhya Pradesh Country as a wholePercentage
Geographical Area 44,3446 32,87,263 13.49Reserved Forest 82,700 4,16,516 19.86Protected Forest 66,678 2,23,309 29.86Others 5,119 1,25,385 4.08Total Forest Area 15,4497 7,65,210 20.19Source : Compendium of Environmental Statistics,1999; Forest Survey of India- The state of forest Report-1997.
Madhya Pradesh has nearly 20 per cent of the forest area of the country. Almost one-third of the state is forest area, compared with the over all figure of one-fifth for India as a whole. In the state, forest types range from dry thorny forest to tropical moist forests. A large number of forest products, medicinal plant as well as aromatic plants are found in the natural forests. Significant among these being tendu leaves (diospyros melanoxylon), used for bidi wrapping, Sal seeds (shorea robusta), used for extracting non -edible oil for industrial use, Harra (Terminalia Chebula), used for tanning in the leather industry, Mahul leaves (Bacehinia Vahlii) used in making pressed cups and plates. The forest produce has tremendous potential and makes significant contribution in terms of income and employment in rural as well as tribal areas.
On the face of it Madhya Pradesh appears to be environmentally more sustainable than other states. This is supported by the fact that it has 30 per cent of the area under thick forests, more than 40 per cent of the net sown area is under leguminous crops, and the levels of ground water exploitation is less than the available ground water resources. Wasteland, as a percentage of geographical area, is also smaller. 20
20 Environmental Compendium and Wasteland atlas of India38

However, some micro studies point to considerable degradation of forest land and forest products and also decrease in forest area in Madhya Pradesh. The reduction in the availability of products such as bamboo, edible fruits, tendu and mahua leaves are apparent.
This has a major impact on the livelihood of the tribals. The collection of forest produce has been the traditional occupation of the tribals. Thus degradation of forest results in low income from the non-timber forest products leading to insecurity of livelihood.
39
Chapter-IV
FOOD INSECURITY AND DEVELOPMENT DYNAMICS: AN INTER- DISTRICT ANALYSIS
4.1 SUSTENANCE INSECURITY
4.1a. Population supported by cereal production
In Madhya Pradesh agriculture is a complex sector comprising physiographic, social and
ecological elements. The major constraints in the growth of agriculture in the state are:
1. Large run-off and soil erosion in most parts of the state resulting in water logging in
the early monsoon season and inadequate moisture in the latter part when needed the
most.
2. Nearly 75 per cent of cultivable area is subjected to rain-fed agriculture.
3. Inadequate, region specific technology development to match the rainfall patterns.
4. Vagaries of monsoon and frequent natural calamities.
The quantity of cereal produced in any region is a function of the region's physiography,
moisture availability and retention capacity, presence of irrigation facilities, availability of fertile
agricultural land, and also percentage of land available for agriculture. The five-year average
cereal production is comparatively high in the districts of Raipur, Durg, Dhar, Ujjain, Vidisha
West Nimar, Mahasamund, Chhindwara, Rajnandgaon, Balaghat, Gwalior, etc. Comparatively
low production is observed in Kawardha, Janjgir-Champa, Korba, Barwani, Umaria, Bilaspur,
Bhopal, Morena, etc.
The distribution shows that the maximum population pressure on cereal production is in the
districts of Janjgir -Champa, Bilaspur, Bhopal, Korba, Barwani, Jabalpur, Morena, Sidhi,
Shahdol, Indore and Sagar. Dantewara, Mahasamund, Hosangabad, Jashpur, Raipur, West
Nimar, Rajnandgaon, Dhar and Vidisha show a lower pressure of population on the cereal
production. The high population pressure in the district of Dewas and East Nimar is owing to
their large acreage under non-food crops such as soyabean and cotton. (Annexure IV, Table: 2,
Map: 1)
40
4.1b. Seasonality in cereal production
Madhya Pradesh is a predominantly kharif growing state. The major cereals grown during the
kharif season in different parts of the state include rice, jowar, bajra, maize, kodon-kutki, small
millets and tur. Wheat is the most important rabi cereal. The other produce during the rabi
season include gram, jowar, barley, oilseeds, etc.
Graph 4
Source: Department of Agriculture, MP
The distribution of data depicting seasonality suggests that all the districts of Madhya Pradesh
grow both rabi and kharif crops, the production being more in the case of kharif crops. However,
heavy dependence on the kharif season is observed in the Chhattisgarh region of Raigarh, Janjgir
-Champa, Jashpur, Mahasamund, Korba, Bastar, Bilaspur, Surguja and Durg. The eastern
districts such as Raigarh, Bilaspur and Surguja get abundant rainfall. Dependence on rabi crops
is more in the districts of Hosangabad, Indore, Tikamgarh, Morena, Bhopal, Ujjain, Sehore,
Raisen and Datia where more than 40 per cent of the net sown area is under irrigation. Khandwa,
Khargone, Mandsaur, Betul, Neemuch, Barwani, Jabalpur, Jhabua and Rajgarh have almost
equal dependency on both kharif and rabi crops. (AnnexIV- Table 3, Map- 2)
41

4.1c. Inadequacy of the Safety net
Creation of employment opportunities has always been an important objective of developmental
planning in India. The relatively higher growth of population and labour force has led to an
increase in the volume of unemployment and under-employment from one plan period to
another.
Existence of the safety net system is measured in terms of assistance received during scarcity.
Assistance is provided through employment generation under the Jawahar Rojgar Yojna and
Employment Assurance Scheme (EAS), employment generated by World Food Programme
(WFP) and food aid provided by WFP and CARE. The primary objective of such employment
schemes is the creation of additional wage employment opportunities during the period of acute
shortage of wage employment, through manual work for the rural poor living below the poverty
line. Through this, durable for community assets for sustained employment and development is
also created. The target group is generally the scheduled caste and scheduled tribes and parents
of child labour withdrawn from hazardous occupations who are below the poverty line.
At present the state of Madhya Pradesh produces about 16 million tonnes of foodgrains of which
about 9 per cent is goes to the national buffer stock. But owing to uncertain climatic conditions,
moderate to high transitory food insecurity can be experienced in one part of the state or the
other in almost all the years. The term 'household food security' is referred to as ' access by all
people at all times to enough food for an active healthy life'21. At the macro level, food security is
achieved by the state by: (a) having sufficient access to food for all its citizens-through
production, stocks or trade; and (b) guaranteeing everyone (right to) access. The design of the
public distribution system in India was to insulate the poor and the undernourished from the
sharp increases in foodgrain prices by providing them with subsidised foodgrain.
According to the India Human Development Report 1999, in Madhya Pradesh about 34.2 per
cent of households are using the PDS, and only 13.5 per cent of the per capita consumption of
foodgrains is met from the PDS. The percentage of requirement of cereals met by the PDS in
Madhya Pradesh is as low as 20.7 per cent.
The inadequacy of the safety net system is observed in Chhatarpur, Sehore, Shajapur, Ujjain,
Bhopal, Indore, East Nimar Vidisha, etc. The distribution also shows intense coverage of safety
net in the tribal districts of Jhabua, Bastar, Bilaspur, Surguja Raigarh, Dantewada, Chhindwara,
etc. (Annex-IV, Table 4, Map-3)
21 P. Vidyasagar, Public Distribution System and Food Security in a region of large Agricultural Instability42

4.1d. Composite sustenance insecurity index
The composite sustenance insecurity index has been constructed by taking up two out of three
individual indicators. These include population supported by cereal production and seasonality of
cereal production The inadequacy of the safety net indicator has been dropped because the data
only specifies its existence but not its outreach. Moreover, the indicator is intervention variable
and controls vulnerability. So while constructing the composite sustenance insecurity index this
indicator has been dropped.
The scale free value of population supported by cereal production and seasonality has been
added and divided by 2. (Annex-IV, Table-5, Map 4)
The composite score of sustenance insecurity shows that districts such as Bhopal, Bilaspur,
Morena, Janjgir-Champa, Jabalpur, Indore, Sagar, Bastar, Surguja, etc., are vulnerable to
sustenance insecurity whereas, Neemuch, Mandsaur, Betul, West Nimar, Rajgarh, Jhabua are in
a comparatively better position.
43

4.2 DISASTER
4.2a. Cattle and crop loss owing to natural disaster (flood, drought and hailstorm)
The quantity and distribution of rainfall play a vital role in agricultural production. Normal
rainfall in the months of June and July in Madhya Pradesh does very little damage to standing
crops. But heavy and continuous rains in September cause very heavy losses to the kharif crop.
Again, rising water level owing to heavy rainfall causes flooding in the rivers that also damages
crops, village property, and human lives and cattle population along the rivers. Landslides
resulting from extensive flooding causes terrible destruction in a very large number of villages to
human life, cattle and crops.
On the other hand, scanty and sporadic pattern of rainfall also affects the kharif crop. Although
all rainfall deficient areas are not affected by drought, the kharif crops wither owing to long dry
spells and extremely inadequate rainfall during the months July-August. Owing to scarcity of
fodder and drinking water, the cattle population belonging to small and marginal farmers and
landless labourers become vulnerable to epidemics and malnutrition. In Madhya Pradesh,
however, the loss of cattle owing to drought is minimal.
Loss of cattle and standing crops owing to hailstorms is becoming quite common in Madhya
Pradesh. The loss is more in the case of crops than cattle life.
The distribution shows that a maximum loss of cattle and crops owing to natural disaster is
experienced in Durg, Chhindwara, Raipur, Rajgarh, Jhabua, Rajnandgaon, Panna, Chhattarpur,
Balaghat, East Nimar and Mahasamund. However, Bilaspur, Dantewada, Dindori, Harda, Bastar,
Surguja, Shivpuri, Shahdol, Indore including most of eastern and central Madhya Pradesh do not
show much impact of natural disaster on the cattle population and crops. (Annex-IV, Table-6,
Map-5)
44

4.2b. Disaster proneness
Madhya Pradesh, the largest state in India with its vast expanse, varying geographical features
and climatic conditions has been perennially prone to drought conditions. Natural calamities,
particularly droughts are becoming an increasingly recurring feature in the state. The state has 19
per cent of the total dry land districts in the country. The drought in the districts is caused not
only by inadequate rainfall but also its unpredictability.
As declared by the Drought Prone Area Development Programme (DPAP) the districts of
Chhindwara, Betul, Dhar, Jhabua, Sidhi, East and West Nimar and Dantewada have more blocks
affected by drought. Most of the drought prone districts are situated in the southern hilly and
plateau region of the state characterised by 800-1,000mm of annual average rainfall and extreme
temperatures.
The drought endemic districts are Jhabua, Korba, Barwani and Sidhi and have more than 80 per
cent of the block area under DPAP.
The other drought prone districts are Kawardha, Guna, Betul, Chhindwara, Dantewada and
Umaria. (Annex-IV: Table –7, Map-6). The drought prone blocks in the districts are also
attached. (Annex IV, Table-7A).
45

4.2c. Composite disaster vulnerability index
The composite score of disaster was calculated dividing the aggregate value of disaster
proneness and cattle and crop loss by 2. The composite score indicates that the disaster prone
districts are Korba, Jhabua, Barwani, Sidhi, Dantewada, Chhindwara, Dhar, Durg, Panna, Guna,
Dantewada and Rajnandgaon. (Annex IV, Table-8, Map-7)
46
4.3 DEPRIVATION
4.3a. Households below poverty line
The data reveals that more than 50 per cent of rural households reside below poverty line in the
districts of Balaghat, Mandla, Dindori, Jabalpur, Katni, Rewa, Sidhi, Narsimhapur, Jhabua,
Kaker, Dantewada, Bastar, Damoh, Sagar, Umaria, Shahdol and Raisen. (Annex IV, Table-9,
Map8).
In Koriya, Mandla, Sehore, Surguja, Kaker, Dhar, Dindori, Dantewada, Betul, Barwani, Bastar,
and Jhabua more than half of the BPL households are tribal households, the proportion ranging
from 51 per cent in Betul to 94 per cent in Jhabua. On the basis of landholdings, out of the total
rural BPL households the districts with more than 60 per cent landless labourers' households are
in the districts of Bhopal, Damoh, Dewas, East Nimar, Gwalior, Hosangabad, Jabalpur, Katni,
Narsimhapur, Raisen, Rewa, Sagar, Satna, Shahdol, Shajapur, Shivpuri, Ujjain and Vidisha.
(Annex IV, Table-9A)
47

4.3b. Scheduled caste population
The total scheduled caste population of the state comprising 47 groups is 96.26 lakh that is 14.4
per cent of the total population of 66 million. Community-wise traditional occupational
distribution amongst the scheduled castes has revealed that five scheduled caste communities
namely Andhelia, Banchada, Dhamuk, Muskhan and Rujjhar are engaged in cultivation and as
agricultural labour. Four communities- in the Dahait, Kotwal, Khangar and Chitar work as
village chowkidaars; four scheduled caste communities- in Beldar, Silawat, Chitar, Bagria are
engaged in stone working and other artisans work; nine weaving communities are Bahna, Balai,
Chidar, Ganda, Katia, Kori, Mehra, Meghawal, Jhamral. Others are engaged in bamboo craft and
leather, dance and music, prostitution, and as bazigars, hunting of animals and trapping of birds.
Passis are engaged in distillation of liquor while bhangs and ghasis work as sweepers (safai
karmachari).
The districts of Shivpuri, Chhatarpur, Panna, Ujjain, Damoh, Rajgarh, Shajapur, Sagar, and
Narsimhapur have more than 12 per cent of the population living below the poverty line. 22
The total number of scheduled caste land holdings is only 9.69 lakhs(12.74 per cent) of the total
land holdings in the state and only 1.24 per cent scheduled caste families have land above 10
hectares.
The overall review of the developmental aspect of the scheduled caste has revealed that efforts
have been made to ensure adequate attention on the needs of scheduled caste from all the
relevant sectors. But generally, the socio-economic position of the scheduled caste communities
does not show significant improvement.
Comparatively higher concentration of scheduled caste population is found in Datia, Ujjain,
Chhattarpur, Tikamgarh, Shajapur, Bhind and Sagar. (Annex IV, Table-10, 10A, Map 9,9A)
22 BPL Census Survey, DPIP, Govt. Of Madhya Pradesh,1997-98. 48
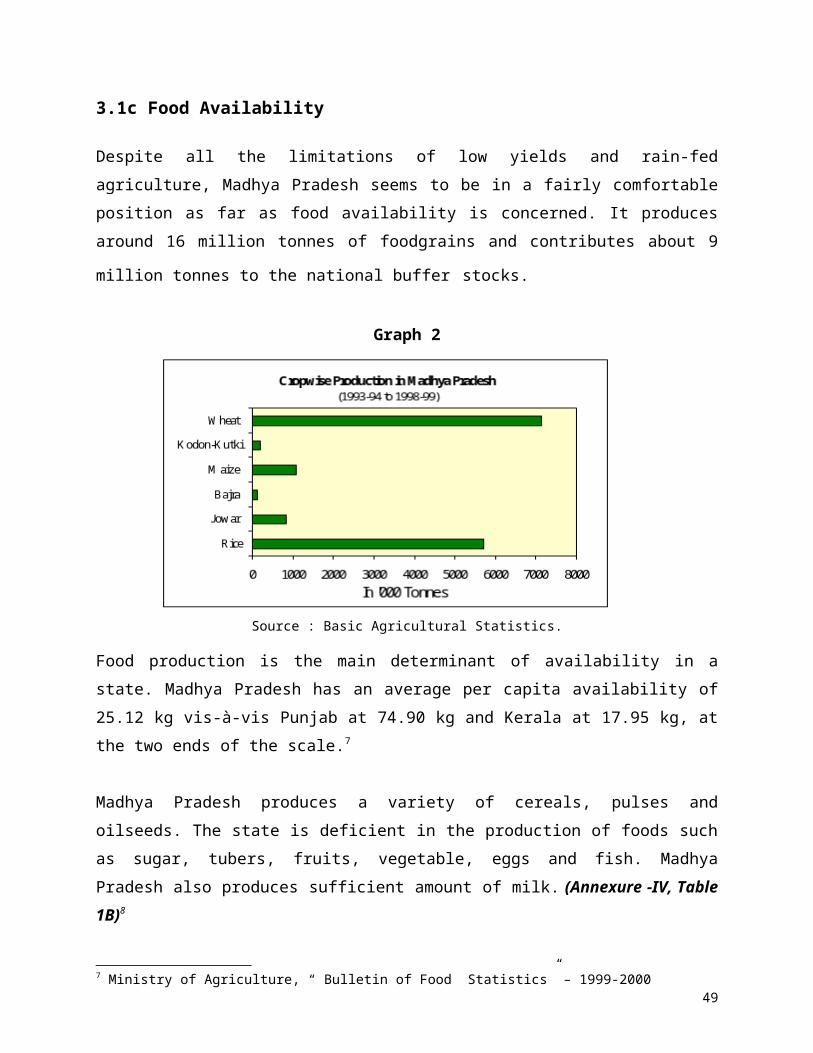
4.3c. Scheduled tribe population
Madhya Pradesh has the largest tribal population in India. The population of scheduled tribes in
the state is 154.03 lakh, which works out to 23.27 per cent of the total population of the state.
The area under scheduled tribe is 25,652 square miles, which is approximately, 15 per cent of the
area of the state.
There are 33 major tribes among the tribals that thrive in Madhya Pradesh. The main tribes of
Madhya Pradesh are: Gond, Bhil (Bhil, Bhilala, Barela, Patelia), Kol Baiga, Kanwar (kanwar, Kaur,
Cherwa, Rathia, Tanwar), Oraon , Bharia, (Bharia, Bhumia, Bhuinhar, etc) Habla or habli, Kokru,
Dhanka, Dhangad, Panika, Shahariya, Suar, Sawar etc.
The tribal population of Madhya Pradesh is dispersed in four geographical zones. The southern
zone comprising Bastar, Dantewada, Kanker, and Durg districts; The eastern zone comprising
Raigarh, Surguja, Bilaspur, Korba, and Sidhi districts; the central zone including Shahdol,
Mandla, Balaghat, Chhindwara, Betul and Seoni; and the western zone comprising Khargone,
Dhar Ratlam and Jhabua.
The scheduled tribes are a socio-economically backward section of the population. The Human
Development Report of Madhya Pradesh reveals that the literacy rate of the scheduled tribes is
21.5 per cent, which is less than half of the literacy rate of the total population of the state (44 per
cent). The female literacy among the scheduled tribes is as low as 10.6 per cent compared to 29
per cent for the state. The percentage of BPL households is also high in the tribal districts. More
than 50 per cent of BPL households out of the total BPL rural households are concentrated in the
districts of Jhabua, Kaker, Mandla, Dhar, Bastar, Barwani, Dantewada, Dindori, Betul, Sehore
Koriya and West Nimar. The tribal districts of Jhabua, Dantewada, Bastar, Kaker, Surguja have
more than 10 per cent of rural population with small holdings. More than 15 per cent of the rural
population in the Durg, Seoni, Raigarh, Bilaspur, Korba, Bastar, Dantewada, Kaker, Balaghat,
Surguja, Jhabua and Mandla have marginal holdings. 23
23 BPL Survey, DPIP, Govt. of Madhya Pradesh, 1997-98.49

Literacy is very low in the tribal areas of Madhya Pradesh. It was only 16.81 per cent in the rural
areas in the year 1971, which increased to 21.22 per cent and 28.2 per cent respectively in the
year 1981 and 1991.
An overwhelmingly majority in the tribals of Madhya Pradesh depends upon agriculture for their
livelihood. Their other sources of earning are hunting and collecting forest produce. Their
agricultural produce is normally more or less sufficient for their own consumption; they have a
little marketable surplus.
About half of the tribal area with an altitude ranging between 1,000-3,000 feet is covered with
forests. The terrain, which the tribals cultivate, is hilly and undulating. With the increasing
pressure on land, undulating land and steep slopes have been brought under cultivation with
consequent loss of fertility and soil erosion. The problem of soil erosion is predominant in
Jhabua, Chhindwara and parts of Mandla and Betul districts. Primitive cultivation techniques in
tribal areas and lack of the latest agricultural technology result in very low yield from the tribal
areas. Because of a considerable acreage under low value crops such as coarse rice, kodokutki,
the income of the tribal farmers is much lower compared to the non-tribal farmers. Owing to the
lack of irrigation facilities, the tribal cultivators are unable to raise cash crops such as pulses,
oilseeds, tobacco, etc.24
The launching of the Rajiv Gandhi Watershed Development Mission has brought about a
remarkable transformation in Jhabua. Once counted amongst the most backward and poverty
stricken districts, prone to drought and famine and unproductive is now smiling with greenery. A
proper sustainable management of water and soil resources with people's participation was key to
the success, where unskilled villagers were taught the art of arresting and storing water. Social
fencing was introduced to minimise the incidence of soil erosion and avert the loss of water.
Regeneration of forests in the socially fenced belts has pushed up the ground water level. The
abundant availability of grass has given a big boost to milk production leading to the cessation of
distress migrants from district. Villagers have set up grain banks, planted beneficial species such as
bamboo, acacia and mango and also there has been a shift towards cash crops such as cotton and
soyabean.
Radha Krishna Rao: The Jhabua Miracle; Kurukshetra, Vol48No.4 January 2000
24 Jain S.K, Madhya Pradesh-A state of Tribals and their traditional subsistence type of farming, Khadi Gramodyog , (May;1996) P- 379-382, # 42 (8)
50
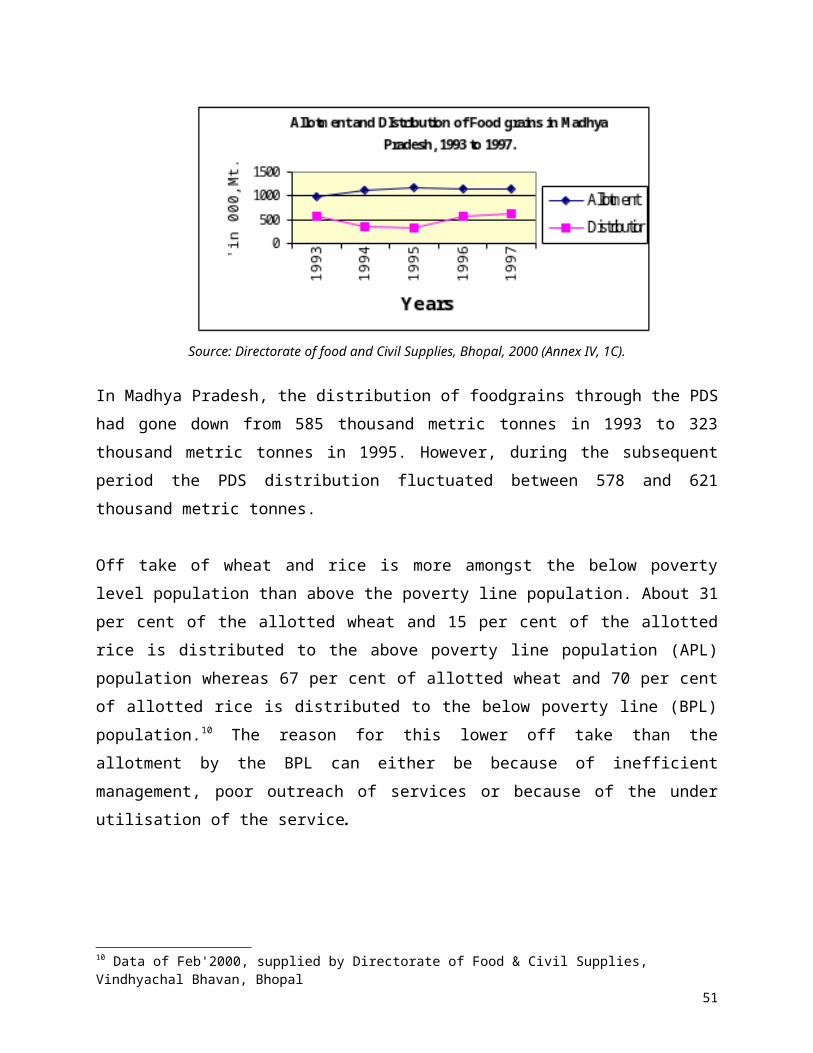
Sparseness of population and scanty communication system are some special features of the
tribal areas. Such a situation raises a real problem as to how the benefits of the development
programmes should be extended to a majority of the tribals living in interior areas.
The distribution shows that the tribal population constitutes more that 50 per cent population in
the districts of Jhabua, Dantewada, Bastar, Jashpur, Dindori, Surguja, Dhar, Shahdol, Kaker,
Mandla, and Umaria. Interestingly districts with greater scheduled caste population have a
smaller percentage of tribes. (Annex IV, Table-11, 11A, Map 10,10A)
51

4.3d. Net Migration
Agriculture, being largely rainfed, thus assures only one-season employment to the people. As in
the case of the in rest of India, the non-availability of off-farm employment induces people to
migrate. Even though this is seasonal migration, it has implications on food security. The
patterns of migration in the west and east of Madhya Pradesh are distinct. In the west people
migrate to the neighbouring states of Maharashtra, Gujarat, Rajasthan and to the industrial
complexes of Indore. In the western region, the proportion of population migrating and the
period of migration are higher than in the rest of the state. In a survey conducted by WFP, the
western region reported nearly 90 per cent migration during the period between December and
April. After the harvest of the kharif crop, they leave their villages in search of work since they
cannot raise a second crop. Thus, they remain away from their homes for four to six months
every year.
Migration in the central and eastern regions, though prevalent, is shorter lasting 15 days to a
month. In these regions people migrate to neighbouring villages to work on the farms of the large
landowners during weeding and harvesting activities. Since many parts of the east harvest a
second crop, there are at least three opportunities in a year for agricultural labourers to obtain
work.
A study conducted by WFP on “Assessment of Household Food Security and Impact of WFP
Food Aid in Madhya Pradesh” reveals that the migration pattern in the eastern and central
regions differs from that in the west in another aspect. In the eastern region, women did not
report migration; only men travel out of the villages for work in Jhabua and Dhar, however the
entire family travels to the town leaving behind one person to manage the crops and the
livestock. Migrants return to their villages in April when they pick mahua flowers and tendu
leaves. It is quite clear that the degree of insecurity and hardship is higher for these migrants who
have to spend nearly half the year in a different environment.
Lack of adequate employment opportunities is a direct result of the poor development of the off-
farm sector. This results in a significant proportion of people migrating in search of
employment.
52
Migration to cities both within the state and outside is very widespread in the state during the
period of crisis and under employment. Migration to cities and towns is usually to find
employment in sectors such as construction and small trading and manufacturing.
The distribution shows that out-migration is more than in-migration in the districts of Rewa,
Harda, West Nimar, Barwani, Kawardha, Narsimhapur and Mandla. The industrial districts of
Bhopal, Indore, Gwalior, Guna, and Jabalpur act as magnets and 'pull' people from other
districts. The mining districts such as Dantewada, Bastar, Kaker and Durg also offers ample
opportunity for earning livelihood, whereas Raigarh, Mahasdamund, Rajnandgaon, Raipur, Seoni
and Bilaspur also being mineral rich districts cannot offer enough livelihood opportunities. The
districts of Hosangabad, Sagar, Dindori, Mandla, Rewa have more than 26 per cent of landless
labourers who migrate during the lean season. (Annex -IV, Table 12, Map -11)
53

4.3e. Illiteracy
Planning for total economic development is based on social development. Social development
includes development in the fields of education, health, facilities of drinking water, housing,
women and child, scheduled tribes and caste, etc.
In August 1994, the Government of Madhya Pradesh identified the tasks universal primary
education and conducted a survey in 1996 to understand the problem of primary education in
terms of ' How many children do not go to school and who they are.' The data revealed that
access to primary education was a huge problem. The scattered habitation pattern in the tribal
areas, maximum non-enrolment, near-total irrelevance of government scheme of non-formal
education, and non-functional schools has aggravated the situation.
The distribution shows that more that 70 per cent illiteracy prevails in the districts of Dantewada,
Bastar, Jhabua, Surguja, Dhar Guna, Panna, Shivpuri, Rajgarh and Shahdol, etc. The incidence
of illiteracy is more common for tribal districts. Indore, Jabalpur, Bhopal, Gwalior and Durg
show less percentage of illiterates. (Annex -IV, Table 13,13A, Map, 12,12A)
54

4.3f. Agricultural labourer
Since the state of Madhya Pradesh is primarily agricultural, about 77 per cent of rural population
of the state directly or indirectly depends upon agriculture. Agriculture and allied services
contributes about 44 per cent share in the state economy and 78 per cent of its working force is
directly engaged in agriculture. Out of this about 29 per cent is works as agricultural wage
labourers. The main constituents of the agricultural labour force are landless labourers. Small
and marginal farmers also work as agricultural wage labourers as their small landholding cannot
sustain the livelihood of their family. Thus, the concentration of agricultural labourers indicates a
greater number of vulnerable people in the district.
The distribution shows that Narsimhapur, Jabalpur, Raisen, Harda, Hosangabad, East Nimar,
Vidisha, Damoh, Indore, West Nimar, Mahasamund Dhamtari, Satna, Katni, Sehore, Shajapur,
Ujjain, Raigarh, Durg, Bhopal, Raipur etc. have more than 30 per cent of agricultural labourers
to the total primary workers of the district. Jhabua, Morena and Dantewada have less than 10 per
cent of agricultural labourers. Again districts with more than 30 per cent agricultural labourers,
such as East Nimar, Sagar, Damoh, Shahdol, Umaria, Jabalpur, Katni, raisen, Narsimhapur and
Rewa have more than 25 per cent of landless labourers. Jhabua , Sarguja Koriya and Bastar,
however, have more than 18 per cent of marginal farmers25. (Annex-IV, table 14,14A, Map-13,
13A)
25 BPL survey, DPIP, Govt. Of Madhya Pradesh, 1997-9855
4.3g. Percentage of Working Children
Even after a hundred years of child labour legislation and fifty years of independence, child
labour is a common occurrence in India. Today, the incidence of child labour exceeds those of
any other country.
According to the International Labour Organisation (ILO) comprehensive definition: "Child
labour includes children prematurely living adult lives, working long hours for low wages under
conditions damaging to their health and physical and mental development, sometimes separated
from their families, frequently deprived of meaningful educational and training opportunities
that could open up for them a better future."
Children are found to be working in all the three sectors of the economy: the agrarian, industrial
and services sectors. The agrarian sector in India is characterised by poverty, illiteracy,
unemployment and encompasses time consuming activities for boys such as looking after
animals, gathering fodder and wood, sowing, reaping and weeding. In the case of girls, the
activities are milking animals, cooking, and looking after younger children.
The industrial sector is characterised by wage based child labour working under conditions of
acute exploitation in the industries. Children of marginalised families work as self-employed or
under-wage employment in the service sector.
The employment of children often provides an important supplement to the incomes of poor
families. But child labour frequently involves diverse forms of exploitation, in which the
beneficiaries are members either of another class or of another generation.
The dropout rates at the primary and middle levels are also high for the state (44.68 per cent in
1993-94); most of the school dropouts constitute the child labour force. Financial crises, and
economic necessity in a household forces a child to engage in household chores or work on the
family farm/business, or take a job as a paid labourer. Although apparently invisible, the school
dropouts engaged in domestic chores are potential child labour in the failure.
56

A study on tribal child labour of Bastar district of Madhya Pradesh26 reveals that the tribal child
labourers are very poor and easy victims of exploitation. Most of them are in debt and almost
three -fourths of their income goes into the pockets of moneylenders or businessmen by way of
repayment of loans. They are mostly engaged as coolies, or in the collection of forest produce.
Some are engaged in other occupations such as making bamboo baskets, earthenware, toys, etc.
The study also indicates that child labourers from the scheduled castes are mainly engaged as
agricultural labourers in the fields of moneylenders, while-non tribal child labourers are engaged
in business activities. They are the most oppressed class of the society living amidst the forest
with their traditional culture, precarious living conditions and unhealthy habits. Owing to
malnutrition and drinking habits their longevity is low and health is poor. While they are inclined
to start a business, or want some employment, illiteracy comes in their way.
The distribution shows that West Nimar, Kaker, Barwani, Dantewada, Bastar, Chindwara, East
Nimar, Betul, Jabalpur Rajnandgaon have comparatively high concentration of working children.
(Annex-IV, Table-15, Map-14).
26 Prasad Rohini and Jain NK; A Study on Tribal Child Labour of Bastar District of Madhya Pradesh, Khadi Gramodyog, Dec91, P-121-124.
57
4.3h Composite deprivation index
The composite deprivation index was calculated by aggregating all the scale free values and
dividing them by the number of indicators.
From the distribution, it can be observed that the tribal illiterate districts of Jhabua, Dantewada,
Bastar, Barwani, Dindori and the tribal districts of Chhindwara, Kaker are the poorest and also
have a high percentage of households residing below the poverty line. Panna and Katni also
come under the category of the most deprived districts
A comparatively better situation is seen in the districts of Indore, Morena, Gwalior, Bhind,
Bhopal, Durg, Datia, Neemuch and Sheopur. (Annex-IV – Table 16,Map15)
58

4.4 GENDER INEQUALITY
4.4a. Disparity in literacy
Despite the evidence that suggests high returns to society if girls are provided with primary education, there is a strong bias against sending girls to school specially in rural India. The low value attached to female education in much of India is linked with deep-rooted features of gender relations. The three very common features are as follows:
In rural India a large majority of girls are expected to spend most of their adult life in domestic work and child rearing. Thus, female education to most of the parents appears to be somewhat ‘pointless’.
The investments that parents make in the education of their daughter primarily benefit the ‘other’ family, once the daughter is married off. This strongly reduces the value of education from the parental self-interest point of view.
If an educated girl can only marry a more educated boy and if dowry payments increase with education of the groom, then parents will obviously be reluctant to educate their daughters.27
The above mentioned factors and other links between female education and gender relations result in female -male disparity in education.
A study conducted by the Lok Sampark Abhiyan in Madhya Pradesh showed that out of the many findings girl children were the most disadvantaged category of the population accounting for 33 per cent of non-enrolment. An in-depth study conducted in two districts of Ujjain and Surguja in Madhya Pradesh reveled that dropping out of school was heavily influenced by: (i) low parental interest and inadequate support for further schooling, especially for girls; (ii) lower educational aspirations among girls as compared to boys; (iii) indifferent teachers killing students’ desire to learn; and (iv) lack of conveniently located and adequately equipped schools. 28
The distribution shows that Shivpuri, Sheopur, Sidhi, Rajgarh, Shajapur, Guna, Morena, Umaria, DIndori and Kawardha etc. have higher incidence of gender disparity in literacy. On the other hand, Bhopal, Gwalior, Narsimhapur, Indore, Balaghat, West Nimar, Hoshangabad and Jabalpur etc. show a better picture. (Annex IV: Table 17, 17A: Map 16,16A)4.4b. Disparity in Infant morality Rate27 Dreze Jean & Sen Amartya; Indian Economic Development and social Opportunity,1996.P-13228 Veena Kulkarni (Nov. Dec 96.) Manushi P- 32-38,Why they drop out; Reasons for lower literacy among girls.
59
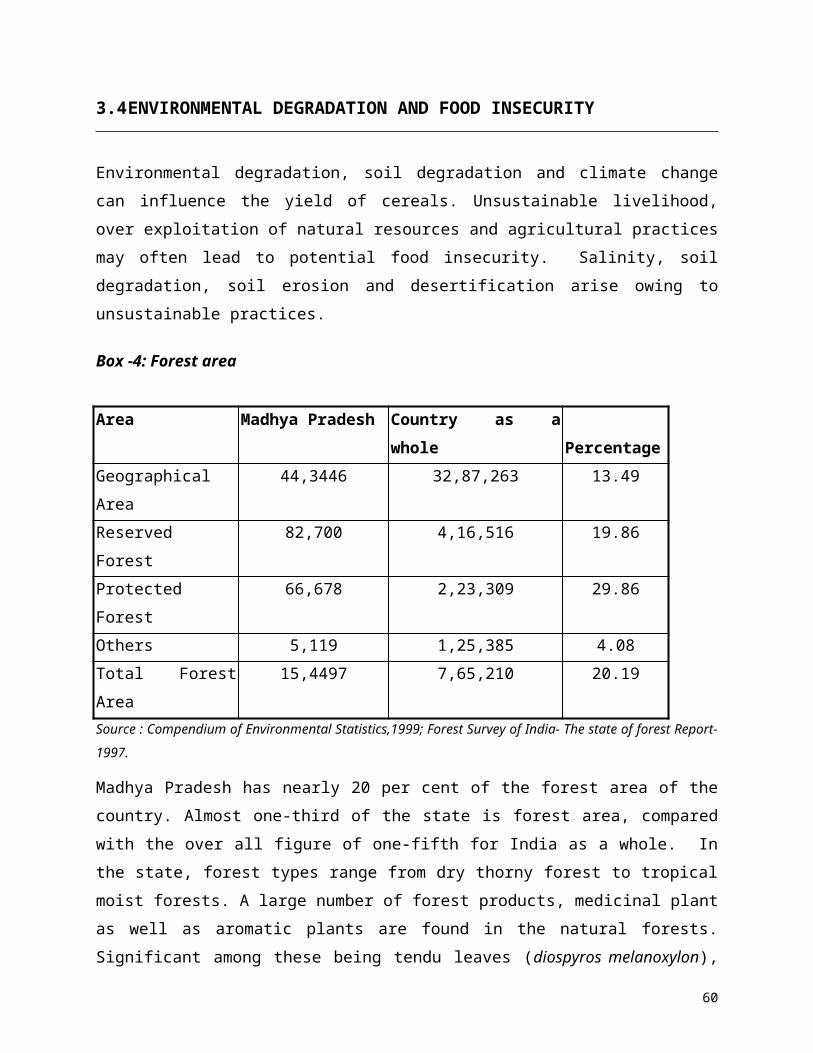
The NFHS report of Madhya Pradesh brings out the fact that female mortality occurs only after
the first month of life. Neonatal mortality is substantially high for males reflecting male frailty.
However, post neonatal mortality is 18 per cent higher for females than for males. According to
1992- 92 figures Madhya Pradesh occupies the 13th position out of 16 states of India as far the
gender development index (GDI) is concerned. The value is 0.312 for Madhya Pradesh as
compared to 0.388, which is the overall figure for India29. This reflects the situation of gender
disparity that exists in the state.
Female infants under one year of age may be less disadvantaged relative to males because
children of both sexes tend to be breast fed throughout infancy. Once breast feeding ceases,
however, the potential for differential treatment of males and females increases. This results in
disparity of male- female infant mortality.
The data relates to an estimate made in 1991 and was available for 45 districts. The data for the
parent district has been repeated for the new districts. Maximum disparity in IMR is observed in
the districts of Rajgarh, Guna, Shivpuri, Raisen, Dewas, Tikamgarh, Bhind, Chhatarpur,
Balaghat, Bhopal Gwalior, Harda, East Nimar etc. Lower disparity is observed in the tribal
districts of Shahdol, Umaria, Bastar, Dantewada, Barwani, West Nimar, Bilaspur and Damoh
and Rewa. (Annex IV: Table 18: Map 17)
29 The Madhya Pradesh Human Development Report 1998, Government of Madhya Pradesh60

4.4c. Disparity in under 5 MR
As against the overall state’s total sex ratio of 943 females per thousand males, the juvenile (0-5
years) sex ratio is better at 954. However, the NFHS report suggests that in Madhya Pradesh,
under 5 mortality rate is 22 per cent higher for females than for males. This reversal of sex
differentials in mortality after the age of weaning reflects relative nutritional and medical neglect
of girls after breast-feeding has ceased.
The incidence of gender disparity in under 5 mortality rate is high in the districts of Bhind, Datia,
Shivpuri, Shajapur, Dewas, Tikamgarh, Rajgarh, Guna, Chhatarpur and Jhabua. The situation is
comparatively better in Damoh, Sagar, Sidhi, Koriya Jashpur and the tribal districts. (Annex IV:
Table 19; Map 18,)
61
4.4d. Sex Ratio
The 1997 census recorded a sex ratio of 927 females to every 1,000 males, an all time low (934
in 1981) in the female-male ratio in the Indian population. This is very surprising because all
possible data suggests a narrowing down in gender-differentials in mortality. Rather,
countrywide sex selective migration could not have been a major factor in the decline in the
female ratio during a period of narrowing gender gap in death rates the decline in female ratio
can be the result of large female deficits occurring at birth.
Sex ratio in Madhya Pradesh has shown a gradual decline from 990 females per 1,000 males in
1901 to 941 in 1971 and 1981. Following the countrywide trend of decreasing sex ratio, Madhya
Pradesh also recorded an all time low of 931 females per 1,000 males in 1991.
However, the sex ratio in age group 0-16 years in our study reveals that Morena, Datia, Gwalior,
Chhatarpur, Vidisha, Tikamgarh, Chattarpur and Damoh districts of Madhya Pradesh show a
high discrimination against females. A comparatively better situation exists in the south and
southeastern and tribal districts of Madhya Pradesh.. (Annex IV: Table 20, Map 19,)
62
4.4e. Composite Gender Inequality Index
The composite gender inequality index was calculated by dividing the aggregate value of all the
four indicators by 4. The composite score indicates that Bhind, Shivpuri, Datia, Rajgarh, Guna,
Sheopur, Tikamgarh, Morena, Shajapur, Chhatarpur and Dewas etc., show maximum gender
disparity. The districts that reflect gender equality to some extent are Durg, Seoni, Korba,
Bilaspur, Chhindwara, Betul, Jabalpur etc. (Annex IV: Table 21: Map 20).
63

4.5 MALNUTRITION AND MORTALITY
4.5a. Infant Mortality Rate
In Madhya Pradesh although the infant mortality rate is high, it has seen a decline since 1981.
The IMR in 1981 for rural areas in Madhya Pradesh was 152 as against a figure of 80 for the
urban areas. The combined IMR was 142. This rate declined to 125, 74 and 117 for rural, urban
and MP as whole in 1991. The state's progress in reducing the infant mortality from 196 per
thousand live births in 1950 to 97 by 1996 is significant. The declining trend of IMR can be
observed in the following graph. The estimated total infant mortality rate is 98 in the 1998. The
IMR for the rural area is 104 and for the urban area it is 56 (1998).
Graph 5
Source: SRS data
The Mission on Control of Diarrhoea Diseases had estimated that 28 per cent of the state's infant
mortality was on account of easily preventable diarrhoeal diseases. The vital registration system
has the primary responsibility to provide the data up to the district level. But owing to a very
poor birth and death registration system, a parallel system of sampling of birth and death
(Sample Registration System) is developed and this provides the estimates of different fertility
and mortality measures at the state level. District level IMR is an indirect estimate done from
census figures of population. All these exercises are carried out by the Office of the Registrar
General of India. The latest data (1991) for this is up to the district level. (Annex IV: Table 22,)
64
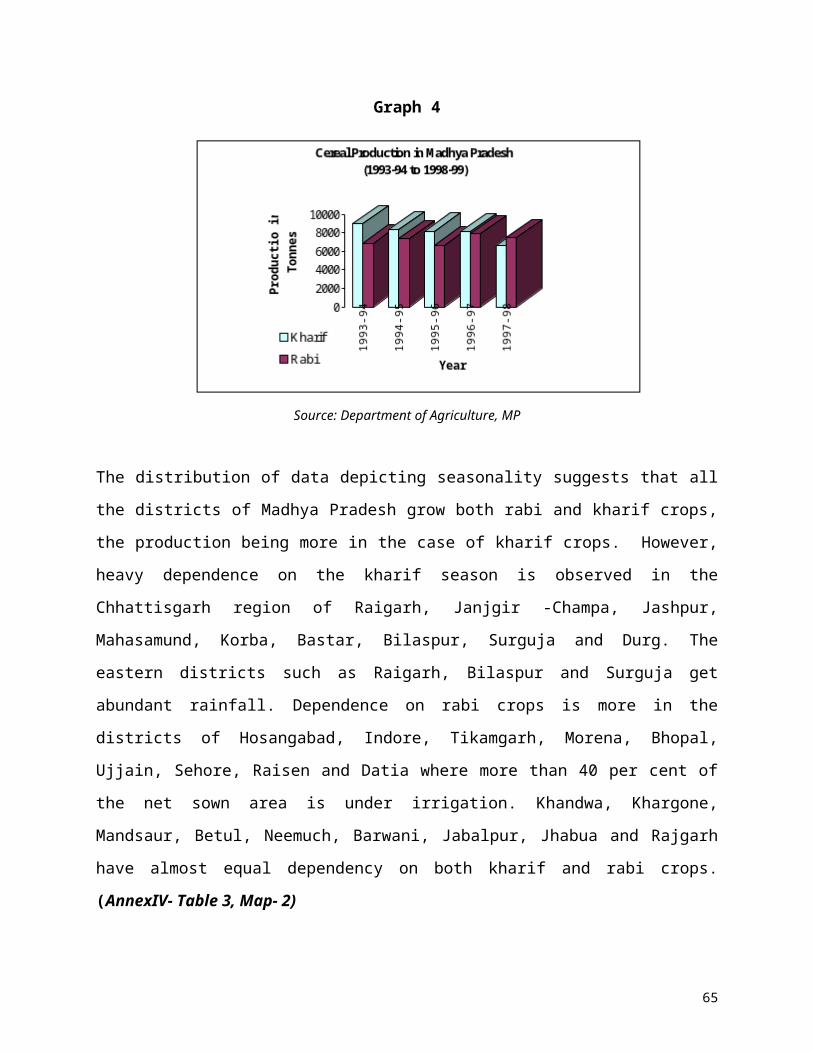
The distribution in Madhya Pradesh shows that IMR is very high, almost double the state's
average, in the districts of Betul, Damoh, Rewa, Tikamgarh, Chattarpur, Satna, Raisen, Balaghat,
Hosangabad and Sagar. The IMR in the Tribal districts of Bastar, Dantewada, Dhar, Bilaspur is
almost equal to the state's average. Infant morality rates that are less than the state's average are
observed in the districts of Shajapur, Ujjain, Indore, Jhabua, Bhopal, Koriya, and Surguja. (Map
21)
65

4.5b. Under 5 Mortality Rate
According to the NFHS survey report, child mortality rate is greater in the backward districts and
rural areas than the urban areas. The survey also suggests that child mortality is higher for births
in the case of mothers under 20 years of age than for births in the case of mothers in the age
group 20 years and above. Higher birth order also increases child mortality as the child after
weaning faces intense competition for nutritious food.
The data on Under 5 mortality rate was available only for 45 districts and the value for parent
districts was used for the newly formed districts. The distribution shows that a very high
incidence of child mortality rate is seen in Panna, Satna, Shivpuri, Chhatarpur, Rewa, Guna,
Damoh, Vidisha, Hoshangabad etc, whereas comparatively low incidence of under 5 morality
rate is seen in Indore, Dhar Bhopal, Koriya, Surguja, Gwalior etc. (Annex-IV, Table-23, Map
22)
66

4.5c. Prevalence of Malnutrition
Malnutrition is most often clinically observed as stunting, tissue wasting, cognitive and
behavioural deficits, or, in extreme form, a disease of starvation (e.g., kwashiorkor, marasmus).
The percentage in this category indicates the prevalence of chronic under nutrition, which often
results from failure to receive adequate nutrition over long period of time or from chronic or
recurrent diarrhoea. Height for age, therefore, does not vary appreciably by the season in which
data are collected.
The NFHS-1992 data reveals that on an average almost 50 per cent of the children in Madhya
Pradesh suffer from malnutrition. More than 65 per cent of children are stunted in the districts of
Rajnandgaon, Raipur, Raigarh, Mahasamund, Korba, Bilaspur, Dantewada, Bastar, Durg and
Jashpur etc. However, the districts of Chhatarpur, Damoh, Koriya, Panna and Rewa are in a
slightly better position with more than 50 per cent of the children being undernourished. (Annex-
IV, Table-24, Map-23)
67

4.5d. Population supported by AWC
The objective of the ICDS programme is to reduce child malnutrition, morbidity and mortality
and ensure optimal, physical, mental and psycho-socio development of India's children through a
package of six services delivered from the anganwadi centre. The package includes:
supplementary nutrition, immunisation, health check-up, referral services, treatment of minor
illness, growth monitoring and promotion, nutrition and health education for adolescent girls and
all women and early childhood care and pre-school education. (Annex IV: Table 25)
The tribal districts of Mandla, Kaker, Surguja, Jashpur, Bastar, Dhar, Dantewada, Dindori, and
Jhabua have population pressure on the AWC well below established standards. However, the
tribal districts with higher population pressure than the established norm is observed in the
districts of Betul, Korba, Seoni, Koriya, Barwani, Chindwara, Raigarh, Shahdol and Umariya.
The non-tribal districts of Rewa, Kawardha, Satna, Janjgir- Champa, Shivpuri Mandsaur
Narsimhapur etc have a population more than 1,000 under each AWC. (Map 24,)
68
4.5e. Composite Malnutrition and Mortality Index
Mortality index was constructed by aggregating the value of infant and child mortality rate and
dividing the value by two. The mortality score was then added with the malnutrition index and
divided by the number of indicators.
The score reveals that Raisen, Betul, Damoh, Hosangabad, Rajgarh, Balaghat, Rajnandgaon,
Kawardha, Rewa and Sehore, etc are more prone to malnutrition and mortality. Koriya, Surguja,
Gwalior, Indore, Bhind, Ujjain, Morena, etc., are in a comparatively better position. (Annex IV:
Table 26, Map 25)
69

4.5f Composite Vulnerability Index With All Broad Categories
To project the food insecurity or vulnerability scenario of the state, a composite vulnerability
index was constructed with all the broad categories (with 18 indicators out of 20 excluding
inadequacy of safety net and population supported by AWC). The composite score of the broad
categories were added up and divided by 5.
The highest score with respect to vulnerability goes to Kawardha, Jhabua, Korba, Barwani,
Sidhi, Umariya etc. Comparatively less vulnerable districts are Tikamgarh, Balaghat, Raigarh,
Durg, Raipur etc. However, the lowest score in terms of vulnerability goes to Neemuch,
Mandsore, Gwalior, Indore, Koriya, Ujjain, etc. (Annex IV: Table 27, Map 26)
This scenario differs from that of the human development index of the stated in the Human
Development Report of Madhya Pradesh, 1998, since the indicators chosen for the two are quite
different. However, Jhabua, West Nimar, Panna, Shahdol, Betul, Chhatarpur, etc. are also shown
as vulnerable in the human development index. In the case of the gender related development
index specified in the Madhya Pradesh Human Development Report, 1998 a similar trend is
noticed with Durg, Seoni, Indore and Bilaspur revealing a better stand and Bhind, Guna, Morena
reflecting a gender bias.
70
CHAPTER V
INTERDEPENDENCY AND COMPOSITE VULNERABILITY
SCENARIO
5.1 AN ANALYSIS OF INTERDEPENDENCY OF INDICATORS
An analysis of the interdependence of the indicators suggests that a large part of the areas
inhabited by scheduled tribe population is disaster prone. A very significant positive relationship
between the disaster proneness, illiteracy and incidence of working children is observed. To cope
with the natural disaster, children are busy earning a livelihood and therefore are unable to attend
schools. However, the interrelationship also suggests a negative relationship between the
scheduled caste population and disaster.
A significant positive interrelationship between BPL households and scheduled tribes reflects
the vulnerability of the community. However, the scheduled caste population has been able to get
integrated with the local economy and exhibits a negative relation with poverty. A high
incidence of working children is also noticed in the BPL households. A negative but very
significant relationship has been found between the BPL households and sex ratio. This only
explains the fact that there are a greater number of females in the poverty stricken areas and that
males have migrated out for better livelihood opportunities.
The scheduled caste population is mainly concentrated in the areas where disaster proneness is
low. They are economically stable and show a negative correlation with households below the
poverty line, working children, malnutrition and illiteracy. The population pressure on
anganwadi centres is high in the areas with a concentration of scheduled castes. However, among
the scheduled caste population there seems to be a high level of gender discrimination in Madhya
Pradesh which gets reflected in the strong positive relationship that the scheduled castes bear
with the sex ratio and disparity in the under 5 morality rate. The under 5 mortality rate is also
very high in the areas with higher percentage of SC population.
On the contrary, the scheduled tribes share a negative relationship with disparity in IMR, disparity in under 5 mortality rate and sex ratio. This suggests that socio-cultural discrimination against the girl child in the tribal society is relatively less. The scheduled tribes however, are economically very backward having a high incidence of poverty, child labour and illiteracy.
71

Malnourishment is prevalent amongst the scheduled tribe population. Intervention through a network of anganwadi centres has been attempted to improve the child health care system in these areas. Thus, the population pressure on these centres is low in the scheduled tribe concentrated areas.
A very strong positive relationship between in-migration and IMR and under 5 mortality rate has been observed. This may be owing to the fact that basic health facilities are inadequate in those areas from where the population is migrating. The livelihood opportunities being low, the migrating population do not have enough money for medical treatment. It is possible that the areas where they are migrating to, lack in basic health facilities and the living condition is also very unhealthy without proper ventilation, water and sanitation facilities. It is also possible that the quality of life in these areas might have deteriorated as a consequence of excessive in-migration and absence of corresponding increase in facilities.
The incidence of illiteracy is greater in the disaster prone and tribal areas. The percentage of child labour is also significantly high among the illiterate population. The significant positive relationship between illiteracy and disparity in literacy suggests that in districts with low literacy, level of female literacy work out as very low causing high disparity in literacy.
Agricultural labourers belong to poor households as expected and interestingly have a very low gender discriminatory attitude that is reflected through their negative strong relationship with disparity in literacy.
One would also infer from the strong positive correlation that the incidence of working children is high amongst the households living below the poverty line, scheduled tribe population and they are mostly illiterates and malnourished. [
There is a strong positive correlation between disparity in IMR and disparity in under 5 mortality rate. A strong and positive relation between disparity in under 5MR and sex ratio indicates that high disparity in under 5 mortality rate results in a high sex ratio.
IMR and under 5 mortality rate are strongly correlated with each other and under 5 mortality rate is also positively related to disparity in under 5 mortality rate and sex ratio. The positive relationship of under 5 mortality rate with population supported by anganwadi centres suggests that the AWC are not adequate in the areas with high under 5 mortality rate. The negative relationship between the mortality indicators and malnourishment cannot be justified. The weakness of the data on malnourishment may be the cause for this strange interrelationship.
72

5.2 IDENTIFICATION OF CORE INDICATORS
The main objective of this study is identification of food insecure areas. Therefore it becomes
essential to identify a few core indicators that are playing a major role in causing food insecurity.
An analysis of the interdependency of the indicators helps us in identifying some crucial
indicators of food security.
The selection of the indicators has been made on the basis of correlation coefficient matrix. For
this we to selected at least one indicator from all the five broad categories.
An overview of the correlation matrix suggests that none of the indicators in the sustenance
insecurity category emerge as having an impact on food security. This could be attributed to the
fact that despite all the limitations of low yields and rain-fed agriculture, Madhya Pradesh seems
to be in a fairly comfortable position as far as food availability is concerned. There is no shortage
of basic food availability as in the case of Kerala, Tamil Nadu, Gujarat and Maharashtra. This
prompted us to drop the category from the core composite index.
Disaster proneness of the districts has emerged as a major component leading to food insecurity
in Madhya Pradesh. Cattle and crop loss owing to disaster in Madhya Pradesh is not of much
significance in the overall developmental dynamics of the state.
Poverty seems to be an important component that reduces accessibility to food. The fact that a
household is sending children to the labour market shows that the household is suffering from
basic food insecurity. These two indicators were picked up from the deprivation category.
Education has often been identified as an important factor in ensuring accessibility to food and
bringing about awareness about nutrition. Literacy ensures better chances of employment, gives
better capability to tap the benefits from developmental programmes and also makes people
aware of their rights and responsibilities. Female illiteracy has a direct bearing as a literate
mother can have a positive contribution to the family by ensuring a balanced diet. Female
illiteracy is an area of major concern in Madhya Pradesh. Disparity in literacy was selected from
the gender inequality category to reflect the gender dimension of food insecurity.
From the malnutrition and mortality category, population supported by the anganwadi centre was
dropped because it is an intervention variable, which controls vulnerability. The weak data of
malnourishment also prevented us from selecting this indicator. Also, lack of correlation gets 73
reflected in the correlation coefficient matrix. In view of the above under 5 mortality rate was
chosen to represent the manifestation of food insecurity.
Thus, composite index with the core indicators was constructed with the following indicators:
1) Disaster proneness
2) Below poverty level households
3) Working children
4) Disparity in literacy, and
5) Under 5 mortality rate.
The highest composite score goes to Betul, Korba, Kawardha, Dantewada, Sidhi, Barwani and
Jhabua, which are the most vulnerable districts. Indore, Bhopal, Gwalior, Hosangabad, Morena
and Durg are comparatively food secure districts. (Annex - IV, Table 29, Map 27 ).
74

CHAPTER VI
HOUSEHOLD LEVEL COPING STRATEGY
As identified from the study, food insecurity in the state of Madhya Pradesh can be attributed to
factors such as fluctuating weather conditions leading to severe droughts, undulating terrain with
little or no capacity of conserving water, steep slopes with high surface runoff, unavailability of
drought resistant variety of quality seeds, agricultural practices and inadequate safety net system.
The coping capacity of the community from such food insecurity depends upon the severity of
the exposure to natural hazards and also upon the quantity and quality of asset holdings of the
household as well as families to mitigate the scarcity.
An average family is secured for 6-7 months in a year from the agricultural produce such as
maize, paddy, millet and gram. The earnings from cash crops such as oilseeds, groundnuts, etc.
enhance the food purchase power of these cultivators. For the rest of the year these families
depend upon purchase from the open market or the public distribution system.
Families who have some assets other than land also, to some extent, have a coping ability. The
presence of livestock ensures additional nutrition intake as well as additional income earning
from livestock produces. In extreme cases, selling of livestock at low prices is a common
phenomenon. However, during a crisis period the animals are often set free, as they become
unable to feed the livestock.
Landless families and communities living near the forest, however, depend largely upon the
forest produce during a crisis. The forest provides fruits, mushrooms, tubers, roots, etc. for
household consumption. During the crisis period employment of the communities for few
months are ensured. They maintain the forest through planting and nursery raising. The forest
also supports the households by providing income sources. Communities collect and sell forest
produce in the local market and make an earning. The fodder collected from the forest also
supports the livestock population.
75
Since Madhya Pradesh is primarily an agricultural state, the indigenous source of livelihood for
the communities is agriculture. A majority of the households are dependent upon agriculture.
With the regular incidence of drought in the state, the cultivators have adopted various
techniques of coping. The multiple cropping system has replaced the mono-cropping pattern.
Drought resistant seeds are sown. Use of chemical fertilizers has been increased to raise the
yield.
Borrowing and purchase of foodgrains from the traders is a very common coping strategy.
Households borrow foodgrains from relatives or traders. Food loans are also taken at a very high
rate of interest. The grains borrowed are repaid back immediately after the harvest.
At times, landless families earn their livelihood by working as wage labourers. To find an
alternate source of income, families migrate to relatively well-off districts nearby as well as other
states. They also get absorbed in the food-for-work programmes provided by the state during the
lean season. They earn wages partly in cash and partly in kind; non-farm employment provides a
significant source of income to the migrating families.
Within a household, people reduce the size of the meal during scarcity. They adapt towards
eating foods that are less preferred (small millets, kodonkutki tubers, roots, leafy vegetables,
etc.). Sometimes, reducing the meal size is not enough and so they even skip meals. The
communities have started building grain banks and village distress funds so as to cope with food
insecurity that prevails during the crises period.
76
77

Annex-1
Sl No. Individual Indicators National Average
State Average Source
1 Agro-Climatic Zones of Madhya Pradesh Madhya Pradesh Web Site, Directorate of Agricultural Statistics.
2 Population supported by cereal production - 58
Basic Agricultural Statistics, Commissioner of Land Records and Settlement, Gwalior, Madhya Pradesh 1999, Census of India,1991
3 Seasonality in cereal production - - Basic Agricultural Statistics, Commissioner of Land Records and Settlement, Gwalior, Madhya Pradesh, 1999.
4 Inadequacy of safety net system - - Employment Assurance Scheme, Directorate of Rural Development, of Madhya Pradesh, WFP, CARE, Census of India, Web Site,1991
5 Cattle and crop loss due to disaster - - Revenue Department, Government of Madhya Pradesh. (1995-99), Basic Agricultural Statistics, Commissioner of Land Records and Settlement, Gwalior, Madhya Pradesh
6 Disaster proneness Drought Prone Area Programme, Directorate of Rural Development, Government of Madhya Pradesh
7 Households below poverty line 37 44 District Poverty Initiative Programme, 1998, Madhya Pradesh.
8 Distribution of scheduled caste population 16.48 15 Census of India, 1991, Web Site of Madhya Pradesh for data on 61 districts
9 Distribution of scheduled tribe population 8 23 Census of India, 1991, Web Site of Madhya Pradesh for data on 61 districts.
10 Net migration - - Census of India, 1991
11 Illiteracy rate 47.79 64.54 Census of India, 1991, Web Site of Madhya Pradesh for data on 61 districts
78

Sl No. Individual Indicators National Average
State Average Source
12 Concentration of agricultural labourers - 29.18 Census Of India, 1991, Web Site of Madhya Pradesh for data on 61 districts
13 Working children 5.3 6.3 Census of India, 1991
14 Gender disparity in literacy 1.64 2.04 Census of India, 1991, Web Site of Madhya Pradesh for data on 61 districts
15 Gender disparity in infant mortality rate -- 0.98 Estimates of child mortality indicators by sex, Sample Registration System(SRS), Census of India, 1991
16 Gender disparity in under 5 morality rate - 1.04 Estimates of child mortality indicators by sex, Sample Registration System(SRS), Census of India, 1991
17 Sex ratio 1083 1080 Census of India, 1991, Web Site of Madhya Pradesh for data on 61 districts
18 Infant mortality rate 79 133 Estimates of child mortality indicators by sex, Sample Registration System(SRS), Census of India, 1991
19 Under 5 mortality rate 113 147 Estimates of child mortality indicators by sex, Sample Registration System(SRS), Census of India, 1991
20 Prevalence of malnutrition among under 5 years
41.4 60. 96 NFHS -1992, (unpublished report).
21 Population supported by anganwadi centre - 995 Department of Women and Child Development, Bhopal, Madhya Pradesh
79
Annex - IIADDITIONAL INDICATORS RELATED TO FOOD SECURITY [Availability with the sources]
Indicator Sources with contact person Level latest period of availability
1 Irrigated land as percentage to total cultivated land, sources of irrigation, production of crops under irrigated lands
Basic Agricultural Statistics, 1998 (45 districts)Mr. Jatav, Jt. Director, Mr. Nimbh, Deputy Commissioner of Land Reforms and Settlement, Moti Mahal, Gwalior
Districts 1997-98
2 Crop yield per unit area by crops II3 Crop yield per unit area by years Do4 Hectares of land damaged by natural
disastersSmt. Mala Srivastava, Principal Secretary to Govt Revenue Department and Relief Commissioner, Ballabh Bhavan, Madhya Pradesh
District with mention of blocks
1999
5 Frequency of manmade disasters N.A6 Number of people affected by manmade
disastersN.A
7 Number of fair price shops, monthly allocation and distribution of PDS, Number of ration cardholders.
Mr. Vinod Semwal, Director, Mr. P.N. Singh, Joint Additional Director, Directorate of Food and Civil Supplies, Vindhyachal Bhavan, Madhya Pradesh.
District Monthly update, 2000
8 Item wise allocation and distribution in districts, distribution among APL & BPL
Mr. Vinod Semwal, Directorate of Food and Civil Supplies
District / Yearly
Monthly update, 2000
9 Number of months households are able to provide their own food requirements
N.A
10 Per cent of villages with PDS shops within 10 km
Directorate of Food and Civil Supplies, Census of India, 1991, Village and Town Directory, Madhya Pradesh
Village
11 Per cent of villages with a market within 30 km
Census of India, 1991, Village and Town Directory Madhya Pradesh
Village 1991
12 Population density per sq.km. Census of India, 1991, Village 199113 Population growth rate " Village 1981-199114 Average size of households " Village 199115 Percentage planted to cash crop of cultivated
areaBasic Agricultural Statistics, 1998 (45 districts)Mr. Jatav, Jt. Director, Mr. Nimbh, Deputy Commissioner of Land Reforms and Settlement, Moti Mahal, Gwalior
District 1992-93
16 Foodgrain loss due to lack of storage, a transportation, etc.
N.A
80

Annex - IIADDITIONAL INDICATORS RELATED TO FOOD SECURITY [Availability with the sources]
17 Per cent of landless agricultural labour Census of India, 1991, District Census Handbook, Madhya Pradesh
Village 1991
18 Farm harvest prices of principal crops in Madhya Pradesh
Basic Agricultural Statistics, 1998 (45 districts)Mr. Jatav, Jt. Director, Mr. Nimbh, Deputy Commissioner of Land Reforms and Settlement, Moti Mahal, Gwalior
State 1999
19 Annual average rainfall in mm(1993-97) Basic Agricultural Statistics, 1998 (45 districts)Mr. Jatav, Jt. Director, Mr. Nimbh, Deputy Commissioner of Land Reforms and Settlement, Moti Mahal, Gwalior
District 1997
20 Monthly rainfall in mm. Mr. P.V. Pillai, Director and the Additional Director General of Meteorology (Research), Mr. Prakash Rao, Director, Data Centre. Meteorological Office, Shivaji Nagar, Pune, 411005, Phone- 5535211, 5535245, Telefax- 553-3201
Observation centre wise
1996
21 Per cent of villages connected by pucca road(rail/ road or other communication facilities).
Census of India, 1991, Town and Village Directory, Madhya Pradesh
Block 1991
22 Coverage under growth monitoring (wt./age) for children up to 5 years
Amitabh Awasthi, Deputy Director, Department of Women and Child Development, Bhopal, Madhya Pradesh
District 1999
23 Sex ratio Census of India, 1991, Registrar General of India, New, Delhi.
District 1991
24 Maternal mortality rate, birth rate, death rate, natural growth rate, crude birth rate, infant mortality rate
Mr. S.K. Sinha, DRG, Sample Registration System, Office of the Registrar General of India, New Delhi.
State 1998
25 General fertility rate, total fertility rate, gross reproduction rate, general marital fertility rate, total marital fertility rate.
Mr. S.K. Sinha, DRG, Sample Registration System, Office of the Registrar General of India, New Delhi.
State 1998
26 Prevalence of protein/energy malnutrition Dr. N. C. Saxena,/ Dr. Tooteja, Indian Council for Medical Research, Ansari Nagar, New Delhi
State Study continuing
27 Prevalence of Vitamin A deficiency Dr. N. C. Saxena, Dr. Tooteja, Indian Council for Medical Research, Ansari Nagar, New Delhi
State Study continuing
28 Prevalence of iodine deficiency Dr. N. C. Saxena, Dr. Tooteja, Indian Council for Medical Research, Ansari Nagar, New Delhi
State Study continuing
29 Radio sets per person Annual Report, Akashbani, June-1999 Country 1999
81

30 Per cent of female headed household NAAnnex - II
ADDITIONAL INDICATORS RELATED TO FOOD SECURITY [Availability with the sources]
31 Net enrolment rate Human Development Report, Madhya Pradesh,1998. District 199832 Enrolment by gender Sixth All India Education Survey, National tables, Vol.IV,
NCERTDistrict 1998
33 Enrolment in primary schools Sixth All India Education Survey, National tables, Vol.IV, NCERT
State wise 1998
34 Estimated enrolment of all classes - rural, scheduled caste, scheduled tribes, urban
Sixth All India Education Survey, National tables, Vol.VI, NCERT
Statewise. 1998
35 Per cent of villages with health services within 10 km
Census of India, 1991, Town and Village Directory, Madhya Pradesh.
Village 1991
36 Per cent of villages with safe drinking water facility
Census of India, 1991, Town and Village Directory, Madhya Pradesh , Rajiv Gandhi Water Commission
Village
82
Annex-III
BIBLIOGRAPHY
1. Helen R. Sekar, Child Labour Legislation in India, A study in Retrospect and
prospect, V.V. Giri National Labour Institute, 1997,Noida,U.P.
2. Government of Madhya Pradesh, Madhya Pradesh Human Development Report,
1998, Bhopal.
3. Government of Madhya Pradesh, Directorate of Economics and Statistics; Economic
Survey of Madhya Pradesh, 1999-2000, Bhopal.
4. Gerry, Rodgers and Guy Standing Edited, Child Work, Poverty and underemployment,
ILO.
5. Government of Madhya Pradesh; International Institute for Population Sciences,
Bombay, National Family Health Survey, Madhya Pradesh, 1992.
6. Registrar General, India SRS Bulletin, Sample Registration System, Vital Statistics
Division,.Vol.33, No. 1, April 2000,Delhi.
7. P. Vidyasagar, Food Security and Public Distribution System in a region of large
Agricultural Instability, 1995, IDS, Jaipur.
8. Radha Krishna Rao: The Jhabua Miracle; Kurukshetra, Vol. 48 No.4, January 2000.
9. Govt. of Madhya Pradesh, Directorate of Economics and Statistics, Madhya Pradesh
ka Sankhiyaki Sankshep, Bhopal, 1998.
10. Govt. of Madhya Pradesh, Directorate of Economics and Statistics, Madhya Pradesh
ka Samajarthik Vikas Sanketak, Bhopal, 1995-96, 1996-97,.
11. Govt. of Madhya Pradesh, Panchayat Evam, Gramin Vikas Bibhag, Gramin Vikas
Karyakramo ka Action Plan: 2000-2001, hetu Samanya Nirdesh, Bhopal, 2000.
12. Govt. of India, Ministry of rural development Employment Assurance Scheme
Guidelines, Bhopal, 1991.
13. Patrick Webb, Anuradha Harinarayan; A Measure of Uncertainty: The Nature of
Vulnerability and its relationship to Malnutrition, Medford, USA, 1999.
14. A childhood for every child, V.V. Giri National Labour Institute, 1998, Noida, U.P.
83
15. Trends in Sex Ratio: A review in Tribute to Asok Mitra, N. Krishnaji;,VolXXXV No.
14, April 1, 2000, P-.
16. Government of Madhya Pradesh, Revenue Department, Memorandum on the situation
created by heavy rains and floods in Hosangabad, Sehore, Raisen, Dewas,
Narsinghpur & Chhindwara Districts, 1999.
17. Government of Madhya Pradesh, Revenue Department, Memorandum on Drought
Situation in Madhya Pradesh.
18. Veena Kulkarni, Why they drop out - Reasons for lower literacy among girls,
MANUSHI Nov. Dec 96. P- 32-38.
19. Pendse, NG and Others; Growth behaviour of agricultural output in MP; a seasonal
approach Indian journal of Regional Science 1996; P-113-122
20. Jain S.K, A State of Tribals and their traditional subsistence type of farming ,Khadi
Gramodyog, May;1996,# 42 (8);P- 379-382
21. Prasad Rohini, Indebtedness among tribals of Bastar, Khadi Gramodyog, 36(5):
Feb90; P- 225-229.
22. Prasad Rohini and Jain N K, Study on Tribal Child Labour of Bastar dist. of MP,
Khadi Gramodyog, 38(3) Dec91, P-121-124.
23. Pandey GD, and Singh R, Some Characteristics of Tribal households in MP Social
Change, 21(2); June 91, P 85-92.
24. Shrivastava, VK, Development of Scheduled castes, intention realities and task ahead
in MP, MP Journal of Social Science, # 4(1) Jan-June 1999; P 15-44.
25. Appropriate Nutrition: Its role in health, Distribution of Malnutrition in India;
Problems, Programmes and Policies, National Nutrition Monitoring Bureau.
26. Making a Difference, WFP,1997
27. Development Alternatives Assessment of Household Food Security and impact of WFP
Food Aid in Madhya Pradesh, Vol-!,II, Report .
28. CARE-India, Household Livelihood Security Assessment, Bastar District, Madhya
Pradesh, India, 1997.
84
Annex - 4 Table 1A: Production and area under cereal (1993-94 to 1997-98)
(I) Change in production and area
Years Area Production1993-94 128.49 15655.31994-95 126.67 15599.61995-96 124.04 14800.71996-97 126.41 15842.41997-98 128.42 13914.8
(ii) Crop wise Production in '000 Tonnes
Cereal Average production in 000 tonsRice 5714.5Jowar 846.98Bajra 130.66Maize 1078.08Kodon-Kutki 198.02Wheat 7143.72
Source: Basic Agricultural Statistics, Commissioner of Land Records and Settlement, Gwalior, Madhya Pradesh
85
Table 1B: Food Availability Index with ICMR Base
1 2 3 4 5 6 7 8 9 10 11Per capita Per capita Per capita Per capita Per capita Per capita Per capita Per capita Percapita Per capita
S.No States availability Availability availability Sugar Availabilty of
availability Availabilityof
availability Availability availability
of Cereals Of Tubers of pulses availability E oilseeds of fruits Vegetables of Eggs of Fish of Milkgms/day Gms/day gms/day gms/day gms/day gms/day Gms/day gms/day gms/day gms/day
ICMR norms 420 gms/day
75 gms/day 40 gms/day 30 gms/day 22 gms/day 50 gms/day 125gms/day 45gms/day 25gms/day 150gms/day
1 0.87 0.09 0.57 1.02 1.26 2.13 0.53 0.59 0.52 1.052 Assam 0.77 0.77 0.15 0.02 0.22 1.00 1.57 0.15 0.65 0.543 Bihar 0.76 0.57 0.40 0.36 0.04 0.90 1.60 0.11 0.25 0.624 Gujarat 0.53 0.41 0.72 1.82 2.00 1.18 0.87 0.08 1.61 1.775 Haryana 3.07 0.30 1.15 2.00 1.69 0.23 1.30 0.24 0.15 3.806 Himachal
Pradesh1.16 0.68 0.10 0.00 0.05 1.40 1.69 0.08 0.10 1.88
7 Karnataka 0.88 0.28 0.74 1.97 1.19 2.82 1.84 0.23 0.62 1.148 Kerala 0.16 2.63 0.04 0.02 0.01 1.57 1.67 0.48 2.08 0.939 Madhya
Pradesh1.08 0.30 2.51 0.11 2.12 0.40 0.68 0.12 0.13 1.19
10 Maharashtra 0.65 0.05 1.08 4.69 0.84 1.95 0.81 0.22 0.61 1.0111 Orissa 0.93 0.38 0.53 0.18 0.21 1.11 4.96 0.13 0.82 0.3212 Punjab 5.08 1.14 0.19 2.06 0.47 0.96 1.33 0.83 0.13 5.1813 Rajasthan 1.09 0.01 2.23 0.04 2.19 0.14 0.13 0.06 0.03 1.8014 Tamil Nadu 0.64 1.65 0.23 2.27 1.10 1.70 1.26 0.39 0.81 1.1315 Uttar Pradesh 1.30 1.56 0.84 2.19 0.33 0.76 1.29 0.03 0.09 1.2916 West Bengal 0.98 2.81 0.12 0.01 0.20 0.42 3.51 0.25 1.24 0.7817 All India 1.02 0.88 0.80 1.37 0.82 1.17 1.43 0.21 0.56 1.23
Source: Ministry of Agriculture, “Area and Production of Principal Crops in India”- 1995-96,,"Bulletion of Food Statistics" 1999-2000.
Intake two standard deviations or more below the meanSource : NNMB data, as reported in Kamala S. Jaya Rao, "Undernutrition Among Adult Indian Males",
NFI Bulletin, July 1984.
86
Table 1C: Allotment and distribution of Food Grains in Madhya Pradesh
(I) Allotment and Distribution of Foodgrains(1993-1997)
in MTs.Years Allotment Distribution1993 987.7 585.51994 1115.9 367.81995 1166.6 323.21996 1138.4 5781997 1144.3 619.91999 916.08 621
(ii) Monthly variation in distribution of rice and wheat 1999
Rice WheatMonth BPL APL BPL APLJan 75 65 98 72Feb 79 43 72 79Mar 80 28 33 72Ap 83 29 4 65May 113 44 19 83Jun 85 36 14 82Jul 93 41 26 76Aug 85 39 29 71Sep 85 41 48 70Oct 93 38 38 77Nov 86 30 30 72Dec 89 24 44 83
Source: Directorate of Food and Civil Supplies, Madhya Pradehs
87

Table 1Di: State-wise calorie intake (Kcal/cu) 1975-80 Average (Rural) by Social Class
Calorie Intake of Schedule
Castes as a percent of
Calorie Intake of Schedule
Tribes as a percent of
States State Average State Average Recommended
Daily
Allowance
(2400)
State Average Recommended
Daily Allowance
(2400)
Karnataka 2837 86.6 102.4 SS --
Andhra P 2517 96.3 101.0 SS --
Orissa 2324 94.1 91.0 96.3 93.3
Tamil Nadu 2292 88.7 84.7 SS -
Maharashtra 2286 85.6 81.5 98.1 93.5
West Bengal 2227 98.7 91.5 92.2 85.5
Gujarat 2211 98.0 90.3 92.4 85.1
Madhya
Pradesh
2160 92.5 83.3 89.4 80.5
Uttar Pradesh 2123 97.2 86.0 SS -
Kerala 1942 94.1 67.4 SS -
SS: Small Sample, Source: Computed from disaggregated NNMB data.
88

Table 1Dii: Percentage of Malnourished (Gr. III + IV) Children in ICD Projects by Caste
Status, 1981*
Average Scheduled Castes Scheduled Tribes
0-36 months 0-72 months 0-36 months 0-72 months 0-36 months 0-72 months
Andhra Pradesh 9.6 8.6 10.4 8.3 9.9 7.5
Bihar 31.8 31.7 39.5 40.9 - -
Gujarat 7.3 6.2 6.0 3.9 11.7 -
Haryana 4.6 3.5 - - -
Himachal Pradesh 5.3 4.3 7.0 9.3 -
Karnataka 8.8 8.3 10.1 8.5 5.0 2.5
Kerala 7.7 7.8 11.0 10.2 17.5 15.6
Madhya Pradesh - - - - 24.3 12.7
Maharashtra 15.8 13.3 16.7 14.8 23.7 20.7
Orissa 16.7 13.0 19.0 16.8 -
Punjab 8.6 8.2 13.9 12.3 -
Rajasthan 8.2 8.7 17.3 12.1 8.1 7.6
Tamil Nadu 8.1 6.4 10.1 7.1 -
Uttar Pradesh 13.1 10.5 17.1 13.2 16.3 13.4
West Bengal 19.9 17.3 26.5 21.3 17.0 12.1
* ICDS authorities follow the Indian Academy of Paediatrics (IAP) classification, as shown below :
<50% weight for age : Grade IV malnutrition
51-60% weight for age : Grade III malnutrition
61-70% weight for age : Grade II malnutrition
71-80% weight for age : Grade I malnutrition
>80% NormalSource : Compiled from Child in India. A Statistical Profile, Ministry of Welfare, Government of India
89

Table 2: Population Supported By cereal Production (1993-94 to 1997-98)
District Average cereal production in
quintals*
12.5% loss due to seed, store and
transport in Quintals
Projected 1995**
Population supported per 100 quintols of
production
Division by mean
Balaghat 2967600 2596650 1513384 58.28 0.88
Barwani 828582 725009 922324 127.22 1.93
Bastar 2356296 2061759 1237521 60.02 0.91
Betul 2614200 2287425 1309103 57.23 0.87
Bhind 2375000 2078125 1350652 64.99 0.99
Bhopal 1299800 1137325 1497439 131.66 2.00
Bilaspur 1211797 1060322 1877930 177.11 2.69
Chhatarpur 2689200 2353050 1283148 54.53 0.83
Chhindwara 3297000 2884875 1738122 60.25 0.91
Damoh 1781200 1558550 995123 63.85 0.97
Dantewada 2755442 2411012 689472 28.60 0.43
Datia 1066200 932925 571019 61.21 0.93
Dewas 2498800 2186450 1145458 52.39 0.80
Dhamtari 1263111 1105222 651148 58.92 0.89
Dhar 3822400 3344600 1515092 45.30 0.69
Dindori 1222888 1070027 729598 68.18 1.04
Durg 6158800 5388950 2656024 49.29 0.75
East Nimar (Khandwa) 2011200 1759800 1586281 90.14 1.37
Guna 2985400 2612225 1451831 55.58 0.84
Gwalior 3086800 2700950 1433272 53.07 0.81
Harda 1318117 1153352 421884 36.58 0.56
Hoshangabad 2781883 2434148 982185 40.35 0.61
Indore 2909000 2545375 2034194 79.92 1.21
Jabalpur 1780796 1558197 1958985 125.72 1.91
Janjgir-Champa 679776 594804 1230102 206.81 3.14
Jashpur 2473277 2164118 727238 33.60 0.51
Jhabua 2184000 1911000 1252489 65.54 1.00
Kaker 1422262 1244479 589623 47.38 0.72
Katni 1412804 1236203 977173 79.05 1.20
Kawardha 645467 564784 568954 100.74 1.53
Korba 797627 697923 915087 131.12 1.99
District Average cereal production in
12.5% loss due to seed, store and
Projected 1995**
Population supported per 100 quintols of
Division by mean
90

quintals* transport in Quintals
production
Koriya 1265810 1107584 554840 50.09 0.76
Mahasamund 3325165 2909520 876646 30.13 0.46
Mandla 1392912 1218798 701121 57.53 0.87
Mandsaur 2687248 2351342 1060211 45.09 0.68
Morena 1318195 1153420 1417236 122.87 1.87
Narsimhapur 1832400 1603350 870330 54.28 0.82Neemuch 2020152 1767633 662960 37.51 0.57
Panna 1423400 1245475 762243 61.20 0.93
Raigarh 2442523 2137207 1181060 55.26 0.84
Raipur 7904524 6916458 2802316 40.52 0.62
Raisen 2285200 1999550 971119 48.57 0.74
Rajgarh 1902000 1664250 1099983 66.09 1.00
Rajnandgaon 3080333 2695291 1206664 44.77 0.68
Ratlam 2760600 2415525 1076852 44.58 0.68
Rewa 3068200 2684675 1722926 64.18 0.97
Sagar 2713600 2374400 1825691 76.89 1.17
Satna 2820000 2467500 1623645 65.80 1.00
Sehore 2728400 2387350 932225 39.05 0.59
Seoni 2048200 1792175 1108921 61.88 0.94
Shahdol 2056571 1799500 1465944 81.46 1.24
Shajapur 3120000 2730000 1144839 41.94 0.64
Sheopur 1855005 1623130 478080 29.45 0.45
Shivpuri 2823600 2470650 1255339 50.81 0.77
Sidhi 1997200 1747550 1521765 87.08 1.32
Surguja 2922990 2557616 1752714 68.53 1.04
Tikamgarh 2653200 2321550 1042439 44.90 0.68
Ujjain 3568200 3122175 1532459 49.08 0.75
Umaria 985029 861900 466263 54.10 0.82
Vidisha 3496800 3059700 1075190 35.14 0.53
West Nimar(Khargone) 3388818 2965216 1324861 44.68 0.68
Madhya Pradesh 144583000 126510125 73328736 57.96
Mean 58Souce: Basic Agricultural Statistics, Commissioner of Land Records and Settlement, Gwalior, Madhya Pradesh,1999,& Census of India, 1991.
91

Table 3: Seasonality of cereal production in thousand Tonnes (1997-98)
District Kharif Rabi 1-k/r 1-r/k I-second crop / first crop
Division by mean method
Balaghat 278.42 18.34 -14.18 0.93 0.93 1.28
Barwani 247.5 174.24 -0.42 0.30 0.30 0.41
Bastar 651.02 2.38 -272.54 1.00 1.00 1.36
Betul 133.46 127.96 -0.04 0.04 0.04 0.06
Bhind 39.26 198.24 0.80 -4.05 0.80 1.10
Bhopal 5.96 124.02 0.95 -19.81 0.95 1.30
Bilaspur 906.66 15.92 -55.95 0.98 0.98 1.35
Chhatarpur 34.44 234.48 0.85 -5.81 0.85 1.17
Chhindwara 184.36 145.34 -0.27 0.21 0.21 0.29
Damoh 48.52 129.6 0.63 -1.67 0.63 0.86
Dantewada 651.02 2.38 -272.54 1.00 1.00 1.36
Datia 5.68 100.94 0.94 -16.77 0.94 1.29
Dewas 52.88 197 0.73 -2.73 0.73 1.00
Dhamtari 1230.52 18.76 -64.59 0.98 0.98 1.35
Dhar 114.4 267.84 0.57 -1.34 0.57 0.78
Dindori 201.4 60.18 -2.35 0.70 0.70 0.96
Durg 604.02 11.86 -49.93 0.98 0.98 1.34
East Nimar (Khandwa) 95.4 105.72 0.10 -0.11 0.10 0.13
Guna 77.5 221.04 0.65 -1.85 0.65 0.89
Gwalior 63.46 245.22 0.74 -2.86 0.74 1.02
Harda 20.28 389.72 0.95 -18.22 0.95 1.30
Hoshangabad 20.28 389.72 0.95 -18.22 0.95 1.30
Indore 18.94 271.96 0.93 -13.36 0.93 1.27
Jabalpur 129.5 189.86 0.32 -0.47 0.32 0.44
Janjgir-Champa 906.66 15.92 -55.95 0.98 0.98 1.35
Jashpur 488.26 3.32 -146.07 0.99 0.99 1.36
Jhabua 133.96 84.44 -0.59 0.37 0.37 0.51
Kaker 651.02 2.38 -272.54 1.00 1.00 1.36
Katni 129.5 189.86 0.32 -0.47 0.32 0.44
Kawardha 359.04 13.54 -25.52 0.96 0.96 1.32
Korba 906.66 15.92 -55.95 0.98 0.98 1.35
92

District Kharif Rabi 1-k/r 1-r/k I-second crop / first crop
Division by mean method
Koriya 394.36 24.52 -15.08 0.94 0.94 1.28
Mahasamund 1230.52 18.76 -64.59 0.98 0.98 1.35
Mandla 201.4 60.18 -2.35 0.70 0.70 0.96
Mandsaur 252.32 218.42 -0.16 0.13 0.13 0.18Morena 13.34 303.98 0.96 -21.79 0.96 1.31
Narsimhapur 19.46 163.78 0.88 -7.42 0.88 1.21
Neemuch 252.32 218.42 -0.16 0.13 0.13 0.18
Panna 44.7 97.64 0.54 -1.18 0.54 0.74
Raigarh 488.26 3.32 -146.07 0.99 0.99 1.36
Raipur 1230.52 18.76 -64.59 0.98 0.98 1.35
Raisen 9.38 219.14 0.96 -22.36 0.96 1.31
Rajgarh 78.12 112.08 0.30 -0.43 0.30 0.42
Rajnandgaon 359.04 13.54 -25.52 0.96 0.96 1.32
Ratlam 79 197.06 0.60 -1.49 0.60 0.82
Rewa 105.9 200.92 0.47 -0.90 0.47 0.65
Sagar 18.46 252.9 0.93 -12.70 0.93 1.27
Satna 47.76 234.24 0.80 -3.90 0.80 1.09
Sehore 24.92 247.92 0.90 -8.95 0.90 1.23
Seoni 135.56 69.26 -0.96 0.49 0.49 0.67
Shahdol 244.72 59.44 -3.12 0.76 0.76 1.04
Shajapur 114.58 197.42 0.42 -0.72 0.42 0.57
Sheopur 13.34 303.98 0.96 -21.79 0.96 1.31
Shivpuri 45.5 236.86 0.81 -4.21 0.81 1.11
Sidhi 125.48 74.24 -0.69 0.41 0.41 0.56
Surguja 394.36 24.52 -15.08 0.94 0.94 1.28
Tikamgarh 31.64 233.68 0.86 -6.39 0.86 1.18
Ujjain 30.72 326.1 0.91 -9.62 0.91 1.24
Umaria 244.72 59.44 -3.12 0.76 0.76 1.04
Vidisha 27.48 322.2 0.91 -10.72 0.91 1.25
West Nimar(Khargone) 247.5 174.24 -0.42 0.30 0.30 0.41
Mean 0.73
Souce: Basic Agricultural Statistics, Commissioner of Land Records and Settlement, Gwalior, Madhya Pradesh.1999.
93
Table4: Inadequacy of Safety Net
District Care* WFP* Total Division by mean
Agri-lab 2000**
Total Persondays generated by EAS***
Person days generated / Agri- Lab
Division by mean
Total Adequacy Inadequacy
Balaghat 1 1 2 2.90 195924 706000 4 0.51 3.41 0.3Barwani 0 0 0 0.00 83011 NA 3 0.43 0.43 2.3Bastar 1 1 2 2.90 95681 1329000 14 1.98 4.88 0.2Betul 0 0 0 0.00 143997 466000 3 0.46 0.46 2.2Bhind 0 1 1 1.45 42304 378000 9 1.28 2.73 0.4Bhopal 0 0 0 0.00 40359 84000 2 0.30 0.30 3.4Bilaspur 1 1 2 2.90 218623 2372000 11 1.55 4.45 0.2Chhatarpur 0 0 0 0.00 88805 162000 2 0.26 0.26 3.8Chhindwara 1 1 2 2.90 175842 852000 5 0.69 3.59 0.3Damoh 0 0 0 0.00 101968 455000 4 0.64 0.64 1.6Dantewada 1 0 1 1.45 31895 NA 14 2.00 3.45 0.3Datia 0 1 1 1.45 26293 46000 2 0.25 1.70 0.6Dewas 0 0 0 0.00 135214 396000 3 0.42 0.42 2.4Dhamtari 1 0 1 1.45 111476 0 7 1.00 2.45 0.4Dhar 0 1 1 1.45 158703 881000 6 0.79 2.24 0.4Dindori 0 0 0 0.00 81566 0 7 1.00 1.00 1.0Durg 1 0 1 1.45 301067 970000 3 0.46 1.91 0.5East Nimar (Khandwa)
0 0 0 0.00 223163 555000 2 0.36 0.36 2.8
Guna 0 0 0 0.00 92095 637000 7 0.99 0.99 1.0Gwalior 0 1 1 1.45 34195 199000 6 0.83 2.28 0.4Hard 0 0 0 0.00 65117 0 4 0.57 0.57 1.8Hoshangabad 1 1 2 2.90 102177 434000 4 0.61 3.51 0.3
94

District Care* WFP* Total Division by mean
Agri-lab 2000**
Total Persondays generated by EAS***
Person days generated / Agri- Lab
Division by mean
Total Adequacy Inadequacy
Indore 0 0 0 0.00 97958 208000 2 0.30 0.30 3.3Jabalpur 0 0 0 0.00 153965 970000 6 0.90 0.90 1.1Janjgir-Champa 1 0 1 1.45 130065 0 11 1.55 3.00 0.3Jashpur 0 0 0 0.00 46126 0 6 0.86 0.86 1.2Jhabua 0 1 1 1.45 31312 928000 30 4.23 5.68 0.2Kaker 1 0 1 1.45 50543 0 14 2.00 3.45 0.3Katni 0 0 0 0.00 105055 0 6 0.86 0.86 1.2Kawardha 0 0 0 0.00 73533 0 6 0.86 0.86 1.2Korba 1 0 1 1.45 79504 11 1.55 3.00 0.3Koriya 1 0 1 1.45 22311 0 11 1.57 3.02 0.3Mahasamund 1 0 1 1.45 144838 0 7 1.00 2.45 0.4Mandla 0 1 1 1.45 94769 705000 7 1.06 2.51 0.4Mandsaur 0 0 0 0.00 95546 350000 4 0.52 0.52 1.9Morena 0 1 1 1.45 22743 636000 28 3.99 5.44 0.2Narsimhapur 1 0 1 1.45 133620 168000 1 0.18 1.63 0.6Neemuch 0 0 0 0.00 48871 0 4 0.57 0.57 1.8Panna 0 0 0 0.00 76523 542000 7 1.01 1.01 1.0Raigarh 1 1 2 2.90 154511 955000 6 0.88 3.78 0.3Raipur 1 0 1 1.45 332285 2267000 7 0.97 2.42 0.4Raisen 0 0 0 0.00 131713 422000 3 0.46 0.46 2.2Rajgarh 0 0 0 0.00 91083 393000 4 0.62 0.62 1.6Rajnandgaon 1 0 1 1.45 114566 725000 6 0.90 2.35 0.4Ratlam 0 0 0 0.00 80555 241000 3 0.43 0.43 2.3Rewa 1 0 1 1.45 226088 632000 3 0.40 1.85 0.5Sagar 1 0 1 1.45 153934 445000 3 0.41 1.86 0.5
95
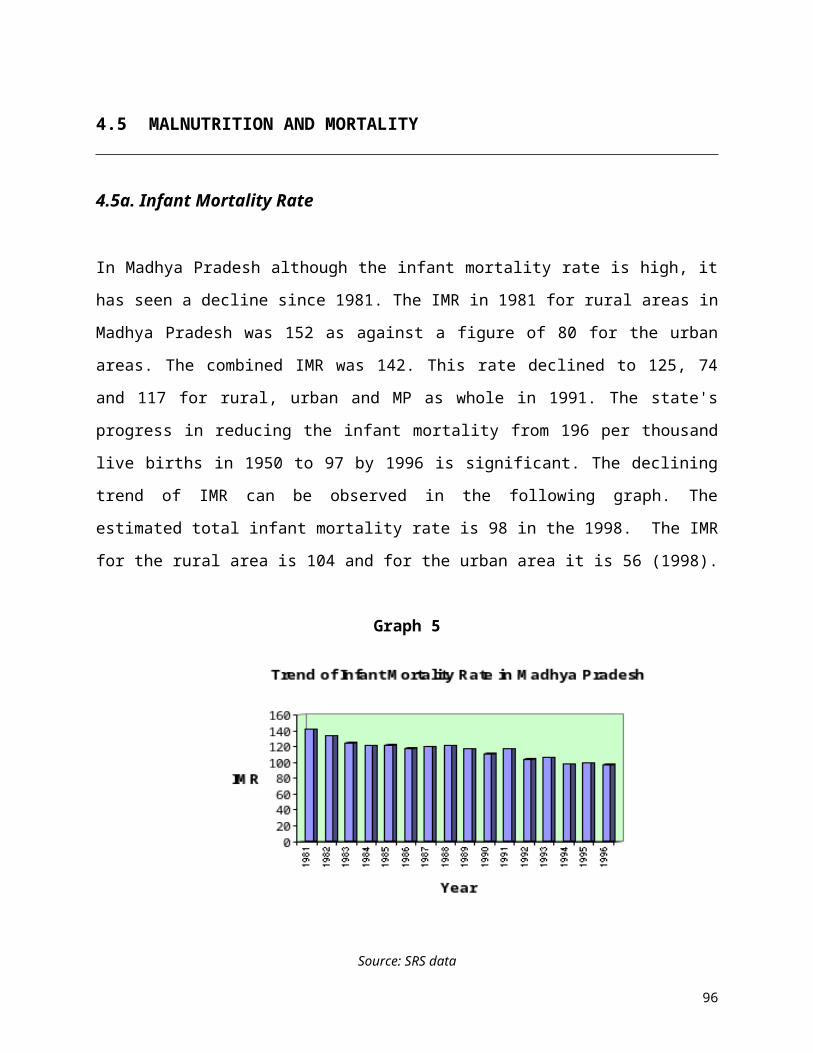
District Care* WFP* Total Division by mean
Agri-lab 2000**
Total Persondays generated by EAS***
Person days generated / Agri- Lab
Division by mean
Total Adequacy Inadequacy
Satna 1 0 1 1.45 178183 804000 5 0.64 2.09 0.5Sehore 0 0 0 0.00 110337 204000 2 0.26 0.26 3.8Seoni 1 1 2 2.90 171638 647000 4 0.54 3.44 0.3Shahdol 1 1 2 2.90 144801 1101000 8 1.09 3.98 0.3Shajapur 0 0 0 0.00 141128 287000 2 0.29 0.29 3.4Sheopur 0 0 0 0.00 25076 0 28 4.00 4.00 0.3Shivpuri 0 1 1 1.45 58341 595000 10 1.46 2.91 0.3Sidhi 0 1 1 1.45 146342 670000 5 0.65 2.10 0.5Surguja 1 1 2 2.90 132709 1503000 11 1.62 4.52 0.2Tikamgarh 0 0 0 0.00 41279 345000 8 1.19 1.19 0.8Ujjain 0 0 0 0.00 140217 286000 2 0.29 0.29 3.4Umaria 0 0 0 0.00 50155 0 8 1.14 1.14 0.9Vidisha 0 0 0 0.00 129054 329000 3 0.36 0.36 2.7West Nimar(Khargone)
0 1 1 1.45 187426 610000 3 0.46 1.91 0.5
Madhya Pradesh 23 19 0.69 6898180 7
Mean 1.4 Mean 7
Source: * WFP, CARE** WFP Estimates for 2000, MP web site Census of India 1991*** EAS, Directorate of Rural Development,of Madhya Pradesh,
96

Table 5: Composite Sustenance Insecurity Index
District Population Supported by Cereal
Seasonality in Cereal Production
Composite Index
Balaghat 0.88 1.28 1.08Barwani 1.93 0.41 1.17
Bastar 0.91 1.36 1.14
Betul 0.87 0.06 0.46
Bhind 0.99 1.10 1.04
Bhopal 2.00 1.30 1.65
Bilaspur 2.69 1.35 2.02
Chhatarpur 0.83 1.17 1.00
Chhindwara 0.91 0.29 0.60
Damoh 0.97 0.86 0.91
Dantewada 0.43 1.36 0.90
Datia 0.93 1.29 1.11
Dewas 0.80 1.00 0.90
Dhamtari 0.89 1.35 1.12
Dhar 0.69 0.78 0.74
Dindori 1.04 0.96 1.00
Durg 0.75 1.34 1.05
East Nimar (Khandwa) 1.37 0.13 0.75
Guna 0.84 0.89 0.87
Gwalior 0.81 1.02 0.91
Harda 0.56 1.30 0.93
Hoshangabad 0.61 1.30 0.96
Indore 1.21 1.27 1.24
Jabalpur 1.91 0.44 1.17
Janjgir-Champa 3.14 1.35 2.24
Jashpur 0.51 1.36 0.94
Jhabua 1.00 0.51 0.75
Kaker 0.72 1.36 1.04
Katni 1.20 0.44 0.82
Kawardha 1.53 1.32 1.42
Korba 1.99 1.35 1.67
Koriya 0.76 1.28 1.02
District Population Supported by Cereal
Seasonality in Cereal Production
Composite Score
97

Mahasamund 0.46 1.35 0.90
Mandla 0.87 0.96 0.92
Mandsaur 0.68 0.18 0.43
Morena 1.87 1.31 1.59Narsimhapur 0.82 1.21 1.02
Neemuch 0.57 0.18 0.38
Panna 0.93 0.74 0.84
Raigarh 0.84 1.36 1.10
Raipur 0.62 1.35 0.98
Raisen 0.74 1.31 1.02
Rajgarh 1.00 0.42 0.71
Rajnandgaon 0.68 1.32 1.00
Ratlam 0.68 0.82 0.75
Rewa 0.97 0.65 0.81
Sagar 1.17 1.27 1.22
Satna 1.00 1.09 1.04
Sehore 0.59 1.23 0.91
Seoni 0.94 0.67 0.80
Shahdol 1.24 1.04 1.14
Shajapur 0.64 0.57 0.61
Sheopur 0.45 1.31 0.88
Shivpuri 0.77 1.11 0.94
Sidhi 1.32 0.56 0.94
Surguja 1.04 1.28 1.16
Tikamgarh 0.68 1.18 0.93
Ujjain 0.75 1.24 0.99
Umaria 0.82 1.04 0.93
Vidisha 0.53 1.25 0.89
West Nimar(Khargone) 0.68 0.41 0.54
98

Table 6: Cattle and Crop loss due to disaster 1995-99
Districts % croploss Division by mean
% Cattle loss Division by mean
Total Score
Balaghat 2.83 2.83 0.0 0.0 1.41Barwani 0.00 0.00 0.0 0.0 0.00Bastar 0.00 0.00 0.0 0.0 0.00Betul 0.07 0.07 0.0 0.0 0.04Bhind 0.18 0.18 0.0 0.0 0.09Bhopal 0.13 0.13 0.0 0.0 0.07Bilaspur 0.00 0.00 0.0 0.0 0.00Chhatarpur 3.33 3.33 0.0 0.0 1.67Chhindwara 2.35 2.35 7.0 17.6 9.97Damoh 0.01 0.01 0.0 0.0 0.01Dantewada 0.00 0.00 0.0 0.0 0.00Datia 0.97 0.97 0.0 0.0 0.49Dewas 0.09 0.09 0.0 0.0 0.05Dhamtari 0.30 0.30 0.2 0.6 0.44Dhar 0.03 0.03 0.0 0.0 0.02Dindori 0.00 0.00 0.0 0.0 0.00Durg 5.80 5.80 7.2 18.0 11.90East Nimar (Khandwa) 1.61 1.61 0.0 0.0 0.80Guna 0.47 0.47 0.0 0.0 0.24Gwalior 0.66 0.66 0.0 0.0 0.33Harda 0.00 0.00 0.0 0.0 0.00Hoshangabad 0.42 0.42 0.0 0.0 0.22Indore 0.13 0.13 0.0 0.0 0.06Jabalpur 0.85 0.85 0.0 0.0 0.43Janjgir-Champa 0.00 0.00 0.0 0.0 0.00Jashpur 0.00 0.00 0.0 0.0 0.00Jhabua 3.26 3.26 0.0 0.0 1.63Kaker 0.00 0.00 0.0 0.0 0.00Katni 0.00 0.00 0.0 0.0 0.00Kawardha 0.00 0.00 0.0 0.0 0.00Korba 0.00 0.00 0.0 0.0 0.00Koriya 0.02 0.02 0.0 0.0 0.01Mahasamund 1.31 1.31 1.1 2.8 2.06Mandla 0.33 0.33 0.0 0.0 0.16Mandsaur 1.07 1.07 0.0 0.0 0.54
99

Districts % croploss Division by mean
% Cattle loss Division by mean
Total Score
Morena 0.30 0.30 0.0 0.0 0.15Narsimhapur 0.78 0.78 0.0 0.0 0.39Neemuch 0.00 0.00 0.0 0.0 0.00Panna 1.71 1.71 2.9 7.1 4.43Raigarh 0.26 0.26 0.0 0.0 0.13Raipur 7.75 7.75 3.6 9.0 8.37Raisen 0.19 0.19 0.0 0.0 0.10Rajgarh 11.65 11.65 0.0 0.0 5.83Rajnandgaon 4.02 4.02 2.6 6.5 5.26Ratlam 0.83 0.83 0.0 0.0 0.42Rewa 0.63 0.63 0.0 0.1 0.38Sagar 0.44 0.44 0.0 0.0 0.22Satna 0.13 0.13 0.0 0.0 0.07Sehore 0.44 0.44 0.0 0.0 0.22Seoni 0.91 0.91 0.0 0.0 0.46Shahdol 0.07 0.07 0.0 0.0 0.04Shajapur 0.07 0.07 0.0 0.0 0.04Sheopur 0.00 0.00 0.0 0.0 0.00Shivpuri 0.02 0.02 0.0 0.0 0.01Sidhi 0.00 0.00 0.0 0.0 0.00Surguja 0.00 0.00 0.0 0.0 0.00Tikamgarh 2.94 2.94 0.0 0.0 1.47Ujjain 0.03 0.03 0.0 0.0 0.02Umaria 0.00 0.00 0.0 0.0 0.00Vidisha 0.16 0.16 0.0 0.0 0.08West Nimar(Khargone) 0.15 0.15 0.0 0.0 0.08
Mean 1.0, 0.4Source: Revenue Department, Government of Madhya Pradesh. (1995-99), Basic Agricultural Statistics, Commissioner of Land Records and Settlement, Gwalior, Madhya Pradesh,1999.
100

Table 7: Disaster Proneness
District Area in sq km. DPAP area in Sq. Km
Percent Division by mean
Balaghat 9229 0 0 0.00Barwani 3664 3078 84 3.65Bastar 8755 3148 36 1.56Betul 10043 7194 72 3.11Bhind 4459 406 9 0.40Bhopal 2772 0 0 0.00Bilaspur 6377 1665 26 1.13Chhatarpur 8687 0 0 0.00Chhindwara 11815 7296 62 2.68Damoh 7306 2213 30 1.32Dantewada 10238 6776 66 2.87Datia 2692 0 0 0.00Dewas 7020 3010 43 1.86Dhamtari 1455 0 0 0.00Dhar 8153 4690 58 2.50Dindori 6128 0 0 0.00Durg 8537 1129 13 0.57East Nimar (Khandwa) 10779 3664 34 1.48Guna 11065 8062 73 3.16Gwalior 4565 0 0 0.00Harda 2644 0 0 0.00Hoshangabad 5408 0 0 0.00Indore 3898 0 0 0.00Jabalpur 5655 0 0 0.00Janjgir-Champa 3629 0 0 0.00Jashpur 6000 0 0 0.00Jhabua 6795 6396 94 4.09Kaker 5285 0 0 0.00Katni 4505 0 0 0.00Kawardha 1914 1396 73 3.17Korba 4258 4189 98 4.27Koriya 5977 0 0 0.00Mahasamund 3831 0 0 0.00Mandla 7141 0 0 0.00Mandsaur 5099 0 0 0.00
101

District Area in sq km. DPAP area in Sq. Km
Percent Division by mean
Morena 5018 0 0 0.00Narsimhapur 5133 0 0 0.00Neemuch 3875 0 0 0.00Panna 7135 3892 55 2.37Raigarh 6036 0 0 0.00Raipur 9139 0 0 0.00Raisen 8489 2380 28 1.22Rajgarh 6154 1816 30 1.28Rajnandgaon 9202 2934 32 1.38Ratlam 4861 681 14 0.61Rewa 6314 2055 33 1.41Sagar 10252 0 0 0.00Satna 7425 0 0 0.00Sehore 8564 0 0 0.00Seoni 8758 3659 42 1.81Shahdol 9485 5070 53 2.32Shajapur 6196 1618 26 1.13Sheopur 6665 0 0 0.00Shivpuri 10278 3424 33 1.45Sidhi 10526 8737 83 3.60Surguja 13801 0 0 0.00Tikamgarh 5048 0 0 0.00Ujjain 6091 0 0 0.00Umaria 4543 3439 76 3.29Vidisha 7371 0 0 0.00West Nimar(Khargone) 9786 2958 30 1.31West Nimar(Khargone) 9786 2958 30 0.24
Mean- 23.03
Source: Drought Prone area Programme, Directorate of Rural Development, Govt. of Madhya Pradesh
102
Table 7A: Drought prone blocks
Districts Drought Prone BlocksBarwani Barwani, Newali, Pati, Rajpur, Sendhwa, ThikriBastar Bakaband, Bastar, Jagdalpur, Kondagaon, Lohandiguda TonkpalBetul Amla, Athner, Betul, Bhainsdehi, Bhimpura, Chicholi, Ghoda Dongri, Multai Prabhat
Pattam, ShahpurBhind Ron MihonaBilaspur Gaurella-1, Gaurella-2, PathariyaChhindwara Amarwara, Bichhua, Harrai, Jamai, Mohkhra, Parasia,Sausar,TamiaDamoh Damoh Hatta PateraDantewada Bhairamgarh Bijapur Geedam, Konta, Sukma, UsurDewas Kannod, Khategaon, Tonk KhurdDhar Bagh, Bankaner (Umarban), Dahi, Gandhwani, Kukshi, Manawar, Nisarpur, SardarpurDurg Dondi, NawagarhEast Nimar (Khandwa) Chhegaon Makhan, Harsud, Khaknar, Khalawa, PandhanaGuna Aron, Ashok Nagar, Chachaura, Guna, Isagarh, MungaoliJabalpur KundamJanjgir -Champa JaijaipurJhabua Alirajpur, Bhabra, Jhabua, Jobat, Kattiwada, Meghnagar, Petlawad, Rama, , Ranapur,
Sondwa, Thandla, UdaigarhKawardha Bodla, Sahaspur LoharaKorba Kartala, Katghora, Korba, Pali, PondiuprodaPanna Gunnor, Pawai, ShahnagarRaisen Begamganj, Gairatganj, UdaipuraRajgarh Khilchipur, RajgarhRajnandgaon Chauki, Chhuria, Manpur, MohlaRatlam BajnaRewa Gangeve, Mauganj, Naigarhi, Raipur (Karchulian)Seoni Chhapara, Dhanaura, Kahnapas (Ghansaur), Kurai, Lakhnadon
Shahdol Beohari, Jaisinghnagar, Pushprajgarh, SohagpurShajapur Bagdod, ShajaPurShivpuri Badarwas, Kolaras, PohriSidhi Baidhan, Chitrangi, Deosar, Kusmi, Majholi, Rampur Naikin, Sidhi, Sihawal
Umaria Manpur, Umaria (Karkeli)West Nimar(Khargone) Bhagwanpura, Bhikangaon, Jhiranya, Khargone, Segaon
Source: Drought Prone area Programme, Directorate of Rural Development, Govt. of Madhya Pradesh
103
Table 8: Composite Disaster Proneness
Districts Cattle-Crop loss Disaster Proneness Composite Index
Balaghat 0.31 -0.77 0.00
Barwani -0.39 2.04 3.65
Bastar -0.39 0.43 1.56
Betul -0.38 1.63 3.11
Bhind -0.35 -0.47 0.40
Bhopal -0.36 -0.77 0.00
Bilaspur -0.39 0.10 1.13
Chhatarpur 0.44 -0.77 0.00
Chhindwara 2.71 1.30 2.68
Damoh -0.39 0.24 1.32
Dantewada -0.39 1.45 2.87
Datia -0.15 -0.77 0.00
Dewas -0.37 0.66 1.86
Dhamtari -0.23 -0.77 0.00
Dhar -0.38 1.16 2.50
Dindori -0.39 -0.77 0.00
Durg 3.63 -0.33 0.57
East Nimar (Khandwa) 0.01 0.37 1.48
Guna -0.28 1.67 3.16
Gwalior -0.23 -0.77 0.00
Harda -0.39 -0.77 0.00
Hoshangabad -0.29 -0.77 0.00
Indore -0.36 -0.77 0.00
Jabalpur -0.18 -0.77 0.00
Janjgir-Champa -0.39 -0.77 0.00
Jashpur -0.39 -0.77 0.00
Jhabua 0.42 2.38 4.09
Kaker -0.39 -0.77 0.00
Katni -0.39 -0.77 0.00
Kawardha -0.39 1.67 3.17
Korba -0.39 2.52 4.27
104

Districts Cattle-Crop loss Disaster Proneness Composite Index
Koriya -0.39 -0.77 0.00
Mahasamund 0.34 -0.77 0.00
Mandla -0.31 -0.77 0.00
Mandsaur -0.13 -0.77 0.00
Morena -0.32 -0.77 0.00
Narsimhapur -0.20 -0.77 0.00
Neemuch -0.39 -0.77 0.00
Panna 1.06 1.06 2.37
Raigarh -0.33 -0.77 0.00
Raipur 2.83 -0.77 0.00
Raisen -0.34 0.17 1.22
Rajgarh 2.52 0.22 1.28
Rajnandgaon 1.54 0.30 1.38
Ratlam -0.19 -0.30 0.61
Rewa -0.22 0.32 1.41
Sagar -0.28 -0.77 0.00
Satna -0.36 -0.77 0.00
Sehore -0.28 -0.77 0.00
Seoni -0.16 0.63 1.81
Shahdol -0.37 1.02 2.32
Shajapur -0.38 0.10 1.13
Sheopur -0.39 -0.77 0.00
Shivpuri -0.39 0.34 1.45
Sidhi -0.39 2.01 3.60
Surguja -0.39 -0.77 0.00
Tikamgarh 0.34 -0.77 0.00
Ujjain -0.38 -0.77 0.00
Umaria -0.39 1.76 3.29
Vidisha -0.35 -0.77 0.00
West Nimar(Khargone) -0.35 0.24 1.31
West Nimar(Khargone) 0.53 0.24 0.38
105

Table 9: Households below poverty line
District Total Rural Households
BPL households Percent Division by mean method
Balaghat 283205 180741 64 1.48Barwani Na na 45 1.05Bastar 460953 243372 53 1.23Betul 195935 87148 44 1.03Bhind 162954 43202 27 0.62Bhopal 64761 22978 35 0.83Bilaspur 729563 311013 43 0.99Chhatarpur 210982 89251 42 0.98Chhindwara 290028 126605 44 1.02Damoh 189495 98304 52 1.21Dantewada na na 53 1.23Datia 78062 13286 17 0.40Dewas 164081 65288 40 0.93Dhamtari na na 39 0.91Dhar 258736 100281 39 0.90Dindori na na 58 1.35Durg 327523 109398 33 0.78East Nimar (Khandwa) 221444 99269 45 1.04Guna 234454 101615 43 1.01Gwalior 123996 38044 31 0.71Harda na na 36 0.84Hoshangabad 204759 74221 36 0.84Indore 125600 28124 22 0.52Jabalpur 399440 228392 57 1.33Janjgir-Champa na na 43 0.99Jashpur na na 44 1.02Jhabua 211997 115256 54 1.26Kaker na na 53 1.23Katni na na 57 1.33Kawardha na na 44 1.02Korba na na 43 0.99Koriya na na 49 1.14Mahasamund na na 39 0.91Mandla 305802 178344 58 1.36Mandsaur 261638 80003 31 0.71Morena 289640 69607 24 0.56Narsimhapur 143842 79737 55 1.29Neemuch na na 31 0.72Panna 156591 76441 49 1.14Raigarh 371281 161838 44 1.01Raipur 734194 285806 39 0.91Raisen 176860 89352 51 1.17Rajgarh 169200 80059 47 1.10Rajnandgaon 254366 112803 44 1.03
106

District Total Rural Households
BPL households Percent Division by mean method
Ratlam 141819 53425 38 0.88Rewa 371963 211493 57 1.32Sagar 287712 148997 52 1.20Satna 305643 157003 51 1.19Sehore 149831 53773 36 0.83Seoni 252000 104339 41 0.96Shahdol 343976 147421 43 1.00Shajapur 175797 63766 36 0.84Sheopur na na 24 0.56Shivpuri 211649 62684 30 0.69Sidhi 294688 166430 56 1.31Surguja 421455 204518 49 1.13Tikamgarh 187376 66866 36 0.83Ujjain 180192 52998 29 0.68Umaria na na 43 1.00Vidisha 168305 66291 39 0.92West Nimar(Khargone) 357294 162092 45 1.06Madhya Pradesh 11651082 5111874
Mean- 43Source:District Poverty Initiative Programme, 1998, Madhya Pradesh.
107
Table 9A : District-wise BPL census-1997BASIS OF LAND
HOLDINGDistrict Total Rural
householdSC House
Hold% ST House
Hold% Backward Minority Landless % Marginal Small
Balaghat 283205 17270 6 46162 16 113113 3476 94681 33 63426 22634Barwani 357294 20100 6 104739 29 31896 2627 93863 26 40994 27235Bastar 460953 14610 3 169045 37 37508 2274 77841 17 86835 78696Betul 195935 12216 6 44765 23 33741 1022 48581 25 21796 16771Bhind 162954 16870 10 122 0 19094 1710 20626 13 17391 5185Bhopal 64761 5777 9 2053 3 8879 1473 14934 23 4761 3283Bilaspur 729563 74419 10 96099 13 117498 6508 135926 19 130137 44950Chhatarpur 210982 30371 14 8275 4 40375 1542 44480 21 25743 19028Chhindwara 290028 17035 6 59025 20 46867 4168 74739 26 28900 22966Damoh 189495 25256 13 19152 10 37503 3447 66379 35 21207 10718Dantewada 460953 14610 3 169045 37 37508 2274 77841 17 86835 78696Datia 78062 5647 7 946 1 5924 296 5827 7 5732 1727Dewas 164081 19303 12 18962 12 18137 3019 46060 28 11384 7844Dhamtari 734194 55624 8 74900 10 138773 2737 148096 20 107431 30279Dhar 258736 7117 3 76697 30 13066 1873 51537 20 28906 19838Dindori 305802 17982 6 106144 35 48000 1289 95880 31 53663 28801Durg 327523 19132 6 18836 6 69434 1121 44080 13 48880 16438East Nimar (Khandwa) 221444 18209 8 43035 19 29829 4341 74408 34 14038 10823Guna 234454 23004 10 23852 10 44143 2447 54810 23 24781 22024Gwalior 123996 12134 10 6348 5 16548 1676 25791 21 8972 3281Harda 204759 17576 9 25675 13 25107 1341 57830 28 8988 7403Hoshangabad 204759 17576 9 25675 13 25107 1341 57830 28 8988 7403Indore 125600 7684 6 9565 8 8306 853 22986 18 3450 1688Jabalpur 399440 36185 9 75992 19 98077 3195 149731 37 52582 26079Janjgir-Champa 729563 74419 10 96099 13 117498 6508 135926 19 130137 44950Jashpur 371281 31117 8 70681 19 55971 1587 69413 19 60167 32258Jhabua 211997 4287 2 107994 51 2164 339 28320 13 53248 33688Kaker 460953 14610 3 169045 37 37508 2274 77841 17 86835 78696Katni 399440 36185 9 75992 19 98077 3195 149731 37 52582 26079Kawardha 254366 14648 6 35671 14 60353 1197 43284 17 44826 24693District Total Rural
householdSC House
Hold% ST House
Hold% Backward Minority Landless % Marginal Small
108

Korba 729563 74419 10 96099 13 117498 6508 135926 19 130137 44950Koriya 421455 15655 4 123850 29 55828 3682 65433 16 95190 43895Mahasamund 734194 55624 8 74900 10 138773 2737 148096 20 107431 30279Mandla 305802 17982 6 106144 35 48000 1289 95880 31 53663 28801Mandsaur 261638 22628 9 9110 3 39466 3354 44047 17 26804 9152Morena 289640 17161 6 14016 5 28283 1648 40321 14 21585 7701Narsimhapur 143842 17813 12 16289 11 36075 2805 59020 41 13075 7642Neemuch 261638 22628 9 9110 3 39466 3354 44047 17 26804 9152Panna 156591 18795 12 17902 11 26785 2486 42363 27 20821 13257Raigarh 371281 31117 8 70681 19 55971 1587 69413 19 60167 32258Raipur 734194 55624 8 74900 10 138773 2737 148096 20 107431 30279Raisen 176860 20809 12 19338 11 37326 4050 68435 39 12520 8397Rajgarh 169200 22293 13 5297 3 42682 2956 36188 21 24863 19008Rajnandgaon 254366 14648 6 35671 14 60353 1197 43284 17 44826 24693Ratlam 141819 10753 8 27967 20 11429 3115 18890 13 23522 11013Rewa 371963 39948 11 37135 10 62392 4155 153083 41 40151 18259Sagar 287712 35424 12 23815 8 70336 2522 99935 35 26383 22679Satna 252000 15071 6 37761 15 42477 3692 62285 25 25305 16749Sehore 343976 19326 6 79779 23 36184 3817 69533 20 53580 24308Seoni 294688 25190 9 55939 19 38096 4302 95695 32 44428 26307Shahdol 305643 34402 11 36351 12 49771 2576 109291 36 33861 13851Shajapur 149831 18657 12 11054 7 21661 2401 41551 28 7758 4464Sheopur 289640 17161 6 14016 5 28283 1648 40321 14 21585 7701Shivpuri 175797 25644 15 3824 2 27225 4915 38514 22 17112 8140Sidhi 211649 16312 8 19915 9 22861 992 31770 15 20596 10318Surguja 421455 15655 4 123850 29 55828 3682 65433 16 95190 43895Tikamgarh 187376 17420 9 8624 5 35497 2203 29915 16 26818 10133Ujjain 180192 25466 14 2206 1 17645 1505 32662 18 14047 6289Umaria 305643 34402 11 36351 12 49771 2576 109291 36 33861 13851Vidisha 168305 18110 11 7580 5 32285 1045 45548 27 10898 9845West Nimar(Khargone) 357294 20100 6 104739 29 31896 2627 93863 26 40994 27235Source: District Poverty Initiative Programme, 1998, Madhya Pradesh.
109
Table 10: Distribution of Scheduled Caste Population 1991
District SC popn. Total Population % SC Division by mean method
Balaghat 113106 1365870 8 0.58
Barwani 57657 832422 7 0.49
Bastar 83433 1116896 7 0.53
Betul 127438 1181501 11 0.76
Bhind 260106 1219000 21 1.50
Bhopal 186538 1351479 14 0.97
Bilaspur 323474 1694883 19 1.34
Chhatarpur 274438 1158076 24 1.67
Chhindwara 191419 1568702 12 0.86
Damoh 180350 898125 20 1.42
Dantewada 25318 622267 4 0.29
Datia 128001 515360 25 1.75
Dewas 187680 1033807 18 1.28
Dhamtari 40307 587679 7 0.48
Dhar 94895 1367412 7 0.49
Dindori 33337 658482 5 0.36
Durg 305916 2397134 13 0.90
East Nimar (Khandwa)
163160 1431662 11 0.80
Guna 236903 1310317 18 1.27
Gwalior 258520 1293567 20 1.41
Harda 64104 380762 17 1.19
Hoshangabad 142258 886449 16 1.13
Indore 305767 1835915 17 1.17
Jabalpur 234873 1768037 13 0.94
Janjgir-Champa 248273 1110200 22 1.58
Jashpur 47012 656352 7 0.50
Jhabua 34641 1130405 3 0.22
Kaker 24130 532151 5 0.32
Katni 105039 881925 12 0.84
Kawardha 71191 513496 14 0.98
Korba 82481 825891 10 0.70
Koriya 39417 500758 8 0.55
Mahasamund 100350 791197 13 0.89
District SC popn. Total Population % SC Division by mean method
110

Mandla 34162 632781 5 0.38
Mandsaur 170063 956869 18 1.25
Morena 268405 1279094 21 1.48
Narsimhapur 130291 785496 17 1.17
Neemuch 76568 598339 13 0.90
Panna 140374 687945 20 1.44
Raigarh 148901 1065939 14 0.98
Raipur 422920 2529166 17 1.18
Raisen 145095 876461 17 1.17
Rajgarh 178714 992764 18 1.27
Rajnandgaon 109820 1089047 10 0.71
Ratlam 133376 971888 14 0.97
Rewa 229915 1554987 15 1.04
Sagar 347432 1647736 21 1.49
Satna 261505 1465384 18 1.26
Sehore 170796 841358 20 1.43
Seoni 107792 1000831 11 0.76
Shahdol 99709 1323054 8 0.53
Shajapur 230828 1033248 22 1.57
Sheopur 71836 431480 17 1.17
Shivpuri 219384 1132977 19 1.36
Sidhi 156157 1373434 11 0.80
Surguja 75415 1581872 5 0.34
Tikamgarh 214064 940829 23 1.60
Ujjain 339618 1383086 25 1.73
Umaria 34586 420815 8 0.58
Vidisha 197061 970388 20 1.43
West Nimar(Khargone)
140361 1195723 12 0.83
Madhya Pradesh 9626680 66181170
Mean 14.19Source: Census Of India, 1991, Web Site of Madhya Pradesh for data on 61 districts
111
Table 10A, 11A, 13A, 14A and 17A: Block Level data 1991
DISTRICT BLOCK SC ST Illiterate Agri- Lab Disp-LitBalaghat Baihar 3 64 70 28 2.00Balaghat Balaghat 8 20 59 36 1.76Balaghat Birsa 4 53 68 23 1.96Balaghat Katangi 12 14 56 34 1.78Balaghat Khairlanji 12 8 55 32 1.78Balaghat Kirnapur 9 8 56 33 1.78Balaghat Lalbarra 8 14 55 36 1.69Balaghat Lanji 8 18 56 33 1.83Balaghat Paraswada 4 52 62 31 1.96Balaghat Waraseoni 12 13 54 38 1.70Barwani Barwani 8 67 81 32 2.29Barwani Newali 6 86 87 12 1.92Barwani Pansemal 5 75 84 35 2.60Barwani Pati 3 84 95 10 2.14Barwani Rajpur 6 74 79 23 2.32Barwani Sendhwa 4 87 91 13 2.30Barwani Thikri 13 41 66 43 2.24Bastar Abhujhmad (Orcha) 2 94 93 7 3.59Bastar Baderajpur 3 76 83 13 3.55Bastar Bakaband 13 61 86 26 4.12Bastar Bastanar (Bade Kilep) 2 91 96 8 3.44Bastar Bastar 11 65 86 24 3.39Bastar Darbha 6 84 92 19 3.48Bastar Farasgaon 6 72 82 11 2.94Bastar Jagdalpur 14 62 82 47 2.71Bastar Keshkal 3 71 79 14 2.49Bastar Koilibeda 5 77 84 12 3.11Bastar Kondagaon 5 72 89 12 3.68Bastar Lohandiguda 6 76 91 20 2.92Bastar Makadi 3 77 89 12 4.09Bastar Narayanpur 4 71 81 11 2.38Bastar Tonkpal 10 73 88 27 2.72Betul Amla 14 27 65 36 1.83Betul Athner 7 48 68 25 1.82Betul Betul 9 38 66 37 1.74Betul Bhainsdehi 9 59 74 27 2.03Betul Bhimpura 4 84 87 21 2.89Betul Chicholi 6 61 74 33 2.08Betul Ghoda Dongri 7 57 75 31 2.11Betul Multai 11 11 58 22 1.81Betul Prabhat Pattam 16 25 60 29 1.66Betul Shahpur 8 63 75 26 2.41Bhind Ater 17 0 61 11 2.48
112

DISTRICT BLOCK SC ST Illiterate Agri- Lab Disp-LitBhind Bhind 20 0 61 10 2.29Bhind Gohad 28 1 67 18 3.35Bhind Lahar 26 0 66 18 3.00Bhind Mehgaon 20 0 64 16 2.94Bhind Ron Mihona 23 0 65 13 2.54Bhopal Berasia 24 3 76 37 3.40Bhopal Phanda 20 6 72 40 3.13Bilaspur Bilha 27 12 60 38 2.68Bilaspur Gaurella-1 5 64 75 20 2.84Bilaspur Gaurella-2 4 64 77 31 2.83Bilaspur Kota 10 47 71 35 2.99Bilaspur Lormi 26 17 74 30 3.73Bilaspur Marwahi 7 61 74 23 2.62Bilaspur Masturi 26 14 85 33 2.87Bilaspur Mungeli 32 5 72 32 3.21Bilaspur Pathariya 22 12 70 27 3.23Bilaspur Takhatpur 21 14 67 37 2.81Chhatarpur Bada Malhara 27 7 81 18 3.13Chhatarpur Bakswaha 18 12 77 32 2.99Chhatarpur Bijawar 22 14 82 27 2.73Chhatarpur Chhatarpur 25 3 80 21 2.92Chhatarpur Gaurihar 29 0 73 25 3.07Chhatarpur Laundi 29 1 75 22 2.94Chhatarpur Nowgaon 26 0 74 29 2.77Chhatarpur Rajnagar 21 6 79 23 2.73Chhindwara Amarwara 12 39 76 29 2.51Chhindwara Bichhua 11 55 73 32 2.22Chhindwara Chaurai 10 20 70 40 2.08Chhindwara Chhindwara 13 29 66 44 1.96Chhindwara Harrai 8 80 85 17 2.96Chhindwara Jamai 13 58 79 20 2.18Chhindwara Mohkhra 10 29 67 32 2.09Chhindwara Pandhurna 11 41 64 38 1.80Chhindwara Parasia 14 40 73 26 2.10Chhindwara Sausar 14 22 58 44 1.64Chhindwara Tamia 6 78 78 21 2.74Damoh Batiagarh 21 11 69 46 2.33Damoh Damoh 20 12 70 42 2.35Damoh Hatta 23 12 71 43 2.25Damoh Jabera 18 23 66 41 2.42Damoh Patera 22 10 69 39 2.27Damoh Patharia 23 5 62 45 2.17Damoh Tendukheda 15 30 74 33 2.76Dantewada Abhujhmad (Orchha) 0 98 98 1 4.15Dantewada Bhairamgarh 2 87 94 5 2.99Dantewada Bhopalpattanam (Matd) 8 75 80 25 3.06
DISTRICT BLOCK SC ST Illiterate Agri- Lab Disp-LitDantewada Bijapur 7 79 87 5 2.58
113
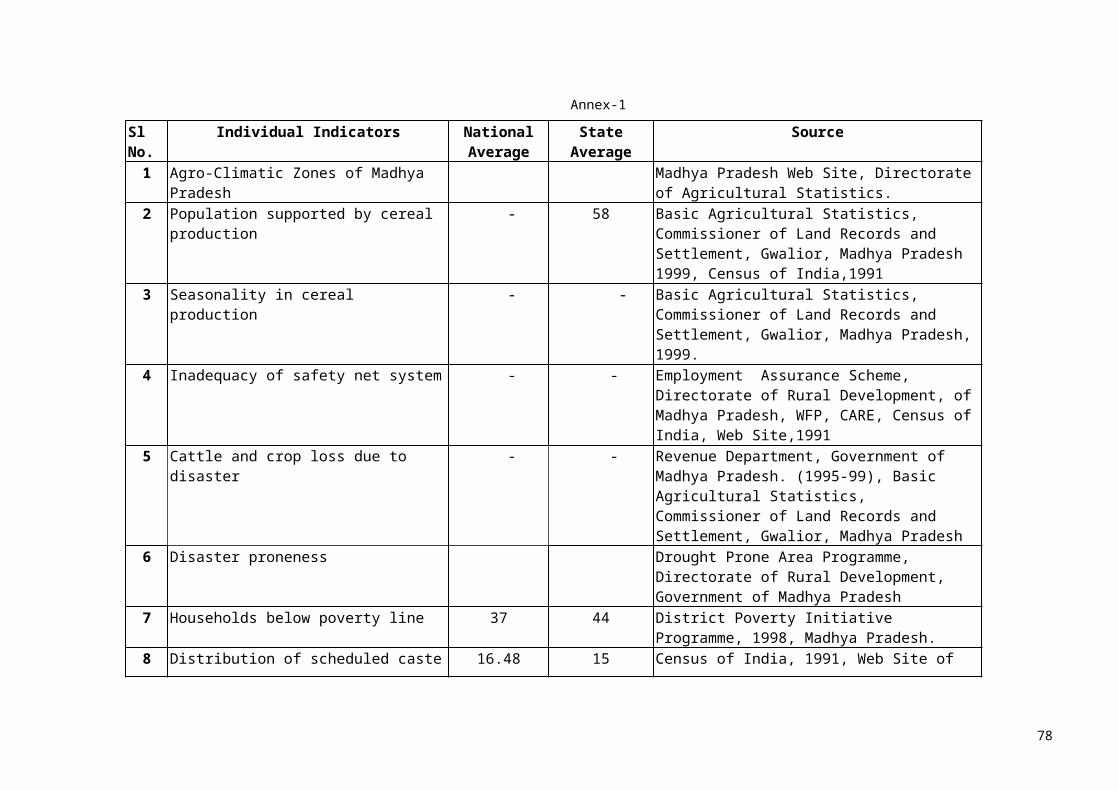
Dantewada Chhindgarh 3 83 90 10 3.06Dantewada Dantewada 4 72 86 10 2.28Dantewada Geedam 5 67 88 9 2.36Dantewada Katekalyan 2 94 97 7 3.77Dantewada Konta 2 90 92 4 2.24Dantewada Kuwankonda 2 88 94 13 3.44Dantewada Sukma 5 77 86 5 2.20Dantewada Usur 4 85 90 14 3.08Datia Bhander 26 1 61 20 3.00Datia Datia 28 3 70 20 3.46Datia Seondha 26 0 69 13 3.62Dewas Bagli 17 34 76 37 3.17Dewas Dewas 22 4 64 39 3.29Dewas Kannod 14 37 80 47 3.49Dewas Khategaon 16 24 73 45 2.75Dewas Sonkatch 29 2 68 37 3.79Dewas Tonk Khurd 24 1 66 39 3.85Dhamtari Dhamtari 6 21 56 45 1.95Dhamtari Kurud 10 9 57 37 1.96Dhamtari Magarlod 5 25 64 40 2.36Dhamtari Sihawa (Nagri) 4 62 62 30 2.12Dhar Badnagar 12 33 70 34 2.89Dhar Bagh 2 95 91 7 2.64Dhar Bankaner (Umarban) 5 75 81 21 2.76Dhar Dahi 4 84 84 10 2.70Dhar Dhar 17 12 68 42 3.46Dhar Dharampuri 8 55 71 45 2.20Dhar Gandhwani 2 88 87 13 2.32Dhar Kukshi 5 82 79 15 2.46Dhar Manawar 8 57 74 37 2.42Dhar Nalcha 8 44 73 29 3.06Dhar Nisarpur 9 47 68 46 2.05Dhar Sardarpur 4 58 77 28 3.21Dhar Tirla 4 72 81 32 2.87Dindori Amarpur 4 66 72 23 2.49Dindori Bajang 6 64 74 27 2.35Dindori Dindori 6 60 74 27 3.01Dindori Ghughri 2 77 80 14 3.20Dindori Karanjia 4 73 75 17 2.69Dindori Mawai 2 74 77 26 2.75Dindori Mohgaon 2 73 78 14 2.76Dindori Samnapur 3 63 73 26 2.78Dindori Shahpura 14 65 76 27 3.63Durg Bemetara 19 5 70 38 4.63Durg Berla 14 3 66 39 2.34
DISTRICT BLOCK SC ST Illiterate Agri- Lab Disp-LitDurg Dhamdha 19 5 64 37 2.38Durg Dondi 5 66 58 20 2.02Durg Dondilohara 6 47 55 18 1.98Durg Durg 13 6 56 45 1.90
114
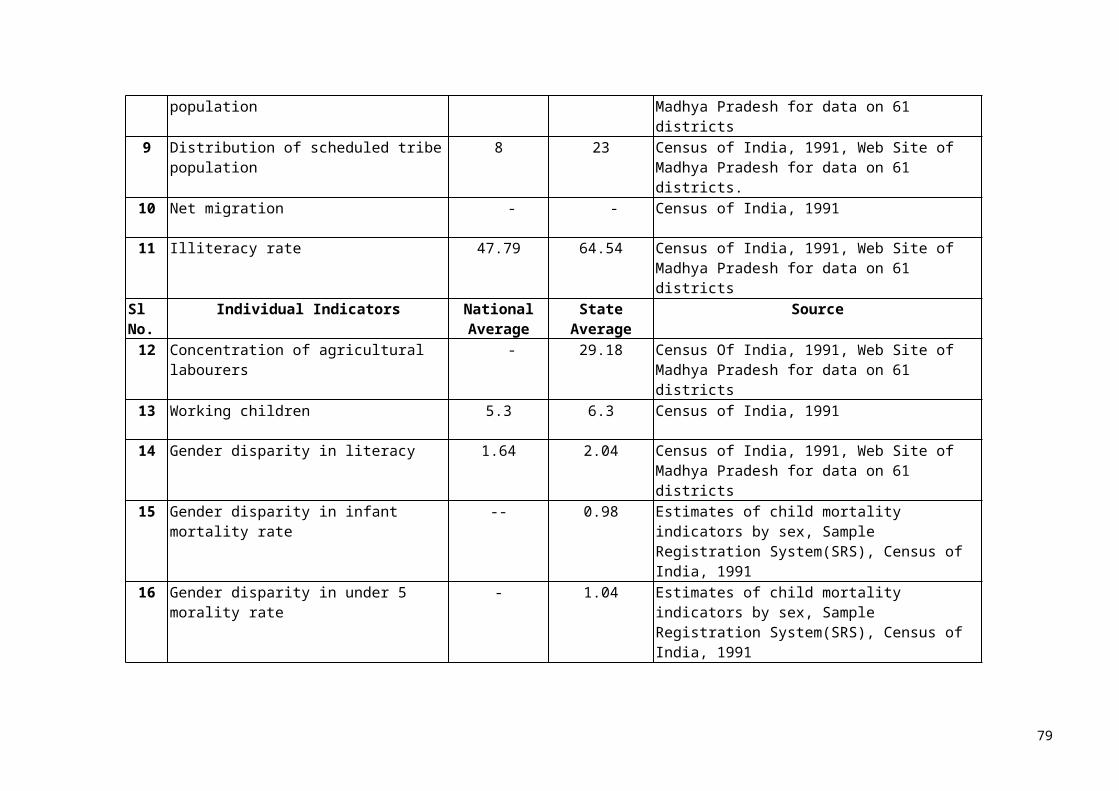
Durg Gunderdehi 13 13 52 33 1.76Durg Gurur 6 21 52 40 1.73Durg Nawagarh 27 4 68 31 2.76Durg Patan 15 9 55 45 1.81Durg Saja 10 7 67 39 2.53Durg Sanjari Balod 7 31 51 33 1.79East Nimar (Khandwa) Baladi 15 24 72 38 2.92East Nimar (Khandwa) Burhanpur 12 29 72 52 2.01East Nimar (Khandwa) Chhegaon Makhan 19 19 62 39 2.47East Nimar (Khandwa) Harsud 15 17 68 36 2.83East Nimar (Khandwa) Khaknar 6 50 74 51 2.25East Nimar (Khandwa) Khalawa 6 68 81 23 2.78East Nimar (Khandwa) Khandwa 19 20 65 43 2.39East Nimar (Khandwa) Pandhana 11 43 71 37 2.33East Nimar (Khandwa) Punasa 14 31 72 40 2.86Guna Aron 23 6 82 25 4.97Guna Ashok Nagar 28 3 75 25 4.18Guna Bamori 12 28 82 25 4.69Guna Chachaura 13 13 84 16 5.90Guna Chanderi 15 17 81 18 5.00Guna Guna 19 22 79 23 4.22Guna Isagarh 21 12 69 27 3.59Guna Mungaoli 20 11 74 98 3.49Guna Raghogarh 17 14 80 24 4.03Gwalior Bhitarwar 25 5 70 21 3.45Gwalior Dabra 28 5 70 25 3.38Gwalior Ghatigaon (Barai) 13 14 76 23 3.63Gwalior Morar 25 1 72 13 4.06Harda Harda 21 23 67 53 2.18Harda Khirkiya 16 33 67 42 2.16Harda Timarni 16 31 67 44 2.15Hoshangabad Babai 14 10 66 46 2.44Hoshangabad Bankhedi 21 17 70 48 2.25Hoshangabad Hoshangabad 17 9 77 35 1.93Hoshangabad Kesla 13 39 63 45 1.87Hoshangabad Piparia 19 19 70 46 2.42Hoshangabad Seoni Malwa 15 21 63 40 2.10Hoshangabad Sohagpur 17 16 73 42 2.78Indore Depalpur 20 4 70 38 4.37Indore Indore 21 11 62 42 2.37Indore Mhow 12 31 23 44 2.93Indore Sawer 26 3 64 46 3.09
DISTRICT BLOCK SC ST Illiterate Agri- Lab Disp-LitJabalpur Jabalpur 12 29 64 47 2.06Jabalpur Kundam 8 71 74 35 2.65Jabalpur Majholi 13 20 62 50 2.21Jabalpur Panagar 13 23 58 61 1.90Jabalpur Patan 17 15 59 59 1.89Jabalpur Shahpur 14 24 65 53 2.04Jabalpur Sihora 13 19 56 50 2.02
115
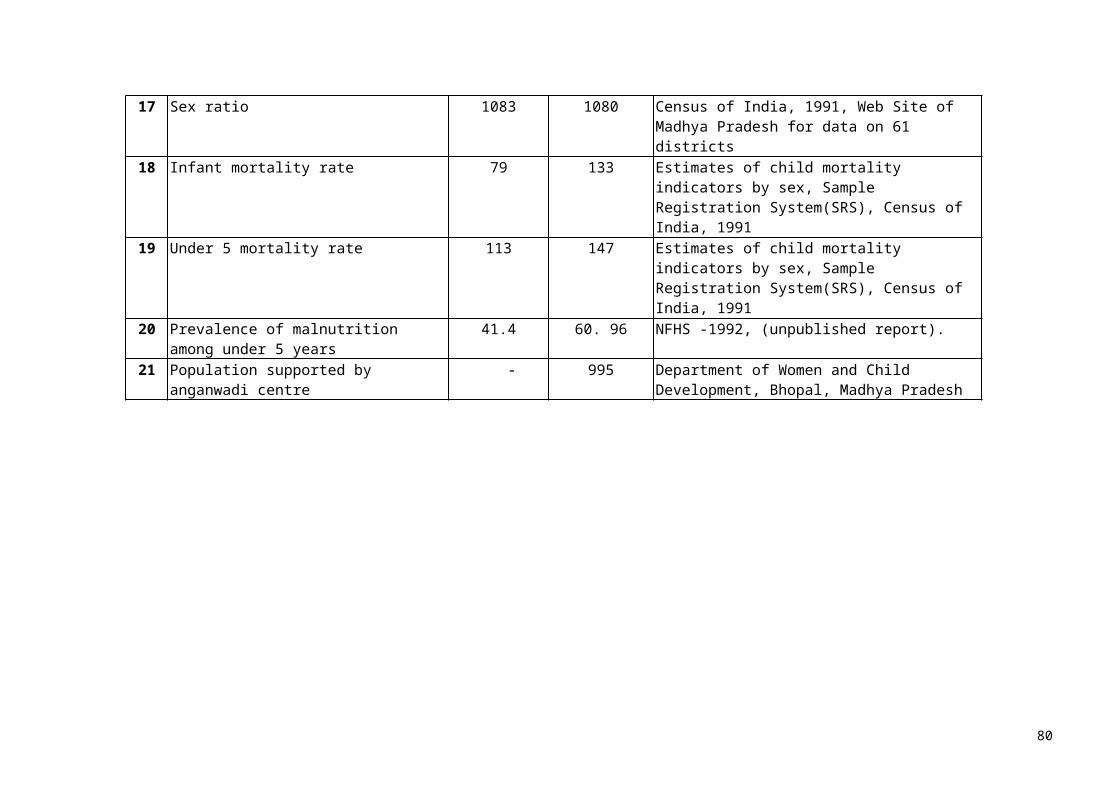
Janjgir-Champa Akaltara 23 15 62 25 2.55Janjgir-Champa Baloda 21 17 63 28 2.73Janjgir-Champa Bamhanidih (Champa) 17 10 62 30 2.58Janjgir-Champa Dabhra 19 21 63 41 2.30Janjgir-Champa Jaijaipur 26 11 69 23 2.98Janjgir-Champa Malkharoda 29 12 65 32 2.44Janjgir-Champa Nawagarh 24 3 63 22 2.69Janjgir-Champa Pamgarh 33 5 66 19 2.77Janjgir-Champa Sakti 14 29 64 34 2.76Jashpur Bageecha 4 72 74 12 2.11Jashpur Duldula 7 53 66 17 1.96Jashpur Farsabahar (Tapkara) 9 66 70 27 2.02Jashpur Jashpur Nagar 6 69 62 10 1.67Jashpur Kansavel 9 65 70 14 1.98Jashpur Kunkuri 9 53 62 18 1.76Jashpur Manora 4 82 70 9 1.86Jashpur Pathalgaon 8 68 76 21 2.74Jhabua Alirajpur 4 92 91 4 2.91Jhabua Bhabra 1 97 92 4 3.42Jhabua Jhabua 1 95 91 5 3.02Jhabua Jobat 3 96 90 5 3.02Jhabua Kattiwada 12 82 92 12 2.27Jhabua Meghnagar 2 87 84 8 2.48Jhabua Petlawad 2 80 84 7 3.20Jhabua Rama 1 94 90 7 3.00Jhabua Ranapur 1 97 91 5 4.28Jhabua Sondwa 4 93 92 5 3.54Jhabua Thandla 1 94 90 9 3.08Jhabua Udaigarh 2 94 91 3 2.62Kaker Antagarh 5 77 81 10 2.91Kaker Bhanupratappur 6 64 68 18 2.16Kaker Charama 6 49 60 27 1.95Kaker Durg Kondal 6 77 81 9 2.83Kaker Kanker 5 61 66 27 2.23Kaker Koilibeda 1 26 69 8 1.92Kaker Sarona (Narharpur) 4 68 71 24 2.56Katni Badwara 10 34 71 40 3.11Katni Bahoriband 13 22 65 42 2.37Katni Dhimarkheda 11 32 66 40 2.47
DISTRICT BLOCK SC ST Illiterate Agri- Lab Disp-LitKatni Katni 12 28 67 39 2.60Katni Rithi 14 25 69 32 2.77Katni Vijairaghavgarh 11 27 70 31 3.09Kawardha Bodla 9 38 81 22 3.63Kawardha Kawardha 16 8 76 32 3.84Kawardha Pandaria 20 22 79 23 3.86Kawardha Sahaspur Lohara 7 16 76 28 3.31Korba Kartala 11 50 69 27 2.98Korba Katghora 12 29 58 26 2.07Korba Korba 13 54 72 32 2.79
116

Korba Pali 8 54 70 28 3.05Korba Pondiuproda 4 73 78 25 3.08Koriya Baikunthpur 7 42 73 15 2.75Koriya Bharatpur (Janakpur) 6 66 79 21 3.07Koriya Khadgawan 6 73 84 13 3.90Koriya Manendragarh 7 69 83 17 3.45Koriya Sonhat 6 57 81 14 3.47Mahasamund Bagbahara 10 34 69 40 2.77Mahasamund Basna 13 29 67 37 2.42Mahasamund Mahasamund 15 24 67 41 2.71Mahasamund Pithora 9 36 67 37 2.46Mahasamund Saraipali 16 27 62 39 2.19Mandla Bichhiya 8 53 66 32 2.31Mandla Bijadandi 2 83 74 25 2.93Mandla Mandla 4 48 65 38 2.20Mandla Mehadwani 1 78 81 10 3.63Mandla Nainpur 6 55 67 36 2.25Mandla Narayanganj 3 71 76 32 2.79Mandla Niwas 8 62 70 35 2.50Mandsaur Bhanpura 16 5 68 32 3.09Mandsaur Garoth 21 1 70 24 3.61Mandsaur Malhargarh 20 5 64 22 3.26Mandsaur Mandsaur 18 5 62 25 3.08Mandsaur Sitamau 22 1 69 26 2.99Morena Ambah 24 0 62 8 2.58Morena Joura 19 0 69 8 3.92Morena Kailaras 19 2 71 6 5.03Morena Morena 20 0 70 8 4.56Morena Pahadgarh 19 3 71 7 3.99Morena Porsa 22 0 62 8 2.42Morena Sabalgarh 24 2 71 4 3.93Narsimhapur Babai Chichli 18 15 64 48 1.85Narsimhapur Chawarpatha 16 10 57 49 1.73Narsimhapur Gotegaon 20 19 56 51 1.76Narsimhapur Kareli 15 14 55 55 1.66Narsimhapur Narsimhapur 18 22 58 41 1.79
DISTRICT BLOCK SC ST Illiterate Agri- Lab Disp-LitNarsimhapur Saikheda (Gadarwara) 16 5 61 50 1.96Neemuch Jawad 12 15 67 17 3.22Neemuch Manasa 13 8 66 20 3.12Neemuch Neemuch 14 7 63 27 3.08Panna Ajaigarh 21 9 79 23 3.55Panna Gunnor 24 9 75 38 2.78Panna Panna 20 22 76 33 2.55Panna Pawai 23 14 77 32 2.78Panna Shahnagar 17 29 77 27 3.00Raigarh Gharghoda 7 64 73 27 2.84Raigarh Kharsia 11 35 63 33 2.53Raigarh Lailunga 7 64 76 34 2.66Raigarh Pusaur 14 24 58 42 2.00
117

Raigarh Raigarh 14 34 61 45 2.17Raigarh Sarai Lenha (Baram K) 16 23 62 43 2.11Raigarh Sarangarh 30 16 69 35 2.72Raigarh Tamnar 10 54 66 33 2.33Raigarh Udaipur (Dharamjaiga) 6 70 79 22 3.14Raipur Abhanpur 19 6 62 38 2.20Raipur Balodabazar 21 15 70 30 3.43Raipur Bhatapara 17 23 72 29 3.24Raipur Bilaigarh 31 10 70 16 3.27Raipur Chandkhurai (Arang) 25 4 66 39 2.39Raipur Deobhog 14 26 78 35 4.24Raipur Dhhura 7 49 67 41 2.41Raipur Gariaband 6 62 69 39 2.47Raipur Kasdol 12 25 70 18 3.27Raipur Mainpur 9 52 78 30 3.57Raipur Palari 28 8 67 33 2.78Raipur Raipur (Dharsiwa) 16 4 62 42 2.21Raipur Rajim 12 12 63 38 2.38Raipur Simga 21 9 68 32 2.59Raipur Tilda 18 4 62 42 2.10Raisen Baraily 21 9 72 49 2.72Raisen Begamganj 19 11 73 42 2.40Raisen Gairatganj 21 12 71 41 2.55Raisen Obedullaganj 13 29 72 57 2.57Raisen Sanchi 20 11 73 41 2.90Raisen Silwani 12 45 71 53 1.99Raisen Udaipura 17 11 68 50 2.22Rajgarh Biaora 18 4 82 22 4.72Rajgarh Jirapur 20 1 81 21 4.37Rajgarh Khilchipur 12 3 84 14 4.02Rajgarh Narsingarh 21 3 75 35 4.27Rajgarh Rajgarh 17 4 85 19 4.26Rajgarh Sarangpur 21 8 73 33 4.18
DISTRICT BLOCK SC ST Illiterate Agri- Lab Disp-LitRajnandgaon Chauki 11 52 61 18 2.14Rajnandgaon Chhuikhadan 8 21 74 26 3.40Rajnandgaon Chhuria 8 43 62 17 2.22Rajnandgaon Dongargaon 10 16 58 17 2.12Rajnandgaon Dongargarh 7 30 65 24 2.38Rajnandgaon Khairagarh 12 10 70 25 2.70Rajnandgaon Manpur 5 75 72 10 2.34Rajnandgaon Mohla 6 71 63 14 2.28Rajnandgaon Rajnandgaon 12 7 60 27 2.25Ratlam Alot 23 1 79 22 4.90Ratlam Bajna 2 91 88 8 2.69Ratlam Jaora 26 5 70 27 3.22Ratlam Piploda 17 15 67 27 3.21Ratlam Ratlam 14 33 70 32 3.16Ratlam Sailana 2 86 88 13 2.73Rewa Gangeve 16 9 66 44 2.37
118

Rewa Hanumana 15 20 75 41 3.25Rewa Jawa 17 19 68 48 2.60Rewa Mauganj 16 11 69 48 2.57Rewa Naigarhi 19 6 71 45 2.81Rewa Raipur (Karchulian) 15 11 65 47 2.31Rewa Rewa 15 10 65 49 2.30Rewa Sirmour 15 15 66 46 2.38Rewa Teonthar 14 19 69 47 2.55Sagar Banda 22 11 69 33 2.69Sagar Bina 25 8 62 38 2.28Sagar Deori 15 20 67 46 1.92Sagar Jaisinagar 22 6 64 39 2.12Sagar Kesali 12 28 68 42 2.00Sagar Khurai 29 7 62 43 2.25Sagar Malthone 21 10 65 39 2.38Sagar Rahatgarh 23 7 62 46 2.05Sagar Rehli 18 11 69 38 2.43Sagar Sagar 25 9 60 45 2.09Sagar Shahgarh 22 13 76 28 2.81Satna Amarpatan 14 13 67 44 2.50Satna Chitrakut (Majhgawan) 18 19 72 30 2.96Satna Maihar 16 21 71 34 2.89Satna Nagod 25 9 68 41 2.31Satna Ramnagar 13 25 72 43 2.76Satna Rampur Baghelan 16 11 65 41 2.22Satna Satna 26 10 65 48 2.20Satna Unchahara 18 20 70 38 2.53Sehore Ashta 32 3 74 31 4.73Sehore Budni 13 18 65 53 2.17Sehore Icchawar 21 18 76 28 4.31
DISTRICT BLOCK SC ST Illiterate Agri- Lab Disp-LitSehore Nasrullaganj 16 31 73 47 2.73Sehore Sehore 19 4 73 35 3.76Seoni Barghat 7 25 61 38 1.78Seoni Chhapara 10 51 73 39 2.41Seoni Dhanaura 9 58 74 39 2.23Seoni Kahnapas (Ghansaur) 7 59 73 41 2.25Seoni Keolari 11 29 63 38 1.82Seoni Kurai 8 48 66 32 2.10Seoni Lakhnadon 13 51 72 36 2.27Seoni Seoni 16 27 64 44 1.89Shahdol Anuppur 11 37 73 22 3.02Shahdol Beohari 8 43 77 34 3.51Shahdol Burhar 8 59 79 31 3.31Shahdol Jaisinghnagar 8 53 80 34 3.16Shahdol Jaithari 7 49 76 31 2.90Shahdol Kotma 11 42 78 25 3.69Shahdol Pali (Gohparu) 7 64 82 32 3.37Shahdol Pushprajgarh 3 78 80 22 3.33Shahdol Sohagpur 5 55 79 41 2.66
119

Shajapur Agar 30 1 80 36 4.57Shajapur Bagdod 25 0 83 30 5.41Shajapur Kala Pipal 18 1 67 37 3.57Shajapur Moman Badodia 26 6 72 42 3.95Shajapur Nalkheda 24 8 76 32 4.34Shajapur ShajaPur 27 2 67 40 3.06Shajapur Shujalpur 24 1 70 40 4.59Shajapur Susner 24 3 77 31 3.84Sheopur Bijeypur 18 19 80 7 4.70Sheopur Karahal 7 58 88 30 3.49Sheopur Sheopur 20 12 82 19 5.30Shivpuri Badarwas 18 18 79 20 4.84Shivpuri Karera 22 5 77 10 4.17Shivpuri Khaniyadhana 17 15 83 14 5.19Shivpuri Kolaras 23 16 82 21 4.99Shivpuri Narwar 22 3 76 11 4.00Shivpuri Pichhore 17 14 81 14 4.71Shivpuri Pohri 20 16 76 13 4.47Shivpuri Shivpuri 20 19 78 2 4.75Sidhi Baidhan 15 23 79 17 4.57Sidhi Chitrangi 11 45 85 23 4.87Sidhi Deosar 12 44 84 17 5.16Sidhi Kusmi 6 65 84 26 3.72Sidhi Majholi 7 33 78 29 3.23Sidhi Rampur Naikin 12 21 72 44 2.51Sidhi Sidhi 13 31 76 40 2.98Sidhi Sihawal 10 19 78 35 3.96
DISTRICT BLOCK SC ST Illiterate Agri- Lab Disp-LitSurguja Ambikapur 5 54 76 25 2.55Surguja Balrampur 3 61 82 32 2.66Surguja Batauli 3 78 79 15 2.65Surguja Bhaiyathan 7 34 77 16 2.83Surguja Kusmi 6 77 79 16 2.65Surguja Lakhanpur 6 51 83 14 3.22Surguja Lundra 4 69 83 24 2.96Surguja Mainpat 3 76 84 19 2.77Surguja Odgi 4 62 85 17 3.65Surguja Pratappur 4 66 82 20 3.02Surguja Premnagar 4 60 86 13 3.85Surguja Rajpur 2 73 84 20 2.71Surguja Ramanujnagar 6 46 80 13 3.80Surguja Ramchandrapur (Raman) 4 57 85 39 3.72Surguja Shankargarh 6 74 78 15 2.63Surguja Sitapur 5 71 74 20 2.29Surguja Surajpur 5 36 78 15 3.16Surguja Udaipur 6 66 84 17 3.15Surguja Wadrafnagar 6 60 81 25 3.29Tikamgarh Baldeogarh 20 5 80 11 2.90Tikamgarh Jatara 23 5 76 13 2.74Tikamgarh Niwari 26 4 67 18 2.66
120
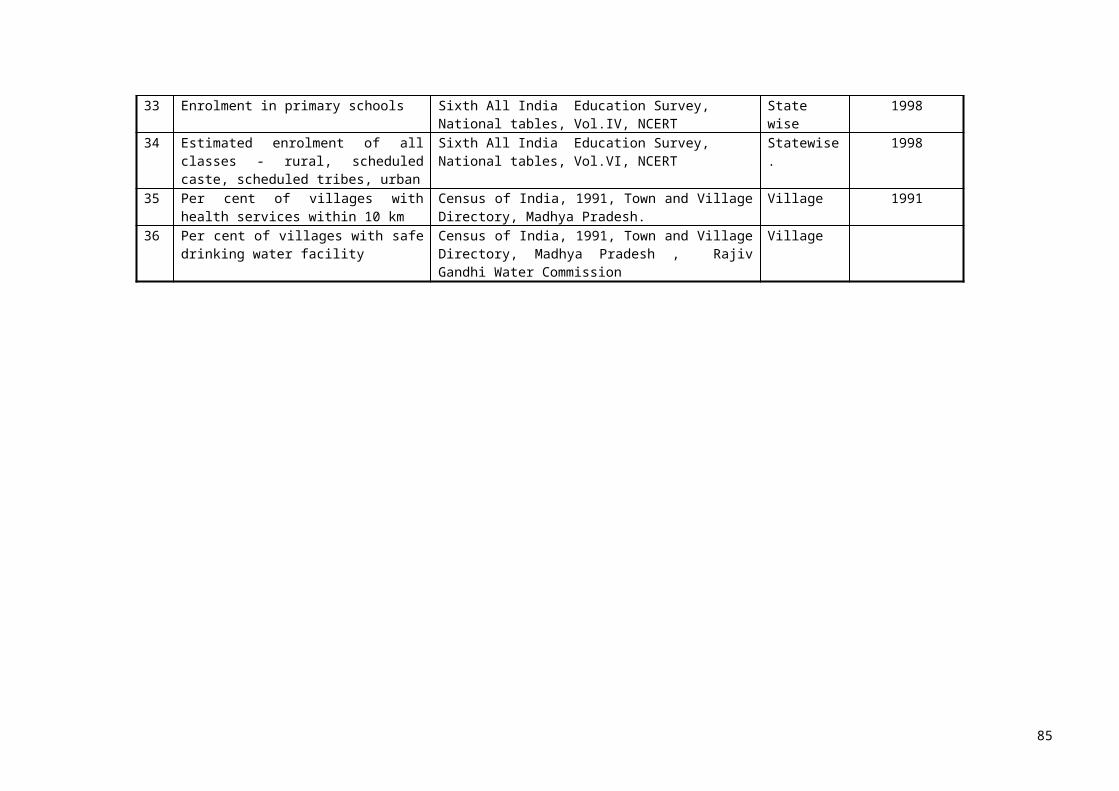
Tikamgarh Palera 28 4 76 12 3.05Tikamgarh Prithvipur 21 6 77 10 3.00Tikamgarh Tikamgarh 23 5 79 14 3.09Ujjain Badnagar 23 7 69 41 3.48Ujjain Ghatiya 31 1 73 38 3.62Ujjain Khacharod 32 3 75 27 4.51Ujjain Mahidpur 29 1 77 31 4.14Ujjain Tarana 34 2 72 39 3.70Ujjain Ujjain 33 1 70 46 3.40Umaria Manpur 10 39 77 33 3.27Umaria Pali 4 73 80 34 2.96Umaria Umaria (Karkeli) 6 55 78 30 3.60Vidisa Basoda 22 7 67 43 2.52Vidisa Gyaraspur 19 6 66 47 2.46Vidisa Kurwai 24 7 66 45 2.41Vidisa Lateri 20 9 81 34 3.98Vidisa Nateran 20 4 74 41 3.24Vidisa Sironj 23 2 78 38 3.45Vidisa Vidisa 22 4 65 47 2.47West Nimar (Khargone) Barwaha 19 17 68 42 2.70West Nimar (Khargone) Bhagwanpura 3 84 89 24 2.71West Nimar (Khargone) Bhikangaon 8 42 72 34 2.66West Nimar (Khargone) Gogawan 12 22 66 42 2.53West Nimar (Khargone) Jhiranya 4 77 88 29 2.57
DISTRICT BLOCK SC ST Illiterate Agri- Lab Disp-LitWest Nimar (Khargone) Kasrawad 15 19 66 44 2.39West Nimar (Khargone) Khargone 15 14 57 39 2.18West Nimar (Khargone) Maheshwar 20 25 64 50 2.16West Nimar (Khargone) Segaon 5 72 74 24 2.18
Source: Census Of India, 1991, Web Site of Madhya Pradesh for data on 61 districts
121

Table 11: Distribution of Scheduled Tribe Population 1991
District Total ST Total Persons % ST Division by meanBalaghat 298665 1365870 22 0.86Barwani 539690 832422 65 2.55Bastar 742799 1116896 67 2.62Betul 443132 1181501 38 1.48Bhind 3291 1219000 0 0.01Bhopal 41205 1351479 3 0.12Bilaspur 347216 1694883 20 0.81Chhatarpur 43482 1158076 4 0.15Chhindwara 540708 1568702 34 1.36Damoh 111114 898125 12 0.49Dantewada 490505 622267 79 3.10Datia 7605 515360 1 0.06Dewas 155493 1033807 15 0.59Dhamtari 160175 587679 27 1.07Dhar 731272 1367412 53 2.10Dindori 439073 658482 67 2.62Durg 298059 2397134 12 0.49East Nimar (Khandwa) 383231 1431662 27 1.05Guna 157426 1310317 12 0.47Gwalior 40151 1293567 3 0.12Harda 92064 380762 24 0.95Hoshangabad 127974 886449 14 0.57Indore 100913 1835915 5 0.22Jabalpur 263347 1768037 15 0.59Janjgir-Champa 135641 1110200 12 0.48Jashpur 429092 656352 65 2.57Jhabua 968372 1130405 86 3.37Kaker 296584 532151 56 2.19Katni 211119 881925 24 0.94Kawardha 103946 513496 20 0.80Korba 356222 825891 43 1.70Koriya 220360 500758 44 1.73Mahasamund 222298 791197 28 1.11Mandla 346514 632781 55 2.15Mandsaur 27251 956869 3 0.11Morena 8578 1279094 1 0.03Narsimhapur 101368 785496 13 0.51
122
District Total ST Total Persons % ST Division by meanNeemuch 47374 598339 8 0.31Panna 102520 687945 15 0.59Raigarh 392385 1065939 37 1.45Raipur 331554 2529166 13 0.52Raisen 126254 876461 14 0.57Rajgarh 32775 992764 3 0.13Rajnandgaon 293071 1089047 27 1.06Ratlam 226156 971888 23 0.92Rewa 193105 1554987 12 0.49Sagar 139467 1647736 8 0.33Satna 202412 1465384 14 0.54Sehore 85643 841358 10 0.40Seoni 369827 1000831 37 1.45Shahdol 612866 1323054 46 1.82Shajapur 24452 1033248 2 0.09Sheopur 86638 431480 20 0.79Shivpuri 127762 1132977 11 0.44Sidhi 418004 1373434 30 1.20Surguja 897217 1581872 57 2.23Tikamgarh 38850 940829 4 0.16Ujjain 29160 1383086 2 0.08Umaria 194898 420815 46 1.82Vidisha 42689 970388 4 0.17West Nimar(Khargone) 398020 1195723 33 1.31Madhya Pradesh 15399034 66181170
Mean: 25.42Source: Census Of India, 1991, Web Site of Madhya Pradesh for data on 61 districts
123

Table 12: Districtwise Net Migration 1991
District Total Population Outmigration Inmigration Net Migration
Balaghat 1365870 61019 53125 0.01
Barwani 832422 186573 92668 0.11
Bastar 1116896 36940 78042 -0.04
Betul 1181501 64153 35650 0.02
Bhind 1219000 115769 64208 0.04
Bhopal 1351479 93448 273730 -0.13
Bilaspur 1694883 235557 213791 0.01
Chhatarpur 1158076 65151 61025 0.00
Chhindwara 1568702 71580 79078 0.00
Damoh 898125 87033 81593 0.01
Dantewada 622267 36940 78042 -0.07
Datia 515360 49280 45029 0.01
Dewas 1033807 126659 154663 -0.03
Dhamtari 587679 243632 230064 0.02
Dhar 1367412 148774 122566 0.02
Dindori 658482 83594 62221 0.03
Durg 2397134 219284 274117 -0.02
East Nimar (Khandwa) 1431662 111083 117214 0.00
Guna 1310317 75396 89855 -0.01
Gwalior 1293567 123284 145817 -0.02
Harda 380762 154666 131318 0.06
Hoshangabad 886449 154666 131318 0.03
Indore 1835915 192176 285103 -0.05
Jabalpur 1768037 198965 231775 -0.02
Janjgir-Champa 1110200 65151 61025 0.00
Jashpur 656352 114071 95402 0.03
Jhabua 1130405 63843 37623 0.02
Kaker 532151 36940 78042 -0.08
Katni 881925 198965 231775 -0.04
Kawardha 513496 142308 121139 0.04
Korba 825891 65151 61025 0.00
Koriya 500758 62722 104010 -0.08
124
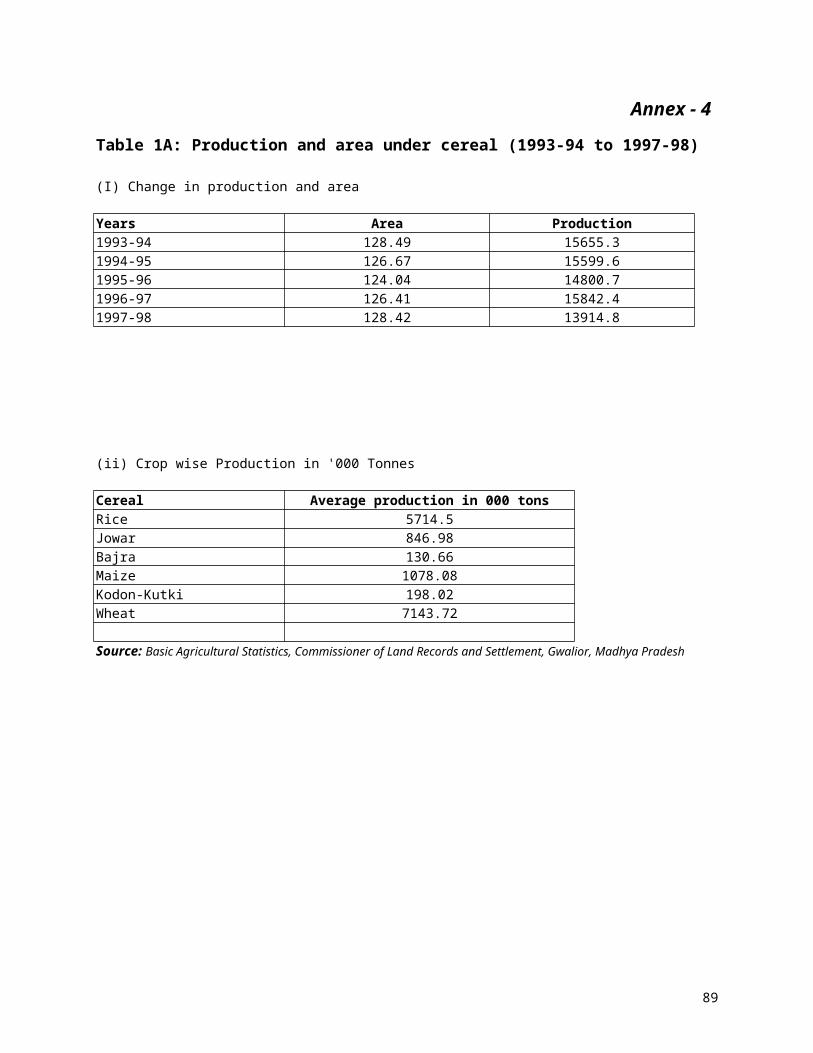
District Total Population Outmigration Inmigration Net Migration
Mahasamund 791197 243632 230064 0.02
Mandla 632781 83594 62221 0.03
Mandsaur 956869 63290 71223 -0.01
Morena 1279094 87563 80908 0.01
Narsimhapur 785496 95987 63980 0.04
Neemuch 598339 63290 71223 -0.01
Panna 687945 58162 53323 0.01
Raigarh 1065939 114071 95402 0.02
Raipur 2529166 243632 230064 0.01
Raisen 876461 85382 104735 -0.02
Rajgarh 992764 87742 63053 0.02
Rajnandgaon 1089047 142308 121139 0.02
Ratlam 971888 113024 112608 0.00
Rewa 1554987 162861 73934 0.06
Sagar 1647736 160101 116526 0.03
Satna 1465384 129591 117364 0.01
Sehore 841358 103853 108117 -0.01
Seoni 1000831 89026 65801 0.02
Shahdol 1323054 90115 143162 -0.04
Shajapur 1033248 123896 119431 0.00
Sheopur 431480 87563 80908 0.02
Shivpuri 1132977 68244 68976 0.00
Sidhi 1373434 63544 55214 0.01
Surguja 1581872 62722 104010 -0.03
Tikamgarh 940829 41355 30486 0.01
Ujjain 1383086 189614 202379 -0.01
Umaria 420815 90115 143162 -0.13
Vidisha 970388 96829 95093 0.00
West Nimar(Khargone) 1195723 186573 92668 0.08
Source: Census Of India, 1991
125

Table 13: Illiteracy rate 1991
District Total Population Literates Males Females % Literates Illiterates Division by mean method
Balaghat 1365870 596248 377269 218979 43.65 56.35 0.86
Barwani 832422 180619 120754 59865 21.70 78.30 1.19
Bastar 1116896 201623 141792 59831 18.05 81.95 1.24
Betul 1181501 430720 274644 156076 36.46 63.54 0.97
Bhind 1219000 476192 354385 121807 39.06 60.94 0.93
Bhopal 1351479 715924 433529 282395 52.97 47.03 0.71
Bilaspur 1694883 620049 431945 188104 36.58 63.42 0.96
Chhatarpur 1158076 322757 233500 89257 27.87 72.13 1.10
Chhindwara 1568702 564751 365698 199053 36.00 64.00 0.97
Damoh 898125 331163 227948 103215 36.87 63.13 0.96
Dantewada 622267 80938 56054 24884 13.01 86.99 1.32
Datia 515360 186995 140976 46019 36.28 63.72 0.97
Dewas 1033807 364909 263424 101485 35.30 64.70 0.98
Dhamtari 587679 252635 165891 86744 42.99 57.01 0.87
Dhar 1367412 376631 266848 109783 27.54 72.46 1.10
Dindori 658482 168101 122968 45133 25.53 74.47 1.13
Durg 2397134 1147427 737004 410423 47.87 52.13 0.79
East Nimar (Khandwa) 1431662 519136 345344 173792 36.26 63.74 0.97
Guna 1310317 357165 271204 85961 27.26 72.74 1.10
Gwalior 1293567 612942 409224 203718 47.38 52.62 0.80
Harda 380762 147718 99109 48609 38.80 61.20 0.93
Hoshangabad 886449 387973 255795 132178 43.77 56.23 0.85
Indore 1835915 1008945 624729 384216 54.96 45.04 0.68
Jabalpur 1768037 941565 582304 359261 53.25 46.75 0.71
Janjgir-Champa 1110200 422959 299122 123837 38.10 61.90 0.94
Jashpur 656352 203303 135112 68191 30.97 69.03 1.05
Jhabua 1130405 164321 115212 49109 14.54 85.46 1.30
Kaker 532151 169086 114796 54290 31.77 68.23 1.04
Katni 881925 338807 234284 104523 38.42 61.58 0.94
Kawardha 513496 121158 92358 28800 23.59 76.41 1.16
Korba 825891 298446 208314 90132 36.14 63.86 0.97
Koriya 500758 153354 107141 46213 30.62 69.38 1.05
District Total Population Literates Males Females % Literates Illiterates Division by mean method
126
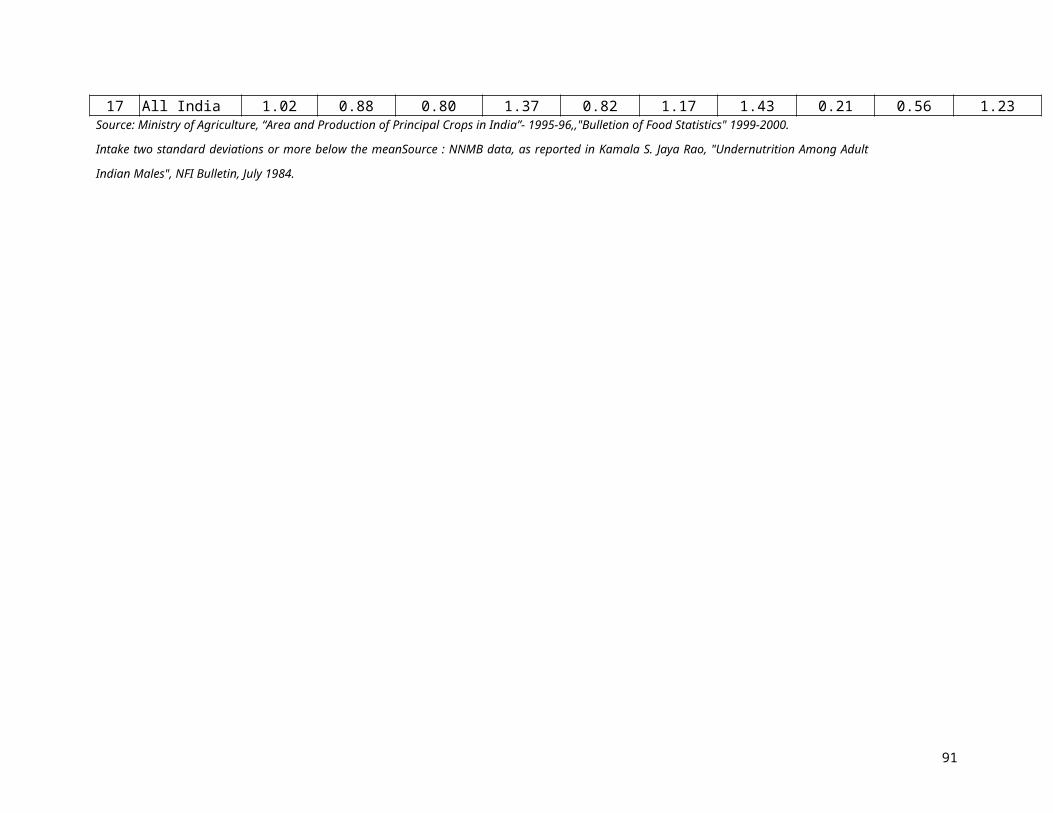
Mahasamund 791197 281422 195642 85780 35.57 64.43 0.98
Mandla 632781 217859 148457 69402 34.43 65.57 1.00
Mandsaur 956869 372621 269100 103521 38.94 61.06 0.93
Morena 1279094 461960 355960 106000 36.12 63.88 0.97
Narsimhapur 785496 356048 229271 126777 45.33 54.67 0.83
Neemuch 598339 246910 175347 71563 41.27 58.73 0.89
Panna 687945 183558 133936 49622 26.68 73.32 1.11
Raigarh 1065939 378603 259696 118907 35.52 64.48 0.98
Raipur 2529166 990568 671787 318781 39.17 60.83 0.92
Raisen 876461 284059 201624 82435 32.41 67.59 1.03
Rajgarh 992764 254015 194206 59809 25.59 74.41 1.13
Rajnandgaon 1089047 431936 289052 142884 39.66 60.34 0.92
Ratlam 971888 347814 236293 111521 35.79 64.21 0.98
Rewa 1554987 543812 385018 158794 34.97 65.03 0.99
Sagar 1647736 699421 469770 229651 42.45 57.55 0.87
Satna 1465384 519852 365409 154443 35.48 64.52 0.98
Sehore 841358 269200 200111 69089 32.00 68.00 1.03
Seoni 1000831 358415 234627 123788 35.81 64.19 0.98
Shahdol 1323054 375131 268457 106674 28.35 71.65 1.09
Shajapur 1033248 328047 248941 79106 31.75 68.25 1.04
Sheopur 431480 92421 73345 19076 21.42 78.58 1.19
Shivpuri 1132977 294788 231410 63378 26.02 73.98 1.12
Sidhi 1373434 309562 240843 68719 22.54 77.46 1.18
Surguja 1581872 342527 249181 93346 21.65 78.35 1.19
Tikamgarh 940829 259666 190800 68866 27.60 72.40 1.10
Ujjain 1383086 558017 379596 178421 40.35 59.65 0.91
Umaria 420815 108298 80347 27951 25.74 74.26 1.13
Vidisha 970388 339114 240371 98743 34.95 65.05 0.99
West Nimar(Khargone) 1195723 395551 274463 121088 33.08 66.92 1.02
Madhya Pradesh 66181170 23465755 16101737 7364018 35.46
Mean 65.83Source: Census Of India, 1991, Web Site of Madhya Pradesh for data on 61 districts
127

Table 14: Percentage of Agricultural Labourers 1991
Districts Cultivators Agricultural laboureres
Forestry Mining Total %of Agricultural labourers
Division by mean
methodBalaghat 310111 157622 10706 8337 486776 32.38 1.12Barwani 203105 66783 2539 83 272510 24.51 0.85Bastar 321940 76976 5582 440 404938 19.01 0.66Betul 281533 115846 7677 11683 416739 27.80 0.96Bhind 213910 34034 1981 307 250232 13.60 0.47Bhopal 55392 32469 6699 1660 96220 33.74 1.16Bilaspur 366463 175883 13310 2784 558440 31.50 1.09Chhatarpur 237131 71444 9512 401 318488 22.43 0.77Chhindwara 293474 141466 5423 26051 466414 30.33 1.05Damoh 116312 82034 4610 561 203517 40.31 1.39Dantewada 235110 25660 2395 5147 268312 9.56 0.33Datia 103258 21153 1527 142 126080 16.78 0.58Dewas 164905 108780 4444 298 278427 39.07 1.35Dhamtari 141908 89683 6024 229 237844 37.71 1.30Dhar 334547 127677 4005 222 466451 27.37 0.94Dindori 218784 65620 2429 160 286993 22.86 0.79Durg 439302 242210 17616 13937 713065 33.97 1.17East Nimar (Khandwa) 235675 179536 10659 550 426420 42.10 1.45Guna 243597 74091 5339 435 323462 22.91 0.79Gwalior 116339 27510 5256 2245 151350 18.18 0.63Harda 56403 52387 2204 50 111044 47.18 1.63Hoshangabad 98576 82202 7427 562 188767 43.55 1.50Indore 112418 78808 5499 616 197341 39.93 1.38Jabalpur 124985 123866 11188 1342 261381 47.39 1.63Janjgir-Champa 275493 104638 4057 2006 386194 27.09 0.93Jashpur 178883 37109 1211 79 217282 17.08 0.59Jhabua 373650 25191 1772 944 401557 6.27 0.22Kaker 173941 40662 2604 168 217375 18.71 0.65Katni 134769 84517 2942 5714 227942 37.08 1.28Kawardha 166765 59158 4973 55 230951 25.61 0.88Korba 154687 63961 4188 15868 238704 26.80 0.92Koriya 87592 17949 2084 26508 134133 13.38 0.46Mahasamund 181585 116523 3550 826 302484 38.52 1.33Mandla 172469 76242 3158 147 252016 30.25 1.04Mandsaur 232195 76867 5311 616 314989 24.40 0.84Morena 252223 18297 2045 1347 273912 6.68 0.23
128
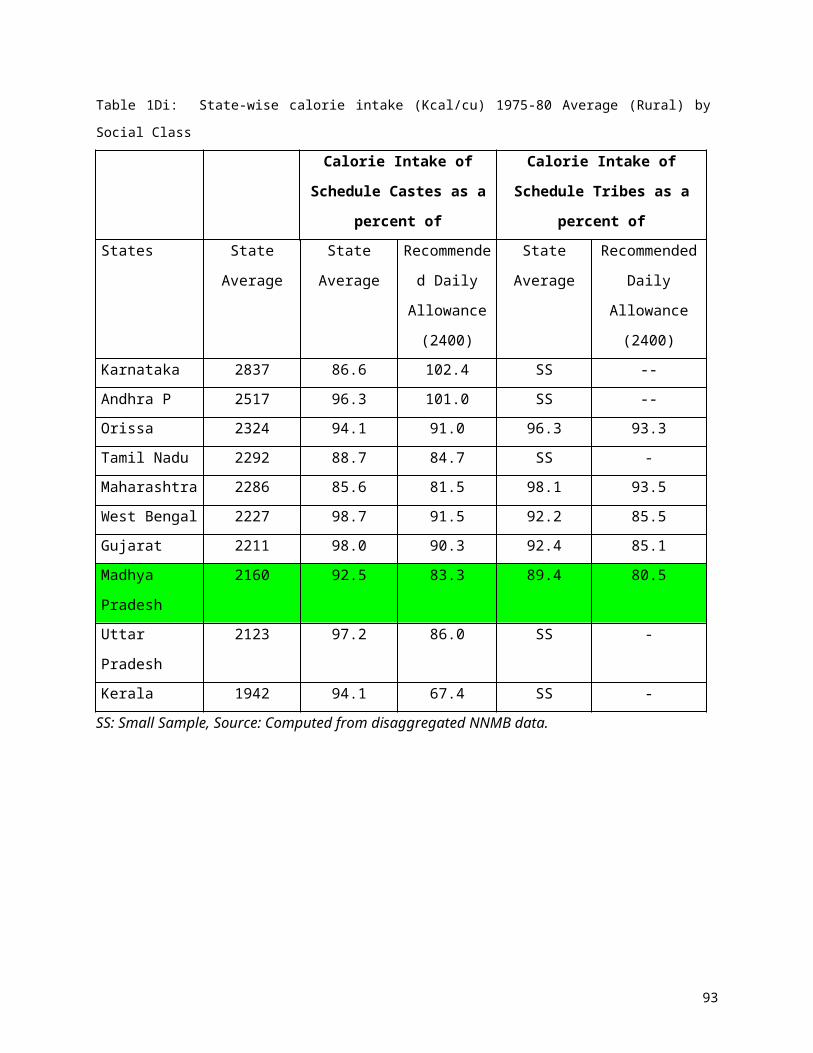
Districts Cultivators Agricultural laboureres
Forestry Mining Total %of Agricultural labourers
Division by mean
methodNarsimhapur 112825 107498 2896 185 223404 48.12 1.66Neemuch 153448 39317 4099 851 197715 19.89 0.69Panna 134611 61563 4970 4411 205555 29.95 1.03Raigarh 233859 124305 4963 591 363718 34.18 1.18Raipur 522191 267325 21743 3638 814897 32.80 1.13Raisen 114655 105964 4442 1673 226734 46.73 1.61Rajgarh 213818 73277 10295 249 297639 24.62 0.85Rajnandgaon 340456 92169 10466 1070 444161 20.75 0.72Ratlam 212117 64807 4076 71 281071 23.06 0.80Rewa 215841 181889 7519 1280 406529 44.74 1.54Sagar 185714 123841 9752 1856 321163 38.56 1.33Satna 222997 143349 8391 5849 380586 37.67 1.30Sehore 152241 88767 2834 138 243980 36.38 1.25Seoni 215127 138084 6457 73 359741 38.38 1.32Shahdol 261293 116493 3343 31326 412455 28.24 0.97Shajapur 198255 113538 7597 156 319546 35.53 1.23Sheopur 102285 20174 2070 96 124625 16.19 0.56Shivpuri 279799 46936 4301 4026 335062 14.01 0.48Sidhi 297428 117733 5950 10974 432085 27.25 0.94Surguja 410005 106765 5163 8350 530283 20.13 0.69Tikamgarh 242568 33209 3741 423 279941 11.86 0.41Ujjain 204763 112805 5924 712 324204 34.79 1.20Umaria 86693 40350 2087 6296 135426 29.79 1.03Vidisha 139677 103825 3981 3919 251402 41.30 1.42West Nimar(Khargone) 241962 150785 6351 171 399269 37.77 1.30Madhya Pradesh 12904058 5549622 345357 220904 19019941 29.18
Mean: 29Source: Census Of India, 1991, Web Site of Madhya Pradesh for data on 61 districts
129

Table 15: Percentage of Working Children, 1991
District % working Children
Division by mean method
District % working Children
Division by mean method
Balaghat 5.69 0.80 Koriya 7.98 1.12Barwani 16.09 2.26 Mahasamund 6.93 0.97Bastar 15.38 2.16 Mandla 7.46 1.05Betul 11.66 1.63 Mandsaur 8.38 1.17Bhind 1.78 0.25 Morena 3.50 0.49Bhopal 3.21 0.45 Narsimhapur 2.96 0.42Bilaspur 5.33 0.75 Neemuch 8.38 1.17Chhatarpur 6.28 0.88 Panna 6.42 0.90Chhindwara 14.16 1.99 Raigarh 7.39 1.04Damoh 5.48 0.77 Raipur 6.93 0.97Dantewada 15.38 2.16 Raisen 3.28 0.46Datia 3.33 0.47 Rajgarh 7.74 1.09Dewas 4.85 0.68 Rajnandgaon 9.42 1.32Dhamtari 6.93 0.97 Ratlam 9.20 1.29Dhar 8.65 1.21 Rewa 4.56 0.64Dindori 7.46 1.05 Sagar 4.39 0.62Durg 1.90 0.27 Satna 5.07 0.71EastNimar/Khandwa 14.54 2.04 Sehore 4.87 0.68Guna 4.24 0.59 Seoni 4.78 0.67Gwalior 2.55 0.36 Shahdol 6.41 0.90Harda 2.42 0.34 Shajapur 6.58 0.92Hoshangabad 2.42 0.34 Sheopur 3.50 0.49Indore 2.37 0.33 Shivpuri 6.48 0.91Jabalpur 10.75 1.51 Sidhi 6.07 0.85Janjgir-Champa 5.33 0.75 Surguja 7.98 1.12Jashpur 7.39 1.04 Tikamgarh 5.69 0.80Jhabua 14.35 2.01 Ujjain 5.73 0.80Kaker 15.38 2.16 Umaria 6.41 0.90Katni 10.75 1.51 Vidisha 3.39 0.48Kawardha 9.42 1.32 West
Nimar(Khargone)16.09 2.26
Korba 5.33 0.75
Mean 7.13Source: Census of India 1991
130

Table 15 A: Percentage of male female working children, 1991
Total children Working children % of working childrenDistrict Males Female Male Female Male % Female %Balaghat 137784 142879 8050 7910 5.8 5.5Bastar 248712 245647 41331 34711 16.6 14.1Betul 148997 138717 17730 15804 11.9 11.4Bhind 153686 116936 4500 320 2.9 0.3Bhopal 100444 91830 4700 1463 4.7 1.6Bilaspur 424075 409630 22710 21742 5.4 5.3Chhatarpur 142475 120406 12706 3800 8.9 3.2Chhindwara 110798 109600 18010 13190 16.3 12.0Damoh 114033 99797 7630 4083 6.7 4.1Datia 48703 38711 2310 600 4.7 1.5Dewas 141044 135107 8219 5163 5.8 3.8Dhar 193182 184982 16990 15740 8.8 8.5Durg 750235 688603 10890 16437 1.5 2.4East Nimar 115499 107138 18310 14060 15.9 13.1Guna 161719 139120 10150 2610 6.3 1.9Gwalior 173861 144017 6780 1331 3.9 0.9Hoshangabad 298441 279279 9360 4610 3.1 1.7Indore 253467 239090 7320 4367 2.9 1.8Jabalpur 89470 85682 10440 8395 11.7 9.8Jhabua 170086 162236 27920 19754 16.4 12.2Mandla 177165 174362 11960 14260 6.8 8.2Mandsaur 175052 169570 13240 15630 7.6 9.2Morena 228624 178124 11150 3100 4.9 1.7Narsimhapur 138320 131552 5350 2650 3.9 2.0Panna 83346 74981 7140 3020 8.6 4.0Raigarh 170995 170998 15230 10060 8.9 5.9Raipur 412698 408618 22740 29138 5.5 7.1Raisen 131395 131424 6270 2351 4.8 1.8Rajgarh 127013 107315 11970 6160 9.4 5.7Rajnandgaon 175687 169573 12990 19530 7.4 11.5Ratlam 114289 107267 11648 9190 10.2 8.6Rewa 180076 169843 7520 8440 4.2 5.0Sagar 207046 185960 10090 7170 4.9 3.9Satna 164479 154242 8612 7560 5.2 4.9Sehore 112470 99340 6050 4260 5.4 4.3Seoni 218704 210940 11380 9145 5.2 4.3Shahdol 193805 186183 14170 10200 7.3 5.5Shajapur 127873 117757 10332 5820 8.1 4.9Shivpuri 130148 110262 11120 4450 8.5 4.0Sidhi 175052 169570 12450 8471 7.1 5.0Surguja 218704 210940 23260 11010 10.6 5.2Tikamgarh 118923 101121 9350 3170 7.9 3.1Ujjain 153798 146808 10680 6530 6.9 4.4Vidisha 158479 145207 8507 1780 5.4 1.2West Nimar 177184 161553 31370 23120 17.7 14.3
Source: Census of India 1991
131
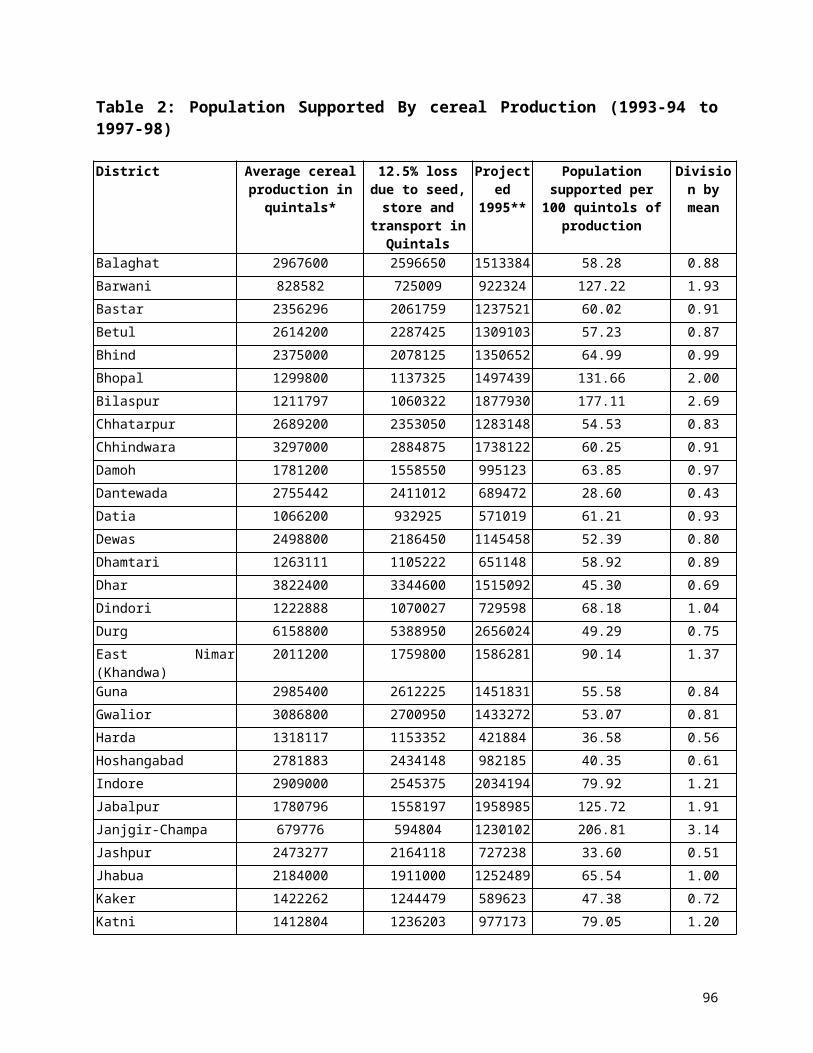
Table 16: Composite Deprivation index
District BPL SC ST Out migration
Illiteracy Agri- Lab Working Children
Composite Deprivation
IndexBalaghat 1.48 0.58 0.86 0.01 0.86 1.12 0.80 0.81Barwani 1.05 0.49 2.55 0.11 1.19 0.85 2.26 1.21Bastar 1.23 0.53 2.62 -0.04 1.24 0.66 2.16 1.20Betul 1.03 0.76 1.48 0.02 0.97 0.96 1.63 0.98Bhind 0.62 1.50 0.01 0.04 0.93 0.47 0.25 0.55Bhopal 0.83 0.97 0.12 -0.13 0.71 1.16 0.45 0.59Bilaspur 0.99 1.34 0.81 0.01 0.96 1.09 0.75 0.85Chhatarpur 0.98 1.67 0.15 0.00 1.10 0.77 0.88 0.79Chhindwara 1.02 0.86 1.36 0.00 0.97 1.05 1.99 1.03Damoh 1.21 1.42 0.49 0.01 0.96 1.39 0.77 0.89Dantewada 1.23 0.29 3.10 -0.07 1.32 0.33 2.16 1.19Datia 0.40 1.75 0.06 0.01 0.97 0.58 0.47 0.60Dewas 0.93 1.28 0.59 -0.03 0.98 1.35 0.68 0.83Dhamtari 0.91 0.48 1.07 0.02 0.87 1.30 0.97 0.80Dhar 0.90 0.49 2.10 0.02 1.10 0.94 1.21 0.97Dindori 1.35 0.36 2.62 0.03 1.13 0.79 1.05 1.05Durg 0.78 0.90 0.49 -0.02 0.79 1.17 0.27 0.62East Nimar (Khandwa) 1.04 0.80 1.05 0.00 0.97 1.45 2.04 1.05Guna 1.01 1.27 0.47 -0.01 1.10 0.79 0.59 0.75Gwalior 0.71 1.41 0.12 -0.02 0.80 0.63 0.36 0.57Harda 0.84 1.19 0.95 0.06 0.93 1.63 0.34 0.85Hoshangabad 0.84 1.13 0.57 0.03 0.85 1.50 0.34 0.75Indore 0.52 1.17 0.22 -0.05 0.68 1.38 0.33 0.61Jabalpur 1.33 0.94 0.59 -0.02 0.71 1.63 1.51 0.96Janjgir-Champa 0.99 1.58 0.48 0.00 0.94 0.93 0.75 0.81Jashpur 1.02 0.50 2.57 0.03 1.05 0.59 1.04 0.97Jhabua 1.26 0.22 3.37 0.02 1.30 0.22 2.01 1.20Kaker 1.23 0.32 2.19 -0.08 1.04 0.65 2.16 1.07Katni 1.33 0.84 0.94 -0.04 0.94 1.28 1.51 0.97Kawardha 1.02 0.98 0.80 0.04 1.16 0.88 1.32 0.89Korba 0.99 0.70 1.70 0.00 0.97 0.92 0.75 0.86Koriya 1.14 0.55 1.73 -0.08 1.05 0.46 1.12 0.85Mahasamund 0.91 0.89 1.11 0.02 0.98 1.33 0.97 0.89Mandla 1.36 0.38 2.15 0.03 1.00 1.04 1.05 1.00Mandsaur 0.71 1.25 0.11 -0.01 0.93 0.84 1.17 0.72Morena 0.56 1.48 0.03 0.01 0.97 0.23 0.49 0.54Narsimhapur 1.29 1.17 0.51 0.04 0.83 1.66 0.42 0.84District BPL SC ST Out
migrationIlliteracy Agri- Lab Working
ChildrenComposite
Deprivation
132

IndexNeemuch 0.72 0.90 0.31 -0.01 0.89 0.69 1.17 0.67Panna 1.14 1.44 0.59 0.01 1.11 1.03 0.90 0.89Raigarh 1.01 0.98 1.45 0.02 0.98 1.18 1.04 0.95Raipur 0.91 1.18 0.52 0.01 0.92 1.13 0.97 0.80Raisen 1.17 1.17 0.57 -0.02 1.03 1.61 0.46 0.85Rajgarh 1.10 1.27 0.13 0.02 1.13 0.85 1.09 0.80Rajnandgaon 1.03 0.71 1.06 0.02 0.92 0.72 1.32 0.82Ratlam 0.88 0.97 0.92 0.00 0.98 0.80 1.29 0.83Rewa 1.32 1.04 0.49 0.06 0.99 1.54 0.64 0.87Sagar 1.20 1.49 0.33 0.03 0.87 1.33 0.62 0.84Satna 1.19 1.26 0.54 0.01 0.98 1.30 0.71 0.86Sehore 0.83 1.43 0.40 -0.01 1.03 1.25 0.68 0.80Seoni 0.96 0.76 1.45 0.02 0.98 1.32 0.67 0.88Shahdol 1.00 0.53 1.82 -0.04 1.09 0.97 0.90 0.90Shajapur 0.84 1.57 0.09 0.00 1.04 1.23 0.92 0.81Sheopur 0.56 1.17 0.79 0.02 1.19 0.56 0.49 0.68Shivpuri 0.69 1.36 0.44 0.00 1.12 0.48 0.91 0.72Sidhi 1.31 0.80 1.20 0.01 1.18 0.94 0.85 0.90Surguja 1.13 0.34 2.23 -0.03 1.19 0.69 1.12 0.95Tikamgarh 0.83 1.60 0.16 0.01 1.10 0.41 0.80 0.70Ujjain 0.68 1.73 0.08 -0.01 0.91 1.20 0.80 0.77Umaria 1.00 0.58 1.82 -0.13 1.13 1.03 0.90 0.90Vidisha 0.92 1.43 0.17 0.00 0.99 1.42 0.48 0.77West Nimar(Khargone) 1.06 0.83 1.31 0.08 1.02 1.30 2.26 1.12West Nimar(Khargone) 0.24 -0.42 0.36 0.08 0.12 0.82 2.31 0.50
133
Table17: Districtwise Disparity in Literacy, 1991
District Total Male
Total Female
Literate Male
Literate Female
% male % female Disp in Lit
Division by mean
Balaghat 682260 683610 377269 218979 55.30 32.03 1.73 0.77Barwani 423809 408613 120754 59865 28.49 14.65 1.94 0.87Bastar 558837 558059 141792 59831 25.37 10.72 2.37 1.06Betul 600935 580566 274644 156076 45.70 26.88 1.70 0.76Bhind 671347 547653 354385 121807 52.79 22.24 2.37 1.06Bhopal 715283 636196 433529 282395 60.61 44.39 1.37 0.61Bilaspur 859027 835856 431945 188104 50.28 22.50 2.23 1.00Chhatarpur 623878 534198 233500 89257 37.43 16.71 2.24 1.00Chhindwara 803386 765316 365698 199053 45.52 26.01 1.75 0.78Damoh 471384 426741 227948 103215 48.36 24.19 2.00 0.90Dantewada 309761 312506 56054 24884 18.10 7.96 2.27 1.02Datia 279041 236319 140976 46019 50.52 19.47 2.59 1.16Dewas 537426 496381 263424 101485 49.02 20.44 2.40 1.08Dhamtari 292559 295120 165891 86744 56.70 29.39 1.93 0.87Dhar 700952 666460 266848 109783 38.07 16.47 2.31 1.04Dindori 330370 328112 122968 45133 37.22 13.76 2.71 1.21Durg 1218814 1178320 737004 410423 60.47 34.83 1.74 0.78East Nimar (Khandwa) 738883 692779 345344 173792 46.74 25.09 1.86 0.84Guna 698747 611570 271204 85961 38.81 14.06 2.76 1.24Gwalior 706337 587230 409224 203718 57.94 34.69 1.67 0.75Harda 198908 181854 99109 48609 49.83 26.73 1.86 0.84Hoshangabad 468505 417944 255795 132178 54.60 31.63 1.73 0.77Indore 963311 872604 624729 384216 64.85 44.03 1.47 0.66Jabalpur 928898 839139 582304 359261 62.69 42.81 1.46 0.66Janjgir-Champa 553248 556952 299122 123837 54.07 22.23 2.43 1.09Jashpur 328054 328298 135112 68191 41.19 20.77 1.98 0.89Jhabua 571764 558641 115212 49109 20.15 8.79 2.29 1.03Kaker 265887 266264 114796 54290 43.17 20.39 2.12 0.95Katni 454756 427169 234284 104523 51.52 24.47 2.11 0.94Kawardha 257201 256295 92358 28800 35.91 11.24 3.20 1.43Korba 423182 402709 208314 90132 49.23 22.38 2.20 0.99Koriya 260061 240697 107141 46213 41.20 19.20 2.15 0.96Mahasamund 392716 398481 195642 85780 49.82 21.53 2.31 1.04Mandla 319074 313707 148457 69402 46.53 22.12 2.10 0.94Mandsaur 491565 465304 269100 103521 54.74 22.25 2.46 1.10Morena 707477 571617 355960 106000 50.31 18.54 2.71 1.22Narsimhapur 410693 374803 229271 126777 55.83 33.82 1.65 0.74District Total
MaleTotal
FemaleLiterate
MaleLiterate Female
% male % female Disp in Lit
Division by mean
Neemuch 307916 290423 175347 71563 56.95 24.64 2.31 1.04
134
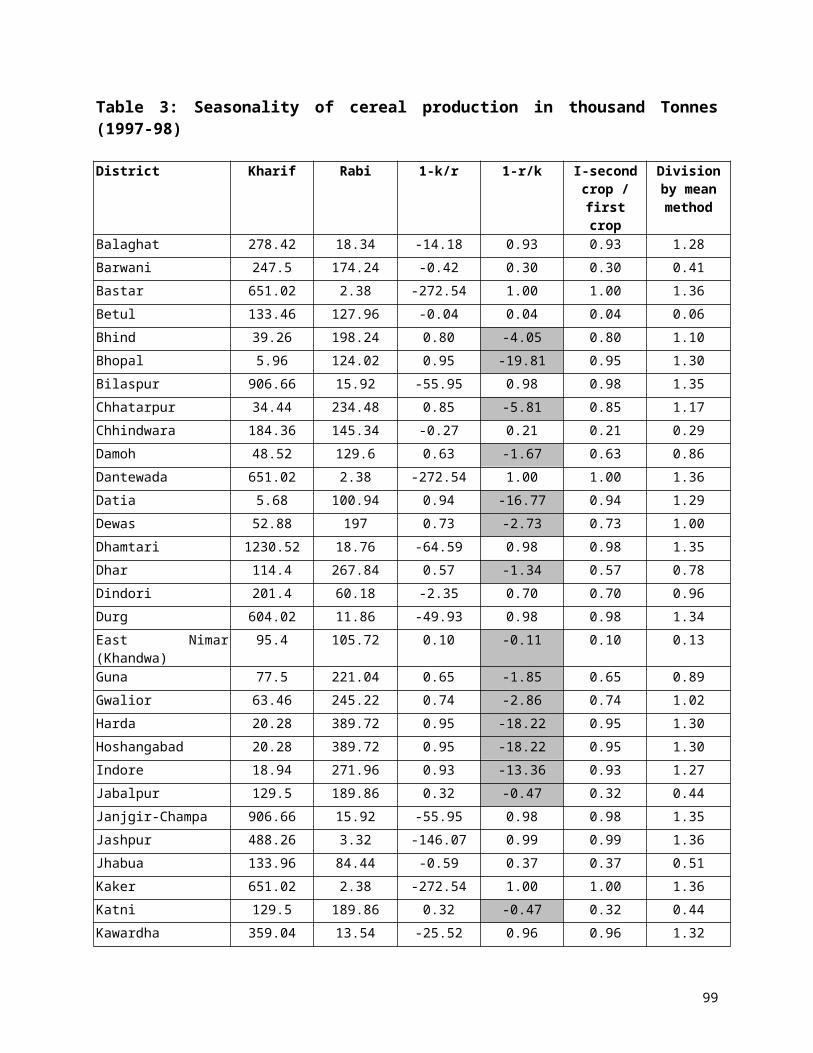
Panna 362727 325218 133936 49622 36.92 15.26 2.42 1.09Raigarh 532908 533031 259696 118907 48.73 22.31 2.18 0.98Raipur 1275487 1253679 671787 318781 52.67 25.43 2.07 0.93Raisen 466389 410072 201624 82435 43.23 20.10 2.15 0.96Rajgarh 516152 476612 194206 59809 37.63 12.55 3.00 1.34Rajnandgaon 540311 548736 289052 142884 53.50 26.04 2.05 0.92Ratlam 498798 473090 236293 111521 47.37 23.57 2.01 0.90Rewa 805000 749987 385018 158794 47.83 21.17 2.26 1.01Sagar 876079 771657 469770 229651 53.62 29.76 1.80 0.81Satna 763983 701401 365409 154443 47.83 22.02 2.17 0.97Sehore 443332 398026 200111 69089 45.14 17.36 2.60 1.17Seoni 507076 493755 234627 123788 46.27 25.07 1.85 0.83Shahdol 681962 641092 268457 106674 39.37 16.64 2.37 1.06Shajapur 538694 494554 248941 79106 46.21 16.00 2.89 1.30Sheopur 229516 201964 73345 19076 31.96 9.45 3.38 1.52Shivpuri 612821 520156 231410 63378 37.76 12.18 3.10 1.39Sidhi 714672 658762 240843 68719 33.70 10.43 3.23 1.45Surguja 804567 777305 249181 93346 30.97 12.01 2.58 1.16Tikamgarh 502822 438007 190800 68866 37.95 15.72 2.41 1.08Ujjain 717018 666068 379596 178421 52.94 26.79 1.98 0.89Umaria 216708 204107 80347 27951 37.08 13.69 2.71 1.21Vidisha 517858 452530 240371 98743 46.42 21.82 2.13 0.95West Nimar(Khargone) 616161 579562 274463 121088 44.54 20.89 2.13 0.96Madhya Pradesh 34267293 31913877 16101737 7364018 46.99 23.07 2.04 0.91
Mean 2.23Source: Census Of India, 1991, Web Site of Madhya Pradesh for data on 61 districts
135

Table 18: Gender disparity in Infant Mortality Rate 1991
District Male Female Disp-IMR Division by mean me thod
Balaghat 132 147 1.11 1.14
Barwani 138 124 0.90 0.92
Bastar 95 86 0.91 0.92
Betul 150 141 0.94 0.96
Bhind 98 113 1.15 1.18
Bhopal 89 98 1.10 1.12
Bilaspur 116 91 0.78 0.80
Chhatarpur 130 149 1.15 1.17
Chhindwara 126 116 0.92 0.94
Damoh 181 139 0.77 0.78
Dantewada 95 86 0.91 0.92
Datia 129 141 1.09 1.12
Dewas 87 102 1.17 1.20
Dhamtari 120 122 1.02 1.04
Dhar 95 102 1.07 1.10
Dindori 125 104 0.83 0.85
Durg 112 94 0.84 0.86
East Nimar (Khandwa) 127 131 1.03 1.05
Guna 113 144 1.27 1.30
Gwalior 100 103 1.03 1.05
Harda 138 139 1.01 1.03
Hoshangabad 138 139 1.01 1.03
Indore 74 69 0.93 0.95
Jabalpur 126 117 0.93 0.95
Janjgir-Champa 116 91 0.78 0.80
Jashpur 116 107 0.92 0.94
Jhabua 91 96 1.05 1.08
Kaker 95 86 0.91 0.92
Katni 126 117 0.93 0.95
Kawardha 134 124 0.93 0.94
Korba 116 91 0.78 0.80
Koriya 89 95 1.07 1.09
District Male Female Disp-IMR Division by mean me thod
136

Mahasamund 120 122 1.02 1.04
Mandla 125 104 0.83 0.85
Mandsaur 109 112 1.03 1.05
Morena 120 116 0.97 0.99
Narsimhapur 119 121 1.02 1.04
Neemuch 109 112 1.03 1.05
Panna 142 129 0.91 0.93
Raigarh 116 107 0.92 0.94
Raipur 120 122 1.02 1.04
Raisen 135 159 1.18 1.20
Rajgarh 109 144 1.32 1.35
Rajnandgaon 134 124 0.93 0.94
Ratlam 120 132 1.10 1.12
Rewa 162 127 0.78 0.80
Sagar 141 132 0.94 0.96
Satna 139 147 1.06 1.08
Sehore 137 117 0.85 0.87
Seoni 135 118 0.87 0.89
Shahdol 144 111 0.77 0.79
Shajapur 113 118 1.04 1.07
Sheopur 120 116 0.97 0.99
Shivpuri 112 139 1.24 1.27
Sidhi 115 106 0.92 0.94
Surguja 89 95 1.07 1.09
Tikamgarh 131 153 1.17 1.19
Ujjain 79 74 0.94 0.96
Umaria 144 111 0.77 0.79
Vidisha 109 102 0.94 0.95
West Nimar(Khargone) 138 124 0.90 0.92
Madhya Pradesh 131 136
Mean 0.98Source: Estimates of Child Mortality indicators by sex, Sample Registration System(SRS), Census of India, 1991
137

Table 19: Gender disparity in Under 5 Mortality Rate 1991
District Male Female Disp-U5MR Division by mean
Balaghat 164 172 1.05 1.01
Barwani 160 156 0.98 0.94
Bastar 130 123 0.95 0.91
Betul 179 181 1.01 0.97
Bhind 108 185 1.71 1.65
Bhopal 105 107 1.02 0.98
Bilaspur 127 118 0.93 0.89
Chhatarpur 193 227 1.18 1.13
Chhindwara 145 137 0.94 0.91
Damoh 200 173 0.87 0.83
Dantewada 130 123 0.95 0.91
Datia 148 213 1.44 1.38
Dewas 116 139 1.20 1.15
Dhamtari 136 138 1.01 0.98
Dhar 117 127 1.09 1.04
Dindori 135 129 0.96 0.92
Durg 128 115 0.90 0.86
East Nimar (Khandwa)
147 153 1.04 1.00
Guna 167 198 1.19 1.14
Gwalior 121 126 1.04 1.00
Harda 174 183 1.05 1.01
Hoshangabad 174 183 1.05 1.01
Indore 89 97 1.09 1.05
Jabalpur 151 145 0.96 0.92
Janjgir-Champa 127 118 0.93 0.89
Jashpur 134 129 0.96 0.93
Jhabua 159 179 1.13 1.08
Kaker 130 123 0.95 0.91
Katni 151 145 0.96 0.92
Kawardha 154 145 0.94 0.91
Korba 127 118 0.93 0.89
Koriya 115 112 0.97 0.94
District Male Female Disp-U5MR Division by mean
Mahasamund 136 138 1.01 0.98
138

Mandla 135 129 0.96 0.92
Mandsaur 147 153 1.04 1.00
Morena 149 163 1.09 1.05
Narsimhapur 144 159 1.10 1.06
Neemuch 147 153 1.04 1.00
Panna 201 207 1.03 0.99
Raigarh 134 129 0.96 0.93
Raipur 136 138 1.01 0.98
Raisen 181 170 0.94 0.90
Rajgarh 167 198 1.19 1.14
Rajnandgaon 154 145 0.94 0.91
Ratlam 147 151 1.03 0.99
Rewa 195 198 1.02 0.98
Sagar 176 169 0.96 0.92
Satna 198 207 1.05 1.01
Sehore 183 195 1.07 1.02
Seoni 156 148 0.95 0.91
Shahdol 165 154 0.93 0.90
Shajapur 153 184 1.20 1.16
Sheopur 149 163 1.09 1.05
Shivpuri 172 234 1.36 1.31
Sidhi 167 163 0.98 0.94
Surguja 115 112 0.97 0.94
Tikamgarh 172 205 1.19 1.15
Ujjain 141 156 1.11 1.06
Umaria 165 154 0.93 0.90
Vidisha 184 198 1.08 1.03
West Nimar(Khargone)
160 156 0.98 0.94
Madhya Pradesh 142 151
Mean 1.04Source : Estimates of Child Mortality indicators by sex, Sample Registration System(SRS), Census of India, 1991
139

Table 20: Sex ratio of 0-16 age group 1991
District Male Female Sex ratio Division bymean method
Balaghat 273305 273137 1001 0.93
Barwani na na 1059 0.98
Bastar 490144 482271 1016 0.94
Betul 258955 255786 1012 0.94
Bhind 300386 234305 1282 1.19
Bhopal 291184 268175 1086 1.01
Bilaspur 443190 426042 1040 0.96
Chhatarpur 275615 237526 1160 1.08
Chhindwara 346625 332902 1041 0.96
Damoh 214523 187514 1144 1.06
Dantewada na na 1016 0.94
Datia 92889 75911 1224 1.13
Dewas 240962 218729 1102 1.02
Dhamtari na na 1028 0.95
Dhar 320240 302419 1059 0.98
Dindori na na 1050 0.97
Durg 503361 482777 1043 0.97
East Nimar (Khandwa) 333984 305528 1093 1.01
Guna 309337 272809 1134 1.05
Gwalior 329417 273829 1203 1.11
Harda na na 1012 0.94
Hoshangabad 258955 255786 1012 0.94
Indore 369965 346471 1068 0.99
Jabalpur 572741 531074 1078 1.00
Janjgir-Champa na na 1040 0.96
Jashpur na na 1024 0.95
Jhabua 275252 268435 1025 0.95
Kaker na na 1016 0.94
Katni na na 1078 1.00
Kawardha na na 1043 0.97
Korba na na 1040 0.96
Koriya na na 1040 0.96
District Male Female Sex ratio Division bymean method
140
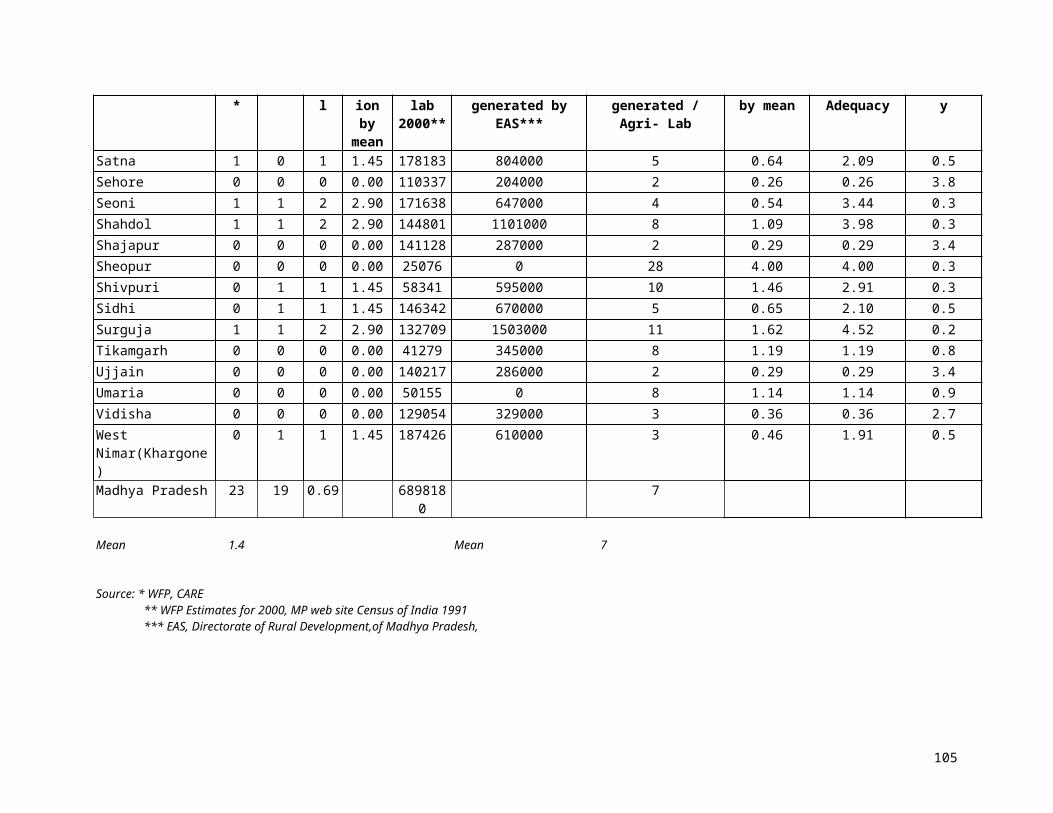
Mahasamund na na 1028 0.95
Mandla 276198 263128 1050 0.97
Mandsaur 330994 318439 1039 0.96
Morena 435757 353974 1231 1.14
Narsimhapur 170349 157173 1084 1.00
Neemuch na na 1039 0.96
Panna 161516 145141 1113 1.03
Raigarh 340240 332378 1024 0.95
Raipur 816248 794383 1028 0.95
Raisen 209378 185854 1127 1.04
Rajgarh 221759 204598 1084 1.00
Rajnandgaon 503361 482777 1043 0.97
Ratlam 215321 202263 1065 0.99
Rewa 360253 332453 1084 1.00
Sagar 393874 349928 1126 1.04
Satna 329818 303821 1086 1.01
Sehore 195384 176001 1110 1.03
Seoni 217168 210857 1030 0.95
Shahdol 383355 366009 1047 0.97
Shajapur 236430 211879 1116 1.03
Sheopur na na 1231 1.14
Shivpuri 259010 223416 1159 1.07
Sidhi 332711 306702 1085 1.01
Surguja 443190 426042 1040 0.96
Tikamgarh 225974 197461 1144 1.06
Ujjain 292667 273424 1070 0.99
Umaria na na 1047 0.97
Vidisha 236385 205239 1152 1.07
West Nimar(Khargone) 477841 451089 1059 0.98
Madhya Pradesh 14779630 13687797 1080
Mean : 1079Source: Census Of India 1991
141

Table 21: Composite Gender Disparity Index
District Disp-lit Disp-IMR Disp-U5MR Sex ratio Composite Score
Balaghat 0.77 1.14 1.01 0.93 0.96
Barwani 0.87 0.92 0.94 0.98 0.93
Bastar 1.06 0.92 0.91 0.94 0.96
Betul 0.76 0.96 0.97 0.94 0.91
Bhind 1.06 1.18 1.65 1.19 1.27
Bhopal 0.61 1.12 0.98 1.01 0.93
Bilaspur 1.00 0.80 0.89 0.96 0.91
Chhatarpur 1.00 1.17 1.13 1.08 1.10
Chhindwara 0.78 0.94 0.91 0.96 0.90
Damoh 0.90 0.78 0.83 1.06 0.89
Dantewada 1.02 0.92 0.91 0.94 0.95
Datia 1.16 1.12 1.38 1.13 1.20
Dewas 1.08 1.20 1.15 1.02 1.11
Dhamtari 0.87 1.04 0.98 0.95 0.96
Dhar 1.04 1.10 1.04 0.98 1.04
Dindori 1.21 0.85 0.92 0.97 0.99
Durg 0.78 0.86 0.86 0.97 0.87
East Nimar (Khandwa) 0.84 1.05 1.00 1.01 0.98
Guna 1.24 1.30 1.14 1.05 1.18
Gwalior 0.75 1.05 1.00 1.11 0.98
Harda 0.84 1.03 1.01 0.94 0.95
Hoshangabad 0.77 1.03 1.01 0.94 0.94
Indore 0.66 0.95 1.05 0.99 0.91
Jabalpur 0.66 0.95 0.92 1.00 0.88
Janjgir-Champa 1.09 0.80 0.89 0.96 0.94
Jashpur 0.89 0.94 0.93 0.95 0.93
Jhabua 1.03 1.08 1.08 0.95 1.03
Kaker 0.95 0.92 0.91 0.94 0.93
Katni 0.94 0.95 0.92 1.00 0.95
Kawardha 1.43 0.94 0.91 0.97 1.06
Korba 0.99 0.80 0.89 0.96 0.91
Koriya 0.96 1.09 0.94 0.96 0.99
142
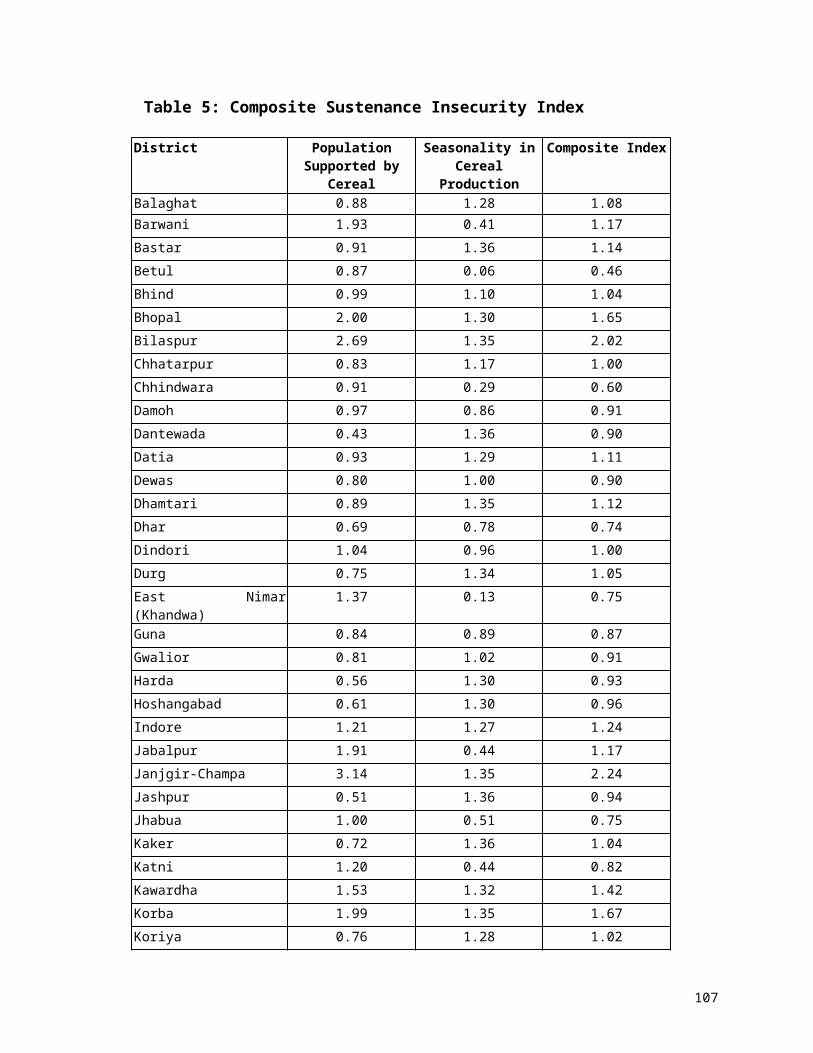
District Disp-lit Disp-IMR Disp-U5MR Sex ratio Composite Score
Mahasamund 1.04 1.04 0.98 0.95 1.00
Mandla 0.94 0.85 0.92 0.97 0.92
Mandsaur 1.10 1.05 1.00 0.96 1.03
Morena 1.22 0.99 1.05 1.14 1.10
Narsimhapur 0.74 1.04 1.06 1.00 0.96
Neemuch 1.04 1.05 1.00 0.96 1.01
Panna 1.09 0.93 0.99 1.03 1.01
Raigarh 0.98 0.94 0.93 0.95 0.95
Raipur 0.93 1.04 0.98 0.95 0.97
Raisen 0.96 1.20 0.90 1.04 1.03
Rajgarh 1.34 1.35 1.14 1.00 1.21
Rajnandgaon 0.92 0.94 0.91 0.97 0.93
Ratlam 0.90 1.12 0.99 0.99 1.00
Rewa 1.01 0.80 0.98 1.00 0.95
Sagar 0.81 0.96 0.92 1.04 0.93
Satna 0.97 1.08 1.01 1.01 1.02
Sehore 1.17 0.87 1.02 1.03 1.02
Seoni 0.83 0.89 0.91 0.95 0.90
Shahdol 1.06 0.79 0.90 0.97 0.93
Shajapur 1.30 1.07 1.16 1.03 1.14
Sheopur 1.52 0.99 1.05 1.14 1.17
Shivpuri 1.39 1.27 1.31 1.07 1.26
Sidhi 1.45 0.94 0.94 1.01 1.08
Surguja 1.16 1.09 0.94 0.96 1.04
Tikamgarh 1.08 1.19 1.15 1.06 1.12
Ujjain 0.89 0.96 1.06 0.99 0.97
Umaria 1.21 0.79 0.90 0.97 0.97
Vidisha 0.95 0.95 1.03 1.07 1.00
West Nimar(Khargone) 0.96 0.92 0.94 0.98 0.95
143

Table 22: Infant Mortality Rate, 1991
District Persons Division by mean District Persons Division by mean
Balaghat 141 1.21 Koriya 92 0.79Barwani 126 1.08 Mahasamund 121 1.03Bastar 98 0.84 Mandla 114 0.97Betul 146 1.25 Mandsaur 111 0.95Bhind 105 0.90 Morena 118 1.01Bhopal 94 0.80 Narsimhapur 120 1.03Bilaspur 109 0.93 Neemuch 111 0.95Chhatarpur 136 1.16 Panna 132 1.13Chhindwara 119 1.02 Raigarh 112 0.96Damoh 166 1.42 Raipur 121 1.03Dantewada 98 0.84 Raisen 141 1.21Datia 131 1.12 Rajgarh 125 1.07Dewas 97 0.83 Rajnandgaon 129 1.10Dhamtari 121 1.03 Ratlam 128 1.09Dhar 99 0.85 Rewa 149 1.27Dindori 114 0.97 Sagar 138 1.18Durg 102 0.87 Satna 142 1.21East Nimar (Khandwa) 129 1.10 Sehore 128 1.09Guna 124 1.06 Seoni 126 1.08Gwalior 96 0.82 Shahdol 137 1.17Harda 138 1.18 Shajapur 46 0.39Hoshangabad 138 1.18 Sheopur 118 1.01Indore 71 0.61 Shivpuri 120 1.03Jabalpur 121 1.03 Sidhi 111 0.95Janjgir-Champa 109 0.93 Surguja 92 0.79Jashpur 112 0.96 Tikamgarh 142 1.21Jhabua 92 0.79 Ujjain 77 0.66Kaker 98 0.84 Umaria 137 1.17Katni 121 1.03 Vidisha 107 0.91Kawardha 129 1.10 West
Nimar(Khargone)126 1.08
Korba 109 0.93 STATE 133
Mean : 117Source : Estimates of Child Mortality indicators by sex, Sample Registration System(SRS), Census of India, 1991
144
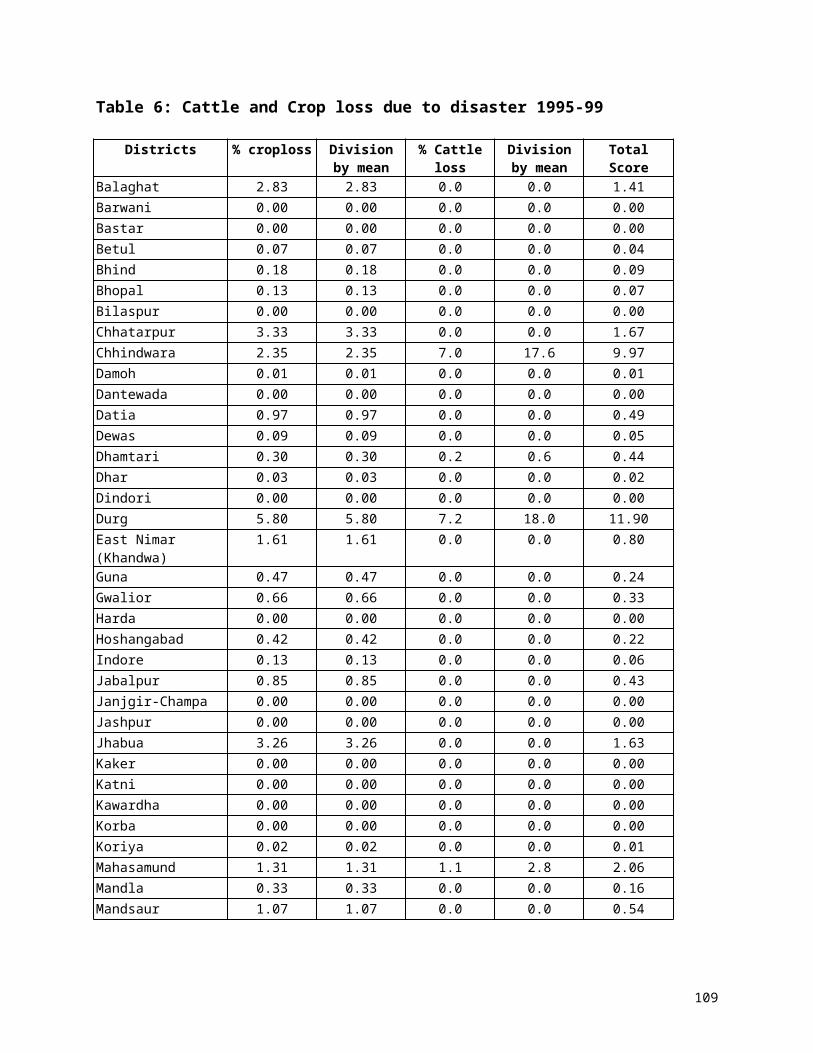
Table 22 A: Trend of infant mortality rate in Madhya Pradesh
Year IMR1981 1421982 1341983 1251984 1211985 1221986 1181987 1201988 1211989 1171990 1111991 1171992 1041993 1061994 981995 991996 97
Source: MP Web site, Census of India.
145

Table 23: Under 5 Mortality Rate 1991
District Persons Division by mean
District Persons Division by mean
Balaghat 167 1.09 Koriya 113 0.74Barwani 158 1.03 Mahasamund 137 0.90Bastar 129 0.84 Mandla 132 0.86Betul 180 1.18 Mandsaur 150 0.98Bhind 149 0.97 Morena 138 0.90Bhopal 105 0.69 Narsimhapur 148 0.97Bilaspur 123 0.80 Neemuch 150 0.98Chhatarpur 199 1.30 Panna 204 1.33Chhindwara 142 0.93 Raigarh 131 0.86Damoh 194 1.27 Raipur 137 0.90Dantewada 129 0.84 Raisen 179 1.17Datia 178 1.16 Rajgarh 182 1.19Dewas 129 0.84 Rajnandgaon 150 0.98Dhamtari 137 0.90 Ratlam 149 0.97Dhar 122 0.80 Rewa 196 1.28Dindori 132 0.86 Sagar 172 1.12Durg 122 0.80 Satna 203 1.33East Nimar/Khandwa 151 0.99 Sehore 178 1.16Guna 195 1.27 Seoni 152 0.99Gwalior 119 0.78 Shahdol 160 1.05Harda 179 1.17 Shajapur 168 1.10Hoshangabad 179 1.17 Sheopur 138 0.90Indore 94 0.61 Shivpuri 200 1.31Jabalpur 147 0.96 Sidhi 165 1.08Janjgir-Champa 123 0.80 Surguja 113 0.74Jashpur 131 0.86 Tikamgarh 187 1.22Jhabua 169 1.10 Ujjain 147 0.96Kaker 129 0.84 Umaria 160 1.05Katni 147 0.96 Vidisha 191 1.25Kawardha 150 0.98 West Nimar(Khargone) 158 1.03Korba 123 0.80 Madhya Pradesh 147
Mean : 153Source : Estimates of Child Mortality indicators by sex, Sample Registration System(SRS), Census of India, 1991
146

Table 24: Prevelance of Malnutrition
District Prevalence of Malnutrition
Division by mean District Prevalence of Malnutrition
Division by mean
Balaghat 62 1.02 Koriya 52.6 0.86Barwani 62 1.02 Mahasamund 67.7 1.11Bastar 67.7 1.11 Mandla 63.6 1.04Betul 62 1.02 Mandsaur 63.6 1.04Bhind 55.6 0.91 Morena 55.6 0.91Bhopal 63.6 1.04 Narsimhapur 62 1.02Bilaspur 67.7 1.11 Neemuch 63.6 1.04Chhatarpur 52.6 0.86 Panna 52.6 0.86Chhindwara 62 1.02 Raigarh 67.7 1.11Damoh 52.6 0.86 Raipur 67.7 1.11Dantewada 67.7 1.11 Raisen 63.6 1.04Datia 55.6 0.91 Rajgarh 63.6 1.04Dewas 63.6 1.04 Rajnandgaon 67.7 1.11Dhamtari 67.7 1.11 Ratlam 63.6 1.04Dhar 63.6 1.04 Rewa 52.6 0.86Dindori 63.6 1.04 Sagar 52.6 0.86Durg 67.7 1.11 Satna 52.6 0.86East Nimar (Khandwa)
62 1.02 Sehore 63.6 1.04
Guna 55.6 0.91 Seoni 62 1.02Gwalior 55.6 0.91 Shahdol 52.6 0.86Harda 62 1.02 Shajapur 63.6 1.04Hoshangabad 62 1.02 Sheopur 55.6 0.91Indore 63.6 1.04 Shivpuri 55.6 0.91Jabalpur 62 1.02 Sidhi 52.6 0.86Janjgir-Champa 67.7 1.11 Surguja 52.6 0.86Jashpur 67.7 1.11 Tikamgarh 52.6 0.86Jhabua 63.6 1.04 Ujjain 63.6 1.04Kaker 67.7 1.11 Umaria 52.6 0.86Katni 62 1.02 Vidisha 52.6 0.86Kawardha 67.7 1.11 West
Nimar(Khargone)62 1.02
Korba 67.7 1.11 Madhya Pradesh 60.96Mean : 60.96Source : NFHS-1992
147

Table 25: Population supported by Anganwadi Centre (2000)
Districts Sanctioned Functioning Reporting Projected Population,2000
Pop Per AWC
Balaghat 1560 711 694 1536451 2161
Barwani 852 840 828 729862 869
Bastar 1883 1849 1822 1252845 678
Betul 1544 1543 1540 1195208 775
Bhind 1133 1088 1084 1203046 1106
Bhopal 1141 1131 1107 336452 297
Bilaspur 1617 1590 1524 1395750 878
Chhatarpur 880 874 869 1161648 1329
Chhindwara 1657 1593 1422 1499494 941
Damoh 756 756 753 913857 1209
Dantewada 466 464 429 290280 626
Datia 484 441 435 382039 866
Dewas 738 735 731 830181 1129
Dhamtari 524 493 493 627285 1272
Dhar 1942 1918 1902 1379493 719
Dindori 0 0 0 0 0
Durg 1926 1284 1279 1834320 1429
East Nimar (Khandwa) 1412 1313 1308 1289601 982
Guna 1071 1050 1028 1311043 1249
Gwalior 908 815 814 596043 731
Harda 332 330 303 376847 1142
Hoshangabad 0 0 0 0 0
Indore 702 701 701 697816 995
Jabalpur 0 0 0 0 0
Janjir Champa 762 750 718 1002814 1337
Jashpur 1103 1103 1097 671768 609
Jhabua 1877 1867 1867 1204175 645
Kanker 773 769 769 517864 673
Katni 0 0 0 0 0
Kawardha 113 113 113 140362 1242
Korba 969 967 943 825853 854
Koriya 183 183 172 141069 771
Districts Sanctioned Functioning Reporting Projected Population,2000
Pop Per AWC
148

Mahasamund 576 540 525 720136 1334
Mandla 1206 1201 1162 565815 471
Mandsore 792 778 747 950850 1222
Morena 1205 1029 943 1231185 1196
Nar Singh Pur 679 661 644 831204 1257
Neemuch 0 0 0 0 0
Panna 569 523 485 743784 1422
Rai Garh 932 931 924 832785 895
Raipur 2294 2260 2253 2383138 1054
Raisen 674 653 613 784840 1202
Raj Garh 740 713 704 853127 1197
Rajnand Gaon 1090 992 988 1101417 1110
Ratlam 1043 1022 1022 823054 805
Rewa 1412 751 675 1638488 2182
Sagar 1074 1071 993 1303059 1217
Satna 1237 895 874 1462041 1634
Sehore 690 665 640 857701 1290
Seoni 1420 1380 1380 1126188 816
Shahdol 1214 1174 1141 967250 824
Shajapur 1118 1104 1075 1057000 957
Sheopur 0 0 0 0 0
Shivpuri 950 894 855 1194407 1336
Sidhi 1194 1147 1108 1300506 1134
Surguja 2571 2538 2262 1749271 689
Tikam Garh 832 813 791 971796 1195
Ujjain 1002 998 997 1039649 1042
Umariya 112 112 112 67064 599
Vidisa 841 827 804 963702 1165
West Nimar (Khargon) 1502 1451 1421 1263304 871
Madhya Pradesh 58277 54394 52883 54126229 995
Mean - 995Source: Department of Women and Child Development, Bhopal, Madhya Pradesh
149

Table 26: Composite mortality and malnutrition index
Districts Mortality Malnutrition IndexBalaghat 1.15 1.02 1.08Barwani 1.05 1.02 1.04Bastar 0.84 1.11 0.98Betul 1.21 1.02 1.11Bhind 0.94 0.91 0.92Bhopal 0.74 1.04 0.89Bilaspur 0.87 1.11 0.99Chhatarpur 1.23 0.86 1.05Chhindwara 0.97 1.02 0.99Damoh 1.34 0.86 1.10Dantewada 0.84 1.11 0.98Datia 1.14 0.91 1.03Dewas 0.84 1.04 0.94Dhamtari 0.96 1.11 1.04Dhar 0.82 1.04 0.93Dindori 0.92 1.04 0.98Durg 0.83 1.11 0.97East Nimar (Khandwa) 1.04 1.02 1.03Guna 1.17 0.91 1.04Gwalior 0.80 0.91 0.86Harda 1.17 1.02 1.10Hoshangabad 1.17 1.02 1.10Indore 0.61 1.04 0.83Jabalpur 1.00 1.02 1.01Janjir Champa 0.87 1.11 0.99Jashpur 0.91 1.11 1.01Jhabua 0.95 1.04 0.99Kanker 0.84 1.11 0.98Katni 1.00 1.02 1.01Kawardha 1.04 1.11 1.08Korba 0.87 1.11 0.99Koriya 0.76 0.86 0.81Mahasamund 0.96 1.11 1.04Mandla 0.92 1.04 0.98Mandsore 0.96 1.04 1.00Morena 0.96 0.91 0.93Nar Singh Pur 1.00 1.02 1.01Neemuch 0.96 1.04 1.00Panna 1.23 0.86 1.05Rai Garh 0.91 1.11 1.01Raipur 0.96 1.11 1.04Raisen 1.19 1.04 1.12Raj Garh 1.13 1.04 1.09Rajnand Gaon 1.04 1.11 1.08Ratlam 1.03 1.04 1.04
Districts Mortality Malnutrition IndexRewa 1.28 0.86 1.07
150

Sagar 1.15 0.86 1.01Satna 1.27 0.86 1.07Sehore 1.13 1.04 1.09Seoni 1.04 1.02 1.03Shahdol 1.11 0.86 0.99Shajapur 0.75 1.04 0.89Sheopur 0.96 0.91 0.93Shivpuri 1.17 0.91 1.04Sidhi 1.01 0.86 0.94Surguja 0.76 0.86 0.81Tikam Garh 1.22 0.86 1.04Ujjain 0.81 1.04 0.93Umariya 1.11 0.86 0.99Vidisa 1.08 0.86 0.97West Nimar (Khargon) 1.05 1.02 1.04
151
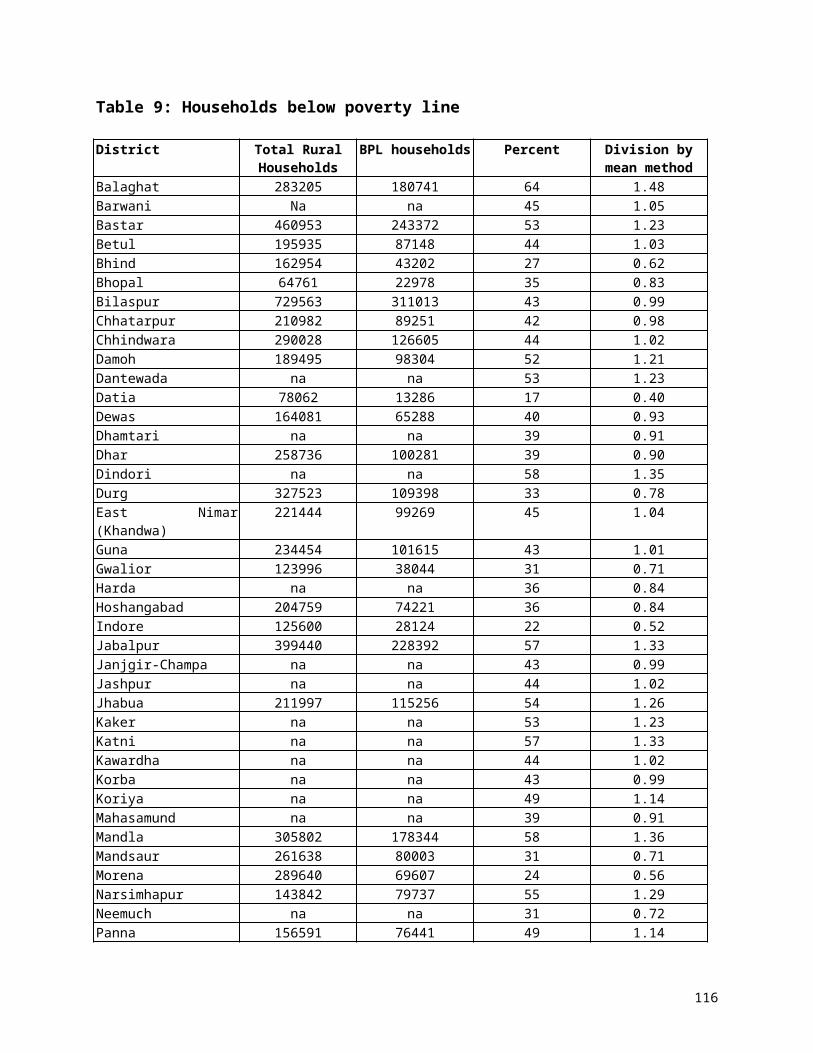
Table: 27 Composite vulnarability index with all indicators
Districts Sustenance Disaster Poverty Gender Mal-Mort Comp-vul
Balaghat 1.08 0.00 0.81 0.96 1.08 0.79Barwani 1.17 3.65 1.21 0.93 1.04 1.60Bastar 1.14 1.56 1.20 0.96 0.98 1.17Betul 0.46 3.11 0.98 0.91 1.11 1.31Bhind 1.04 0.40 0.55 1.27 0.92 0.84Bhopal 1.65 0.00 0.59 0.93 0.89 0.81Bilaspur 2.02 1.13 0.85 0.91 0.99 1.18Chhatarpur 1.00 0.00 0.79 1.10 1.05 0.79Chhindwara 0.60 2.68 1.03 0.90 0.99 1.24Damoh 0.91 1.32 0.89 0.89 1.10 1.02Dantewada 0.90 2.87 1.19 0.95 0.98 1.38Datia 1.11 0.00 0.60 1.20 1.03 0.79Dewas 0.90 1.86 0.83 1.11 0.94 1.13Dhamtari 1.12 0.00 0.80 0.96 1.04 0.78Dhar 0.74 2.50 0.97 1.04 0.93 1.23Dindori 1.00 0.00 1.05 0.99 0.98 0.80Durg 1.05 0.57 0.62 0.87 0.97 0.82East Nimar (Khandwa)
0.75 1.48 1.05 0.98 1.03 1.06
Guna 0.87 3.16 0.75 1.18 1.04 1.40Gwalior 0.91 0.00 0.57 0.98 0.86 0.66Harda 0.93 0.00 0.85 0.95 1.10 0.76Hoshangabad 0.96 0.00 0.75 0.94 1.10 0.75Indore 1.24 0.00 0.61 0.91 0.83 0.72Jabalpur 1.17 0.00 0.96 0.88 1.01 0.80Janjir Champa 2.24 0.00 0.81 0.94 0.99 1.00Jashpur 0.94 0.00 0.97 0.93 1.01 0.77Jhabua 0.75 4.09 1.20 1.03 0.99 1.61Kanker 1.04 0.00 1.07 0.93 0.98 0.80Katni 0.82 0.00 0.97 0.95 1.01 0.75Kawardha 1.42 3.17 0.89 1.06 1.08 1.52Korba 1.67 4.27 0.86 0.91 0.99 1.74Koriya 1.02 0.00 0.85 0.99 0.81 0.74Mahasamund 0.90 0.00 0.89 1.00 1.04 0.77Mandla 0.92 0.00 1.00 0.92 0.98 0.76Mandsore 0.43 0.00 0.72 1.03 1.00 0.64Morena 1.59 0.00 0.54 1.10 0.93 0.83Nar Singh Pur 1.02 0.00 0.84 0.96 1.01 0.77Neemuch 0.38 0.00 0.67 1.01 1.00 0.61Panna 0.84 2.37 0.89 1.01 1.05 1.23Rai Garh 1.10 0.00 0.95 0.95 1.01 0.80Raipur 0.98 0.00 0.80 0.97 1.04 0.76Raisen 1.02 1.22 0.85 1.03 1.12 1.05Raj Garh 0.71 1.28 0.80 1.21 1.09 1.02
152

Districts Sustenance Disaster Poverty Gender Mal-Mort Comp-vulRajnand Gaon 1.00 1.38 0.82 0.93 1.08 1.04Ratlam 0.75 0.61 0.83 1.00 1.04 0.85Rewa 0.81 1.41 0.87 0.95 1.07 1.02Sagar 1.22 0.00 0.84 0.93 1.01 0.80Satna 1.04 0.00 0.86 1.02 1.07 0.80Sehore 0.91 0.00 0.80 1.02 1.09 0.77Seoni 0.80 1.81 0.88 0.90 1.03 1.08Shahdol 1.14 2.32 0.90 0.93 0.99 1.25Shajapur 0.61 1.13 0.81 1.14 0.89 0.92Sheopur 0.88 0.00 0.68 1.17 0.93 0.73Shivpuri 0.94 1.45 0.72 1.26 1.04 1.08Sidhi 0.94 3.60 0.90 1.08 0.94 1.49Surguja 1.16 0.00 0.95 1.04 0.81 0.79Tikam Garh 0.93 0.00 0.70 1.12 1.04 0.76Ujjain 0.99 0.00 0.77 0.97 0.93 0.73Umariya 0.93 3.29 0.90 0.97 0.99 1.41Vidisa 0.89 0.00 0.77 1.00 0.97 0.73West Nimar (Khargon)
0.54 1.31 1.12 0.95 1.04 0.99
153

Table 28: Co-relation Matrix
Correlation CoefficientsCEREAL SEASONAL SAFETYNE CATTLCRO DROUGHT BPL
CEREAL 1.0000 .0040 -.0648 -.1477 .1522 .0959SEASONAL .0040 1.0000 -.2044 -.0591 -.3560** -.1647SAFETYNE -.0648 -.2044 1.0000 -.1408 -.1096 -.2440CATTLCRO -.1477 -.0591 -.1408 1.0000 .0486 -.0369DROUGHT .1522 -.3560** -.1096 .0486 1.0000 .2309BPL .0959 -.1647 -.2440 -.0369 .2309 1.0000SC .0688 .1175 .3615** .0239 -.3454** -.5250**ST -.0526 -.0353 -.3581** -.1164 .4317** .4939**MIGRATIO -.0157 -.2073 -.1328 .0395 .0514 .0361ILLITERA -.1628 -.0643 -.1843 -.1362 .5226** .2473AGRILAB .0238 -.0772 .2982* .0155 -.1617 .2090WORKCHIL -.0080 -.4764** -.0730 .0458 .3781** .4038**DISPLIT -.0564 .0125 -.1340 -.1387 .2458 -.1215DISPIMR -.3125* -.0452 .1782 .0306 -.1530 -.2248DISPCMR -.1898 -.0079 .1361 -.1015 -.1283 -.4954**SEXRATIO -.0180 .0643 .1330 -.1327 -.1829 -.4569**IMR -.0367 -.1025 -.1592 .0469 .0692 .2468CMR -.2594* -.2591* .1615 -.0152 .1587 .1175MALNOURI .1074 .1024 .0246 .1875 .0048 .0298AWC -.0094 .1528 .0299 .2174 .0501 .0600
Correlation Coefficients
SC ST MIGRATIO ILLITERA AGRILAB WORKCHIL
CEREAL .0688 -.0526 -.0157 -.1628 .0238 -.0080SEASONAL .1175 -.0353 -.2073 -.0643 -.0772 -.4764**SAFETYNE .3615** -.3581** -.1328 -.1843 .2982* -.0730CATTLCRO .0239 -.1164 .0395 -.1362 .0155 .0458DROUGHT -.3454** .4317** .0514 .5226** -.1617 .3781**BPL -.5250** .4939** .0361 .2473 .2090 .4038**SC 1.0000 -.8796** .1343 -.3147* .1694 -.5743**ST -.8796** 1.0000 -.0332 .5747** -.3108* .6182**MIGRATIO .1343 -.0332 1.0000 .0722 .1370 .0280ILLITERA -.3147* .5747** .0722 1.0000 -.5286** .4309**AGRILAB .1694 -.3108* .1370 -.5286** 1.0000 -.2367WORKCHIL -.5743** .6182** .0280 .4309** -.2367 1.0000DISPLIT .1196 .0048 .0630 .6867** -.4440** -.0262DISPIMR .2709* -.3278** -.0155 .0414 -.1992 -.1140DISPCMR .4784** -.4077** .1518 .0157 -.2768* -.2836*SEXRATIO .6426** -.5551** .0769 -.0126 -.2168 -.4202**IMR .0931 -.1199 .3345** .0178 .2286 -.0698CMR .3994** -.3069* .3474** .2282 .1524 -.1131MALNOURI -.3171* .2675* .0404 -.1602 .1022 .3093*AWC .3463** -.3562** .2605* -.0510 .1829 -.2449
154
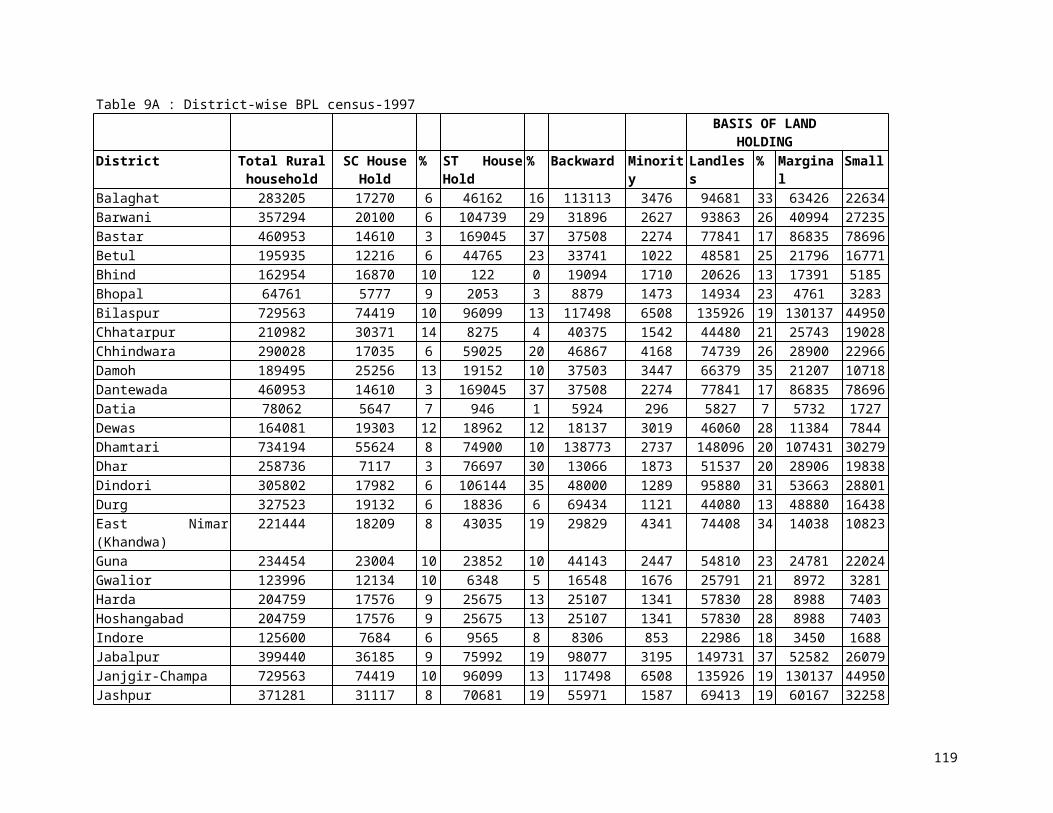
Correlation Coefficients
DISPLIT DISPIMR DISPCMR SEXRATIO IMR CMR
CEREAL -.0564 -.3125* -.1898 -.0180 -.0367 -.2594*SEASONAL .0125 -.0452 -.0079 .0643 -.1025 -.2591*SAFETYNE -.1340 .1782 .1361 .1330 -.1592 .1615CATTLCRO -.1387 .0306 -.1015 -.1327 .0469 -.0152DROUGHT .2458 -.1530 -.1283 -.1829 .0692 .1587BPL -.1215 -.2248 -.4954** -.4569** .2468 .1175SC .1196 .2709* .4784** .6426** .0931 .3994**ST .0048 -.3278** -.4077** -.5551** -.1199 -.3069*MIGRATIO .0630 -.0155 .1518 .0769 .3345** .3474**ILLITERA .6867** .0414 .0157 -.0126 .0178 .2282AGRILAB -.4440** -.1992 -.2768* -.2168 .2286 .1524WORKCHIL -.0262 -.1140 -.2836* -.4202** -.0698 -.1131DISPLIT 1.0000 .1475 .2707* .3110* -.0449 .2326DISPIMR .1475 1.0000 .6275** .3306** -.0651 .2371DISPCMR .2707* .6275** 1.0000 .6498** -.1380 .2851*SEXRATIO .3110* .3306** .6498** 1.0000 .0546 .2886*IMR -.0449 -.0651 -.1380 .0546 1.0000 .6174**CMR .2326 .2371 .2851* .2886* .6174** 1.0000MALNOURI -.2230 -.1466 -.2830* -.5795** -.3177* -.5151**AWC .0522 .1364 .1562 .1012 .2681* .4024**
Correlation Coefficients
MALNOURI AWC
CEREAL .1074 -.0094SEASONAL .1024 .1528SAFETYNE .0246 .0299CATTLCRO .1875 .2174DROUGHT .0048 .0501BPL .0298 .0600SC -.3171* .3463**ST .2675* -.3562**MIGRATIO .0404 .2605*ILLITERA -.1602 -.0510AGRILAB .1022 .1829WORKCHIL .3093* -.2449DISPLIT -.2230 .0522DISPIMR -.1466 .1364DISPCMR -.2830* .1562SEXRATIO -.5795** .1012IMR -.3177* .2681*CMR -.5151** .4024**MALNOURI 1.0000 -.1783AWC -.1783 1.0000
* - Signif. LE .05 ** - Signif. LE .01 (2-tailed)
" . " is printed if a coefficient cannot be computed
155

Table 29: Composite vulnerability index with selected indicators
District Disaster proneness
BPL Working child
Disp-Literacy Under 5 mortality
Vul Index
Balaghat 0.00 1.48 0.80 0.77 1.09 0.83Barwani 3.65 1.05 2.26 0.87 1.03 1.77Bastar 1.56 1.23 2.16 1.06 0.84 1.37Betul 3.11 1.03 1.63 0.76 1.18 1.54Bhind 0.40 0.62 0.25 1.06 0.97 0.66Bhopal 0.00 0.83 0.45 0.61 0.69 0.51Bilaspur 1.13 0.99 0.75 1.00 0.80 0.94Chhatarpur 0.00 0.98 0.88 1.00 1.30 0.83Chhindwara 2.68 1.02 1.99 0.78 0.93 1.48Damoh 1.32 1.21 0.77 0.90 1.27 1.09Dantewada 2.87 1.23 2.16 1.02 0.84 1.62Datia 0.00 0.40 0.47 1.16 1.16 0.64Dewas 1.86 0.93 0.68 1.08 0.84 1.08Dhamtari 0.00 0.91 0.97 0.87 0.90 0.73Dhar 2.50 0.90 1.21 1.04 0.80 1.29Dindori 0.00 1.35 1.05 1.21 0.86 0.89Durg 0.57 0.78 0.27 0.78 0.80 0.64East Nimar (Khandwa)
1.48 1.04 2.04 0.84 0.99 1.28
Guna 3.16 1.01 0.59 1.24 1.27 1.46Gwalior 0.00 0.71 0.36 0.75 0.78 0.52Harda 0.00 0.84 0.34 0.84 1.17 0.64Hoshangabad 0.00 0.84 0.34 0.77 1.17 0.63Indore 0.00 0.52 0.33 0.66 0.61 0.43Jabalpur 0.00 1.33 1.51 0.66 0.96 0.89Janjgir-Champa 0.00 0.99 0.75 1.09 0.80 0.73Jashpur 0.00 1.02 1.04 0.89 0.86 0.76Jhabua 4.09 1.26 2.01 1.03 1.10 1.90Kaker 0.00 1.23 2.16 0.95 0.84 1.04Katni 0.00 1.33 1.51 0.94 0.96 0.95Kawardha 3.17 1.02 1.32 1.43 0.98 1.58Korba 4.27 0.99 0.75 0.99 0.80 1.56Koriya 0.00 1.14 1.12 0.96 0.74 0.79Mahasamund 0.00 0.91 0.97 1.04 0.90 0.76Mandla 0.00 1.36 1.05 0.94 0.86 0.84Mandsaur 0.00 0.71 1.17 1.10 0.98 0.79Morena 0.00 0.56 0.49 1.22 0.90 0.63Narsimhapur 0.00 1.29 0.42 0.74 0.97 0.68Neemuch 0.00 0.72 1.17 1.04 0.98 0.78Panna 2.37 1.14 0.90 1.09 1.33 1.36Raigarh 0.00 1.01 1.04 0.98 0.86 0.78Raipur 0.00 0.91 0.97 0.93 0.90 0.74Raisen 1.22 1.17 0.46 0.96 1.17 1.00District Disaster
pronenessBPL Working
childDisp-Literacy Under 5
mortalityVul Index
Rajgarh 1.28 1.10 1.09 1.34 1.19 1.20
156

Rajnandgaon 1.38 1.03 1.32 0.92 0.98 1.13Ratlam 0.61 0.88 1.29 0.90 0.97 0.93Rewa 1.41 1.32 0.64 1.01 1.28 1.13Sagar 0.00 1.20 0.62 0.81 1.12 0.75Satna 0.00 1.19 0.71 0.97 1.33 0.84Sehore 0.00 0.83 0.68 1.17 1.16 0.77Seoni 1.81 0.96 0.67 0.83 0.99 1.05Shahdol 2.32 1.00 0.90 1.06 1.05 1.26Shajapur 1.13 0.84 0.92 1.30 1.10 1.06Sheopur 0.00 0.56 0.49 1.52 0.90 0.69Shivpuri 1.45 0.69 0.91 1.39 1.31 1.15Sidhi 3.60 1.31 0.85 1.45 1.08 1.66Surguja 0.00 1.13 1.12 1.16 0.74 0.83Tikamgarh 0.00 0.83 0.80 1.08 1.22 0.79Ujjain 0.00 0.68 0.80 0.89 0.96 0.67Umaria 3.29 1.00 0.90 1.21 1.05 1.49Vidisha 0.00 0.92 0.48 0.95 1.25 0.72West Nimar(Khargone)
1.31 1.06 2.26 0.96 1.03 1.32
157