are women doing it for themselves? gender segregation and...
TRANSCRIPT

Are Women Doing it for Themselves? Gender Segregation and the Gender Wage Gap
Alex BrysonUCL
John ForthCass Business School
Nikos TheodoropoulosUniversity of Cyprus
IAB Workshop on The Gender Wage Gap in Europe20th May, 2019

Overview
• Workplace segregation can affect size of the GWG
• Require linked employer-employee data to investigate the link
• Some evidence on its effects
• We contribute by focusing on segregation in different parts of the workplace hierarchy
• And by investigating mechanisms and causality
• Work in progress – comments very welcome

Gender Composition Can Affect GWG
• How?– Representation of women’s interests
• Access to training, promotion etc
– Mentors/role models– Discrimination, fairness, information (female productivity)– Gender norms at workplace
• Accommodate women’s preferences: work-life balance
– Collective bargaining (median voter, eg. Bryson et al 2019)
• Within workplace– Gender composition of non-managers– Gender composition of managers
• If women are well-represented at management level, then managerial decision-making has particular regard to the interests of women
• But….queen bees

Background on Britain
• 1970 Equal Pay Act came into force on 29th December 1975
• Raw GWG in median unconditional hourly pay was 18.4% in 2017 (McGuinness, 2018).
• Employment rates among women have been rising steadily, reaching 70% by 2017, while men’s has been falling
– the employment gap was 8.9 percentage points in 2017 (McGuinness, 2018).

Background on Britain
• Women have made advances across the occupational distribution
– by 2017 women were better represented than men in professional occupations (McGuinness, 2018).
• Concerns remain about their ability to access managerial positions.
– In 2017 women were outnumbered nearly 2:1 by men in the top occupations (managers, directors and senior officials) (McGuinness, 2018).

Segregation and GWG in Europe
• Britain: Mumford and Smith (2008): in 2004 share female in workplace reduces GWG between full-timers by 1.6 log points and 2.3 log points among part-timers
• Sweden: Hensvik (2014) – GWG falls in female-led firms, but driven by worker sorting as opposed to the treatment of equally productive men and women, i.e. female managers recruit high-wage women rather than paying their existing women more relative to equivalent men
• Germany: Ludsteck (2014) - examines the role of non-random sorting of workers– Increasing share women in a job cell lowers wages for those in those jobs
– Women working in job cells dominated by men have above-average unobserved individual ability
• Germany: Bruns (2019) – sorting across firms accounts for failure to close GWG in last two decades– Firm-specific wages rising faster in high-wage firms where men dominate
– Within those firms men receiving higher premia than women

Data• Two cross sections of the British Workplace Employment
Relations Survey: WERS 2004 & 2011• Randomly select workplaces with 5 or more employees
from IDBR, highest quality available sampling frame.• Sampling stratifies by workplace size and industry.• Consists of three questionnaires: MQ, EQ, WRQ.• 25 random employees in each workplace (or all if <25).• Response rates MQ: 64% in 2004; 46% in 2011.• Response rates EQ: 60% in 2004%; 54% in 2011.
• Panel 2004-2011– Workplace panel n~=1,000 random subsample of 2004– Two time points– Linked data but no panel component to the employees

Data
• Log hourly earnings❑ Workers report weekly/annual income banded into 14 categories
“How much do you get paid for your job here, before tax and other deductions are taken out? If your pay before tax changes from week to week because of overtime, or because you work different hours each week, think about what you earn on average.”
❑ £60 or less per week, £61-£100,…,£1051 or more per week❑ Worker-reported usual weekly working hours
• HR manager reports N employees• N female employees -> share female• N female managers -> share female managers• N female supervisors -> share female supervisors• N female non-managers -> share female non-managers
• Sample❑ Employees with positive hours of work, establishments with 10 or
more employees across the public and private sectors

Share female in the workforce WERS 2011

Share female among managers WERS 2011

Econometric Specifications𝑙𝑜𝑔
𝑤𝑖(𝑗)
ℎ𝑖(𝑗)=
(1) 𝛽0 + 𝛽1𝐹𝑒𝑚𝑖(𝑗) + 𝜀𝑖(𝑗)
2 𝛽0 + 𝛽1𝐹𝑒𝑚𝑖(𝑗) + 𝛽3𝑿𝑖𝑗 + 𝛽4𝑾𝑗 + 𝜀𝑖(𝑗)
(3) 𝛽0 + 𝛽1𝐹𝑒𝑚𝑖(𝑗) + 𝛽2𝑆ℎ𝐹𝑒𝑚𝑗 + 𝜷𝟑𝑭𝒆𝒎𝒊(𝒋) ∗ 𝑺𝒉𝑭𝒆𝒎𝒋 + 𝛽4𝑿𝑖𝑗 + 𝛽5𝑾𝑗 + 𝜀𝑖 𝑗
4 𝛽0 + 𝛽1𝐹𝑒𝑚𝑖(𝑗) + 𝛽2𝑆ℎ𝐹𝑒𝑚𝑀𝑎𝑛𝑎𝑔𝑗 + 𝜷𝟑𝑭𝒆𝒎𝒊(𝒋) ∗ 𝑺𝒉𝑭𝒆𝒎𝑴𝒂𝒏𝒂𝒈𝒋+ 𝛽4𝑆ℎ𝐹𝑒𝑚𝑁𝑜𝑛𝑀𝑎𝑛𝑗 + 𝜷𝟓𝑭𝒆𝒎𝒊(𝒋) ∗ 𝑺𝒉𝑭𝒆𝒎𝑵𝒐𝒏𝑴𝒂𝒏𝒋 + 𝛽6𝑿𝑖𝑗 + 𝛽7𝑾𝑗 + 𝜀𝑖(𝑗)
• Models incorporating workplace FE– Gender segregation main effect drops out but interaction with gender remains
• Panel first difference models– First stage: recover male/female residual wages
• Cleans out differences across workplaces in terms of employee demographics and human capital
– Second stage at workplace-level: difference in residual wage gap 2004-11 and association with change in workplace-level gender segregation

Results• GWG
– Sensitivity to conditioning variables and estimation approach
• Interaction between segregation and female– Female share
– Female share manager, female share non-manager
– Female share supervisors
• Mechanisms interacting segregation, female and practices– Training
– Individual incentive pay
• Introduction of workplace FE
• Workplace-level panel analysis
• Initial efforts at instrumenting for share female– Using head office country of origin
– Perhaps Public Sector Equality Duty

GWG in log hourly wages(1) (2) (3) (4) (5) (6) (7)
Only female Plus Personal & Education
Plus Job & Occupation
Plus Workplace
Plus Workforce
IntervalReg
FE
Panel A. WERS 2004
Female -0.206***(0.014)
-0.197***(0.011)
-0.155***(0.011)
-0.135***(0.010)
-0.127***(0.010)
-0.133***(0.010)
-0.117***(0.011)
R-sq adj. 0.030 0.254 0.387 0.420 0.439 --- 0.500
N = 20,697
Panel B. WERS 2011
Female -0.182***(0.019)
-0.171***(0.015)
-0.119***(0.015)
-0.103***(0.014)
-0.099***(0.014)
-0.111***(0.014)
-0.094***(0.015)
R-sq adj. 0.019 0.216 0.360 0.399 0.419 --- 0.464
N = 19, 324
Panel C. Pooled
Female -0.194***(0.012)
-0.185***(0.009)
-0.136***(0.009)
-0.118***(0.009)
-0.112***(0.009)
-0.120***(0.009)
-0.106***(0.009)
R-sq adj. 0.066 0.265 0.396 0.431 0.449 --- 0.502
N = 40, 021

Log Hourly Earnings and Workplace Segregation Interactions with Gender
WERS 2011
(1) (2) (3)
Female -0.088***(0.014)
-0.187***(0.033)
-0.184***(0.034)
Share female in workforce -0.116**(0.047)
-0.211***(0.060)
Share female X Female 0.194***(0.056)
Share female among managers -0.078*(0.042)
Share female among non-managers -0.137**(0.062)
Share female among managers X Female 0.134***(0.050)
Share female among non-managers X Female 0.084(0.064)
Constant 1.414***(0.106)
1.444***(0.106)
1.415***(0.105)
Observations 19,324 19,324 19,324
R-squared adjusted 0.420 0.421 0.422

Log Hourly Earnings and Workplace Segregation among Managers and Non-Managers: WERS 2011
2.3
52.4
2.4
52.5
2.5
5
Lin
ear
Pre
dic
tion
0 .1 .2 .3 .4 .5 .6 .7 .8 .9 1FemaleShareManagers
Female=0 Female=1
Predictive Margins of Female with 95% CIs
2.3
2.4
2.5
2.6
Lin
ear
Pre
dic
tion
0 .1 .2 .3 .4 .5 .6 .7 .8 .9 1FemaleShareNonManagers
Female=0 Female=1
Predictive Margins of Female with 95% CIs

Log Hourly Earnings and Workplace Segregation among Managers and Non-Managers: WERS 2011
-.2
-.15
-.1
-.05
0
.05
Con
tra
sts
of L
inea
r P
redic
tion
0 .1 .2 .3 .4 .5 .6 .7 .8 .9 1FemaleShareManagers
Contrasts of Predictive Margins of Female with 95% CIs

Log Hourly Earnings and Workplace Segregation Interactions with GenderWERS 2011 with Workplace FE
(1) (2) (3)
Female -0.094*** -0.156*** -0.148***
(0.015) (0.039) (0.040)
FemaleShareManagers*Female 0.162***
(0.055)
FemaleShareNonManagers*Female -0.011
(0.075)
FemaleShareWorkforce*Female 0.123*
(0.066)
Constant 1.936*** 1.931*** 1.927***
(0.094) (0.094) (0.094)
Observations 19,324 19,324 19,324
Adj R-squared 0.464 0.464 0.464
Robust standard errors in parentheses, *** p<0.01, ** p<0.05, * p<0.1

Impact of Share Female Supervisors on Gender Wage Gap, Pooled 2004-11VARIABLES Female Superv/ors vs Female All Female Superv/ors vs Female Managers
Female -0.167*** -0.162***
(0.020) (0.020)
FemaleShareManagers -0.057**
(0.029)
FemaleShareManagers*Female 0.088***
(0.033)
FemaleShareNonManagers -0.057
(0.040)
FemaleShareNonManagers*Female -0.015
(0.043)
FemShareSupervisors -0.060** -0.063**
(0.025) (0.025)
FemShareSupervisors*Female 0.091*** 0.083***
(0.030) (0.030)
FemaleShareWorkforce -0.110***
(0.042)
FemaleShareWorkforce*Female 0.050
(0.042)
Constant 1.473*** 1.457***
(0.071) (0.071)
Observations 40,021 40,021
R-squared 0.452 0.452
r2_a 0.451 0.451
Robust standard errors in parentheses *** p<0.01, ** p<0.05, * p<0.1

Share Female Supervisors

Log Hourly Wages, Fem*Fem Share Manager*Incentive Pay. WERS 20112
.22
.42
.62
.8
0 .1 .2 .3 .4 .5 .6 .7 .8 .9 1 0 .1 .2 .3 .4 .5 .6 .7 .8 .9 1
Female=0 Female=1
incentpay=0 incentpay=1
Lin
ea
r P
redic
tion
FemaleShareManagers
Predictive Margins of Female#incentpay with 95% CIs

Workplace Segregation and the Gender Gap in Training Receipt– WERS 2011
(1) (2) (3)
Any training 1+ day training Training intensity
VARIABLES 2011 2011 2011
Female -0.055* -0.062** -0.222**
(0.028) (0.031) (0.096)
FemaleShareManagers -0.037 -0.025 -0.041
(0.038) (0.043) (0.137)
FemaleShareManagers*Female 0.076* 0.097** 0.248*
(0.042) (0.046) (0.133)
FemaleShareNonManagers 0.073 0.044 0.019
(0.053) (0.055) (0.166)
FemaleShareNonManagers*Female -0.021 -0.043 -0.122
(0.056) (0.060) (0.183)
Constant 0.522*** 0.542*** 3.152***
(0.091) (0.089) (0.297)
Observations 19,209 19,209 19,209
R-squared 0.120 0.132 0.144
r2_a 0.116 0.128 0.140
Robust standard errors in parentheses, *** p<0.01, ** p<0.05, * p<0.1.
Training intensity is in days: 0. None, 1. < one day, 2. one to < two days, 3. two to < 5 days, 4. five to <
than 10 days, 5. >10 days .

Workplace Segregation and Off the Job Training Intensity - WERS 2011

Change in Residual GWG and Share FemalesWorkplace Panel Analysis, 2004-11
(1) (2) (3) (4)
OLS-FE OLS-FE OLS-FE
Female share -0.057
(0.083)
Female share of managers -0.060* -0.058*
(0.035) (0.034)
Female share of non-managers -0.060 -0.050
(0.073) (0.071)
Constant 0.114 0.118 0.115 0.143
(0.115) (0.107) (0.110) (0.119)
Observations 1,184 1,184 1,184 1,184
r2_a 0.0875 0.110 0.0894 0.112
Robust standard errors in parentheses, *** p<0.01, ** p<0.05, * p<0.1

Causality• IV share female managers with employer country of
origin
– Uses HQ location
– Builds on research showing importance of cross-country attitudes to gender on gender progression in the workplace (Fortin, 2005)
– Strong first stage
– Exclusion restriction depends partly on what else we condition on in the wage equation, eg. foreign owned
• IV using 2010 public sector quality duty
– Advancing equality of opportunity among those carrying out public duties
– Interact public*2011

Conclusions So Far
• Contribute to the literature examining the role of gender composition at the workplace and the influence it has on the size of the GWG
• We show that the GWG falls markedly as the share of female managers’ rises. In workplaces where the vast majority of managers are female the GWG virtually disappears
• Share female managers increases women’s access to training and closes the GWG when workers are paid for performance

On-going Work
• Much of the decline in the GWG and in the gender training gap arises due to worsening in men’s positions, not only relatively but also in absolute terms.
• Reallocation of limited resources from men to women when share female managers rises (i.e. supervisory support and mentor time).
• Further evidence on mechanisms that might drive the results
• Instrument for share female and share female managers.

Additional Slides
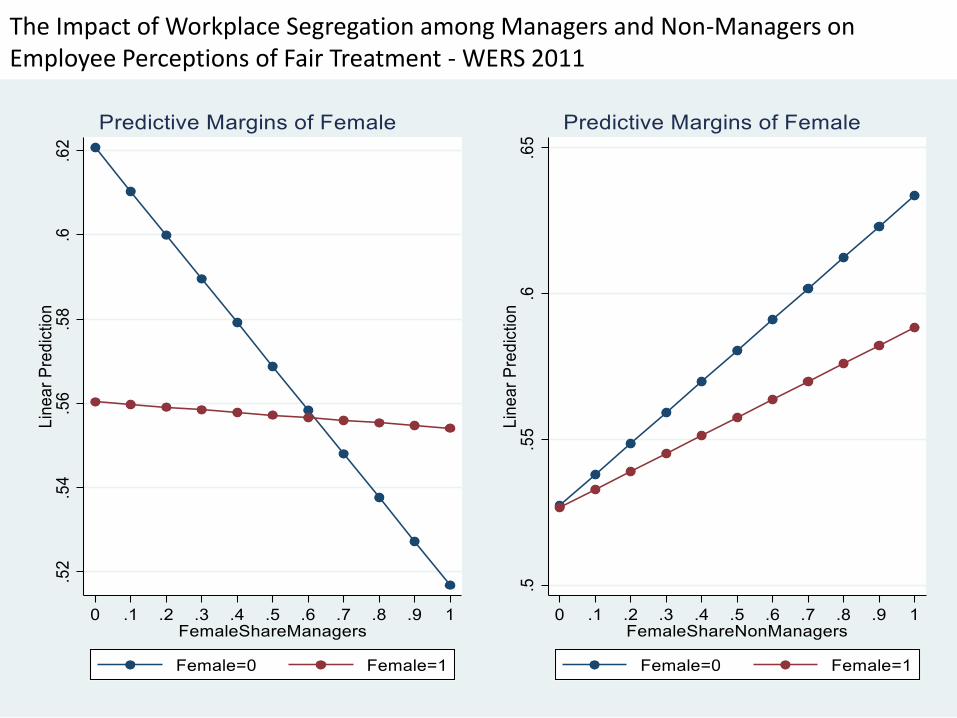
The Impact of Workplace Segregation among Managers and Non-Managers on Employee Perceptions of Fair Treatment - WERS 2011

Share Female Managers – Role of Equal Opportunities Practices, 2004-11 WERS Panel
(1) (2)
VARIABLES OLS OLS with establishment FE
PCA establishment level policies 0.038*** 0.039*
(0.013) (0.022)
Constant 0.521*** 0.448**
(0.202) (0.186)
Observations 1844 1844
Mean of the dependent variable 0.352 0.352
R-squared 0.324 0.852
R-squared adjusted 0.307 0.676
Number of workplaces 933 933
The “PCA establishment level policies” is the first principal component constructed using the following dummy variables: “the establishment has a formal written policy on equal opportunities or managing diversity”“when filling vacancies the establishment conducts performance or competency tests”“when filling vacancies the establishment conducts personality or attitude tests”“when filling vacancies the establishment has special procedures to encourage applications from women returning to work after having children, or women in general”“the establishment monitors recruitment and selection by gender”“the establishment reviews recruitment and selection procedures to identify indirect discrimination by gender”“if employees are entitled to work only during school term-time”, “if there is a workplace nursery or nursery linked with the workplace”If there has been a grievance in the last year through a procedure or not over the following issues:“grievance over job grading/classification and grievance over promotion/career advancement/internal transfers”
“sex and race discrimination”“relations with supervisors/line managers (i.e. unfair treatment, victimisation)”“sexual/racial harassment and bullying at work”

Incentive Pay Results(1) (2)
Without FE With FE
Female -0.179*** -0.131***
(0.034) (0.039)
Incentive pay 0.128** 0.146**
(0.060) (0.074)
Female * incentive pay -0.044 -0.124
(0.122) (0.135)
FemaleShareManagers -0.068
(0.043)
Female * FemaleShareManagers 0.120** 0.139**
(0.050) (0.055)
Incentive pay * FemaleShareManagers -0.140 -0.182
(0.148) (0.162)
Female*incentive pay*FemaleShareManagers 0.300 0.267
(0.244) (0.301)
FemaleShareNonManagers -0.159***
(0.060)
Female*FemaleShareNonManagers 0.107* 0.002
(0.064) (0.074)
Incentive pay *FemaleShareNonManagers 0.050 0.061
(0.159) (0.190)
Female*incentive pay*FemaleShareNonManagers -0.203 -0.068
(0.212) (0.228)
Constant 1.773*** 1.915***
(0.110) (0.096)
Observations 18,647 18,647
R-squared 0.425 0.514
r2_a 0.423 0.464

Training Results with FE
(1) (2) (3)
Any training 1+ day training Training intensity
VARIABLES 2011 FE 2011 FE 2011 FE
Female -0.065** -0.091*** -0.294***
(0.031) (0.034) (0.112)
FemaleShareManagers*Female -0.006 0.041 0.096
(0.046) (0.055) (0.147)
FemaleShareNonManagers*Female 0.085 0.062 0.177
(0.058) (0.067) (0.218)
Constant 0.835*** 0.789*** 3.929***
(0.069) (0.070) (0.241)
Observations 19,209 19,209 19,209
R-squared 0.269 0.276 0.296
r2_a 0.196 0.204 0.226