are we doing well slides
TRANSCRIPT
8/11/2019 Are We Doing Well Slides
http://slidepdf.com/reader/full/are-we-doing-well-slides 1/10
Copyright © 1999-2003 The Westfall Team. All Rights Reserved.
Linda Westfall
Partnering for Excellence in Software
Are We Doing Well or Are We Doing Poorly
Measurement is Common Decision Criteria Defined
According to the ISO/IEC 15939 standard forSoftware Engineering -- Software MeasurementProcess:
Decision criteria are the thresholds, targets, or
patterns used to:• Determine the need for action or further
investigation
• Describe the level of confidence in a given result
[ISO/IEC-15939:2002]
8/11/2019 Are We Doing Well Slides
http://slidepdf.com/reader/full/are-we-doing-well-slides 2/10
8/11/2019 Are We Doing Well Slides
http://slidepdf.com/reader/full/are-we-doing-well-slides 3/10
Copyright © 1999-2003 The Westfall Team. All Rights Reserved.
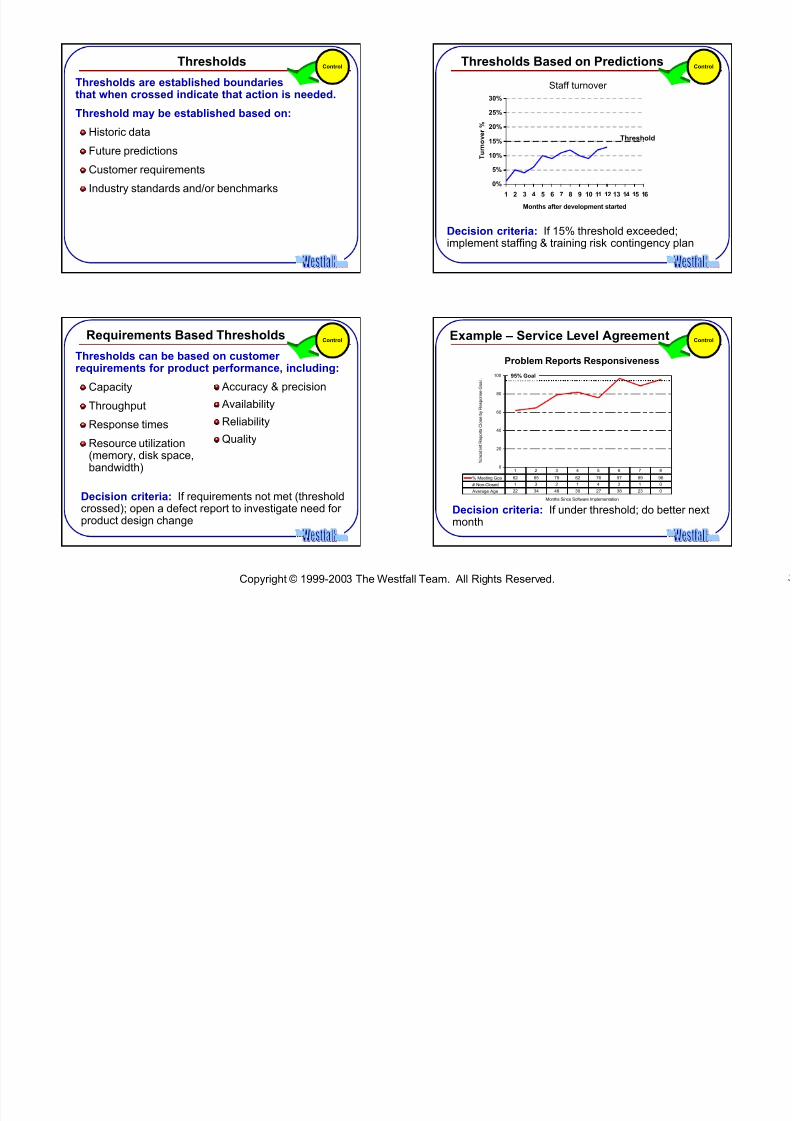
Thresholds
Thresholds are established boundariesthat when crossed indicate that action is needed.
Threshold may be established based on:
Historic data
Future predictions
Customer requirements
Industry standards and/or benchmarks
ControlThresholds Based on Predictions
0%
5%
10%
15%
20%
25%
30%
1 2 3 4 5 6 7 8 9 10 11 12 13 14 15 16
Months after development started
T u r n o v e r %
Threshold
Decision criteria: If 15% threshold exceeded;implement staffing & training risk contingency plan
Control
Staff turnover
Requirements Based Thresholds
Thresholds can be based on customerrequirements for product performance, including:
Capacity
Throughput
Response times
Resource utilization(memory, disk space,bandwidth)
Accuracy & precision
Availability
Reliability
Quality
Decision criteria: If requirements not met (thresholdcrossed); open a defect report to investigate need for
product design change
Control Example – Service Level Agreement
0
20
40
60
80
100
Months Since Software Implementation
% I n c i d e n t R e p o r t s C l o s e b y R e s p o n s e G o a l .
% Meeting Goal 62 65 79 82 76 97 89 96
# Non-Closed 1 3 2 1 4 2 1 0
Average Age 22 34 48 30 27 38 23 0
1 2 3 4 5 6 7 8
95% Goal
Control
Problem Reports Responsiveness
Decision criteria: If under threshold; do better nextmonth
8/11/2019 Are We Doing Well Slides
http://slidepdf.com/reader/full/are-we-doing-well-slides 4/10
Copyright © 1999-2003 The Westfall Team. All Rights Reserved.
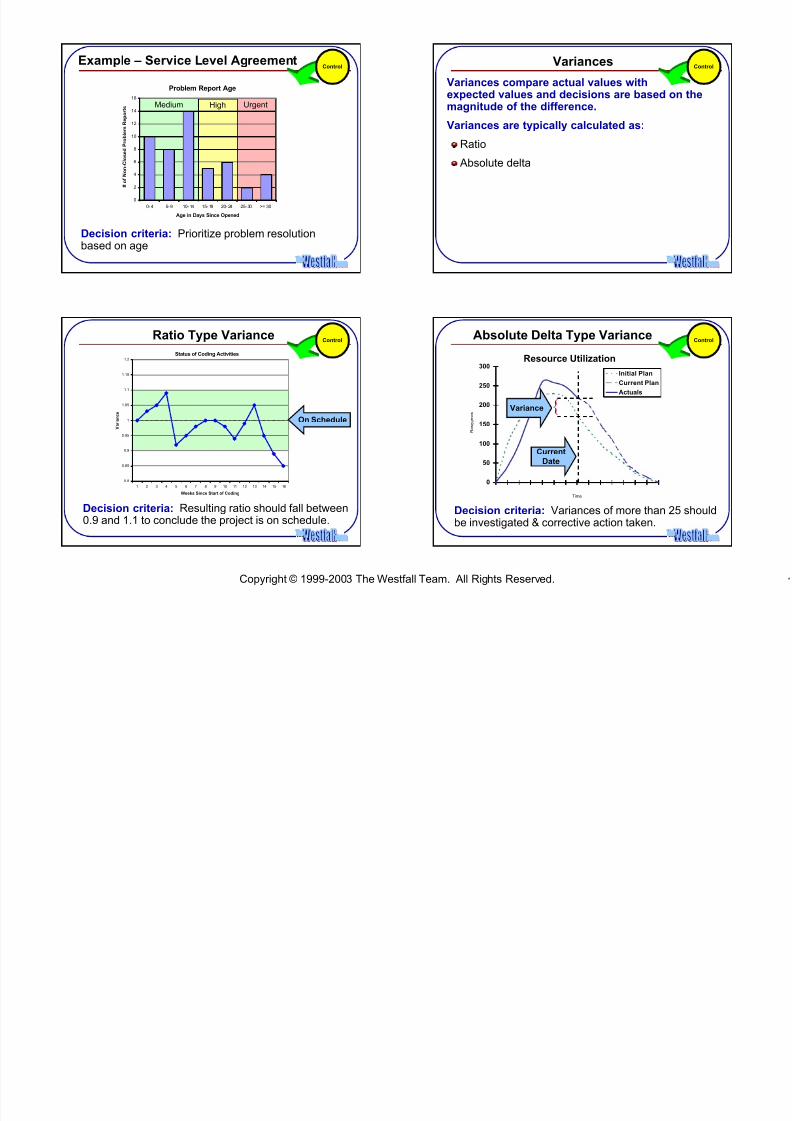
UrgentHighMedium
Example – Service Level AgreementControl
Problem Report Age
0
2
4
6
8
10
12
14
16
0- 4 5- 9 10- 14 15- 19 20- 24 25- 30 >= 30
Age in Days Since Opened
# o f N o n - C l o s e d P r o b l e m R
e p o r t s
Decision criteria: Prioritize problem resolutionbased on age
Variances
Variances compare actual values withexpected values and decisions are based on the
magnitude of the difference.
Variances are typically calculated as:
Ratio
Absolute delta
Control
Ratio Type VarianceControl
Status of Coding Activities
0.8
0.85
0.9
0.95
1
1.05
1.1
1.15
1.2
1 2 3 4 5 6 7 8 9 10 11 12 13 14 15 16
Weeks Since Start of Coding
V a r i a n c e
On Schedule
Decision criteria: Resulting ratio should fall between
0.9 and 1.1 to conclude the project is on schedule.
Absolute Delta Type VarianceControl
0
50
100
150
200
250
300
Time
R e s o u r c e s
Initial Plan
Current Plan
Actuals
Current
Date
}Variance
Decision criteria: Variances of more than 25 shouldbe investigated & corrective action taken.
Resource Utilization
8/11/2019 Are We Doing Well Slides
http://slidepdf.com/reader/full/are-we-doing-well-slides 5/10
Copyright © 1999-2003 The Westfall Team. All Rights Reserved.
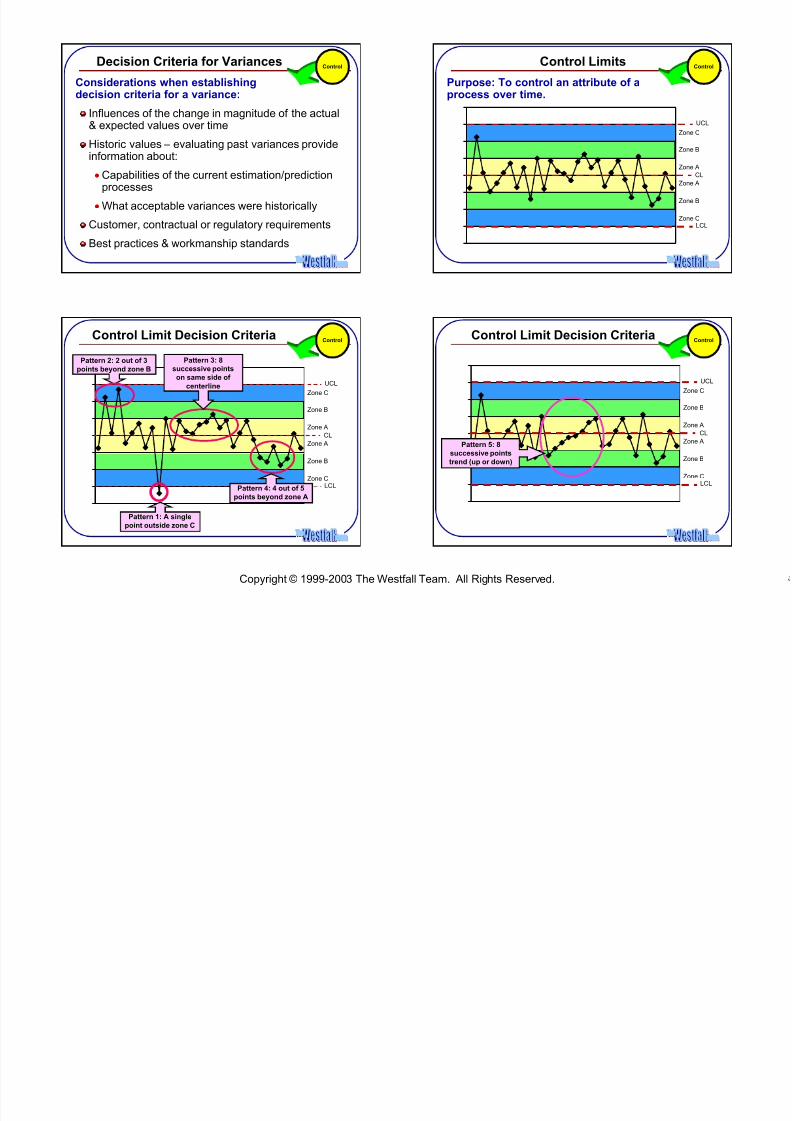
Decision Criteria for Variances
Considerations when establishingdecision criteria for a variance:
Influences of the change in magnitude of the actual& expected values over time
Historic values – evaluating past variances provideinformation about:
• Capabilities of the current estimation/predictionprocesses
• What acceptable variances were historicallyCustomer, contractual or regulatory requirements
Best practices & workmanship standards
ControlControl Limits
Purpose: To control an attribute of aprocess over time.
UCL
LCL
CLZone A
Zone A
Zone B
Zone C
Zone B
Zone C
Control
Control Limit Decision Criteria
UCL
LCL
CL
Zone A
Zone A
Zone B
Zone C
Zone B
Zone C
Pattern 1: A singlepoint outside zone C
Pattern 2: 2 out of 3
points beyond zone B
Pattern 3: 8
successive points
on same side of
centerline
Pattern 4: 4 out of 5
points beyond zone A
Control
UCL
LCL
CLZone A
Zone A
Zone B
Zone C
Zone B
Zone C
Control Limit Decision Criteria
Pattern 5: 8
successive points
trend (up or down)
Control
8/11/2019 Are We Doing Well Slides
http://slidepdf.com/reader/full/are-we-doing-well-slides 6/10Copyright © 1999-2003 The Westfall Team. All Rights Reserved.
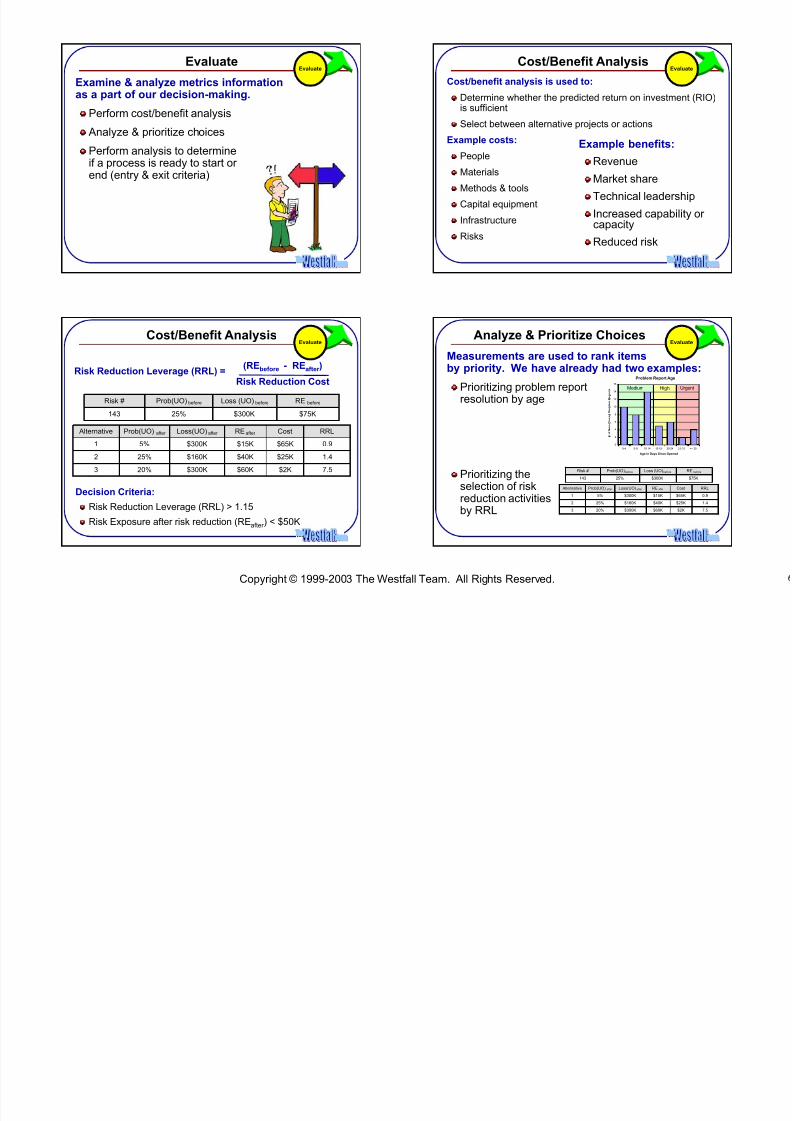
Evaluate
Examine & analyze metrics informationas a part of our decision-making.
Perform cost/benefit analysis
Analyze & prioritize choices
Perform analysis to determineif a process is ready to start orend (entry & exit criteria)
EvaluateCost/Benefit Analysis
Cost/benefit analysis is used to:
Determine whether the predicted return on investment (RIO)is sufficient
Select between alternative projects or actions
Example costs:
People
Materials
Methods & tools
Capital equipmentInfrastructure
Risks
Evaluate
Example benefits:
Revenue
Market share
Technical leadership
Increased capability orcapacity
Reduced risk
Cost/Benefit Analysis
Decision Criteria:
Risk Reduction Leverage (RRL) > 1.15
Risk Exposure after risk reduction (REafter ) < $50K
(REbefore - REafter )
Risk Reduction CostRisk Reduction Leverage (RRL) =
Risk # Prob(UO) before Loss (UO) before RE before
143 25% $300K $75K
Alternative Prob(UO) after Loss(UO) after RE after Cost RRL
1 5% $300K $15K $65K 0.9
2 25% $160K $40K $25K 1.4
3 20% $300K $60K $2K 7.5
EvaluateAnalyze & Prioritize Choices
Measurements are used to rank itemsby priority. We have already had two examples:
Prioritizing problem reportresolution by age
Prioritizing theselection of riskreduction activitiesby RRL
Evaluate
UrgentHighMedium
Problem Report Age
0
2
4
6
8
10
12
14
16
0-4 5-9 10-14 15-19 20-24 25-30 >= 30
Age in Days Since Opened
# o f N o n - C l o s e d
P r o b l e m R e p o r t s
Risk # Prob(UO) before Loss (UO) before RE before
143 25% $300K $75K
Alternative Prob(UO) after Loss(UO) after RE after Cost RRL
1 5% $300K $15K $65K 0.9
2 25% $160K $40K $25K 1.4
3 20% $300K $60K $2K 7.5
8/11/2019 Are We Doing Well Slides
http://slidepdf.com/reader/full/are-we-doing-well-slides 7/10Copyright © 1999-2003 The Westfall Team. All Rights Reserved.
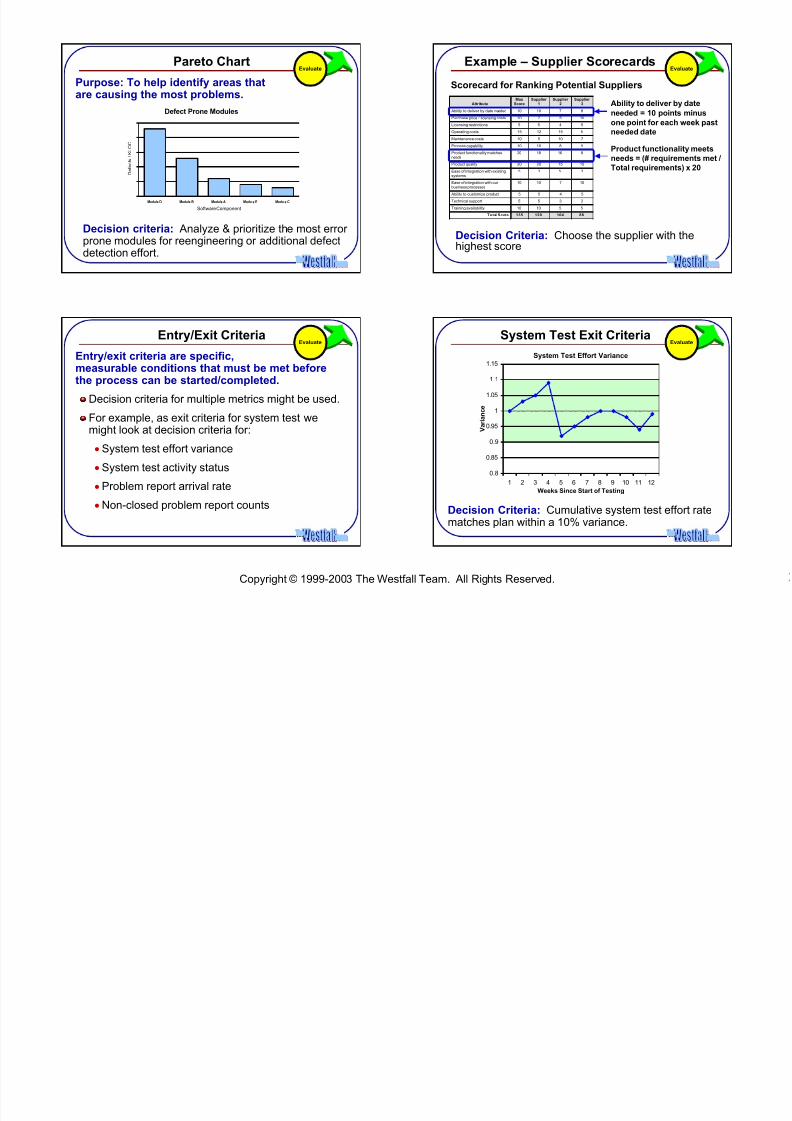
Pareto Chart
Purpose: To help identify areas thatare causing the most problems.
Defect Prone Modules
Module D Module B Module A Module E Module C
Software Component
D e f e c t s / K L O C
Evaluate
Decision criteria: Analyze & prioritize the most errorprone modules for reengineering or additional defectdetection effort.
Example – Supplier ScorecardsEvaluate
Ability to deliver by dateneeded = 10 points minus
one point for each week pastneeded date
Product functionality meets
needs = (# requirements met /
Total requirements) x 20
Attribute
Max
Score
Supplier
1
Supplier
2
Supplier
3
Ability to deliver by date needed 10 10 7 8
Purchase price / licensing costs 10 7 5 10
Licensing restrictions 5 5 4 5
Operating costs 15 12 15 5
Maintenance costs 10 5 10 7
Process capability 10 10 8 5
Product functionality matchesneeds
20 18 16 8
Product quality 20 20 15 15
Ease of integration with existingsystems
5 3 5 3
Ease of integration with ourbusiness processes
10 10 7 10
Ability to customize product 5 5 4 5
Technical support 5 5 3 2
Training availability 10 10 5 5
Total Score 135 120 104 88
Scorecard for Ranking Potential Suppliers
Decision Criteria: Choose the supplier with thehighest score
Entry/Exit Criteria
Entry/exit criteria are specific,measurable conditions that must be met beforethe process can be started/completed.
Decision criteria for multiple metrics might be used.
For example, as exit criteria for system test wemight look at decision criteria for:
• System test effort variance
• System test activity status
• Problem report arrival rate
• Non-closed problem report counts
EvaluateSystem Test Exit Criteria
Decision Criteria: Cumulative system test effort ratematches plan within a 10% variance.
Evaluate
System Test Effort Variance
0.8
0.85
0.9
0.95
1
1.05
1.1
1.15
1 2 3 4 5 6 7 8 9 10 11 12
Weeks Since Start of Testing
V a r i a n
c e
8/11/2019 Are We Doing Well Slides
http://slidepdf.com/reader/full/are-we-doing-well-slides 8/10Copyright © 1999-2003 The Westfall Team. All Rights Reserved.
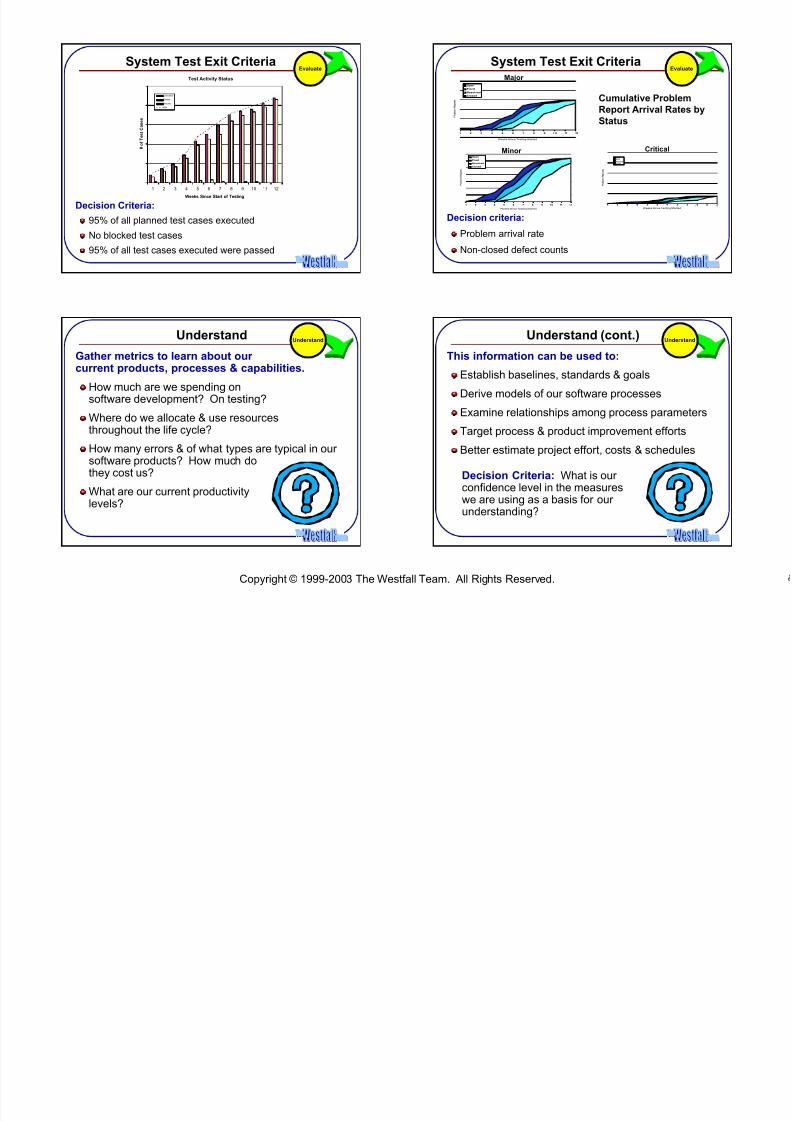
System Test Exit Criteria
Decision Criteria:95% of all planned test cases executed
No blocked test cases
95% of all test cases executed were passed
Test Activity Status
1 2 3 4 5 6 7 8 9 10 11 12
Weeks Since Start of Testing
# o f T e s t C a s e s
Executed
Passed
BlockedPlan
EvaluateSystem Test Exit Criteria
Decision criteria:
Problem arrival rate
Non-closed defect counts
1 2 3 4 5 6 7 8 9 1 0 1 1 1 2
Weeks Since Testing Started
P r o b l e m R e p o r t s
Open
Fixed
Resolved
Closed
Evaluate
1 2 3 4 5 6 7 8 9 1 0 11 12
Weeks Since Testing Started
P r o b l e m R e p o r t s
Open
Fixed
Resolved
Closed
1 2 3 4 5 6 7 8 9 10 11 12
Weeks Since Testing Started
P r o b l e m R e p o r t s
Open
Fixed
Resolved
Closed
Major
Minor Critical
Cumulative Problem
Report Arrival Rates by
Status
Understand
Gather metrics to learn about ourcurrent products, processes & capabilities.
How much are we spending onsoftware development? On testing?
Where do we allocate & use resourcesthroughout the life cycle?
How many errors & of what types are typical in oursoftware products? How much dothey cost us?
What are our current productivitylevels?
UnderstandUnderstand (cont.)
This information can be used to:
Establish baselines, standards & goals
Derive models of our software processes
Examine relationships among process parametersTarget process & product improvement efforts
Better estimate project effort, costs & schedules
Understand
Decision Criteria: What is ourconfidence level in the measureswe are using as a basis for ourunderstanding?
8/11/2019 Are We Doing Well Slides
http://slidepdf.com/reader/full/are-we-doing-well-slides 9/10Copyright © 1999-2003 The Westfall Team. All Rights Reserved.
Predict
Use metrics to estimate future values.
How much will it cost? (Budget)How long will it take? (Schedule)
How much effort will it take? (Staffing)
What other resources will it take?(Resources)
What is the probability that something will gowrong? And what will it cost if it does? (Risk)
How many errors will it have? (Quality)How will those errors impact operations?(Reliability)
PredictDecision Criteria
Decision criteria are the “thresholds, targets, orpatterns used to determine the need for actionor further investigation, or to describe thelevel of confidence in a given result”
PredictUnderstand
Decisioncriteria for
Understand &
Predict typemetrics
Confidence Level
Considerations when determining our confidencelevel in a given result include:
How complete is the data used?
Is the data used subjective or objective?
What is the integrity and accuracy of the data?
How stable is the product, process or service beingmeasured?
What is the variation within the data set?
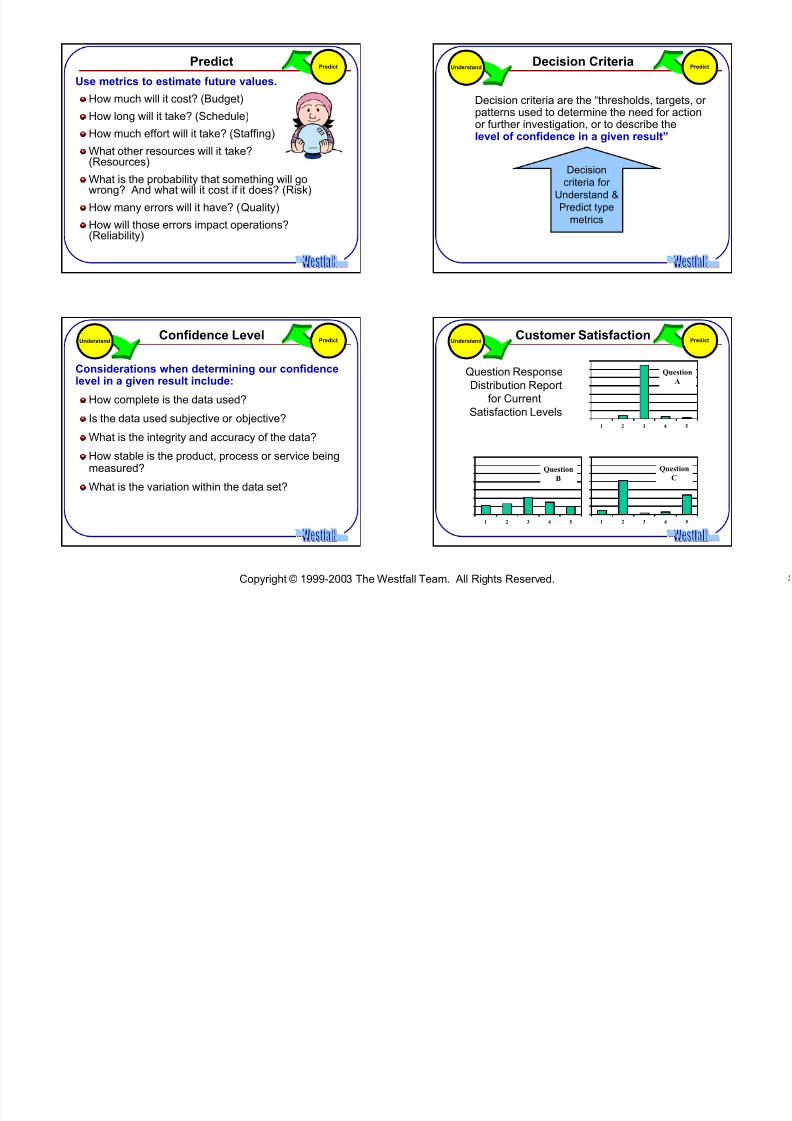
PredictUnderstandCustomer Satisfaction
1 2 3 4 5
1 2 3 4 51 2 3 4 5
Question
A
Question
B
Question
C
Question ResponseDistribution Report
for Current
Satisfaction Levels
PredictUnderstand
8/11/2019 Are We Doing Well Slides
http://slidepdf.com/reader/full/are-we-doing-well-slides 10/10Copyright © 1999-2003 The Westfall Team. All Rights Reserved.
Conclusions
I believe that having clearly defined & appropriatedecision criteria is important in ensuring that our
measurement indicators are correctly interpreted& applied.
ISO/IEC 15939 provides decision criteria definition& examples but little guidance to help us establishthem for our metrics
This papers is a starting point
More discussion & definition is needed
Questions?
Contact Information
Linda Westfall
3000 Custer Road
Suite 270, PMB 383
Plano, TX 75075-4499
phone: (972) 867-1172
fax: (972) 943-1484
www.westfallteam.com