are the meal benefits for employees in india 2012 keeping...
TRANSCRIPT

Meal benefit needs to be revised immediately to match the
increase in food prices. Salaries earned have also
increased, but meal benefits for Indian employees have
not changed in the last 10 years. Government should treat
meal benefit limits as a priority reform.
KARTHIK SHEKHAR
UNITES PROFESSIONALS, INDIA
2012
Are the Meal Benefits for Employees in India
keeping up with the rising Food Prices?
GENERAL SECRETARY
Meal Benefits for Employees in India Stagnates at 2001 Levels

· The income tax exemption limit for meals to employees was fixed in 2001 and has not been revised since then despite over 100% increase in food prices;
· Due to the limits being stagnant, employers have not increased their spending on the meals as a result of which the overall quality of meals to employees have suffered;
· During the period when Fringe Benefits Tax (FBT) was applicable, the limits were removed in case of meals provided by the employer directly or through meal vouchers. A limit of Rs.100 per meal was prescribed in case of electronic meal cards. After abolition of FBT, the old provisions was reinstated but with the old limits;
· To ensure that the quality of nutrition is preserved and to encourage employers to spend more on employee meals, the limits should be enhanced by atleast 100%
Key Representations:
2 2

Meal provisions for employees and workers have been in place since the late 90's. The CBDT circular No. 15/2001 [F.No.275/192/2001-IT(B)] of 2001 describes Free Meals as a staff welfare measure. The provision being:
“Free Meals: The provision of free meals varies widely from uniform canteen food, coupons etc to lavish hotel meals. The scheme of free meals as a staff welfare had been recognized and was admissible upto Rs 35 (mandated in 1997) for each meal. The new rule does not treat as perquisite free meals if the cost per meal does not exceed Rs 50/.”
The Government has thus recognised the need for healthy meals for the employee welfare and accordingly set a limit within which an employee could be provided meal support without any tax being imposed as a perquisite.
1AThere are a number of studies which have been done by ILO , which clearly establish a relationship between good working conditions and welfare support for the worker and worker productivity. Meals for employees and workers figure high among welfare measures and in making a contribution towards enhanced productivity in any organisation.But somewhere in the interim years the Government has lost sight of the need to suitably revise the limit set looking at the price levels in the market in the year in question.
The current meal provisions for 1Employees in India state that value of free food and non-alcoholic
beverages or meal vouchers provided by the employer is exempt from income tax to the extent of Rs 50 per meal. The tax
Meal provisions for Employees in India:
Are the Meal Benefits for Employees in India keeping up with the rising Food Prices?
3

exemption is calculated on a per-meal basis.
This Limit of Rs 50/- per meal per day was decided in 2001 when the limit was increased from Rs 35/- per day to Rs 50/ per meal.
In most parts of the World, the meal benefit limit is adjusted every 2 or 3 years to Consumer Price Index (CPI) Inflation basket but surprisingly, in India, this has not been the case. Keeping in mind that the original limit of Rs 50/- per meal was set over 10 years ago and that there has been a significant increase in food prices over the past 10 years; the limit should be revised. Clear evidence can be obtained from the CPI and Commodity Food Price Index.
India uses the Wholesale Price Index (WPI) to calculate and then decide the rate of 2
inflation in the economy . Since, Food articles have only 14% weight in the WPI, it is 3
advisable to look at the CPI , to get a better picture of the situation. CPI assigns 50% 4
weightage to Food, beverages and tobacco in the index . According to the report published by the Labour Bureau, Government of India, the CPI with base year 2001, was at 199 in November, 2011. It is evident from index figures that the food prices have doubled in the last 10 years. Even if we consider the Commodity Food Price Index, it gives similar results. It includes Cereal, Vegetable Oils, Meat, Seafood, Sugar, Bananas, and Oranges Price Indices. Considering 2005 as the base year, from January 2002 to January 2012, there has been an increase of 85.530 (which
5 means an increase of 109.50 %) in the food prices (Annexure III). 6According to salary data gathered by Paycheck India website , if we calculate the
7percentage of meal benefits as a percentage of average annual salary , it is observed that this percentage is constantly decreasing over the years. It was around 6.33% in 2006 and has reduced to only 2.39% in 2011 (Annexure IV). The
2 4

scene is no different in Information and Communication Industry, where this percentage was only 2.63% in 2006 and reduced to 1.69% in 2011 (Annexure V). Thus, it is quite evident that the proportion of meal expense on average annual salary is constantly decreasing over a period. The reason for that evidently is that, absent any increase in the exemption limit, the companies have seen no reason to increase the value of the meal benefit, especially as it involves calculating perquisite value for each employee for tax purposes, which can become cumbersome. That shows a tangible linkage between the exemption limit and the quantum of benefit as part of the pay package.
A survey of basic food outlets commonly frequented by average employees in various cities shows a significant change in prices for similar meals from 2001 to 2012. This brings out the major gap in the defined limit. The items listed here are not to showcase a meal price, but the way the prices for food items have moved between 2001 to 2012. A meal for an employee would compromise of a combination of these dishes on different days.
1Para (iii) of sub-rule 7 of Rule 3: The value of free meals provided by the employer to an employee shall be the amount of expenditure incurred by the employer. The amount so determined shall be reduced by the amount, if any paid or recovered from the employee for such benefit or amenity.Provided that nothing contained in this sub-rules apply to free meals provided by the employer during office hours or business premises or through paid vouchers which are not transferable and usable only at eating joints if the value thereof in each case is upto ̀ 50/- per meal or to tea or snacks provided during office hours or to free meals during working hours provided in a remote area or an offshore installation.1A Food at Work by Christopher Wanjek, ISBN 92-2-117015-2: ILO 2 In India, price data for 435 commodities is tracked. The main problem with WPI calculation is that more than 100 out of the 435 commodities included in the Index have ceased to be important from the consumption point of view. 3 CPI is a statistical time-series measure of a weighted average of prices of a specified set of goods and services purchased by consumers. It is a price index that tracks the prices of a specified basket of consumer goods and services, providing a measure of inflation.
4 http://labourbureau.nic.in/indnum.htm5 http://www.indexmundi.com/commodities/?commodity=food-price-index&months=1206 www.paycheck.in 7To calculate the percentage of meal benefit as a percentage of average annual salary,
meal benefit per meal (`50) x working days in a month (22) x 12 months = ` 13,200, is
used.
5

Domino's - Pizza Ahmedabad 49 100 204%
Pakwan Dinning Hall - Thali Meal Ahmedabad 60 170 283%
Sankalp - Masala Dosa / Idly Vada Ahmedabad 35 95 271%
Chana puri @ Havmor Restaurant -
Chole Bhature
Ahmedabad
35
90
257%
Domino's -
Medium Size
Pizza
Bangalore
65
274
422%
75
342
456%
Shanthi Sagar -
North Indian Thali
Bangalore
34
75
221%
Nandhini South Indian Mini Meals
Bangalore
45
100
222%
Empire -
Non-Veg Thali
Bangalore
-
-
60
134
223%
KFC (Hyson Restaurant) -
Burger
Chennai
85
95
Domino's -
Regular Pizza
Chennai
70
131
187%
Palimar -
South Indian Meal
Chennai
23
77
335%
Anjappar -
Chiken Biryani
Chennai
65
128
197%
Anjappar -
Mutton Biryani
Chennai
70
135
193%
Hotel Saravana Bhavan -
South Indian Meal
Chennai
45
75
167%
Domino's -
Regular Pizza
Delhi
95
137
144%
Bikanervala -
Chole Bhatura
Delhi
38
72
189%
Haldiram -
Thali
Delhi
60
209
348%
Navaidhyam -
Thali
Delhi
53
142
268%
Nirula,s -
Thali
Delhi
68
173
254%
Outlet Name City / Location
VEG % Change
over 2001
NON VEG % Change
over 20012001 2012 2001 2012
2
SURVEY OF FOOD OUTLETS
6

Dominos -Regular Pizza Hyderabad 142 210 148%
Hotel Malligi , Hospet - South Indian Thali Hyderabad 75
Taj Tristar -
Thali
Hyderabad
65
145
223%
Ohris Food Court @Prasad -
Chole Bhature
Hyderabad
125
Mineva Coffe Shop -
South Indian Thali
Hyderabad
65
135
208%
Hotel Central court -
Thali
Hyderabad
84
131
156%
Kamat Restaurant -
Thali
Hyderabad
42
74
176%
Subway -
Regular Sub
Hyderabad
85
Bread World -
Chicken Burger
Kochi
40
70
175%
Domino's -
Regular Pizza
Kochi
45
115
256%
Anugraha -
Thali Meal
Kochi
60
90
150%
Bharat Hotel (BTH) -
Thali Meal
Kochi
50
100
200%
Geethanjali -
Masala Dosa
Thiruvananthapuram
18
27
150%
Diyabati -
Rajasthani Veg Thali
Kolkata
36
66
183%
Arsenal -
Chicken Biriyani/Mutton Biriyani
Kolkata
80
105
131%
Rajdhani Thali -
Thali
Mumbai -
Lower Parel
190
289
152%
Kailash Prabhat -
Chole Bhature
Mumbai -
Lower Parel
45
75
167%
Navratna Restaurant -
Thali
Navi Mumbai -
Vashi
75
130
173%
Ambica Thane -
Dombivali 45
100
222%
Source: Food Outlet Survey
7

Conclusion :
Thus, it may be concluded that the meal benefit needs to be revised immediately to match the increase in food prices. Market prices of a basic meal have increased by over 100%, but meal benefits for Indian employees have not changed in the last 10 years. Government should treat meal benefit limits as a priority reform. The meal limit prescribed should also be linked to the Dearness Allowance or another suitable inflation indicator so that automatic adjustment to the limit happens without the need for any yearly intervention unless the gap widens widely.
Considering that the original limit was set over 10 years ago and there has been an increase of 109.50% in food prices in the past 10 years; the limit should be revised to a minimum of Rs.125 per meal from April 2012.
2 8

Annexure I: The Evolution of the Tax law on Meal Provisions for Employees in
Ph
as
eY
ea
rD
es
cri
pti
on
Tax
ab
ilit
y o
n E
mp
loy
ee
Taxa
bili
ty o
n E
mp
loye
r
Phas
e I
1997
to
2001
mea
l val
uatio
n fo
r
empl
oyee
s on
mea
ls in
side
and
outs
ide
offic
e on
wor
king
day
s
Ta
x Fr
ee u
p to
Rs
35 p
er d
ayFu
lly d
educ
tible
as
an
expe
nse.
How
ever
, no
fisca
l adv
anta
ge fo
r the
com
pany
to s
uppo
rt
empl
oyee
mea
l ben
efit
Phas
e II
2001
to
2005
Firs
t Val
uatio
n of
Perq
uisi
tes
Tax
Free
upt
o R
s 50
per
mea
l
Fully
ded
uctib
le a
s an
expe
nse.
How
ever
, no
fisca
l adv
anta
ge fo
r the
com
pany
to s
uppo
rt
empl
oyee
mea
l ben
efit
Phas
e III
2005
to
2009
Frin
ge B
enef
it Ta
x
Tax
Free
with
no
limits
def
ined
. In
2009
a p
rovi
sion
for e
lect
roni
c m
eal
card
pre
scrib
ed li
mits
of R
s 10
0/ p
er
day,
and
that
bec
ame
a de
fact
o
stan
dard
for m
eal l
imit
Fully
ded
uctib
le e
xpen
se
and
exem
ptio
n fro
m p
ayin
g
FBT.
How
ever
, no
fisca
l
adva
ntag
e fo
r the
com
pany
to s
uppo
rt em
ploy
ee m
eal
bene
fit
Phas
e IV
2009
to
2011
Seco
nd V
alua
tion
of
Perq
uisi
tes
Tax
Free
up
to R
s 50
per
mea
l
Fully
ded
uctib
le a
s an
expe
nse.
How
ever
, no
fisca
l adv
anta
ge fo
r the
com
pany
to s
uppo
rt
empl
oyee
mea
l ben
efit
9
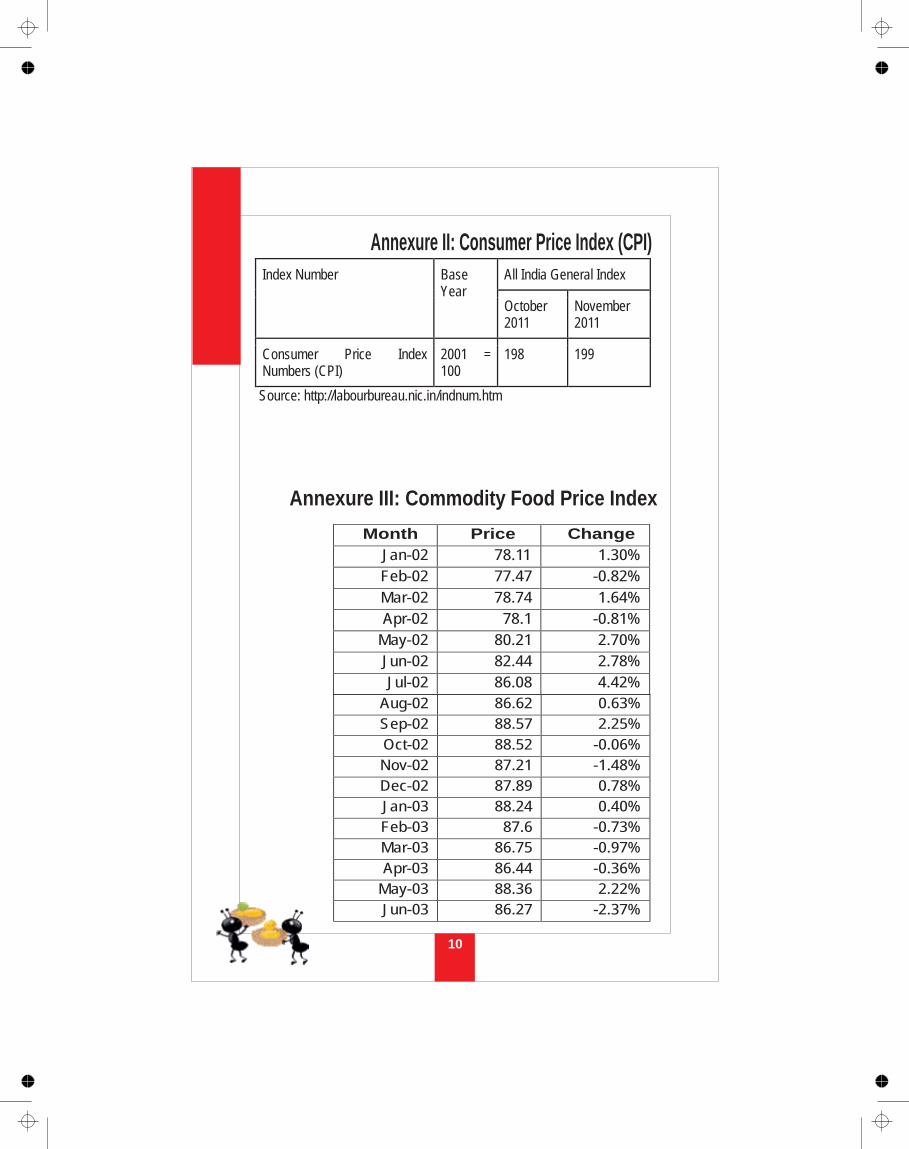
Annexure II: Consumer Price Index (CPI)
Index Number Base Year
All India General Index
October 2011
November 2011
Consumer Price Index Numbers (CPI)
2001 = 100
198 199
Source: http://labourbureau.nic.in/indnum.htm
Annexure III: Commodity Food Price Index
Month Price Change
Jan-02 78.11 1.30%
Feb-02
77.47
-0.82%
Mar-02
78.74
1.64%
Apr-02
78.1
-0.81%
May-02
80.21
2.70%
Jun-02
82.44
2.78%
Jul-02
86.08
4.42%
Aug-02 86.62 0.63%
Sep-02 88.57 2.25%
Oct-02 88.52 -0.06%
Nov-02 87.21 -1.48%
Dec-02 87.89 0.78%
Jan-03 88.24 0.40%
Feb-03 87.6 -0.73%
Mar-03 86.75 -0.97%
Apr-03 86.44 -0.36%
May-03 88.36 2.22%
Jun-03 86.27 -2.37%
2 10

Jul-03 83.41 -3.32%
Aug-03 84.53 1.34%
Sep-03 88.23 4.38%
Oct-03 92.96 5.36%
Nov-03 94.75 1.93%
Dec-03 95.12 0.39%
Jan-04 98.74 3.81%
Feb-04 101.71 3.01%
Mar-04 107.49 5.68%
Apr-04 109.09 1.49%
May-04 109.52 0.39%
Jun-04 105.56 -3.62%
Jul-04 102.6 -2.80%
Aug-04 98.1 -4.39%
Sep-04 96.15 -1.99%
Oct-04 93.3 -2.96%
Nov-04 93.9 0.64%
Dec-04 95.23 1.42%
Jan-05 95.58 0.37%
Feb-05 98.79 3.36%
Mar-05 103.17 4.43%
Apr-05 100.48 -2.61%
May-05 100.91 0.43%
Jun-05 100.96 0.05%
Jul-05 101.43 0.47%
Aug-05 100.09 -1.32%
Sep-05 100.03 -0.06%
Oct-05 100.35 0.32%
Nov-05 97.8 -2.54%
Dec-05 100.42 2.68%
Jan-06 101.37 0.95%
Feb-06 104.35 2.94%
Mar-06 105.56 1.16%
Apr-06 108.05 2.36%
11

May-06
115.1
6.52%
Jun-06
115.82
0.63%
Jul-06
114.84
-0.85%
Aug-06
112.6
-1.95%
Sep-06
108.37
-3.76%
Oct-06
110.8
2.24%
Nov-06
114.25
3.11%
Dec-06
114.84
0.52%
Jan-07
115.05
0.18%
Feb-07
118.99
3.42%
Mar-07
118.77
-0.18%
Apr-07
118.3
-0.40%
May-07
119.54
1.05%
Jun-07
124.62
4.25%
Jul-07
126.26
1.32%
Aug-07
128.65
1.89%
Sep-07
135.05
4.97%
Oct-07
137.23
1.61%
Nov-07
139.3
1.51%
Dec-07
145.97
4.79%
Jan-08
153.02
4.83%
Feb-08
165.52
8.17%
Mar-08
172.53
4.24%
Apr-08
171.57
-0.56%
May-08
173.17
0.93%
Jun-08
179.71
3.78%
Jul-08
178.29
-0.79%
Aug-08
164.85
-7.54%
Sep-08
153.98
-6.59%
Oct-08 129.83 -15.68%
2 12

Nov-08
122.41
-5.72% Dec-08
119.6
-2.30%
Jan-09
127.89
6.93%
Feb-09
124.61
-2.56%
Mar-09 125.85 1.00% Apr-09 131.88 4.79%
May-09 141.87 7.58%
Jun-09
143.18
0.92%
Jul-09
137.11
-4.24%
Aug-09
135.4
-1.25%
Sep-09
131.21
-3.09%
Oct-09
132.35
0.87%
Nov-09
137.12
3.60%
Dec-09
139.52
1.75%
Jan-10
138.74
-0.56%
Feb-10
138.12
-0.45%
Mar-10
139.24
0.81%
Apr-10
143.07
2.75%
May-10
140.65
-1.69%
Jun-10
136.49
-2.96%
Jul-10
143.88
5.41%
Aug-10
151.36
5.20%
Sep-10
156.14
3.16%
Oct-10
163.18
4.51%
Nov-10
164.96
1.09%
Dec-10
176.43
6.95%
Jan-11
183.16
3.81%
Feb-11
189.34
3.37%
Mar-11
184.34
-2.64%
Apr-11
190.88
3.55%
May-11 187.01 -2.03%
13

Jun-11
181.62
-2.88% Jul-11
180.3
-0.73% Aug-11
181.74
0.80%
Sep-11
175.3
-3.54%
Oct-11
165.52
-5.58%
Nov-11 164.18 -0.81% Dec-11 161.55 -1.60%
Jan-12 163.64 1.29%
Source: http://www.indexmundi.com/commodities/?commodity=food-price-index&months=120
Annexure IV: Average Annual Salary and Percentage of Meal Coupon Benefit of Annual Salary
Year
Annual salary Median
Percentage of Meal coupon benefit of annual salary
2006
208492.38 6.33
2007
517598.14
2.55 2008
620337.12
2.12 2009
504387.94
2.61 2010
516451.23
2.55 2011
550539.48
2.39
Source: www.paycheck.in
Annexure V: Average Annual Salary of Information and Communication
Industry and Percentage of Meal Benefit of Annual Salary
Year
Average Annual Salary -
Median
2006
2007
2008
2009
2010 2011Information and Communication Industry
501385.75
366546.59
792609.79
691732.20
755541.20 780600.54
Percentage of Meal benefit of annual salary 2.63 3.60 1.66 1.90 1.74 1.69
2
Source: www.paycheck.in
14

15
www.myfullmeal.org

Karthik [email protected]
9341210784www.unitespro.org
Desig
n: H
imm
at S
ingh
(hm
tsin
gh@
gmai
l.com
), Pr
inte
r: 4t
h Di
men
sion,
New
Del
hi-7
4. www.myfullmeal.org