are publicly reported quality measures aligned with
TRANSCRIPT

Summer 2015
Journal of Health Care Finance www.HealthFinanceJournal.com
Are Publicly Reported Quality Measures Aligned with Nursing Home Prices?
Jan P. Clement, Ph.D. Professor
Department of Health Administration Virginia Commonwealth University
Jaya Khushalani, MHA PhD Student
Department of Health Administration Virginia Commonwealth University

2
Are Publicly Reported Quality Measures Aligned with Nursing Home Prices?
Abstract
Public quality reports have become widespread in the US. A largely unexplored area concerning how health care providers react is whether quality information may influence their prices. Using the publicly available Centers for Medicare and Medicaid Services Nursing Home Compare five star quality ratings and the self-pay per diem price for a semi-private room, we evaluate whether publicly available quality ratings are related to prices in Virginia nursing homes. Data for self-pay semi-private nursing home rooms posted on the Virginia Health Information web site for the 2011 fiscal year were merged with Nursing Home Compare quality data as well as market and organizational data. Cross-sectional multiple regression models were estimated using the overall five star quality rating and separately for each of the three components of the overall rating. The results show that the overall quality rating is not significantly related to the price. One of the three components of the overall rating, quality measures, has a significantly higher price for higher than lower quality. Thus, our results indicate that nursing homes in Virginia were not using higher NHC ratings to charge higher prices to their self-pay residents during the study period. Frail elderly residents of these nursing homes, who face a large financial burden for care, paid similar prices for nursing homes with high and low quality of care ratings on Nursing Home Compare.
3
Are Publicly Reported Quality Measures Aligned with Nursing Home Prices?
Introduction
Public reports of quality information for health care providers are now widely available after having expanded rapidly over the past decade.1 One of the earlier established public reporting websites is the Centers for Medicare and Medicaid Services (CMS) Nursing Home Compare (NHC) website for Medicare and Medicaid certified nursing homes (http://www.medicare.gov/nursinghomecompare). In late 1998, NHC began providing information on inspection deficiencies. In November of 2002, CMS introduced six long-term and four post-acute care quality measures to the site. The set of measures expanded and changed and, in 2009, the site began posting an overall five star rating as well. 2
Since the primary goals of public quality reporting are to encourage providers to
improve quality to enable consumers to select high quality providers, empirical research on NHC has focused on these topics. 3-7 There is much less research on other potential effects of the quality information presented on NHC.
Among the topics not addressed is how NHC quality information may influence the
pricing structure of nursing homes (NHs) for their self-pay long-term care residents. While nursing homes in the US face regulated prices for beneficiaries of government programs (Medicare for post-acute care and Medicaid for long-term care), they have flexibility in setting prices for their long-term care self-pay residents.
The pricing flexibility of self-pay prices is important to the finances of nursing homes.
Medicaid is the largest payer for long-term care services delivered in nursing homes but payments for Medicaid residents for a day of care are usually the lowest of all payer groups. In fact, many nursing homes complain they do not cover the cost of care. 8 There is also substantial self-pay volume in NHs--33 percent of nursing home care expenditures in 2005. 9 NH prices are also important to self-pay residents and their families because the financial burden for long-term nursing home care is large. The median per diem rate for a semi-private room in 2014 in the US was $212, or $77,380 per year. 10
Park et al.6 note that nursing homes may respond to NHC quality information by setting
higher prices for higher quality ratings and vice versa. How nursing homes set prices for long-term care nursing home services is also interesting because, unlike most health care services, the price information is transparent; list prices are available to potential self-pay residents or their caregivers from a telephone call or meeting with an admissions staff member. There is very little commercial long-term care insurance with only about 8% of the US population having

4
coverage.11 Consequently, the market penetration of LTC insurers is too low to negotiate prices or select providers as insurers do for other health care services. This means that the list price is the relevant payment for self-pay residents and they do not need to sort through discounted rates, deductibles, copayments and coinsurance to determine what they will pay for long-term care. Further, the majority of the long-term care services to be used are bundled into a per diem price paid to the NH, not to a variety of different providers.
Using the publicly available NHC five star quality ratings and the self-pay per diem price
for a semi-private room, we evaluate whether publicly available quality ratings are related to prices in nursing homes. The evaluation model also includes the important role of market forces such as competition and nursing home organizational characteristics.
Previous Research
The literature is largely silent on the topic of how quality is related to the price paid by self-pay long-term care nursing home residents. In research prior to the implementation of quality transparency in NHC, Ballou12 found little evidence of a relationship between quality and private pay price or mark-up in Wisconsin nursing homes from 1984-1995. 12 In a descriptive analysis, Clement et al.13 found that average self-pay per diem prices were higher for Wisconsin nursing homes in the early 2000s for higher ratings on a composite quality indicator the authors constructed. They also found than NHs with low quality before the release of the Centers for Medicare and Medicaid Services Nursing Home Compare (NHC) quality indicators in 2002 raised prices in the following year but mid- and high quality NHs did not. Thus, NHs did not act to align price and quality as quality information became more transparent. However, the Clement et al. study examined data from 2001 through 2003 meaning that only one year of data was available after the publicly reported quality measures became widely available in 2002.13
Conceptual Framework
“Pricing questions are perhaps the most vexing decisions facing an executive.” 14 Indeed, there are many potential pricing strategies from which managers may choose. To inform our analysis, we draw upon research shows that managers consider the willingness of potential consumers to pay for unique characteristics of their services in making pricing decisions as well as market forces and organizational cost characteristics. 14-16
As noted by Porter,17 a key characteristic of a service is its quality. If NHs perceive that
residents are willing to pay more for higher quality, they may apply a product differentiation strategy and charge higher prices if they have higher publicly reported quality ratings.16, 17 Research has shown that quality is one important characteristic of long-term nursing home

5
services that potential NH residents prefer.18, 19 In other industries, higher quality products or services have been associated with consumer willingness to pay more. 20
It is possible, as Porter assumes, that higher quality NHs set prices higher to cover higher
costs. Firms pursuing Porter’s cost leadership (low price) strategy keep their costs low through, among other means, offering lower quality. However, there is considerable debate and mixed evidence about whether high quality of health care is more costly to produce than low quality.21, 22 Thus, even if higher quality is not more costly to produce, NHs with higher quality ratings may still take advantage of a market opportunity to set a premium price.
Although NHs may believe their potential residents are willing to pay for higher quality,
NH pricing decisions are constrained by market forces. The demand for NH care is related to the potential population of residents in the area and their ability to pay, which is particularly important given the large annual cost of this care. NHs must also consider the supply of care available from other nursing homes, which engenders competition. Two studies of nursing home23 pricing conducted before nursing home quality data were publicly available found that higher competition was associated with lower nursing home prices.23, 24 The availability of possible substitutes for nursing home care such as assisted living facilities or home health care agencies could also lead to lower NH prices.13, 23
Lastly, organizations use cost information in setting prices. Economic theory predicts
that organizations will set prices to cover marginal costs.23, 24 The marginal cost is a function of all operating and care decisions the NH makes. If higher quality is more costly to produce, NHs with higher quality would be expected to have a higher marginal cost.
Prices are set by organizations during the budgeting cycle that precedes the fiscal year.
Previous research on price setting shows that firms don’t change prices frequently leading to the expectation that the NH prices are constant for the fiscal year.25, 26
Methods Data
Data for the study are derived from publicly available sources. The study uses data for nursing homes in Virginia due to the limitations in availability of data for NH prices. Although potential residents can obtain self-pay per diem long-term care prices from individual nursing homes, they are not available in a national data base. We used price data posted on the Virginia Health Information (VHI) web site for the 2011 fiscal year. VHI was unable to provide similar data for previous or later years. Focusing the study on Virginia NHs also allowed us to include potential competition from assisted living facilities as a market force. Data are not

6
available nationally for assisted living market capacity, but, instead must be obtained from an agency in each state.
Nursing home quality data are obtained from the Centers for Medicare and Medicaid
Services Nursing Home Compare (NHC) web site. Market conditions data come from the US Department of Commerce Bureau of Economic Analysis, US Census Bureau, Virginia Department of Social Services and Long-Term Care Focus (LTCF) Project at Brown University. Data for organizational characteristics are drawn from the VHI and LTCF data. Available on the LTCFocUS.org web site through 2010, the LTCF data are compiled using a variety of primary and secondary sources, including the Minimum Data Set (MDS) and Online Survey Certification and Reporting System (OSCAR) from the Centers for Medicare and Medicaid Services. The MDS is a tool to assess the physical, psychological and psychosocial functioning status for all residents in Medicare and/or Medicaid-certified long-term care facilities. The OSCAR data show regulatory compliance, operational characteristics and aggregate patient characteristics for each facility.
Variables Definitions and sources for the study variables are shown in Table 1. The dependent
variable is nursing home price for a semi-private room, the most common room type in a NH. The per diem price is the largest as well as most visible and predictable cost. Consequently, it is most likely to be the focus of potential residents. The variable is transformed by its natural logarithm to ensure a distribution close to normal.
The key explanatory variable is nursing home quality. The CMS Nursing Home Compare
five star rating system for NHs participating in the Medicare and Medicaid programs is designed to “provide residents and their families with an easy way to understand assessment of nursing. home quality, making meaningful distinctions between high and low performing nursing homes.”2 The ratings are easily accessible from the NHC web site and range from a low of 1 to a high of 5 (best quality). The overall NH quality rating is constructed using three separate five star ratings for health inspection (survey), staffing and quality measure domains.27 As an overall performance indicator, this summary measure is most likely to be incorporated in pricing decisions. However, we also examine each of the components in separate models.
We average the monthly five star ratings for NHs with available ratings for at least six
months of the calendar year for the overall five star rating as well as for each of its components. We, then, create a series of binary variables to represent performance quartiles. The lowest quality quartile is the reference group in our analytical models. We use ratings for 2010 because these would have been available to NHs during their budget preparation period for 2011.

7
Table 1. Variables and descriptive statistics
Variables
Mean or N
Standard Deviation or %
Source
Dependent Variable
Self-Pay per diem semi-private room price 198.93 41.38 VHI1
Explanatory Variables
Quality (2010)
Nursing Home Compare 5 star overall rating 2.60 1.19 NHC2
Nursing Home Compare 5 star survey rating 2.61 1.15 NHC
Nursing Home Compare 5 star quality measures rating 3.28 1.02 NHC
Nursing Home Compare 5 star staffing rating 2.38 1.11 NHC
Market Characteristics3 2010
% population age 65 years or older 14.55 4.06 US Census4
Per capita income/ 1,000 38.22 11.16 BEA5
Nursing home competition (Herfindahl index-beds) 0.40 0.29 LTCF6
# home health agencies (HHA) per 1,000 persons age 65 + LTCF
Low tercile (Omitted) 76 36%
Medium tercile 71 34%
High tercile 63 30%
Assisted living facility (ALF) beds/1,000 population 65 + 30.90 18.51 VA DSS,7 US Census
% female population 50.96 1.76 US Census
Organizational Characteristics
Medicaid payment rate per day 2011 153.88 22.58 VHI
Has Alzheimer’s specialty unit (0/1) 2010 28 13% LTCF
% Medicare residents 2010 18.44 11.53 LTCF
Total beds 2011 121.89 55.67 VHI
Chain member (0/1) 2011 160 76% VHI
For-profit owned (0/1) 2011 168 80% VHI
Occupancy 2010 89.53 7.12 LTCF
% non-Medicare or Medicaid residents 2010 19.02 12.80 LTCF
Number of observations 210 1 VHI is Virginia Health Information. 2 Centers for Medicare and Medicaid Services Nursing Home Compare web site (http://www.medicare.gov/nursinghomecompare) 3Variables measured for market of nursing home. Market is county or city/county combination as defined by the US Bureau of Economic Analysis. 4 US Census Bureau. 5 US Bureau of Economic Analysis. 6Shaping Long Term Care in America Project at Brown University funded in part by the National Institute on Aging (1P01AG027296). http://www.ltcfocus.org/. 7Virginia Department of Social Services for numerator.

8
Market characteristics reflect socio-demographic characteristics related to demand and competition that NHs face. Similar to most research on NHs, we use the county as the market area similar to most research on nursing homes. 28 However, in Virginia, because cities are not included in counties, no matter how small they are, we follow the US Bureau of Economic Analysis practice of combining small independent cities into their surrounding counties.29 Nursing homes in the study are located in one of 91 markets.
We include percent population over age 65 and per capita income as measures of
demand for care. More demand is expected to increase prices. Nursing home competition is measured with a nursing home Herfindahl index, which indicates nursing home market share concentration of beds.28 It is defined as the sum of the squares of the market share of nursing home beds. A value of one indicates that there is no market competition, that is, there is one nursing home in the market. Lower values indicate higher competition. Home health care and assisted living facilities and may serve as alternatives to nursing home care for some elderly. Because of the non-normality, similar to Gruneir et al., we broke the number of home health agencies (HHA) per 1,000 persons aged 65 and older into terciles for estimating the model.30 We also include the number of licensed assisted living beds per 1,000 population over age 65 31 and percent female population. The role of females, who are most often the informal caregivers, is measured with the percent of the market population. Availability of alternative suppliers for care should be associated with lower prices. All market variables are measured for 2010.
Following other researchers, because marginal cost is difficult to obtain, we use the
2011 Medicaid payment rate.23, 24 It reflects the opportunity cost of treating a private pay resident. During the study period, in Virginia, this rate was prospective and cost based but it was also adjusted by the facility’s average case-mix using Medicare Resource Utilization case weights. The payments were limited by peer group ceilings but were not adjusted for quality differences.32 Thus, the Medicaid payment rate may control, at least partially, for higher costs of producing better quality if they exist.
Given that the Medicaid payment rate is limited by peer group ceilings, other variables
that may influence NH costs are also included in the analytical model. Two additional variables reflect potential service mix differences that could increase NH costs, the presence of an Alzheimer’s unit33 and the percentage of Medicare residents. Medicare residents receive skilled post-acute care. Four variables reflect potential cost lowering efficiencies. Larger NHs, members of a chain, or NHs with higher occupancy may take advantage of economies of scale. In addition, since nursing homes set self-pay prices for residents with the goal to create resources to achieve their missions, ownership may be associated with price level. For-profit NHs may be more efficient because not-for-profit or government owned NHs may set prices to generate additional resources to pursue other financial and non-financial goals such as care to the poor. Finally, because NHs with a high reliance on non-government payers may be more sensitive to setting high self-pay prices, we control for the percentage of other payers.

9
These organizational variables are measured for 2010 because we assume that NHs set
semi-private room rates during the budget planning process in the previous year. There are two exceptions. Because a small minority of NHs reported different bed size or ownership in 2011 than for 2010, and these structural elements would have been known during the planning cycle, we use the 2011 measures. However, using 2010 values did not change the results of the analysis.
Sample To obtain the final sample, we excluded specialty facilities such as training centers and
acute long-term care facilities as well as nursing homes in operation for a year or less. We also excluded hospital-based facilities from the study because they are fundamentally different from other nursing homes,28 and because they supplied no semi-private room price data. NHs that are members of continuing care retirement communities also did not supply price information. Other omissions include: one for price outlier (> $450/day); four for missing price; two for no data on percentage of other payers; one for missing five star quality ratings. The final number of nursing homes in the study is 210.
Analysis The empirical model is
P2011 = a + b1Q + b2MKT + b3ORG + e where P refers to nursing home self-pay semi-private room price, Q refers to public
reported quality, MKT refer to a vector of market variables, ORG refers to a vector of organizational variables and e is the error term. We estimated linear regression models separately for the overall, inspections survey, quality measures, and staffing average annual five star ratings using STATA Version 13. Standard errors are adjusted for clustering of nursing homes within markets.
Results
Table 1 displays the descriptive statistics for the study variables. An examination of the set of variables does not show evidence of multicollinearity. Table 2 shows the mean per diem self-pay semi-private room rate by quartiles of the overall, inspection survey, quality measure and staffing annual average five star indicators. Contrary to expectations, the semi-private room rate generally decreases with higher overall and survey quality indicator performance. The price increases very slightly with better quality measure and staffing ratings.
10
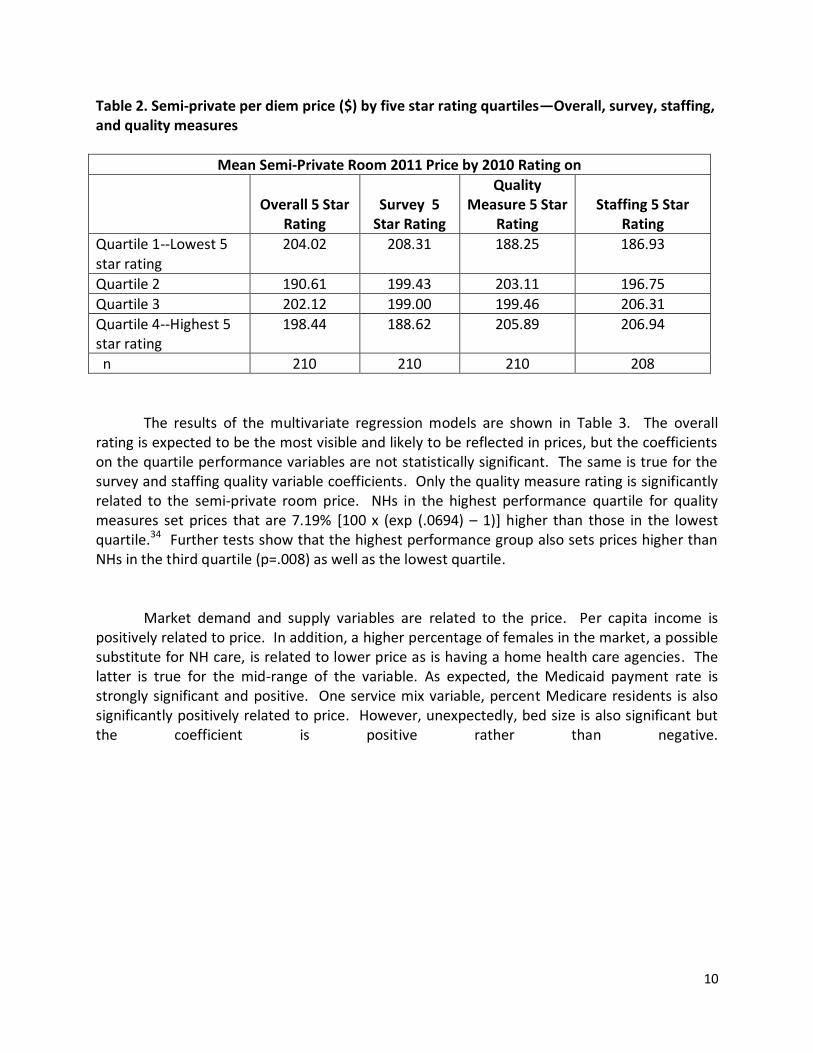
Table 2. Semi-private per diem price ($) by five star rating quartiles—Overall, survey, staffing, and quality measures
Mean Semi-Private Room 2011 Price by 2010 Rating on
Overall 5 Star
Rating
Survey 5
Star Rating
Quality Measure 5 Star
Rating
Staffing 5 Star
Rating
Quartile 1--Lowest 5 star rating
204.02
208.31 188.25 186.93
Quartile 2 190.61 199.43 203.11 196.75
Quartile 3 202.12 199.00 199.46 206.31
Quartile 4--Highest 5 star rating
198.44 188.62 205.89 206.94
n 210 210 210 208
The results of the multivariate regression models are shown in Table 3. The overall
rating is expected to be the most visible and likely to be reflected in prices, but the coefficients on the quartile performance variables are not statistically significant. The same is true for the survey and staffing quality variable coefficients. Only the quality measure rating is significantly related to the semi-private room price. NHs in the highest performance quartile for quality measures set prices that are 7.19% [100 x (exp (.0694) – 1)] higher than those in the lowest quartile.34 Further tests show that the highest performance group also sets prices higher than NHs in the third quartile (p=.008) as well as the lowest quartile.
Market demand and supply variables are related to the price. Per capita income is
positively related to price. In addition, a higher percentage of females in the market, a possible substitute for NH care, is related to lower price as is having a home health care agencies. The latter is true for the mid-range of the variable. As expected, the Medicaid payment rate is strongly significant and positive. One service mix variable, percent Medicare residents is also significantly positively related to price. However, unexpectedly, bed size is also significant but the coefficient is positive rather than negative.

11
Table 3. Regression models for price and average annual quality rating1
Quality Indicator
Dependent Variable: Natural log semi-private room price (2011)
Overall 5
Star Rating
Survey 5
Star Rating
Quality Measure 5 Star Rating
Staffing 5
Star Rating
Explanatory Variables
Quality
Nursing Home Compare 5 star best quartile
.0140 (.0335)
-.0361 (.0289)
.0694* (.0299)
.0329 (.0286)
Nursing Home Compare 5 star 2nd best quartile
-.0169 (.0318)
-.0149 (.0279)
.0234 (.0275)
.0266 (.0334)
Nursing Home Compare 5 star 3rd best quartile
-.0298 (.0328)
-.0328 (.0284)
.0006 (.0280)
-.0045 (.0268)
Market Characteristics
% 2010 population age 65 years or older
-.0048 (.0031)
-.0048 (.0031)
-.0043 (.0030)
-.0049 (.0034)
Per capita income/1,000 .0047*** (.0012)
.0047*** (.0012)
.0044*** (.0012)
.0047*** (.0013)
Nursing home competition (Herfindahl index of beds)
.0184 (.0481)
.0217 (.0487)
.0129 (.0458)
.0267 (.0511)
# home health agencies (HHA) per 1,000 persons age 65 +
Medium tercile -.0415+ (.0245)
-.0486* (.0246)
-.0470* (.0234)
-.0345 (.0266)
High tercile -.0041 (.0278)
-.0050 (.0285)
-.0108 (.0274)
-.0399 (.0296)
Assisted living facility (ALF) beds/1,000 population 65 +
-.0002 (.0004)
-.0002 (.0005)
.0001 (.0005)
.0002 (.0005)
% female population -.0103* (.0052)
-.0095+ (.0050)
-.0108* (.0050)
-.0110* (.0049)
Organizational Characteristics
Medicaid payment rate per day .0028*** (.0006)
.0027*** (.006)
.0031*** (.0006)
.0028*** (.0007)
Has Alzheimer’s specialty unit (0/1) -.0063 (.0363)
-.0060 (.0354)
-.0071 (.0336)
-.0211 (.0381)
% Medicare residents .0041*** (.0011)
.0042*** (.0010)
.0040*** (.0010)
.0038*** (.0011)
Total beds .0005* (.0002)
.0004* (.0002)
.0005* (.0002)
.0005* (.0002)
Chain member (0/1) -.0092 (.0264)
-.0147 (.02271)
-.0008 (.0234)
.0010 (.0279)
For-profit owned (0/1) .0099 .0006 .0051 .0104

12
(.0266) (.0290) (.0250) (.0274)
% Occupancy .0005 (.0012)
.0008 (.0013)
.0006 (.0014)
.0008 (.0013)
% non-Medicare or Medicaid residents
.0008 (.0013)
.0010 (.0013)
.0007 (.0012)
.0008 (.0013)
Constant 5.072*** (.2792)
5.04813*** (.2645)
5.0773*** (.2660)
5.0507*** (.2600)
F 36.21*** 42.18*** 35.59*** 31.80***
R squared 0.4983 0.4968 0.5085 0.4981
*** p < .001 ; ** p < .01; *p <.05; + p < .10 1 Estimated with ordinary least squares with standard errors adjusted for clustering by nursing home market area.
We also conducted sensitivity tests on our models. First, we estimated the models using 2011 five star ratings and found largely the same results with one important exception. Relative to the omitted lowest performance group for the 2011 quality measures rating, the three other quality measure groups also have significantly higher prices (p < .05) than NHs in the lowest quality group. But, as with the previous analyses, none of the other types of five star ratings show any significant relationship to price. Second, because our results contrast with those from two much earlier studies showing a relationship between competition and NH price, we created binary high and low competition variables from the Herfindahl index as an alternative specification. This, also, did not change the results. Finally, to assess whether higher quality ratings may incorporate higher costs, we estimated the models excluding the Medicaid payment rate. Again, the results were not substantively altered.
Discussion
This study examined the relationship between self-pay semi-private room per diem price for long-term care in nursing homes (NHs) in Virginia and publicly available quality ratings. After controlling for market factors and organizational characteristics related to costs, there is little evidence of a relationship between the quality ratings reported on the Nursing Home Compare website and the self-pay semi-private room rate. Neither the overall quality rating nor two of its components, inspection surveys and staffing, were related to price. The only evidence was in the highest quality measure quartile; these nursing homes have a 7.19% higher price than NHs in the lowest quality group. The results are robust to alternative model specifications.
Thus, our study results are largely consistent with Virginia nursing homes not using
higher NHC ratings to charge higher prices to their self-pay residents during the study period. Higher quality NHs did not set higher prices and lower quality NHs did not set lower prices. Frail elderly residents of these NHs, who face a large financial burden for care, paid similar prices for high and low quality of care.

13
Like all studies, this study has some limitations. The difficulty in obtaining data bases
containing NH price data limited our study to one year and one state resulting in a relatively small sample size, and potential questions about causality and generalizability to NHs in other states. We were also unable to control for an important product characteristic that NH residents value, namely, proximity to family or home. It can be the most important factor in how NH residents and their families choose NHs.18 Another product characteristic of special concern for NH residents because of the long length of stay is quality of life. It includes several realms including the environment, personal attention, food and meaningful activity.35, 36
Nonetheless, the study provides some important insights. Price and quality
transparency has been championed as a means to align payment and quality.37 We, largely, do not find such an alignment in a health care sector that has a longstanding history of both quality and price transparency. Our study also highlights some of the difficulties in evaluating and linking payment with quality measures. Quality is multidimensional and there are many possible quality indicators. Our results show that prices may be associated with some but not other such measures. As a result, it can be difficult for providers, payers and consumers to develop or to find relationships between prices and quality. Therefore, it is important to continue work on developing quality metrics and determining how to present both price and quality information to users. 38
Long-term care in nursing homes is not the only health care sector where there is an
absence of a relationship between quality and price or net payments. Research on hospitals shows that market power and reputation, but not quality, are related to actual payments (prices net of insurer discounts) for services made by commercial insurers.39-42 An important difference between hospital and long-term care in is the source of payment. Most payments in the hospital sector are controlled by contracts with large third party payers that are large, knowledgeable, and often powerful. But, prices are not transparent to consumers. In contrast, self-pay long-term NH care payments are controlled by individual residents and their representatives but prices are transparent. It is interesting that both settings lack an association between payments and quality.
The push for quality and price transparency for health care services in the US will
continue. Approximately 90% of health care industry leaders in the US say it is important for health care price information to be transparent to the public.43 More research is needed to assess whether such transparency can achieve a better alignment of quality and payment.

14
References
1. Hussey PS, Luft HS, McNamara P. Public reporting of provider performance at a crossroads in the United States: Summary of current barriers and recommendations on how to move forward. Med Care Res Rev. 2014;71:5S-16S.
2. Abt Associates Inc. Nursing Home Compare Five-Star Quality Rating System: Year Five Report [Public Version]. Baltimore, MD: Centers for Medicare & Medicaid Services (CMS); 2014. Available from: http://www.cms.gov/Medicare/Provider-Enrollment-and-Certification/CertificationandComplianc/Downloads/NHC-Year-Five-Report.pdf.
3. Castle NG. The Nursing Home Compare report card: Consumers' use and understanding. J Aging Soc Policy. 2009;21:187-208.
4. Grabowski DC, Town RJ. Does information matter? Competition, quality, and the impact of Nursing home report cards. Health Serv Res. 2011;46:1698-1719.
5. Mukamel DB, Weimer DL, Spector WD, Ladd H, Zinn JS. Publication of quality report cards and trends in reported quality measures in nursing homes. Health Serv Res. 2008;43:1244-1262.
6. Park J, Konetzka RT, Werner RM. Performing well on nursing home report cards: does it pay off? Health Serv Res. 2011;46:531-554.
7. Werner RM, Konetzka RT, Stuart EA, Norton EC, Polsky D, Park J. Impact of public reporting on quality of postacute care. Health Serv Res. 2009;44:1169-1187.
8. American Health Care Association. A Report on Shortfalls in Medicaid Funding for Nursing Center Care. 2012. Available from: http://www.ahcancal.org/research_data/funding/Documents/FINAL%20Medicaid%20Underfunding%20for%20Nursing%20Home%20Care%20Report.pdf.
9. Catlin A, Cowan C, Heffler S, Washington B. National health spending in 2005: the slowdown continues. Health Aff (Millwood). 2007;26:142-153.
10. Genworth Financial. Genworth 2014 Cost of Care Survey. Genworth Financial; 2014. Available from: https://www.genworth.com/dam/Americas/US/PDFs/Consumer/corporate/130568_032514_CostofCare_FINAL_nonsecure.pdf.
11. Robert Wood Johnson Foundation. Long-Term Care: What Are the Issues? Health Policy Snapshot Issue Brief. . Robert Wood Johnson Foundation; 2014. Available from: http://www.rwjf.org/content/dam/farm/reports/issue_briefs/2014/rwjf410654.

15
12. Ballou JP. The Relationship between Pricing Behavior and Ownership Type in the Wisconsin Nursing Home Industry, 1984-1995. Available at SSRN: http://ssrn.com/abstract=1507969. 2002.
13. Clement JP, Bazzoli GJ, Zhao M. Nursing home price and quality responses to publicly reported quality information. Health Serv Res. 2012;47:86-105.
14. Smith T. Pricing Strategy: Setting Price Levels, Managing Price Discounts and Establishing Price Structures. Cengage Learning; 2011 (p.3).
15. Ingenbleek PT, van der Lans, Ivo A. Relating price strategies and price-setting practices. European Journal of Marketing. 2013;47:27-48.
16. Jobber D, Shipley D. Marketing-orientated pricing: Understanding and applying factors that discriminate between successful high and low price strategies. European Journal of Marketing. 2012;46:1647-1670.
17. Porter ME. Competitive advantage: creating and sustaining superior performance. New York. 1985.
18. Castle NG. Searching for and selecting a nursing facility. Med Care Res Rev. 2003;60:223-47; discussion 248-52.
19. Shugarman LR, Brown JA. Nursing home selection: how do consumers choose? Volume I: Findings from focus groups of consumers and information intermediaries. Washington, DC: Prepared for Office of Disability, Aging and Long-Term Care Policy, Office of the Assistant Secretary for Planning and Evaluation, US Department of Health and Human Services, Contract# HHS-100-03-0023. 2006.
20. Völckner F, Hofmann J. The price-perceived quality relationship: A meta-analytic review and assessment of its determinants. Mark Lett. 2007;18:181-196.
21. Hussey PS, Wertheimer S, Mehrotra A. The association between health care quality and cost: a systematic review. Ann Intern Med. 2013;158:27-34.
22. Spilsbury K, Hewitt C, Stirk L, Bowman C. The relationship between nurse staffing and quality of care in nursing homes: a systematic review. Int J Nurs Stud. 2011;48:732-750.
23. Gulley OD, Santerre RE. Market structure elements: the case of California nursing homes. J Health Care Finance. 2007;33:1-16.
24. Nyman JA. The effects of market concentration and excess demand on the price of nursing home care. The Journal of Industrial Economics. 1994:193-204.
16
25. Cabral L, Fishman A. Business as usual: A consumer search theory of sticky prices and asymmetric price adjustment. International Journal of Industrial Organization. 2012;30:371-376.
26. Hall S, Walsh M, Yates A. Are UK companies' prices sticky? Oxford Economic Papers. 2000;52:425-446.
27. Centers for Medicare and Medicaid Services. Design for Nursing Home Compare Five-Star Quality Rating System: Technical Users’ Guide, February 2015. 2015. Available from: http://www.cms.gov/Medicare/Provider-Enrollment-and-Certification/CertificationandComplianc/downloads/usersguide.pdf.
28. Banaszak-Holl J, Zinn JS, Mor V. The impact of market and organizational characteristics on nursing care facility service innovation: a resource dependency perspective. Health Serv Res. 1996;31:97-117.
29. U.S. Bureau of Economic Analysis. Local Area Personal Income and Employment Methodology. 2010. Available from: http://www.bea.gov/regional/pdf/lapi2008/lapi2008.pdf.
30. Gruneir A, Lapane KL, Miller SC, Mor V. Long-term care market competition and nursing home dementia special care units. Med Care. 2007;45:739-745.
31. Grabowski DC, Stevenson DG, Cornell PY. Assisted living expansion and the market for nursing home care. Health Serv Res. 2012;47:2296-2315.
32. Virginia's Legislative Information System. Nursing Facility Reimbursement Formula. Available at: http://law.lis.virginia.gov/admincode/title12/agency30/chapter90/section41. Accessed July, 2015.
33. Arling G, Daneman B. Nursing Home Case‐Mix Reimbursement in Mississippi and South Dakota. Health Serv Res. 2002;37:377-395.
34. Wooldridge J. Introductory Econometrics: A Modern Approach. Cengage Learning; 2012.
35. Burack OR, Weiner AS, Reinhardt JP, Annunziato RA. What matters most to nursing home elders: quality of life in the nursing home. Journal of the American Medical Directors Association. 2012;13:48-53.
36. Shippee TP, Henning-Smith C, Kane RL, Lewis T. Resident- and Facility-Level Predictors of Quality of Life in Long-Term Care. Gerontologist. 2015;55:643-655.
37. Catalyst for Payment Reform. Action Brief on Price Transparency: An Essential Building Block for a High-Value, Sustainable Health Care System. . Available from:

17
http://www.catalyzepaymentreform.org/images/documents/CPR_Action_Brief_Price_Transparency.pdf.
38. Hibbard JH. What can we say about the impact of public reporting? Inconsistent execution yields variable results. Ann Intern Med. 2008;148:160-161.
39. Blue Cross Blue Shield. A Study of Cost Variations for Knee and Hip Replacement Surgeries in the U.S. 2015. Available from: http://www.bcbs.com/healthofamerica/BCBS_BHI_Report-Jan-_21_Final.pdf.
40. Coakley M. Examination of Health Care Cost Trends and Cost Drivers. Office of the Attorney General of Massachusetts, March. 2010;16.
41. White C, Bond AM, Reschovsky JD. High and Varying Prices for Privately Insured Patients Underscore Hospital Market Power. Center for Studying Health System Change Research Brief No. 27. 2013.
42. White C, Reschovsky JD, Bond AM. Understanding differences between high- and low-price hospitals: implications for efforts to rein in costs. Health Aff (Millwood). 2014;33:324-331.
43. Stremikis K, Davis K, Guterman S. Health care opinion leaders’ views on transparency and pricing. New York: Commonwealth Fund. 2010.
Contact information for authors:
Jan P. Clement, Ph.D. Professor
Department of Health Administration Virginia Commonwealth University
PO Box 980203 Richmond, VA 23298-0203
Phone: (804) 828-1886 FAX: (804) 828-1894 [email protected]
Jaya Khushalani, MHA PhD Student
Department of Health Administration Virginia Commonwealth University
PO Box 980203 Richmond, VA 23298-0203
Phone: (804) 828-1886 FAX: (804) 828-1894

18

19