are customers ready for tablet-based menus? an analysis of
TRANSCRIPT

University of South FloridaScholar Commons
Graduate Theses and Dissertations Graduate School
9-11-2015
Are Customers Ready for Tablet-Based Menus? AnAnalysis of the Innovation Characteristics thatInfluence the Intentions to Adopt Tablet-BasedMenusNataly SuarezUniversity of South Florida, [email protected]
Follow this and additional works at: http://scholarcommons.usf.edu/etd
Part of the Other Social and Behavioral Sciences Commons
This Thesis is brought to you for free and open access by the Graduate School at Scholar Commons. It has been accepted for inclusion in GraduateTheses and Dissertations by an authorized administrator of Scholar Commons. For more information, please contact [email protected].
Scholar Commons CitationSuarez, Nataly, "Are Customers Ready for Tablet-Based Menus? An Analysis of the Innovation Characteristics that Influence theIntentions to Adopt Tablet-Based Menus" (2015). Graduate Theses and Dissertations.http://scholarcommons.usf.edu/etd/6033

Are Customers Ready for Tablet-Based Menus? An Analysis of the Innovation Characteristics
that Influence the Intentions to Adopt Tablet-Based Menus
by
Nataly Suarez
A thesis submitted in partial fulfillment of the requirements for the degree of
Master of Science Department of Hospitality Management
College of Hospitality and Tourism Leadership University of South Florida
Major Professor: Ekaterina Berezina, Ph.D. Wan Yang, Ph.D.
Susan Gordon, Ph.D.
Date of Approval: November 2, 2015
Keywords: Self-Service Technologies, Technology Acceptance Model, Predictors of Customer Trial, Restaurant Type
Copyright © 2015, Nataly Suarez

DEDICATION
This thesis is dedicated to my husband, Juan Mendez.
ACKNOWLEDGMENTS
One of my goals when coming to this country was to accomplish a Master’s Degree.
Today, with the completion of this thesis, I can check the Master’s Degree out of my goals list.
However, this would not have been possible without the knowledge and commitment of my
major advisor and chair of my thesis committee Dr. Ekaterina Berezina, who supported me
through out this process. I am truly thankful to her because despite of her own obligations, she
always showed grate respect and dedication to this project.
Also, I would like to extend my since appreciation to my committee members, Dr. Wan
Yang and Dr. Susan Gordon, for all their support and willingness to help me with this thesis. All
their contributions were invaluable.
In addition, I want to thank my mother Sandra Vanegas, for teaching me the values of
responsibility, discipline and commitment because without them, I would not have been able to
go through this process. Also, I would like to thank my father Gabriel Suarez, for his financial
support through out all my educational endeavors. I want to thank my brother Sergio Suarez, for
all his support during the course of my life and for his continuous faith in me. Lastly, I would
like to thank my beloved husband and friend, for all his support, encouragement, patience, and
unwavering love. His willingness to help me rehearse my defenses is a testament in itself of his
solid devotion and love.

i
TABLE OF CONTENTS
List of Tables ...................................................................................................................... iii List of Figures ..................................................................................................................... iv Abstract ................................................................................................................................ v Chapter One: Introduction ................................................................................................... 1 Chapter Two: Literature Review ......................................................................................... 4 Technology Acceptance Model (TAM) and Customer Trial of Self-Service Technologies ............................................................................................................ 4 Predictors of Technology Adoption Intentions ....................................................... 6 Restaurant Type ....................................................................................................... 9 Quick Service Restaurant ............................................................................ 9 Midscale Restaurant .................................................................................. 10 Upscale Restaurant .................................................................................... 11 Use of Tablets in Restaurants .................................................................... 11 Conceptual Model ................................................................................................. 13 Chapter Three: Method ...................................................................................................... 14 Study Design ......................................................................................................... 14 Sample ................................................................................................................... 16 Measurement ......................................................................................................... 17 Pilot Tests .............................................................................................................. 21 Facebook Pilot Test ................................................................................... 21 Demographic characteristics ......................................................... 21 Reliability of the scale ................................................................... 22 MTurk Pilot Test ....................................................................................... 22 Demographic characteristics ......................................................... 22 Reliability of the scale ................................................................... 23 Data Analysis Method ........................................................................................... 24 Chapter Four: Findings ...................................................................................................... 26 Final Data Collection ............................................................................................. 26 Demographic Characteristics ..................................................................... 26 Reliability of the Scale .............................................................................. 28 Hypotheses Testing ................................................................................... 28 Chapter Five: Discussion and Conclusion ......................................................................... 34 Conclusions and Discussion .................................................................................. 34
ii
Implications ........................................................................................................... 36 Limitations and Future Research ........................................................................... 37 References ......................................................................................................................... 39 Appendix 1: Questionnaire ................................................................................................ 43 Appendix 2: IRB Approval Letter ..................................................................................... 51
iii
LIST OF TABLES
Table 1: Measurement items and scales ........................................................................ 18 Table 2: Facebook pilot test demographic statistics ...................................................... 21 Table 3: MTurk pilot test demographic statistics .......................................................... 23 Table 4: Pilot tests Cronbach’s alphas ........................................................................... 24 Table 5: Sample demographic statistics ........................................................................ 27 Table 6: Final data collection Cronbach’s alphas .......................................................... 29 Table 7: Summary statistics, correlations and results from the regression analysis ...... 31 Table 8: Post hoc test ..................................................................................................... 32 Table 9: Hypotheses testing results ............................................................................... 33

iv
LIST OF FIGURES
Figure 1: Key predictors of consumer intention to adopt tablet-based menus ................ 13
v
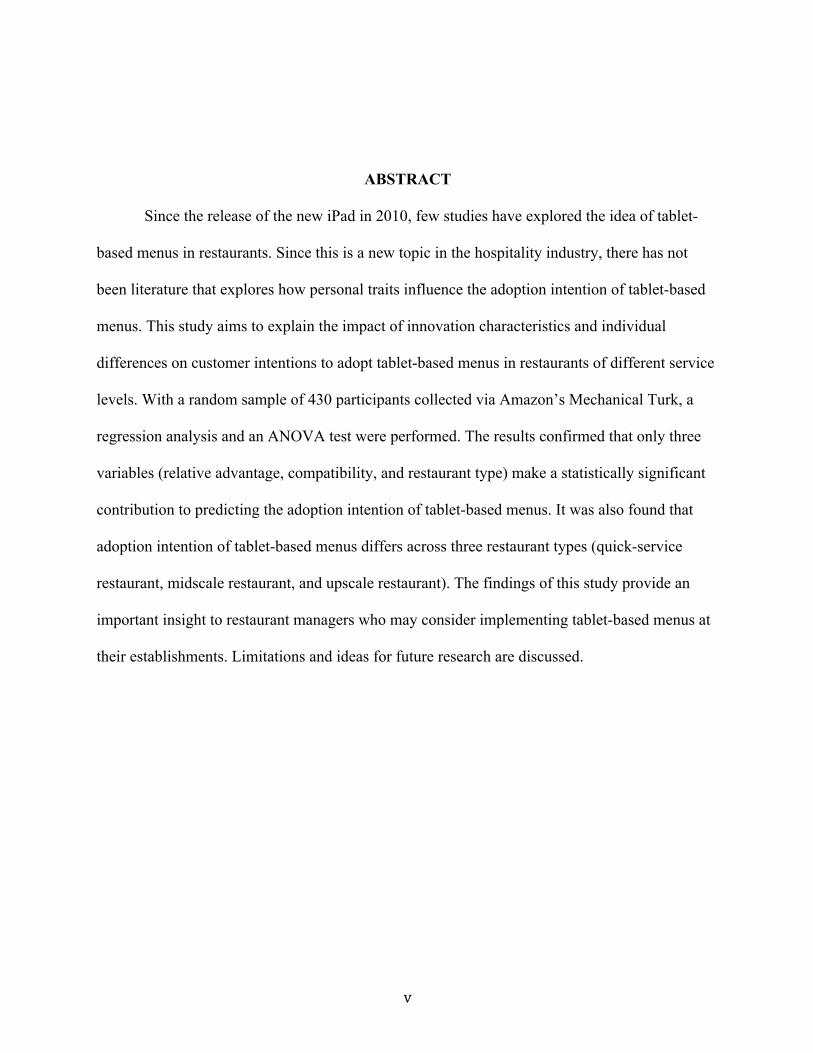
ABSTRACT
Since the release of the new iPad in 2010, few studies have explored the idea of tablet-
based menus in restaurants. Since this is a new topic in the hospitality industry, there has not
been literature that explores how personal traits influence the adoption intention of tablet-based
menus. This study aims to explain the impact of innovation characteristics and individual
differences on customer intentions to adopt tablet-based menus in restaurants of different service
levels. With a random sample of 430 participants collected via Amazon’s Mechanical Turk, a
regression analysis and an ANOVA test were performed. The results confirmed that only three
variables (relative advantage, compatibility, and restaurant type) make a statistically significant
contribution to predicting the adoption intention of tablet-based menus. It was also found that
adoption intention of tablet-based menus differs across three restaurant types (quick-service
restaurant, midscale restaurant, and upscale restaurant). The findings of this study provide an
important insight to restaurant managers who may consider implementing tablet-based menus at
their establishments. Limitations and ideas for future research are discussed.
1
CHAPTER ONE: INTRODUCTION
Menus constitute one of the most important factors that shape the guest experience in a
restaurant setting. According to Cichy and Wise (1999), menus can be described as the path that
encourages hunger and satisfaction for customers. Consequently, restauranteurs and managers
need to place great focus on developing the right menu that will empower the sale of some items
more than others. With the need to improve the design of regular paper menus, technology came
into play an important role due to Apple launching the first iPad in April 2010. This device
encouraged some upscale restaurants like Chicago Cut Steakhouse in Chicago to start using
electronic devices for wine selection, which, according to its manager, helped with an increase of
20 percent of wine consumption (Rousseau, 2011). On the other hand, quick service restaurants
like the chain Au Bon Pain implemented tablet-based menus at their locations with the purpose
of improving the ordering experience from the moment a customer places an order to the
moment he/she pays the bill. Therefore, restaurants of different types may enjoy different
benefits from implementing tablet-based menus.
Tablet-based menus offer some excellent features: first, the ability to browse the food
menu and place the order directly to the kitchen without intermediaries; second, the ability to
customize orders; and third, the advantage of acquiring knowledge about customer buying
interests, patterns and wish lists from the manager’s point of view (Prabu, 2013). Similarly,
Beldona, Buchanan, and Miller (2014) examined the efficacy of e-tablet menus over the
traditional paper-based menus taking into consideration three aspects: order information quality
(customers’ perceptions of the information provided on a menu), menu usability (ease of use of

2
the tablet-menus while providing the user with satisfaction), and ordering satisfaction (the degree
by which, tablet-menus interface and interactivity enhance the ordering experience). Their study
revealed that e-tablet menus are superior compared to the traditional paper-based menus across
all three parameters.
Other researcher has analyzed the impact of menu nutrition labeling on clients’ food
choices using tablet technology and they discovered that attractiveness of menu nutrition labeling
is positively associated with its perceived influence on food choice (Yepes, 2015). Zulkifly,
Zahari, Hafiz, and Jamaluddin (2014) focused on technology readiness (TR) among customers
on tablet-based menus in order to identify their level of comfort and the influence of customer
perceived value (CPV) in adoption behavior and actual use of tablet-based menu. However, to
the best of the author’s knowledge, there are limited studies that examined consumer readiness
for the adoption of tablet-based menus, leaving restaurant managers with a lack of empirical
evidence to base their decisions regarding the implementation of tablet-based menus instead of
paper-based menus. Therefore, the purpose of this study is to explain the impact of innovation
characteristics and individual differences on customer intentions to adopt tablet-based menus in
restaurants of different service levels. In order to address the research purpose, this study
employs a model proposed by Meuter, Bitner, Ostrom, and Brown (2005) which underline the
trial of innovations that require behavior change and the factors that influence customer trial of
new self-service technologies (SSTs) options.
The significance of this study lies in providing an understanding of the impacts of
customer innovation and individual characteristics on adoption intention of tablet-based menus.
Such understanding may assist restaurant managers in recognizing the importance of customer
acceptance of new technologies like tablet-based menus which, will lead to informed decisions

3
about implementing tablet-based menus in their establishments. For example, previous literature
suggests that fast food restaurant managers could reduce costs and improve the delivery of
service by having electronic tablets as the source of ordering and paying the bill (Chancey, n.d.;
Parpal, 2015). Based on the performance of the electronic tablets and the reaction of consumers,
managers can implement this technology in other segments of their businesses such as the drive-
through. Likewise, this study may provide a foundation for future research to examine the effect
of electronic tablets in other fields of the hospitality industry, such as hotels or airlines.

4
CHAPTER TWO: LITERATURE REVIEW
Technology Acceptance Model (TAM) and Customer Trial of Self-Service Technologies
Davis (1989) developed the Technology Acceptance Model (TAM) which is based on
two theoretical constructs that determine the use of new technologies: perceived usefulness and
perceived ease of use. Perceived usefulness refers to a person’s belief that the performance of
his/her job will be enhanced by the use of a new technology, whereas perceived ease of use states
that the use of innovations will be affected by a person’s belief that using a new technology
would be free of effort. In this model, perceived ease of use is influenced by three innovation
characteristics known as compatibility, relative advantage and complexity.
The TAM has been widely used for technology acceptance research and was further
developed in later studies. For example, Wang and Qualls (2007) developed a model of
technology adoption for hospitality organizations which adds technology climate and technology
characteristics as factors that moderate the effects on the relationship between adoption and
perceptions of technology. Wang and Qualls (2007) defined technology climate as the degree of
technocratization in supporting, facilitating and implementing any technology projects.
Similarly, the authors defined technology characteristics as the impact of change and application
orientation of new technologies. Some other examples of applying TAM in hospitality research
are in the areas of restaurant employee technology acceptance (Ham, Kim, & Forsythe, 2008),
technology acceptance by hotel guests (Huh, Kim, & Law, 2009), and traveler acceptance of
self-service hotel kiosks (Kim & Qu, 2014).
5
Even though the TAM has been one of the prominent information systems theories for
decades, it has also been criticized for its limitations (Davis, 1989; Venkatesh, Morris, Davis, &
Davis, 2003; Venkatesh, Thing, & Xu, 2012). As indicated by Davis (1989), the TAM lacks of
explanations that elucidate the impact of people characteristics and performance beliefs on
consumer acceptance of new technologies. Venkatesh et al. (2003) formulated the Unified
Theory of Acceptance and Use of Technology (UTAUT) which is based on eight different
models, including the TAM. The UTAUT suggests that performance expectancy, effort
expectancy, and social influence determine intention to use a new technology, and that intention
and facilitating conditions determine the usage behavior (Venkatesh et al., 2003). Besides the
above direct determinants, experience, voluntariness, gender, and age were included as
moderators in the UTAUT. Later, Venkatesh et al. (2012) added three constructs into the
UTAUT: price value (consumers’ perceptions between the perceived benefits of the technology
and the monetary cost of using it), habit (the extent to which customers perform behaviors
automatically due to prior knowledge), and hedonic motivation (pleasure from using a
technology), creating an enhanced model known as UTAUT2.
In addition to these theories, Meuter et al. (2005) proposed the Customer Trial of Self-
Service Technologies model which suggests that the adoption behavior of self-service
technologies is mediated by the consumer readiness variables: role clarity, motivation and
ability. These variables mediate the relationship between individual differences (inertia,
technology anxiety, need for interaction, previous experience, and demographics) and innovation
characteristics (relative compatibility, relative advantage, complexity, observability, trialability,
and perceived risk) with the likelihood of trial. Three of the innovation characteristics

6
(compatibility, relative advantage, and complexity) recognized by Meuter et al. (2005) were also
identified by the TAM as the innovation types that influence the perceived ease of use construct.
In conclusion, the Customer Trial of Self-Service Technologies complements the TAM
by adding personal differences to the factors affecting customer acceptance of new technologies.
Also, the Customer Trial of Self-Service Technologies is more specific than the UTAUT and the
UTAUT2 because it adds to the equation individual differences, which also affect the adoption
behavior of new technologies. Thus, this research will use the model proposed by Meuter et al.
(2005) as the more suitable model to explain the factors that influence customer trial of tablet-
based menus in the restaurant industry.
Predictors of Technology Adoption Intentions
According to Meuter et al. (2005) there are two adoption constructs that influence the
adoption behaviors of new technologies: perceptions of innovation characteristics and individual
differences. Perceptions of innovation characteristics predictor explains that individuals’
perception of the innovations’ attributes predict an innovation’s rate of adoption, in other words,
“the characteristics of an innovation, as perceived by the members of a social system, determine
its rate of adoption” (Rogers, 1995, p. 1). Rogers (1995) identified five attributes that can help to
predict an innovation’s adoption: (1) relative advantage is characterized by the perception that an
innovation brings more advantages than the idea it replaced, therefore, relative advantage is
positively related with the rate of adoption; (2) compatibility is the level of consistency of an
innovation with existing values and needs of potential adopters, hence if the innovation is
perceived with a higher level of compatibility, the rate of adoption will be higher as well; (3)
complexity is the perceived level of relative difficulty in understanding and using the innovation,
7
consequently, complexity is negatively related to its rate of adoption; (4) trailability is the level
of experimentation of an innovation on a limited basis, thus, an increase in the level of trailability
of an innovation will increase the rate of adoption; and (5) observability is the attribute of an
innovation of making visible its results, therefore, the observability of an innovation is positively
related with its rate of adoption. The sixth attribute was identified by Meuter et al. (2005) as
perceived risk, which affects negatively the likelihood of trial.
Given the novelty of tablet-based menus, it may be suggested that customer acceptance of
this new technology may be influenced by customer perceptions of innovations characteristics
and individual differences. These six aforementioned innovation characteristics were studied by
Meuter et al. (2005) whose findings revealed that observability and trialability do not have a
direct effect on trial. Hence, for the purpose of the current study, these two variables will not be
measured as predictors of trial of tablet-based menus. Therefore, the following hypotheses are
proposed:
H1a. Customer perceptions of tablet-based menus’ relative advantage are positively related to
their intention to adopt tablet-based menus.
H1b. Customer perceptions of tablet-based menus’ compatibility are positively related to their
intention to adopt tablet-based menus.
H1c. Customer perceptions of tablet-based menus’ complexity are negatively related to their
intention to adopt tablet-based menus.
8
H1d. Customer perceptions of tablet-based menus’ risk are negatively related to their intention to
adopt tablet-based menus.
The second construct that influences the adoption behavior of new technologies is known
as individual differences, which are categorized into inertia, technology anxiety, need for
interaction, previous experience, and demographics (Meuter et al., 2005). Inertia makes the task
of creating personal criteria and expectations of an innovation difficult, which results in
hesitancy to adopt the new technology (Olshavsky & Spreng, 1996). Technology anxiety is
defined as the fear, apprehension, and excessive timidity in using new technologies causing the
avoidance of using a particular technology (Meuter, Ostrom, Bitner, & Roundtree, 2003).
Dabholkar (1995) explained that some service encounters required the interaction between
employees and customers, which is known as need for interaction, hence it is expected that the
adoption behavior of tablet-based menus will be negatively affected by the need of interaction of
some individuals. On the contrary, previous experience with a broadly defined product, in this
case with tablets, should lead to an increasing likelihood of adoption of tablet-based menus since
prior knowledge will lead feelings of confidence in handling new innovations (Dickerson &
Gentry, 1983). Even though demographics will be measured in the survey instrument, the author
will not formulate hypotheses about the impact of demographics on the adoption intention of
tablet-based menus since there is a wide range of variables that affect the adoption intention of
new technologies that are not directly related with the demographic characteristics of a
population. Likewise, Meuter et al. (2005) found that antecedent variables like sex and education
are extremely weak predictors of trial. Consequently, the following hypotheses are proposed:

9
H2a. Inertia negatively influences the intention to adopt tablet-based menus.
H2b. Technology anxiety negatively influences the intention to adopt tablet-based menus.
H2c. Need for interaction negatively influences the intention to adopt tablet-based menus.
H2d. Previous experience positively influences the intention to adopt tablet-based menus.
Restaurant Type
When evaluating the use of tablet-based menus, it is important to consider the overall
restaurant setting as well. Emenheiser, Clay, and Palakurthi (1998) distinguished three different
types of restaurants based on the food specialty of the restaurant, the credit card acceptance, the
perceived restaurant type and the alcohol availability. Based on these attributes, three restaurant
types were defined as: quick service restaurant (perceived as a fast-food or take-out restaurant),
midscale restaurant (perceived as more than a quick service restaurant but less than an upscale
restaurant primarily due to the fact that this type of restaurant is not required to serve beer, wine
or alcohol), and upscale restaurant (perceived as more than a midscale restaurant since full liquor
service is offered).
Quick Service Restaurant
Quick service restaurant provides the fastest service among all restaurant types since it is
expected that customers attend these restaurants in a hurry or with a limited time for dinning in.
Consequently, it has been found that frequent fast-food buyers in the United States expect to

10
have quick service when they attend this type of restaurants (Kara, Kaynak, & Kucukemiroglu,
1995). The décor is simple and, in some cases, these restaurants have only a drive-through or a
walk-up window to place and pick up the order instead of a dinning space (Johnson, n.d.). Some
examples of U.S. quick service restaurant chains are McDonald’s, Subway, Wendy’s, Burger
King, and Taco Bell.
Considering the importance of the speed of service in a quick-service restaurant, Brox
(2010) stated that the evaluation of operational procedures and the measuring of the steps it takes
to deliver food to the customers is a good way to increase the speed of the service. One strategy
that managers can use in order to decrease the waiting time and increase the speed of service is to
implement tablet-based menus which expedites the whole process from ordering to paying the
bill, cutting down labor costs and making the process a more efficient one (CBS News, 2014).
Similarly, Swimberghe and Wooldridge (2014) found that customer loyalty for quick-service
restaurants is influenced by customer satisfaction and customer trust, furthermore, robotic
technologies may enhance the service times and food waste in quick-service restaurants (Noone
& Coulter, 2012). Therefore, even though tablet-based menus are not considered robots, they
may enhance the perceived customer satisfaction by giving a faster ordering experience creating
a competitive advantage for those quick-service restaurants that implement this technology.
Midscale Restaurant
Midscale restaurants employ waiters to take customers’ orders who then serve the food,
therefore, the speed of service is expected to be longer than in a quick-service restaurant. These
restaurants are also recognized to have a more family-friendly environment with a larger menu
and more expensive items (Johnson, n.d.). Consumers that patronize this type of restaurants are
11
likely to order healthy menu items since they are interested on the health value of the food they
are buying (Kang, Jun, & Arendt, 2015). According to Yepes (2015), tablet-based menus are
good tools to present the nutrition labeling of menu items. Thus, customers who attend to this
type of restaurant will be more likely to adopt a tablet-based menu. Examples of midscale
restaurants in United States include Chili’s, Applebee’s, Olive Garden, Macaroni Grill, and
Bonefish Grill.
Upscale Restaurant
Johnson (n.d.) described upscale restaurants for having an atmosphere of grace and
elegance. The menus are more elaborated and the prices are expensive which are accepted by
customers because of the perceived value they are receiving from dinning at these restaurants.
The speed of service is perceived as very detail-oriented since customers can take hours between
drinks, appetizers, entrees, and desserts. Customers patronizing this type of restaurant are having
business celebrations or celebrating special occasions, therefore, time is not an issue for them.
Upscale restaurant chains in United States are The Capital Grille, Ruth’s Chris Steak House, and
Fleming’s Prime Steakhouse & Wine Bar.
Use of Tablets in Restaurants
Some examples of restaurants that have implemented some form of tablet-based menus
are Applebee’s, Panera and Chili’s. These restaurants have seen first-hand the benefits of using
tablet devices at their restaurants with an increasing of 20 percent of appetizer and dessert sales,
and a decrease on table turn times of about five minutes (Shah, 2014). This behavior can be
explained by three facts: first, mobile devices like tablet based-menus remove the need to
12
allocate personnel and space at a cashier station; second, mobile devices provide administrative
and reporting oversight of customer behavior and trends; and third, electronic menus allow
managers to add promotions and other cross-selling techniques as sales tools (Kasavana, 2011).
From a customer point of view, tablet-based menus can offer impressive graphics, photos
and links, nutritional values, ingredients, recipes, attractive and detailed wine lists, and item-
search by criteria (Kasavana, 2011). These characteristics may impact positively the adoption
intention of tablet-based menus in a restaurant setting by the high involvement that customers
perceive during the ordering process.
In conclusion, to the best of the author’s knowledge, relevant literature has focused on the
factors that motivate managers of independent full-service and chain restaurants to use
information technology advances and the impact of these technologies on the daily operations
from the manager’s perspective (Oronsky & Chathoth, 2007); the importance of conducting a
financial analysis by the revenue management team of a restaurant when a new technology is
going to be adopted (Kimes, 2008); and how perceived ease of use, intention to use, and
perceived usefulness (TAM) affects the restaurant operations when it adopts different computing
systems (Ham, Kim, & Forsythe, 2008). However, previous research has not explored the
influence of adopting new technologies like tablet-based menus on each type of restaurant. For
example, tablet-based menus may enhance the customer experience in a quick service setting
since it may expedite the entire experience from ordering to paying the bill. However, the use of
tablet-based menus at a fine dining restaurant may negatively affect the customer experience
since patrons are not expecting a quick service, but rather a personalized and detailed service.
Therefore, the author hypothesizes that a restaurant type may influence customer acceptance of
tablet-based menus, and, therefore, customer intentions to adopt table-based menus will differ
13
among the customers who patronize different restaurant types. Consequently, the last hypothesis
is proposed:
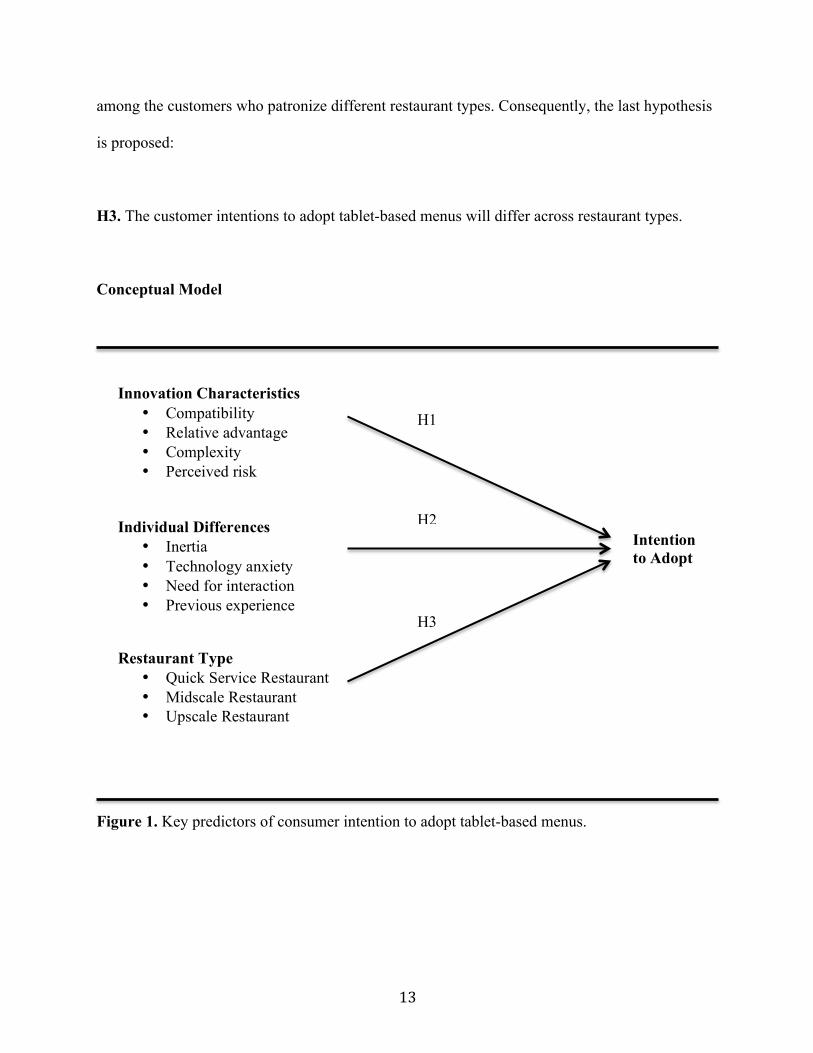
H3. The customer intentions to adopt tablet-based menus will differ across restaurant types.
Conceptual Model
Figure 1. Key predictors of consumer intention to adopt tablet-based menus.
Innovation Characteristics • Compatibility • Relative advantage • Complexity • Perceived risk
Individual Differences • Inertia • Technology anxiety • Need for interaction • Previous experience
Restaurant Type • Quick Service Restaurant • Midscale Restaurant • Upscale Restaurant
H3
Intention to Adopt
H1
H2
14
CHAPTER THREE: METHOD
Study Design
A simple experimental design was used in this study in order to explore tablet-based
menu acceptance intentions across different restaurant settings. The experiment was integrated in
an online survey and was self-administered by the participants. Experimental studies are used in
research with the purpose of analyzing the cause-effect inferences of different treatment levels
(Trochim & Donnelly, 2008). Therefore, subjects were randomly assigned to one of three
scenarios describing a dining experience (See Appendix 1).
In the scenarios, subjects were asked to imagine they decided to go out for dinner. Since
the variable to manipulate (or treatment) is the restaurant type, participants were told that their
choice of restaurant is a quick-service restaurant called Speed Rabbit Deli for the quick-service
restaurant scenario, Archie’s Pizza & Pasta for the midscale restaurant scenario, and The Manor
for the upscale restaurant scenario. To ensure participants imagine the whole experience of
dining out, for the quick-service restaurant scenario, they read the following story: “You and
your friend decide to go to a quick service restaurant called Speed Rabbit Deli. As you enter
Speed Rabbit Deli, you notice a very simple décor and a very limited dining space. Moreover,
you find that there is no line and that there are no employees waiting for you at the service
counter. Instead there are electronic tablets for you to place the order. When you approach the
electronic tablet you are able to see pictorial presentations, nutritional information, and the origin
of the ingredients in an easy and friendly way (Buchanan, 2011). You choose the items that you

15
want to buy and the electronic tablet sends your order to the kitchen and asks you to pay the
bill.”
In contrast, for the midscale restaurant scenario participants were told, “You and your
friend decide to go to an Italian midscale restaurant called Archie’s Pizza and Pasta. As you enter
Archie’s Pizza and Pasta, the hostess advises you that there is a 15 minute wait. You decide to
wait in the lounge of the restaurant where you are able to see some families dining at this
restaurant. After 10 minutes have passed, the hostess calls your name and sits you at the table.
The hostess shows you an electronic tablet from which you will see the menu, place your order
and pay your bill. In the tablet-based menu you are able to see pictorial presentations with videos
of food preparation, nutritional information, and the origin of the ingredients in an easy and
friendly way (Buchanan, 2011). You see the entire menu on the tablet, choose the items you
want to buy and the electronic tablet sends your order to the kitchen. A server brings your food
and, when you finish, you pay the bill through the electronic tablet.”
Finally, for the upscale restaurant scenario participants were told, “After making a
reservation at an upscale restaurant called The Manor, you and your friend arrive at the
restaurant and the hostess asks for your name. The hostess confirms your reservation and directs
you to your reserved table. During the walk to the table you are able to feel a quiet atmosphere
with slow music, candles and white tablecloth. Upon arrival at the table, the hostess shows you
an electronic tablet from which you will see the menu, place your order and pay your bill. In the
tablet-based menu you are able to see pictorial presentations with videos of food preparation,
nutritional information, and the origin of the ingredients in an easy and friendly way (Buchanan,
2011). Moreover, the tablet has a special wine list application resembling a virtual wine cellar
(Kasavana, 2011). You see through the tablet the entire menu, choose the items you want to buy
16
and the electronic tablet sends your order to the kitchen. A server brings your food and, when
you finish, you pay the bill through the electronic tablet.”
Sample
The study started with a pilot testing of the questionnaire. The pilot tests were conducted
with a convenience sample of friends and relatives recruited via Facebook social media platform
and with a small sample using Amazon’s Mechanical Turk. The purpose of the pilot tests was to
improve the items and the measurement scales, as well as, to enhance the quality and clarity of
the questions presented on the survey.
After making such improvements, the survey was distributed again through Amazon’s
Mechanical Turk (MTurk) with a 60-cents appreciation token for participants who completed the
survey. MTurk is a tool that enables thousands of workers around the world (Mechanical Turk
Workers) to complete more than one hundred thousand tasks known as Human Intelligence
Tasks (HITs). MTurk is an inexpensive tool to collect data for research purposes; moreover, it
has been found that this tool can be used to obtain high-quality data rapidly since participants are
more diverse and are motivated for realistic compensation rates that do not affect data quality
(Buhrmester, Kwang, & Gosling, 2011). Similarly, Casler, Bickel, and Hackett (2013) found that
MTurk participants are more ethnically and socio-economically diverse than participants
gathered via social media (Twitter, Facebook, and Reddit) and face-to-face samples. Some other
benefits provided by MTurk are the supportive infrastructure, the subject anonymity, and the
subject identifiability and prescreening (Paolacci, Chandler, & Ipeirotis, 2010; Mason and Suri,
2012).

17
Measurement
An online questionnaire was prepared for the purpose of this study using Qualtrics
platform. The questionnaire included several parts. The questionnaire started with a consent form
and explanation of the study purpose. Next, participants were presented with a type of restaurant
description and were asked to select at which of the three types of restaurants they have ever
dined. One of the scenarios was randomly displayed based on the type(s) of restaurants
participants selected in the previous question. In other words, if a participant would report that
they have dined out at midscale and upscale restaurants, the survey would randomly choose and
present that respondent with either midscale or upscale scenario. Such logic was implemented to
ensure that study participants have relevant dining experience, and may relate to the scenario
presented in the survey. With the purpose of improving the validity of the results, a manipulation
check question was created to ensure participants remembered the type of restaurant scenario
described at the beginning of the survey.
The variables of innovation characteristics and individual differences were measured
using 7-point Likert-type scales ranging from 1-strongly disagree to 7-strongly agree for each
attribute (Meuter et al., 2005). The adoption intention variable was assessed using one 7-point
Likert-type scale using 1-extremely unlikely and 7-extremely likely anchors (Chin & Gopal,
1995) and one 7-point, Likert-type scale using 1-strongly disagree and 7-strongly agree anchors
(Karahanna, Straub, & Chervany, 1999). The measurement items and scales for each construct
are presented in Table 1. The survey concluded with the demographic questions and survey
comments.
18
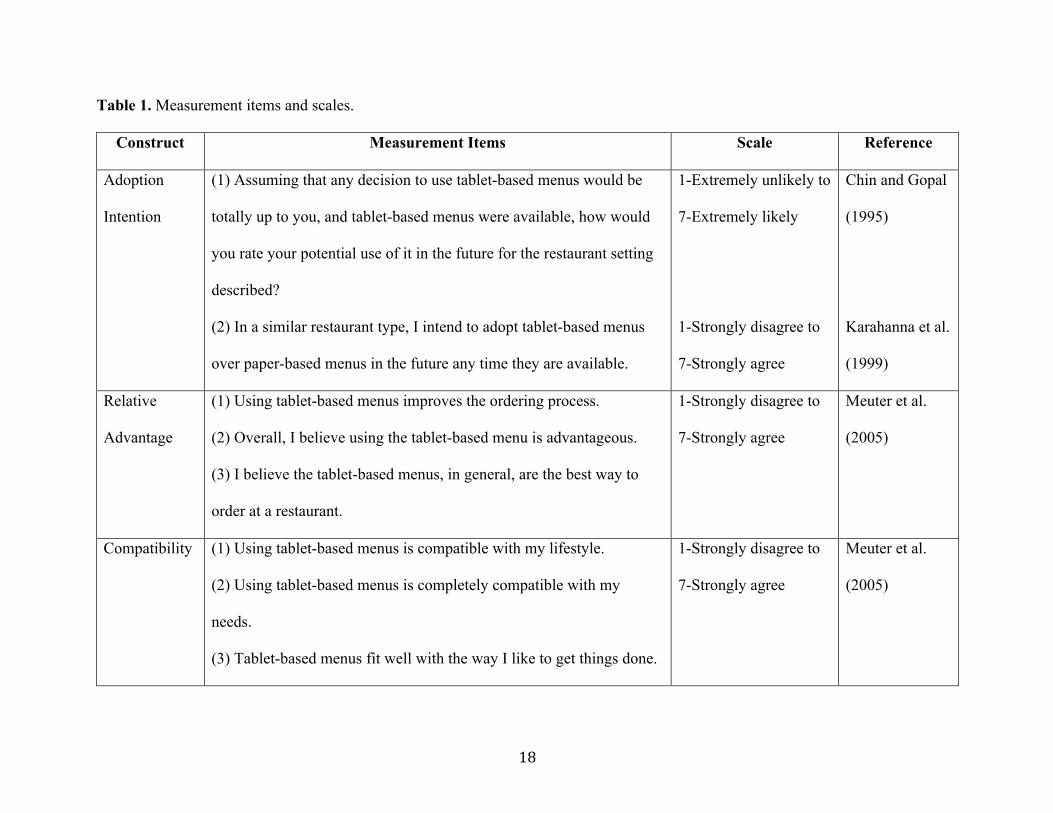
Table 1. Measurement items and scales.
Construct Measurement Items Scale Reference
Adoption
Intention
(1) Assuming that any decision to use tablet-based menus would be
totally up to you, and tablet-based menus were available, how would
you rate your potential use of it in the future for the restaurant setting
described?
(2) In a similar restaurant type, I intend to adopt tablet-based menus
over paper-based menus in the future any time they are available.
1-Extremely unlikely to
7-Extremely likely
1-Strongly disagree to
7-Strongly agree
Chin and Gopal
(1995)
Karahanna et al.
(1999)
Relative
Advantage
(1) Using tablet-based menus improves the ordering process.
(2) Overall, I believe using the tablet-based menu is advantageous.
(3) I believe the tablet-based menus, in general, are the best way to
order at a restaurant.
1-Strongly disagree to
7-Strongly agree
Meuter et al.
(2005)
Compatibility (1) Using tablet-based menus is compatible with my lifestyle.
(2) Using tablet-based menus is completely compatible with my
needs.
(3) Tablet-based menus fit well with the way I like to get things done.
1-Strongly disagree to
7-Strongly agree
Meuter et al.
(2005)
19
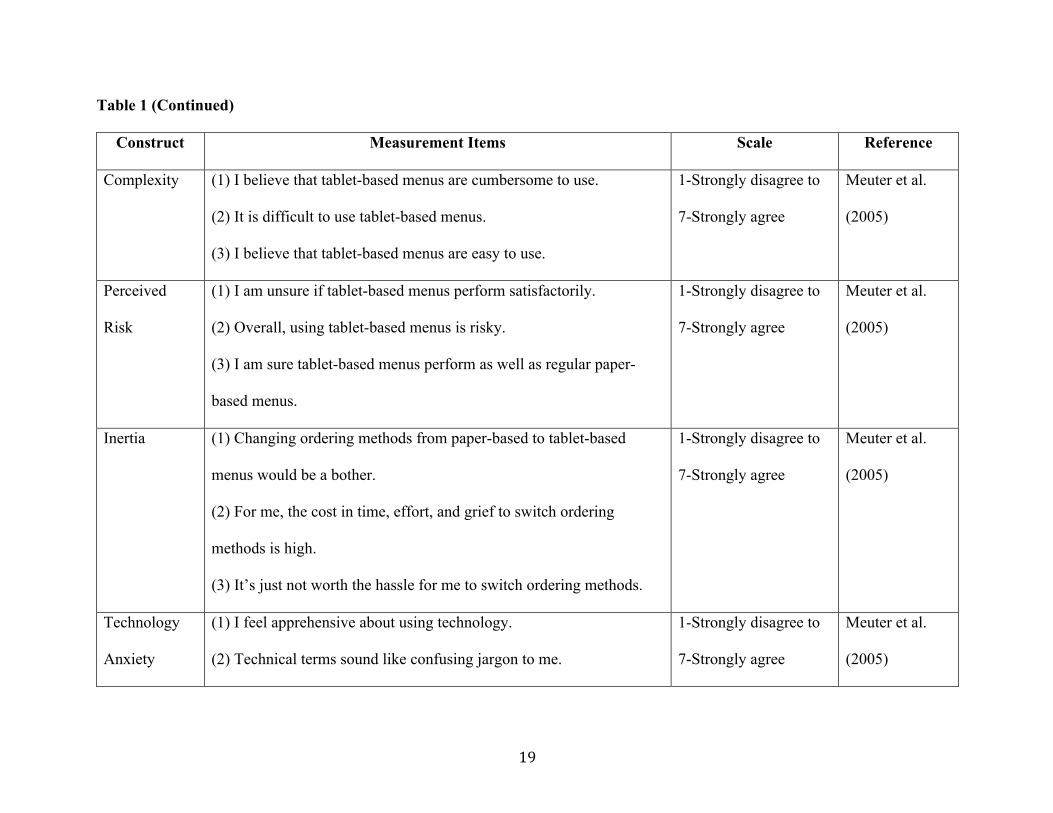
Table 1 (Continued)
Construct Measurement Items Scale Reference
Complexity (1) I believe that tablet-based menus are cumbersome to use.
(2) It is difficult to use tablet-based menus.
(3) I believe that tablet-based menus are easy to use.
1-Strongly disagree to
7-Strongly agree
Meuter et al.
(2005)
Perceived
Risk
(1) I am unsure if tablet-based menus perform satisfactorily.
(2) Overall, using tablet-based menus is risky.
(3) I am sure tablet-based menus perform as well as regular paper-
based menus.
1-Strongly disagree to
7-Strongly agree
Meuter et al.
(2005)
Inertia (1) Changing ordering methods from paper-based to tablet-based
menus would be a bother.
(2) For me, the cost in time, effort, and grief to switch ordering
methods is high.
(3) It’s just not worth the hassle for me to switch ordering methods.
1-Strongly disagree to
7-Strongly agree
Meuter et al.
(2005)
Technology
Anxiety
(1) I feel apprehensive about using technology.
(2) Technical terms sound like confusing jargon to me.
1-Strongly disagree to
7-Strongly agree
Meuter et al.
(2005)

20
Table 1 (Continued)
Construct Measurement Items Scale Reference
Technology
Anxiety
(3) I have avoided technology because it is unfamiliar to me.
(4) I hesitate to use most forms of technology for fear of making
mistakes I cannot correct.
1-Strongly disagree to
7-Strongly agree
Meuter et al.
(2005)
Need for
Interaction
(1) Personal contact with an employee makes ordering enjoyable for
me.
(2) Personal attention by a customer service employee is important to
me.
(3) It bothers me to use a machine when I could talk to a live person
instead.
1-Strongly disagree to
7-Strongly agree
Meuter et al.
(2005)
Previous
Experience
(1) I commonly use lots of automated systems when dealing with
other businesses.
(2) I do not have much experience using tablets.
(3) I use a lot of technologically based products and services.
1-Strongly disagree to
7-Strongly agree
Meuter et al.
(2005)

21
Pilot Tests
Facebook Pilot Test
For the first pilot test, 58 responses were collected. After various data cleaning, which
included deleting incomplete responses and responses that failed the manipulation check
question, 33 valid responses were analyzed.
Demographic characteristics. More than half of the sample were women (66.7%) and
were married (54.5%), followed by single (36.4%) and divorced (9.1%). Also, most respondents
had a 4-year College Degree (36.4%) followed by a Master’s Degree (30.3%). For detailed
demographic statistics of the pilot sample please refer to Table 2.
Table 2. Facebook pilot test demographic statistics.
Variable % Variable %
Gender
Male
Female
Marital Status
Single
Married
Divorced
Separated
Widowed
33.3
66.7
36.4
54.5
9.1
0
0
Level of Education
Some High School
High School / GED
Some College
2-year College Degree
4-year College Degree
Master’s Degree
Doctoral Degree
Professional Degree (JD, MD)
0
0
3.0
0
36.4
30.3
24.2
6.1
22
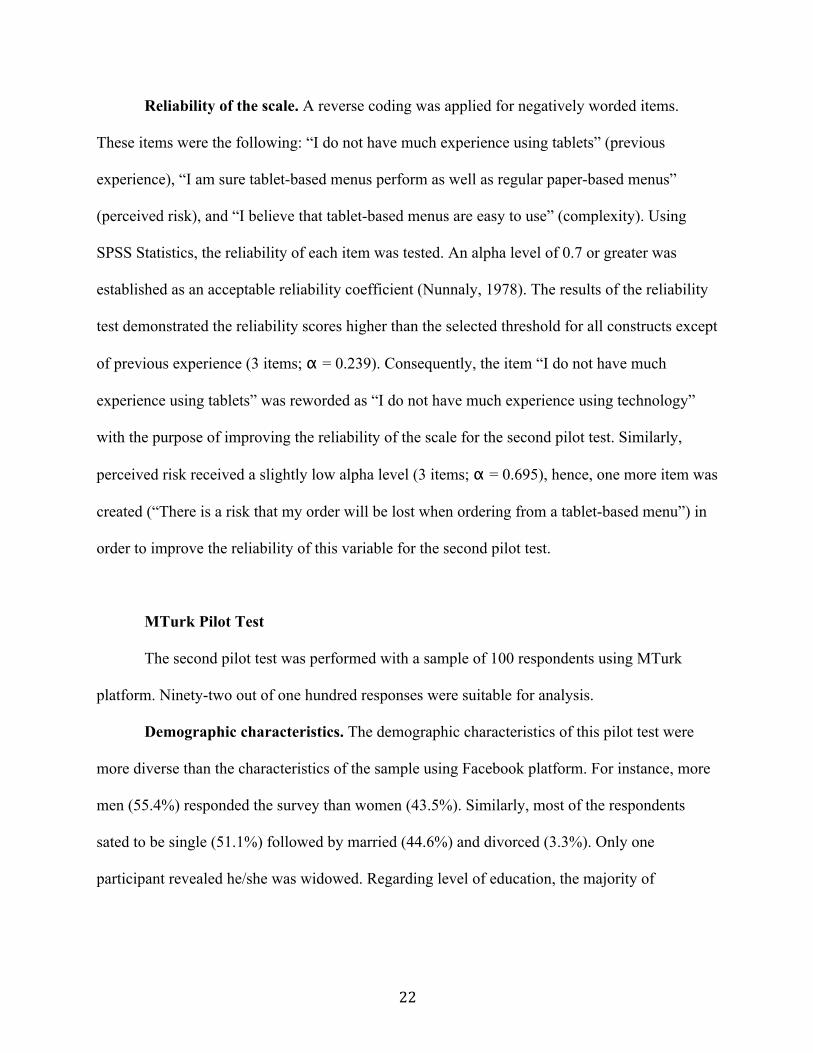
Reliability of the scale. A reverse coding was applied for negatively worded items.
These items were the following: “I do not have much experience using tablets” (previous
experience), “I am sure tablet-based menus perform as well as regular paper-based menus”
(perceived risk), and “I believe that tablet-based menus are easy to use” (complexity). Using
SPSS Statistics, the reliability of each item was tested. An alpha level of 0.7 or greater was
established as an acceptable reliability coefficient (Nunnaly, 1978). The results of the reliability
test demonstrated the reliability scores higher than the selected threshold for all constructs except
of previous experience (3 items; α = 0.239). Consequently, the item “I do not have much
experience using tablets” was reworded as “I do not have much experience using technology”
with the purpose of improving the reliability of the scale for the second pilot test. Similarly,
perceived risk received a slightly low alpha level (3 items; α = 0.695), hence, one more item was
created (“There is a risk that my order will be lost when ordering from a tablet-based menu”) in
order to improve the reliability of this variable for the second pilot test.
MTurk Pilot Test
The second pilot test was performed with a sample of 100 respondents using MTurk
platform. Ninety-two out of one hundred responses were suitable for analysis.
Demographic characteristics. The demographic characteristics of this pilot test were
more diverse than the characteristics of the sample using Facebook platform. For instance, more
men (55.4%) responded the survey than women (43.5%). Similarly, most of the respondents
sated to be single (51.1%) followed by married (44.6%) and divorced (3.3%). Only one
participant revealed he/she was widowed. Regarding level of education, the majority of

23
participants obtained a 4-year College Degree (41.3%). See Table 3 for more detailed
information about the demographic characteristics of the sample.
Table 3. MTurk pilot test demographic statistics.
Variable % Variable %
Gender
Male
Female
Missing*
Marital Status
Single
Married
Divorced
Separated
Widowed
55.4
43.5
1.1
51.1
44.6
3.3
0
1.1
Level of Education
Some High School
High School / GED
Some College
2-year College Degree
4-year College Degree
Master’s Degree
Doctoral Degree
Professional Degree (JD, MD)
1.1
8.7
26.1
10.9
41.3
10.9
0
1.1
* One respondent did not answer this question.
Reliability of the scale. The reliability test confirmed all the variables with the exception
of previous experience (α = 0.523). Consequently, the item “I do not have much experience
using technology” was changed for the item “I have a lot of experience using self-service
technologies (e.g., ordering food online, airport kiosk).” All the Cronbach’s alphas for the first
and second pilot tests are shown in Table 4.

24
Table 4. Pilot tests Cronbach’s alphas.
Variable First Pilot Test (Facebook
Platform)
Second Pilot Test
(MTurk Platform)
Relative Advantage α = 0.933 α = 0.919
Compatibility α = 0.951 α = 0.948
Complexity α = 0.701 α = 0.764
Perceived Risk α = 0.695 α = 0.880
Inertia α = 0.869 α = 0.940
Technology Anxiety α = 0.800 α = 0.882
Need for Interaction α = 0.823 α = 0.760
Previous Experience α = 0.239 α = 0.523
Adoption Intention α = 0.860 α = 0.894
Data Analysis Method
The data analysis process initiated with data preparation and data cleaning. Since the
survey contains negatively worded items, a reverse coding was used for these items. Next, the
reliability of the constructs adapted from the literature was measured using Cronbach’s α. Once
the dimensions were confirmed, summated scores were calculated for every attribute
(compatibility, relative advantage, complexity, perceived risk, inertia, technology anxiety, need
for interaction, previous experience, and intention to adopt) and used in the further analysis.
In order to test the formulated hypotheses, a regression model was implemented using the
above summated scores. Each hypothesis was evaluated based on the beta coefficients received
from the regression analysis. This regression analysis employed alpha level of less than or equal

25
to 0.05 in order to identify statistically significant effects when testing the hypotheses. Lastly, an
ANOVA analysis was used to check the differences in adoption intentions across the customers
of three restaurant types (H3).

26
CHAPTER FOUR: FINDINGS
Final Data Collection
A sample size of 430 respondents was used with the purpose of testing the hypotheses.
Out of 430 participants, 15 people failed the manipulation check question and were deleted from
the study. From the 415 final participants, 135 were assigned to the quick-service restaurant
scenario, 138 to the midscale restaurant scenario, and 142 to the upscale restaurant scenario. The
sample was represented by people 18 years of age or older living in the United States.
Demographic Characteristics
Participants were asked about their gender, marital status, level of education, age, and
approximate annual household income. The sample consisted primarily of women (53%). The
majority of the sample were single (48.7%) followed by married (40.5%). The rest of the marital
status categories had less than 30 responses. Similarly to the education characteristics found
during the first pilot test, 40.5% of the final sample had a 4-year College Degree followed by
Some College (24.3%). Most of the participants were 19 to 29 years old (37.6%) and had a
household income of $50,000 to $74,999 (23.1%).
Additionally, respondents were asked whether or nor they had used an electronic tablet.
Most of the participants said they had used an electronic tablet before (91.8%), however, when
they were asked if they had ever used an electronic tablet-based menu, 60% said no and 40%
said yes. Participants were also asked about the type of restaurant they visit most frequently.

27
Almost half of the sample (48.9%) visits quick-service restaurants more frequently, followed
closely by 47.5% who visit midscale restaurants. Only 15 participants mentioned they visit
upscale restaurants more frequently. All the demographic characteristics of the sample are
presented in Table 5.
Table 5. Sample demographic statistics.
Variable % Variable %
Gender
Male
Female
Marital Status
Single
Married
Divorced
Separated
Widowed
Missing*
Use of an Electronic Tablet
Yes
No
Missing*
47.0
53.0
48.7
40.5
7.2
2.2
1.2
0.2
91.6
8.2
0.2
Level of Education
Some High School
High School / GED
Some College
2-year College Degree
4-year College Degree
Master’s Degree
Doctoral Degree
Professional Degree (JD, MD)
Other**
Type of Restaurant Frequently
Visited
Quick-service restaurant
Midscale restaurant
Upscale restaurant
0.7
9.2
24.3
11.3
40.5
10.4
2.4
1.0
0.2
48.9
47.5
3.6

28
Table 5 (Continued)
Variable % Variable %
Annual Household Income
Less than $15,000
$15,000 to $24,999
$25,000 to $34,999
$35,000 to $49,999
$50,000 to $74,999
$75,000 to $99,999
$100,000 to $149,999
$150,000 to $199,999
$200,000 or more
Missing****
8.4
9.6
14.5
17.8
23.1
13.3
9.4
1.4
1.7
0.7
Use of a Tablet-Based Menu
Yes
No
Age
19 to 29 years old
30 to 39 years old
40 to 49 years old
50 to 59 years old
60 to 69 years old
70 to 78 years old
Missing***
40.2
59.8
37.6
30.1
13.3
11.8
5.5
0.5
1.2
* One respondent did not answer this question ** Other level of education: “Vocational” *** Five respondents did not answer this question **** Three respondents did not answer this question
Reliability of the Scale
Data was analyzed using SPSS software. The reliability of all variables was acceptable
(See Table 6).
Hypotheses Testing
A regression analysis was executed in order to test if innovation characteristics and
individual differences predicted adoption intention of tablet-based menus. Using the enter

29
method it was found that the nine predictors (including restaurant type) explained 71.8% of
adoption intention variance (R2 = .718, F(9, 405) = 114.337, p < .001).
Table 6. Final data collection Cronbach’s alphas.
Variable Final Data Collection
Relative Advantage α = 0.915
Compatibility α = 0.941
Complexity α = 0.789
Perceived Risk α = 0.791
Inertia α = 0.862
Technology Anxiety α = 0.869
Need for Interaction α = 0.839
Previous Experience α = 0.701
Adoption Intention α = 0.909
Nine hypotheses were formulated in this study. The first four hypotheses are related with
innovation characteristics: relative advantage (H1a), compatibility (H1b), complexity (H1c), and
perceived risk (H1d); whereas the following four hypotheses are associated with individual
differences: inertia (H2a), technology anxiety (H2b), need for interaction (H2c), and previous
experience (H2d). The last hypothesis explains that adoption intention of tablet-based menus will
differ across restaurant types (H3).

30
A regression analysis was conducted in order to test if innovation characteristics and
individual differences predicted adoption intention of tablet-based menus. In general form, a
regression model may be presented as follows:
Y = a + b1X1 + b2X2 + … + bnXn + e,
where
Y – dependent variable
X – independent variable
a – constant
b – regression coefficient
n – number of independent variables.
In the context of this study, the dependent variable (intentions to adopt tablet-based
menus) was predicted using nine independent variables (compatibility, relative advantage,
complexity, perceived risk, inertia, technology anxiety, need for interaction, previous experience,
and restaurant type). All variables were entered in the model simultaneously to test all of the
hypotheses (Field, 2009). The results of the model testing demonstrated that the nine predictors
explained 71.8% of the adoption intention variance (R2 = .718, F(9, 405) = 114.337, p < .001).
According to the model, relative advantage (β = .418, p < .000), compatibility (β = .395, p <
.000), and restaurant type (β = -.073, p < .007) are statistically significant predictors of the
intention to adopt tablet-based menus. The model showed that other variables did not have a
statistically significant impact on predicting customers’ adoption intentions of tablet-based
menus. Please see the results of the regression analysis in Table 7.
Since β > 0, the relationship between adoption intention of tablet-based menus and
relative advantage is positive, and the relationship between adoption intention of tablet-based

31
menus and compatibility is positive as well. In other words, participants’ predicted adoption
intention is equal to 1.847 + 0.458 (relative advantage) + 0.412 (compatibility) – 0.139
(restaurant type). Relative advantage, compatibility, and restaurant type were significant
predictors of adoption intention, thus, based on the results of the regression analysis, this
research fails to support hypotheses H1c, H1d, H2a, H2b, H2c, and H2d; and supports
hypotheses H1a, and H1b.
Table 7. Summary statistics, correlations and results from the regression analysis.
Variable
Mean
Std.
Deviation
Correlation
with Adoption
Intention
B
β
Adoption Intention 5.271 1.551
Relative Advantage 4.907 1.415 0.815 0.458 0.418***
Compatibility 5.156 1.485 0.808 0.412 0.395***
Complexity 2.605 1.151 -0.492 0.003 0.002
Perceived Risk 2.984 1.216 -0.521 0.014 0.011
Inertia 2.793 1.385 -0.553 -0.081 -0.072
Technology Anxiety 2.175 1.197 -0.162 0.081 0.062
Need for Interaction 4.227 1.587 -0.565 -0.063 -0.064
Previous Experience 5.198 1.123 0.188 -0.078 -0.057
Restaurant Type 2.016 0.817 -0.125 -0.139 -0.073**
* p < .05 ** p < .01 *** p < .001

32
Given that restaurant type was identified as one of the statistically significant predictors
of the intentions to adopt tablet-based menus, a follow-up ANOVA analysis with post-hoc tests
were conducted. ANOVA analysis revealed that customer intentions to adopt tablet-based menus
differ significantly across restaurants with different service levels. Post-hoc Tukey and Scheffe
tests were conducted to identify the specific differences between the three groups.
The following restaurant types were found to be significantly different (p < .05): quick
service restaurant (M = 5.437, SE = 0.133) and upscale restaurant (M = 4.965, SE = 0.129), and
midscale restaurant (M = 5.424, SE = 0.131) and upscale restaurant (See Table 8). In other
words, customer intentions to adopt tablet-based menus will differ between quick service
restaurant and upscale restaurant, and between midscale restaurant and upscale restaurant but not
between quick service restaurant and midscale restaurant. Hence, this research supports
hypothesis H3, and concludes that there is a statistically significant relationship between the
restaurant type and customer intentions to adopt tablet-based menus.
Table 8. Post hoc test.
Variable Comparison Variables Tukey Sig. Scheffe Sig.
Quick service restaurant
(M = 5.437, SE = 0.133)
Midscale restaurant
Upscale restaurant
0.131
0.472
0.997
0.030
0.013
0.472
0.998
0.040
Midscale restaurant
(M = 5.424, SE = 0.131)
Quick-service restaurant
Upscale restaurant
-0.013
0.459
0.997
0.035
-0.131
0.459
0.998
0.046
Upscale restaurant
(M = 4.965, SE = 0.129)
Quick-service restaurant
Midscale restaurant
-0.472
-0.459
0.030
0.035
-0.472
-0.459
0.040
0.046

33
Table 9 summarizes the hypotheses that this study failed to support as well as the
hypotheses supported by the findings of this research.
Table 9. Hypotheses testing results.
Hypothesis Finding
H1a. Customer perceptions of tablet-based menus’ relative advantage are
positively related to their intention to adopt tablet-based menus.
Supported.
H1b. Customer perceptions of tablet-based menus’ compatibility are
positively related to their intention to adopt tablet-based menus.
Supported.
H1c. Customer perceptions of tablet-based menus’ complexity are
negatively related to their intention to adopt tablet-based menus.
Failed to support.
H1d. Customer perceptions of tablet-based menus’ risk are negatively
related to their intention to adopt tablet-based menus.
Failed to support.
H2a. Inertia negatively influences the intention to adopt tablet-based
menus.
Failed to support.
H2b. Technology anxiety negatively influences the intention to adopt
tablet-based menus.
Failed to support.
H2c. Need for interaction negatively influences the intention to adopt
tablet-based menus.
Failed to support.
H2d. Previous experience positively influences the intention to adopt
tablet-based menus.
Failed to support.
H3. The customer intentions to adopt tablet-based menus will differ
across restaurant types.
Supported.

34
CHAPTER FIVE: DISCUSSION AND CONCLUSION
Conclusions and Discussion
New self-service technologies have broadened the literature and research scope in the
hospitality area. Previous studies have focused on the factors that affect the adoption intention of
a new technology by hospitality organizations (Wang & Qualls, 2007), such as the aspects that
influence the adoption intention of computing systems in a restaurant setting by employees (Ham
et al., 2008), the predictors of travelers’ attitudes toward using hotel self-service kiosks (Kim &
Qu, 2014), and the most suitable model that predicts employees’ intentions to use hotel
information systems (Huh, Kim, & Law, 2009). This study determined a gap in understanding
the impact of customer innovation characteristics on the intention to adopt a tablet-based menu.
The current study extends previous literature by identifying the antecedent predictors of
intention to adopt tablet-based menus taking into account restaurant type. Furthermore, this study
proves the theory proposed by Meuter et al. (2005) by implementing the model known as
customer trial of self-service technologies in the hospitality industry.
To the best of the author’s knowledge, this is the first study that aims to identify the
innovation characteristics and individual differences that predict the adoption intention of tablet-
based menus. Moreover, this is the first study that explores the differences of adoption intention
of tablet-based menus across different restaurant types. According to the previous literature on
adoption of innovation, innovation characteristics construct explains that customers’ perceptions
of an innovation determine the rate of adoption of such innovation (Rogers, 1995). Innovation
35
characteristics include compatibility, relative advantage, complexity, and perceived risk. The
study results indicated that out of the four innovation characteristics, only compatibility and
relative advantage are strong predictors of adoption intention of tablet-based menus. Therefore,
customers who feel that tablet-based menus are more compatible with their values and lifestyle,
and customers who perceive tablet-based menus as a better alternative than paper-based menus,
will be more likely to adopt tablet-based menus. Furthermore, this study suggested that the
adoption intention of tablet-based menus will vary across restaurant types. This statement was
partially confirmed by the results of this study. Specifically, it was found that customers dining
at a quick-service and at a midscale restaurant are more likely to adopt tablet-based menus than
customers dining at an upscale restaurant.
On the other hand, according to Meuter et al. (2005), individual differences such as
inertia, technology anxiety, need for interaction, and previous experience also predict the
adoption intention of a new technology. For the case of tablet-based menus, the current study
found that none of the individual differences predict the adoption intention of tablet-based
menus.
In the current study, the author failed to support the statements that suggested that
complexity and perceived risk are strongly related to the intention to adopt tablet-based menus.
One potential explanation is that customers perceive tablets as very user-friendly devices with
high reliability (Lee, Suh, & Park, 2012), thus tablet-based menus may not be perceived to be
complex or to have any risk associated with its use. Even more interesting, the results of this
study suggest that inertia, need for interaction, technology anxiety, and previous experience do
not have a direct effect in the adoption intention of tablet-based menus. In other words, this study
found that the intentions to adopt tablet-based menus are not affected by customer individual
36
differences with regard to inertia, technology anxiety, need for interaction, and previous
experience. This result can be attributed to the Meuter’s et al. (2005) finding, which suggests that
consumer readiness variables (role clarity, motivation, and ability) are better predictors of trial,
followed by innovation characteristics, and lastly individual differences.
Implications
The findings of this study suggest that relative advantage and compatibility are strong
predictors of trial. Furthermore, it was suggested that customers are more likely to adopt tablet-
based menus at quick-service and midscale restaurants. This finding is consistent with many
comments left by the participants of the study in the comments section of the survey. Some
respondents’ comments included the following: “I do like technology and the role it plays in
retail. But I think for upscale restaurants in particular, if you are paying that much more the least
you can get is actual service” and “I would feel comfortable using a tablet-based menu at a
quick-service or midrange restaurant, but at an upscale restaurant I would expect excellent
customer service from a waiter or waitress.” Hence, managers in quick-service and midscale
restaurants may express the advantages of using tablet-based menus instead of paper based-
menus. Features like the ease of use, presentation of menu items, nutritional information, and
origin of ingredients are characteristics that may be presented to customers (Rousseau, 2011). On
the other hand, this study suggests that upscale restaurants keep their detail-oriented speed of
service since customers patronizing this type of restaurants are expecting a more friendly and a
very customer-focused service.
Despite the apparent benefits of tablet-based menus, is important to understand that
managers may fail to implement successfully this type of technology in their restaurants even

37
though they communicate the advantages of using tablet-based menus over paper-based menus.
It has been found that customers embrace any type of self-service technologies if the technology
works perfectly fine, if it assists them in difficult situations, and if they perceive that it is better
than the interpersonal alternative (Bitner, Ostrom, Meuter, & Clancy, 2002). Accordingly, it is
suggested that managers should not only make visible the advantages of using tablet-based
menus, but also, the tablets should be reliable with high quality designs and easy use.
Likewise, Rogers (1995) suggested that one technique of making a technology more
compatible with customers’ values, experiences, and needs, is to position the innovation relative
to previous ideas. For example, since nowadays social media platforms like Facebook, Instagram
or Twitter are present in the daily lives of people, managers may make clear the compatibility
between tablet-based menus and social media by allowing customers to upload or post photos
and statuses through the tablet-based menu. This tool will not only increase the compatibility
between tablet-based menus and customers’ lifestyle, but it will also serve as a marketing tool for
managers and owners.
Limitations and Future Research
As with any research, several limitations of this study must be recognized. First, the
current study only adopted the antecedent predictors proposed by Meuter et al. (2005) in their
model leaving outside of the scope of this research the mediating consumer readiness variables
(role clarity, motivation, and ability). Thus, future research may implement the consumer
readiness variables as the mediators of the relationship between antecedent predictors and the
adoption intention of tablet-based menus.

38
In addition, according to survey respondents, the implementation of tablet-based menus is
more complicated than just knowing which innovation characteristics affect the adoption
intention of tablet-based menus. For instance, participants mentioned that they feel tablets will
make it more difficult to ask for substitutions to menu items or special requests on different
ingredients. Likewise, the complaining process will be different since guests are in contact with a
tablet. Therefore, future research should explore these concerns and maybe interview managers
of midscale restaurants that have implemented some type of tablet-based menu like Applebee’s
in order to recognize why these restaurants have not adopted tablet-based menus for the whole
ordering experience (from ordering to paying the bill). Similarly, participants mentioned the
concerns of implementing tablet-based menus from the server’s point of view (e.g. “I personally
would love a tablet ordering system. I just feel like it takes away from the usefulness of servers. I
worked as a waitress for many years and if I only had to hand someone a tablet and deliver their
food, I’d feel I didn’t deserve as much of tip as if I also talked with them and took their order”).
Therefore, future studies may take into consideration employees’ perceptions of tablet-based
menus and how this technology and employees can work together.
The findings presented in the current study cannot be generalized to the hospitality
industry as whole since this study only focus on a restaurant setting. Hence, future research may
adopt the conceptual model proposed here with the purpose of exploring other segments of the
hospitality industry such as airlines, hotels, or theme parks.
Finally, since this study employs written scenarios for each type of restaurant, another
study could be conducted in the future with the purpose of testing the variables in a real life
setting. Other variables like perceived waiting time and the extension on which tablet-based
menus decrease service failures could be measured by the use of real life scenarios.
39
REFERENCES
Bae, G., & Kim, D. (2014). The effects of offering menu information on perceived waiting time. Hospitality Marketing Management, 23(7), 746-767.
Beldona, S., Buchanan, N., & Miller, B. L. (2014). Exploring the promise of e-tablet restaurant
menus. International Journal of Contemporary Hospitality Management, 26(3), 367-382. Bitner, M. J., Ostrom, A. L., Meuter, M. L., & Clancy, J. A. (2002). Implementing successful
self-service technologies. The Academy of Management Executive, 16(4), 96-109. Brox, D. (2010). Fast food fast. QSR Magazine, Retrieve from:
http://www.qsrmagazine.com/ordering/fast-food-fast Buhrmester, M., Kwang, T., & Gosling, S. D. (2011). Amazon’s Mechanical Turk: a new source
of inexpensive, yet high-quality, data? Perspectives on Psychological Science, 6(3), 3-5. Casler, K., Bickel, L., & Hackett, E. (2013). Separate but equal? A comparison of participants
and data gathered via Amazon’s MTurk, social media, and face-to-face behavioral testing. Computers in Human Behavior, 29, 2156-2160.
CBS News. (2014). Tabletop tablets speed up restaurant service. CBS News, Retrieve from:
http://www.cbsnews.com/news/tabletop-tablets-speed-up-restaurant-service/ Chancey, B. (n.d.). 10 ways to save. QSR Magazine. Retrieved from:
http://www2.qsrmagazine.com/articles/features/131/saving-1.phtml Chin, W. W., & Gopal, A. (1995). Adoption intention in GSS: relative importance of beliefs.
Database for Advances in Information Systems, 26(2-3), 42-64. Cichy, R.F. & Wise, P. E. (1999). Food and Beverage Service, American Hotel & Lodging
Association, Washington, DC. Dabholkar, P. A. (1995). Consumer evaluations of new technology-based self-service options: an
investigation of alternative models of service quality. International Journal of Research in Marketing, 13, 29-51.
Davis, F. D. (1989). Perceived usefulness, perceived ease of use, and user acceptance of
information technology. MIS Quarterly, 13(3), 319-340. Dickerson, M. D., & Gentry, J. W. (1983). Characteristics of adopters and non-adopters of home
computers. Journal of Consumer Research, 10(2), 225-235.
40
Emenheiser D. A., Clay, J. M., & Palakurthi, R. (1998). Profiles of successful restaurant
managers for recruitment and selection in the US. International Journal of Contemporary Hospitality Management, 10(2), 54-62.
Field, A. (2009). Discovering statistics using SPSS. Sage Publications Ltd. Ham, S., Kim, W. G., & Forsythe, H. W. (2008). Determinants of restaurant employees’
technology use intention: Validating technology acceptance model with external factors via structural equation model. Information and Communication Technologies in Tourism 2008, 441-452.
Huh, H. J., Kim, T. T., & Law, R. (2009). A comparison of competing theoretical models for
understanding acceptance behavior of information systems in upscale hotels. International Journal of Hospitality Management, 28(1), 121-134.
Johnson, R. (n.d.). 4 styles of service in the restaurant business. Small Business, Retrieved from:
http://smallbusiness.chron.com/4-styles-service-restaurant-business-22923.html Kang, J., Jun, J., & Arendt, S. W. (2015). Understanding customers’ healthy food choices at
casual dining restaurants: using the value-attitude-behavior model. International Journal of Hospitality Management, 48, 12-21.
Kara, A., Kaynak, E., & Kucukemiroglu, O. (1995). Marketing strategies for fast-food
restaurants: a customer view. British Food Journal, 99(9), 318-324. Karahanna, E., Straub, D. W., & Chervany, N.L. (1999). Information technology adoption across
time: a cross-sectional comparison of pre-adoption and post-adoption beliefs. MIS Quarterly, 23(2), 183-213.
Kasavana, M. L. (2011). Tablets – t-commerce: innovative guest-facing applications. Hospitality
Upgrade Magazine, Retrieve from: http://www.hospitalityupgrade.com/_magazine/magazine_Detail.asp?ID=686
Kim, M., & Qu, H. (2014). Travelers' behavioral intention toward hotel self-service kiosks
usage. International Journal of Contemporary Hospitality Management, 26(2), 225-245. Kimes, S. E. (2008). The role of technology in restaurant revenue management. Cornell
University School of Hotel Administration, 49(3), 297-309. Kirk, R. E. (1995). Experimental Design: Procedures for the Behavioral Sciences. Pacific Grove,
CA: Brooks/Cole. LaBarbera, P. A., and Mazursky, D. (1983). A longitudinal assessment of consumer
satisfaction/dissatisfaction: the dynamic aspect of the cognitive process. Journal of Marketing Research, 20 (4), 393-404.
41
Lee, K., Suh, E., & Park, J. (2012). A study on determinant factors to purchase for tablet PC and smartphone by a comparative analysis. Paper presented at the Korean Management Science Society Conference, Seoul, Korea.
Mason, W., & Suri, S. (2012). Conducting behavioral research on Amazon’s Mechanical Turk.
Behavioral Research, 44, 1-23. Meuter, M. L., Ostrom, A. L., Bitner, M. J., & Roundtree, R. (2003). The influence of
technology anxiety on consumer use and experiences with self-service technologies. Journal of Business Research, 56, 899-906.
Meuter, M. L., Bitner, M. J., Ostrom, A. L., & Brown, S. W. (2005). Choosing among alternative
service delivery modes: an investigation of customer trial of self-service technologies. Journal of Marketing, 69, 61-83.
Noone, B. M., & Coulter, R. C. (2012). Applying modern robotics technologies to demand
prediction and production management in the quick-service restaurant sector. Cornell Hospitality Quarterly, 53(2), 122-133.
Nunnaly, J. (1978). Psychometric theory. New York, NY: McGraw-Hill. Olshavsky, R. W. & Spreng, R. A. (1996). An exploratory study of the innovation evaluation
process. Journal of Product Innovation Management, 13(6), 512-529. Oronsky, C. R., & Chathoth, P. K. (2007). An exploratory study examining information
technology adoption and implementation in full-service restaurant firms. International Journal of Hospitality Management, 26(4), 941-956.
Paolacci, G., Chandler, J., & Ipeirotis, P. G. (2010). Running experiments on Amazon
Mechanical Turk. Judgment and Decision Making, 5(5), 411-419. Parpal, M. (2015). Running successful take-out and delivery services. Retrieved from:
http://www.foodservicewarehouse.com/blog/running-successful-take-delivery-services/ Prabu, K. (2013). Tablets replacing paper menus in restaurants – a long-term trend or too
problematic? Tnooz, Retrieved from: http://www.tnooz.com/Tablets-replacing-paper-menus-in-restaurants-Is-this-trend-going-to-work-or-backfire
Rogers, E. M. (1995). Diffusion of Innovations. The Free Press, New York. Rousseau, C. (2011). Restaurants uploading menus on iPads for diners. Komonews, Retrieve
from: http://www.komonews.com/news/business/112807114.html Shah, K. (2014). Restaurants are turning to tablets to speed up service. Eater.com, Retrieve from:
http://www.eater.com/2014/9/23/6833871/restaurants-turning-to-tablets-to-speed-up-service
42
Shiv, B., & Huber, J. (2000). The impact of anticipating satisfaction on consumer choice. Journal of Consumer Research, 27: 202-216.
Swuimberghe, K. R., & Wooldridge, B. R. (2014). Drivers of customer relationships in quick-
service restaurants: the role of corporate social responsibility. Cornell Hospitality Quartertly, 55(4), 354-364.
Trochim, W. M. K., & Donnelly, J. P. (2008). The Research Methods Knowledge Base. Mason,
OH: Cengage Learning. Venkatesh, V., Morris, M. G., Davis, G. B., & Davis, F. D. (2003). User acceptance of
information technology: toward a unified view. MIS Quarterly, 27(3), 425-478. Venkatesh, V., Thong, J. Y. L., & Xu, X. (2012). Consumer acceptance and use of information
technology: extending the unified theory of acceptance and use of technology. MIS Quaterly, 36(1), 157-178.
Wang, Y. & Qualls, W. (2007). Towards a theoretical model of technology adoption in
hospitality organizations. International Journal of Hospitality Management, 26(3), 560-573. Yepes, M. F. (2015). Mobile tablet menus: attractiveness and impact of nutrition labeling
formats on millennials’ food choices. Cornell Hospitality Quarterly, 56(1), 58-67. Zulkifly, M. I., Zahari, M. S. M., Hafiz, M., & Jamaluddin, M. R. (2014). Theory and Practice in
Hospitality and Tourism Research. CRC Press Taylor & Francis Group, London.
43
APPENDIX 1:
QUESTIONNAIRE
Type of Restaurant Description
In this survey you may see questions about different types of restaurants: quick service,
midscale and upscale. Please review the definitions of these types of restaurants below and check
if you have dined in any of them.
• Quick service restaurant:
Ø Provides the quickest service.
Ø The décor is simple.
Ø Have a drive-through or a walk-up window.
Ø Dining space is very limited.
• Midscale restaurant:
Ø Employ waiters/tresses.
Ø Speed of service is expected to be longer.
Ø Family-friendly environment.
Ø Larger menu and more expensive items.
• Upscale restaurant:
Ø Atmosphere of grace and elegance.
Ø Elaborated menus and expensive prices.
Ø High perceived value.
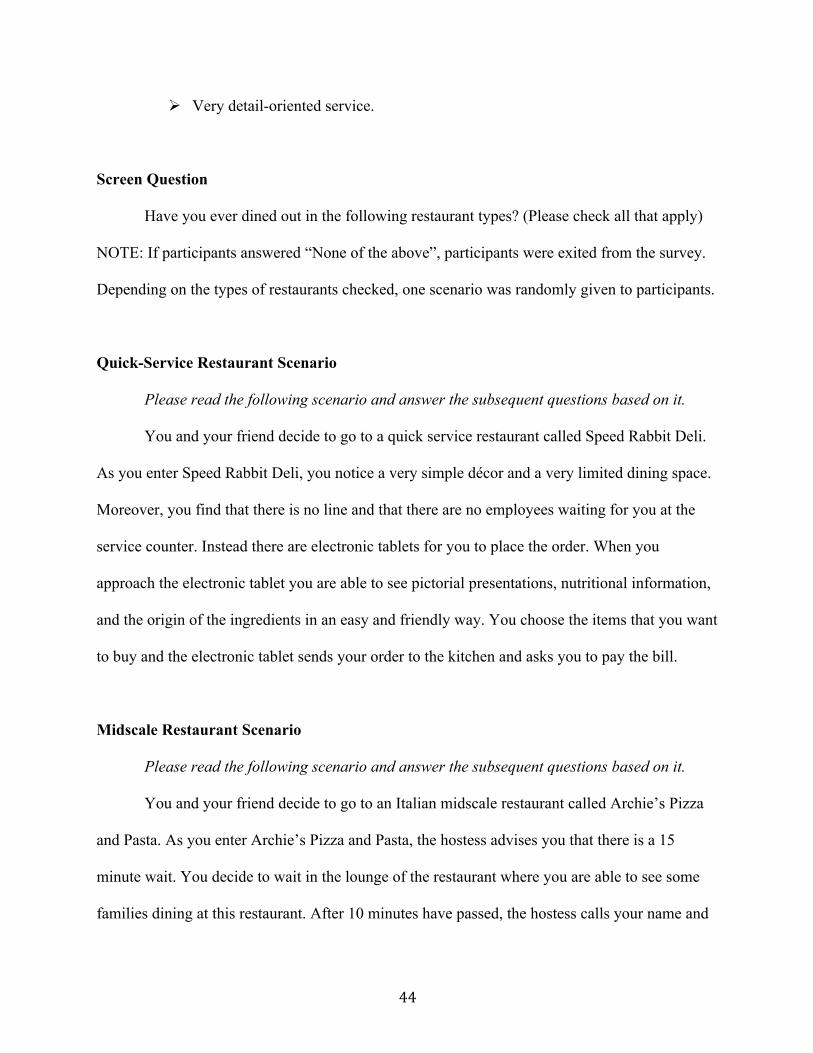
44
Ø Very detail-oriented service.
Screen Question
Have you ever dined out in the following restaurant types? (Please check all that apply)
NOTE: If participants answered “None of the above”, participants were exited from the survey.
Depending on the types of restaurants checked, one scenario was randomly given to participants.
Quick-Service Restaurant Scenario
Please read the following scenario and answer the subsequent questions based on it.
You and your friend decide to go to a quick service restaurant called Speed Rabbit Deli.
As you enter Speed Rabbit Deli, you notice a very simple décor and a very limited dining space.
Moreover, you find that there is no line and that there are no employees waiting for you at the
service counter. Instead there are electronic tablets for you to place the order. When you
approach the electronic tablet you are able to see pictorial presentations, nutritional information,
and the origin of the ingredients in an easy and friendly way. You choose the items that you want
to buy and the electronic tablet sends your order to the kitchen and asks you to pay the bill.
Midscale Restaurant Scenario
Please read the following scenario and answer the subsequent questions based on it.
You and your friend decide to go to an Italian midscale restaurant called Archie’s Pizza
and Pasta. As you enter Archie’s Pizza and Pasta, the hostess advises you that there is a 15
minute wait. You decide to wait in the lounge of the restaurant where you are able to see some
families dining at this restaurant. After 10 minutes have passed, the hostess calls your name and

45
sits you at the table. The hostess shows you an electronic tablet from which you will see the
menu, place your order and pay your bill. In the tablet-based menu you are able to see pictorial
presentations with videos of food preparation, nutritional information, and the origin of the
ingredients in an easy and friendly way. You see the entire menu on the tablet, choose the items
you want to buy and the electronic tablet sends your order to the kitchen. A server brings your
food and, when you finish, you pay the bill through the electronic tablet.
Upscale Restaurant Scenario
Please read the following scenario and answer the subsequent questions based on it.
After making a reservation at an upscale restaurant called The Manor, you and your
friend arrive at the restaurant and the hostess asks for your name. The hostess confirms your
reservation and directs you to your reserved table. During the walk to the table you are able to
feel a quiet atmosphere with slow music, candles and white tablecloth. Upon arrival at the table,
the hostess shows you an electronic tablet from which you will see the menu, place your order
and pay your bill. In the tablet-based menu you are able to see pictorial presentations with videos
of food preparation, nutritional information, and the origin of the ingredients in an easy and
friendly way. Moreover, the tablet has a special wine list application resembling a virtual wine
cellar. You see through the tablet the entire menu, choose the items you want to buy and the
electronic tablet sends your order to the kitchen. A server brings your food and, when you finish,
you pay the bill through the electronic tablet.
Adoption Intention
(One item adapted from Chin and Gopal (1995))
46
1. Please answer the following questions based on the scenario that you just read:
Assuming that any decision to use tablet-based menus would be totally up to you, and
tablet-based menus were available, how would you rate your potential use of it in the
future for the restaurant setting described?
(One item adapted from Karahanna et al. (1999))
2. Please indicate your agreement level with the following sentence:
In a similar restaurant type, I intend to adopt tablet-based menus over paper-based menus
in the future any time they are available.
Anticipated Satisfaction
(Three items adapted from Yang and Mattila (2013))
3. How would you feel if you go to the restaurant setting described and you have to order
through an electronic tablet?
Manipulation Check Question
4. Which of the following types of restaurants was described on the scenario at the
beginning of the survey? Please check one.
Rapport Questions
5. Have you ever used an electronic tablet?
6. Have you ever used an electronic tablet-based menu?
7. How many times do you go to the type of restaurant described in the scenario?
8. What type of restaurant do you visit most frequently?
47
Relative Advantage
(Three items adapted from Meuter et al. (2005))
9. Please indicate your agreement level with the following sentences:
• Using tablet-based menus improves the ordering process.
• Overall, I believe using the tablet-based menu is advantageous.
• I believe the tablet-based menus, in general, are the best way to order at a
restaurant.
Compatibility
(Three items adapted from Meuter et al. (2005))
10. Please indicate your agreement level with the following sentences:
• Using tablet-based menus is compatible with my lifestyle.
• Using tablet-based menus is completely compatible with my needs.
• Tablet-based menus fit well with the way I like to get things done.
Complexity
(Three items adapted from Meuter et al. (2005))
11. Please indicate your agreement level with the following sentences:
• I believe that tablet-based menus are cumbersome to use.
• It is difficult to use tablet-based menus.
• I believe that tablet-based menus are easy to use.

48
Perceived Risk
(Three items adapted from Meuter et al. (2005))
12. Please indicate your agreement level with the following sentences:
• I am unsure if tablet-based menus perform satisfactorily.
• Overall, using tablet-based menus is risky.
• I am sure tablet-based menus perform as well as regular paper-based menus.
(One item created to improve the reliability of the scale)
• There is a risk that my order will be lost when ordering fro a tablet-based menu.
Inertia
(Three items adapted from Meuter et al. (2005))
13. Please indicate your agreement level with the following sentences:
• Changing ordering methods from paper-based to tablet-based menus would be a
bother.
• For me, the cost in time, effort, and grief to switch ordering methods is high.
• It’s just not worth the hassle for me to switch ordering methods.
Technology Anxiety
(Four items adapted from Meuter et al. (2005))
14. Please indicate your agreement level with the following sentences:
• I feel apprehensive about using technology.
• Technical terms sound like confusing jargon to me.

49
• I have avoided technology because it is unfamiliar to me.
• I hesitate to use most forms of technology for fear of making mistakes I cannot
correct.
Need for Interaction
(Three items adapted from Meuter et al. (2005))
15. Please indicate your agreement level with the following sentences:
• Personal contact with an employee makes ordering enjoyable for me.
• Personal attention by a customer service employee is important to me.
• It bothers me to use a machine when I could talk to a live person instead.
Previous Experience
(Two items adapted from Meuter et al. (2005))
16. Please indicate your agreement level with the following sentences:
• I commonly use lots of automated systems when dealing with other businesses.
• I use a lot of technologically based products and services.
(One item created to improve the reliability of the scale)
• I have a lot of experience using self-service technologies (e.g. ordering food
online, airport kiosk).
Demographics
17. Your gender:
18. Your current marital status:

50
19. The highest level of education you have completed:
20. Your age:
21. Your approximate annual household income:
22. How many people are in your household (including you)?
23. Do you have children under 18 years old living in your household?
24. In which state or U.S. territory do you live?
25. Which of the following areas best describes where you currently live?
26. Do you have any comments regarding this survey?
51
APPENDIX 2:
IRB APPROVAL LETTER
September 28, 2015
Nataly Suarez
USF Sarasota/Manatee - College of Hospitality and Tourism Leadership
RE: Exempt Certification
IRB#: Pro00023790
Title: Are Customers Ready for Tablet-Based Menus?
Dear Dr. Suarez:
On 9/28/2015, the Institutional Review Board (IRB) determined that your research meets criteria
for exemption from the federal regulations as outlined by 45CFR46.101(b):
(2) Research involving the use of educational tests (cognitive, diagnostic, aptitude, achievement),
survey procedures, interview procedures or observation of public behavior, unless: (i)
information obtained is recorded in such a manner that human subjects can be identified, directly
or through identifiers linked to the subjects; and (ii) any disclosure of the human subjects'
responses outside the research could reasonably place the subjects at risk of criminal or civil
liability or be damaging to the subjects' financial standing, employability, or reputation.
52
Approved Items:
Study Protocol.docx
IRB Consent Form.docx
As the principal investigator for this study, it is your responsibility to ensure that this research is
conducted as outlined in your application and consistent with the ethical principles outlined in
the Belmont Report and with USF HRPP policies and procedures.
Please note, as per USF HRPP Policy, once the Exempt determination is made, the application is
closed in ARC. Any proposed or anticipated changes to the study design that was previously
declared exempt from IRB review must be submitted to the IRB as a new study prior to initiation
of the change. However, administrative changes, including changes in research personnel, do not
warrant an amendment or new application.
Given the determination of exemption, this application is being closed in ARC. This does not
limit your ability to conduct your research project.
We appreciate your dedication to the ethical conduct of human subject research at the University
of South Florida and your continued commitment to human research protections. If you have any
questions regarding this matter, please call 813-974-5638.
Sincerely,
Kristen Salomon, Ph.D., Vice Chairperson
USF Institutional Review Board