are behavioral choices in the ultimatum and investment games
TRANSCRIPT
WORKING PAPER SERIES
Impressum (§ 5 TMG) Herausgeber: Otto-von-Guericke-Universität Magdeburg Fakultät für Wirtschaftswissenschaft Der Dekan
Verantwortlich für diese Ausgabe:
Otto-von-Guericke-Universität Magdeburg Fakultät für Wirtschaftswissenschaft Postfach 4120 39016 Magdeburg Germany
http://www.fww.ovgu.de/femm
Bezug über den Herausgeber ISSN 1615-4274
1
Are Behavioral Choices in the Ultimatum and
Investment Games Strategic?
by Lora R. Todorova1 and Bodo Vogt2
Abstract
This paper experimentally examines the relationship between self-reporting risk
preferences and behavioral choices in the subsequently played dictator, ultimatum
and investment games. The results from these experiments are used to discern the
motivational bases of behavioral choices in the ultimatum and investment games.
The focus is on investigating whether strategic considerations are important for
strategy selection in the two games. We find that self-reporting risk preferences does
not alter the dictators’ offers and trusters’ investments, while it significantly
decreases the proposers’ offers and leads to a substantial decrease in the amount
trustees give back to their partners. We interpret these results as evidence that the
decisions of proposers in the ultimatum game and trustees in the investment game
are strategic.
Keywords coordination game · dictator game · ultimatum game · investment game ·
questionnaire · risk scale · risk preferences
JEL Classification C7 · C91 · D8
1 Faculty of Economics and Management, Empirical Economics Research, Otto-von-Guericke University Magdeburg, P. O. Box 4120, D-39106 Magdeburg, Germany. E-mail: [email protected]. 2 Faculty of Economics and Management, Empirical Economics Research, Otto-von-Guericke University Magdeburg, P. O. Box 4120, D-39106 Magdeburg, Germany. E-mail: [email protected].
2
1. Introduction The role of individual risk attitudes in the determination of outcomes in many
economic games is indisputable. Coordination games, for example, are one class of
games for which it is well-known that beliefs and risk preferences jointly determine
strategy choices. The dictator game, on the other hand, by its nature, is a degenerate
game that removes incentives for strategic behavior. There are, however, also games
for which the motivational bases of behavioral choices are still a debatable issue.
The ultimatum game (Güth et al. 1982) and the investment game (Berg et al. 1995)
are two examples of such games. Despite the great number of studies dedicated on
analyzing them, researchers have not come to an agreement regarding the
relationship between risk attitudes and behavioral choices in these games.
In this paper, we present results from a laboratory experiment that adds one
piece of evidence to the discussion about the motivational bases of behavioral
choices in the ultimatum game (UG) and the investment game (IG). Specifically, we
examine whether decisions in these games are influenced by the act of answering a
set of risk questions and use our results to draw inferences about the relationship
between risk attitudes and behavioral choices in each of the studied games. For
methodological reasons, we also study the behavior in the dictator game (DG). For
each game, we consider two conditions—one in which subjects directly play a
standard version of the corresponding game (the control condition) and one in which
subjects first report their own risk preferences on a short questionnaire and then play
the same game as the participants in the control condition (the treatment condition).
We then compare behavioral choices in the two conditions. We stress the point that
we do not argue that the risk questionnaire we use is a good method for measuring
risk preferences. Rather, we are interested to study the link between the act of stating
one’s own risk preferences and behavioral choices in the three economic games.
Standard economic theory predicts that subjects, who complete a questionnaire
about their own risk preferences before playing a certain economic game, will not
make different choices from those who play the game right away (internal
consistency of preferences assumption). Deviations from these predictions can be
3
used to better understand the determinants of behavioral choices in the games we
examine.
A risk questionnaire is used in this study with the purpose of investigating the
relationship between risk preferences and behavioral choices in the DG, UG, and IG.
This is motivated by the “unexpected” in light of the standard economic theory
finding of Berninghaus et al. (2011) that states that the mere measurement of
subjects’ risk preferences on a risk scale systematically alters strategic behavior in a
subsequently played coordination game. Berninghaus et al. (2011) report that the
proportion of subjects who choose the risk dominant strategy in the coordination
game is significantly higher for subjects who have first reported their own risk
preferences. After controlling for subjects’ first-order beliefs, Berninghaus et al.
(2011) find that the act of stating one’s own risk preferences does not change beliefs.
Within a best-response correspondence framework, this result implies that subjects
had become more risk-averse after they reported their risk preferences. Behavioral
arguments, such as focal points, framing and uncertain preferences offer an
alternative explanation of the effect that the risk questionnaire produced on strategy
choices in the coordination game.
The purpose of this study is twofold. First we aim at extending the results of
Berninghaus et al. (2011) beyond coordination games in finding out how a simple,
non-strategic decision situation, such as stating one’s own risk preferences
influences behavior in the DG, UG, and IG. Second, we use the results from the
effect that the risk questionnaire produces on behavioral choices to analyze the
motivational bases of decision-making in the studied games. Specifically, we are
interested in drawing inferences about the question whether decisions in the UG and
IG involve strategic considerations. Our study relates to a large body of literature
analyzing the determinants of strategy choices in the UG and IG.
The UG and the DG present very similar bargaining situations with one
difference between them being that the passive second player in the DC is given the
ability to reject the proposer’s offers in the UG. In both games, experimental results
show that people strongly deviate from the predictions of the subgame perfect
equilibrium. Another difference between the games is that while there is little
controversy in explaining the discrepancy between the theoretical predictions and
4
actual choices in the DG with reference to altruism or fairness considerations,
explaining the results from the UG by mere concerns for fairness turns out to be
troublesome. Henrich et al. (2005) describe fairness as the readiness of people to
incur personal costs in order “to change the distribution of material outcomes among
others, sometimes rewarding those who act pro-socially and punishing those who do
not.” Empirical findings suggest that people have preferences for being treated fairly
(see e.g., Kahneman et al. 1986). Camerer and Thaler (1995), however, argue that
preference for fairness is not an innate but rather a learnt manner, which is expected
in social settings. The conclusion of Camerer and Thaler (1995) leaves room for
speculations that behavior that seems fair might not be driven by preferences for
fairness per se but rather be dictated by the desire to adhere to cultural and social
norms.
The question whether fairness can explain the unexpectedly high positive
offers in the UG was extensively studied. Fehr and Schmidt (1999) model fairness as
self-centered inequality aversion. They define inequality aversion as the tendency of
people to resist inequitable outcomes, often at a personal cost. They show that the
results from the UG experiments could be explained by allowing subjects’ utility
function to incorporate the inequality aversion preferences. The theoretical work of
Fehr and Schmidt (1999) suggests that proposers in the UG make considerable
positive offers because they dislike inequality and care about fairness.
Forsythe et al. (1994) use a dictator control game to test whether fairness
considerations can explain the results in the UG. They find that the average
allocation in the DG (20 percent) is much lower than the average offer in the UG
(40-50 percent) and conclude that fairness must only be one factor that determines
proposers’ choices in the UG. Güth and van Damme (1998) use a modified version
of the UG in which an inactive third player is introduced. They compare results from
different information conditions and conclude that proposers were not interested in
fairness per se. They simply wanted to seem fair. Kagel et al. (1996) also find that
the impression of fairness and not fairness itself motivated proposers in an UG
experiment. Roth et al. (1991) and Bahry and Wilson (2006) find evidence that
proposers make offers that are the best replies to actual pattern of rejections or to the
norm of fairness. This result, consistent with the argument of Camerer and Thaler
5
(1995) that fairness is a learned manner, implies that proposers in the UG are simply
being strategic.
Andreoni et al. (2003) who conducted experiments with a convex ultimatum
game carried out a more explicit investigation of the relationship between risk
aversion and decisions in the ultimatum game. In their game, responders are allowed
to shrink the size of the pie and not simply make reject or accept decisions. Thus, the
convex game is less risky to proposers than the standard game. Andreoni et al.
(2003) report that about half of the subjects care only about money maximization,
while the other half reveals a preference for fairness. They also find that risk
aversion is important among money maximizing proposers who, realizing that the
less risky convex game presents an opportunity to earn more money, exploit their
bargaining power by making offers that are more aggressive. Carpenter et al. (2005)
collect measures of risk aversion by survey questions and find that more risk-averse
proposers offer more in the UG. This result, however, is not statistically significant3.
Consensus about the determinants of choices in general and the role of risk
preferences in particular is missing also in the literature dealing with investment
games. In the IG, the predictions of the subgame perfect equilibrium also fail to
capture actual choices. The first part of the IG is often considered to provide a
behavioral measure of trust, while the second part is assumed to provide a measure
of trustworthiness. Upon careful contemplation on the motivational bases of the
truster’s and trustee’s choices in the IG, however, it is not clear what the IG actually
measures. Some of the influences on the decision-making process in the IG
discussed in the literature are as follows. First, the trustee may be driven by her
desire to reciprocate on the truster’s trust or/and they can reflect her concerns for
altruism and fairness. In this paper, we stress the importance of including also
strategic considerations in the analysis of trustee’s choices. The strategic aspect of
trustee’s decision-making, to our knowledge, has not yet been discussed in the
literature and we will elaborate on it in detail in some of the following sections of
the paper. Second, the truster in the IG may make her choices based on the
3 Carpenter et al. (2005) use a risk measure derived from the mean of the answers given on the following two questions: 1) they asked at what price subjects would be willing to sell a lottery ticket with a 50% chance of paying US$0 and a 50% chance of paying US$10; 2) they asked subjects how much they would be willing to pay for such a ticket.
6
expectation of reciprocation of her trust, expectation of altruistic and fairness
concerns of her partner, her own altruistic motives, her attitude toward risk or any
combination of the above-mentioned (see Kiyonari et al. 2006 for a discussion of
possible determinants of behavior in the IG).
The trustee in the IG and the dictator in the DG face very similar behavioral
choices. Both players must divide an endowment of a fixed size between themselves
and another party, anyway they would prefer. The difference between the two games
lies in who provides the endowment to be divided. While the trustee in the IG owes
the chance to earn more on the truster, the dictator in the DG is provided the
endowment directly from the experimenter and she owes nothing to the other party.
The similarity between the behavioral choices that trustees and dictators are faced
with is probably the reason why it has not been investigated in the literature whether
the second part of the IG involves also strategic aspects (we already mentioned that
the DG, by its nature, removes incentives for strategic behavior). In contrast, the
uncertainty involved in the behavioral choice of the truster in the IG has attracted
much attention and the question whether risk preferences are related to the decision
to trust has been addressed in several experimental studies.
Eckel and Wilson (2004) measure risk in two risky choice tasks (one based on
Holt and Laury 2002 and one mimicking the payoff structure of the trust game) and
in a survey investigate the correlation between the different risk measures and the
decision choices made in the IG. They do not find significant correlations between
the risky choices and the trusting behavior. Ashraf, Bohnet, and Piankov (2006) use
a measure of risk, derived from a price list procedure, and along with a number of
demographic variables include it as an explanatory variable in a regression aiming to
explain variations in the decision to trust. They do not find evidence that risk
attitudes explain the variance in trust. Houser, Schunk, and Winter (2010) use a
measure of risk based on Holt and Laury (2002) and examine whether the elicited
risk preferences predict behavior in an investment game and a risk game with
identical payoff structure. Their results show that risk attitudes predict decisions in
the risk conditions but not in the trust conditions.
Evidence supporting the view that risk preferences predict decisions in the
trust game is reported by Schechter (2007). He compares agents’ actions in a

7
traditional trust game and in a similar gambling game and finds that higher bets in
the gambling game are associated with higher investments in the IG. Johansson-
Stenman, Mahmud, and Martinsson (2005) find evidence that shows stake size
matters in the trust game and argue that one possible explanation of their results is
that the first part of the trust game measures risk preferences rather than trust. Karlan
(2005) reports results from a field experiment that indicate that the behavioral choice
of the first player in the IG is determined by both trust and her propensity to take
risks. He finds that subjects who invest more in the IG are more willing to take on
risks.
The overview of the related literature shows that the question, whether the
behavioral choices of players in the UG and the IG involve incentives for strategic
behavior is a delicate one with a no clear answer. We adopt a novel approach to
address this question. We report the following findings. The data from the DG
experiments show no difference in behavioral choices between the condition with
and without questionnaire. This result indicates that subjects’ preferences for
fairness do not change after the act of self-reporting risk preferences. In the UG, we
find that the act of stating one’s own risk preferences significantly alters the
distribution of the proposers’ offers. Proposers who self-reported their risk
preferences made on average lower offers than proposers who directly played the
UG. From the findings in the DG, we know that this result is not triggered by a
change in subjects’ preferences for fairness. Consequently, we conclude that
proposers’ risk considerations change after they self-report their risk preferences and
as a result, they make lower offers in the condition with questionnaire. In other
words, we find support for the idea that decision-making in the UG is strategic. In
the IG, there is no difference between the distribution of trusters’ choices in the
condition with and without questionnaire. This result combined with the results from
the DG and UG implies that trusters’ decisions are not driven by strategic
considerations. We, however, argue that the first part of the IG involves a severe
identification problem (there are many possible determinants of behavior and it is
difficult to discern their marginal effects), which makes it very difficult to study the
role that trusters’ risk preferences play in the determination of their strategy choices
by a single experiment. Our findings for the second part of the IG are mixed. Trustee
8
in the condition with questionnaire give on average lower return to their partners
than trustees in the condition without questionnaire. This difference, albeit relatively
high (17percent), is insignificant. We, however, find a significant positive
correlation between the decisions of trusters and trustees in the condition with
questionnaire. In contrast, the correlation between trusters’ and trustees’ choices is
insignificant in the condition without questionnaire. We interpret these results as
evidence that trustees’ decisions in the IG involve strategic considerations.
The paper proceeds as follows. Section 2 presents the experimental design and
procedure. Section 3 develops the research hypotheses and presents the results.
Section 4 provides a discussion of the main results. Section 5 concludes.
2. Experimental Design and Procedure
2.1. Experimental Design We employ a two conditions between-subject design. In one condition, subjects
directly played a standard version of the dictator game, the ultimatum game, or the
investment game (conditions D, U, and I). In the other condition, they first filled out
a short questionnaire asking about their risk preferences and then played one of the
three games (conditions Q_D, Q_U, and Q_I)4. Each subjects participated in exactly
one condition. Our analysis is based on comparisons of choices between conditions
with and without questionnaire.
The questionnaire we use in this study is identical to the one used by
Berninghaus et al. (2011). It consisted of three questions. All of them were adapted
from the general risk question in the German Socio-Economic Panel Survey
(SOEP)5. In the first two questions, subjects were asked whether they like taking
risks and whether they always try to avoid risks, respectively. Admissible answers
were “Agree,” “Disagree,” or “Neither agree nor disagree.” In the third question,
subjects were asked to determine their risk preferences with a greater precision by
4 In Condition Q_U, only subjects in the role of a Proposer completed the questionnaire. 5 The general risk question in the SOEP survey is as follows: “How do you see yourself: are you generally a person who is fully prepared to take risks or do you try to avoid taking risks? Please tick a box on the scale, where the value 0 means: “not at all willing to take risks” and the value 10 means “very willing to take risks”.
9
positioning themselves on a risk scale between 0 (maximal risk loving preferences)
and 100 (maximal risk averse preferences). Upon completing the questionnaire in
conditions Q_D, Q_U, and Q_T, participants were aware of the fact that the
experiment included also a second task but they were not given any information
regarding the nature of that task.
Economists are generally skeptical about the use of survey questions as a tool
for measuring risk preferences with their major concern being that such questions
are incentive incompatible. Measures of risk-preferences derived from survey
questions are also very sensitive to framing effects. The use of risk scales, however,
has a long history in the psychological literature and can be traced back to the 1950s
(see Grable 2008 for an overview). Until 1980s, many different scales were
developed but they failed to produce consistent results. MacCrimmon and Wehrung
(1986) reason that these inconsistencies are largely due to the one-dimensional
nature of the questions. They argue that a more accurate risk measure would be
produced if one-dimensional questions (e.g., “how risk tolerant are you”) are
replaced by carefully designed psychometric questionnaires that capture the
multidimensional nature of risk. MacCrimmon and Wehrung (1986) also note that
most people overestimate their risk tolerance on one-dimensional scales. However,
as the general risk question in the SOEP survey indicates one-dimensional risk
questions are still used in some household surveys.
Because the questionnaire we use is incentive incompatible and includes only
one-dimensional questions, we treat the answers given on it with caution. We
recognize that most subjects can report their underlying risk preferences only with
an error of whose magnitude we are unaware. We incorporate the results from the
questionnaire into our analysis but we do this because we hope that they will provide
some additional insights about the motivational bases of the subjects’ behavior in the
DG, UG, and IG. The focus of this paper, however, is to examine the link between
the risk questions and behavior in the DG, UG, and IG and to use this information
for drawing conclusions about the incentives for strategic behavior in the UG and
IG. That is, the fact whether subjects answered the questionnaire or not is of main
interest to us and not the exact answers given on the questionnaire. We now proceed
with a discussion of the three games.
10
In the DG, UG, and IG, subjects were randomly assigned an anonymous
partner and a role—a dictator or a receiver, a proposer or a responder, and a truster
or a trustee, respectively. Dictators in the DG had to divide an endowment of 10
euros between themselves and their partners in any way that they preferred.
Receivers were passive players who at the end of the experiment received the
amount of 10 euros that was allocated to them.
Proposers in the UG were also asked to decide how to allocate an endowment
of 10 euros between themselves and their partners. In contrast to the receivers in the
DG, however, responders in the UG were not passive players but rather had the
ability to reject proposers’ offers. Decisions in the UG were made sequentially.
First, the proposers made an allocation suggestion. Responders were then informed
about the offers of their partners and were asked to either accept or reject the offer
they received. Pairs, for which the responder accepted the proposer’s offers,
received the 10 euros in portions as determined by the proposer. Pairs, for which the
responder rejected the proposer’s offer, did not receive the 10 euros and both
partners had a payoff of zero.
In the IG, both trusters and trustees received a fee of 10 euros. The truster had
to decide how much of her fee of 10 euros to entrust to her partner. Any amount
entrusted by the truster was tripled by the experimenter and transferred to the
trustee. The trustee then had to determine the amount of the tripled investment she
wanted to return to the truster. At the end of the experiment, trusters received the
amount of the 10 euros that they did not invest plus the part of the tripled investment
that was returned to them by their partners. Trustees received their own fee of 10
euros plus the amount of the tripled investment that they did not send back to the
truster. Participants in all games had perfect knowledge about how their payoffs and
those of their partners were calculated.
2.2. Experimental Procedure All experiments were carried out at MaXLab, the experimental laboratory of the
University of Magdeburg, between August 2011 and March 2012. Participants were
recruited using ORSEE software (Greiner 2004) from a pool mostly of students from
various faculties. All sessions were hand-run. The experimental instructions were
11
provided in German. We collected data from a total of 257 pairs which were
distributed among the different conditions as follows—30 pairs in condition Q_D,
30 pairs in condition D, 62 pairs in condition Q_U, 56 pairs in condition U, 44 pairs
in condition Q_I, and 35 pairs in condition I.
Regardless of the game or condition in which subjects participated, they were
always assigned a role and a partner using the same procedure. In all three games
(DG, UG, and IG), we used a neutral labeling of the roles. In the experimental
instructions, dictators, proposers, and trusters were referred to as Player 1 and
receivers, responders, and trustees were referred to as Player 2. When subjects
arrived at the laboratory, they were asked to draw a ball from an urn containing an
even number of balls corresponding to the number of participants invited in the
given session. Balls were either red or green. Balls from each color were numbered
consecutively. Thus, the urn contained two balls of each number, one of which was
red and the other green. Subjects who drew a red ball were assigned the role Player 1
and subjects who drew a green ball were assigned the role Player 2. Participants who
drew a ball labeled with the same number were matched with each other. Subjects
who played the games in the role of Player 1 and Player 2 were seated in two
different laboratories in a single cabin with arrangements to ensure their privacy. At
the end of the experiment, Player 1 and Player 2 were separately paid. Thus, partners
who played together remained anonymous during and after the experiment. During
the experiment, no communication was allowed among the participants. The written
instructions were explained to the subjects also orally and they were instructed to
raise their hands if they had questions that were then answered individually.
In conditions Q_D, Q_U, and Q_I, immediately after filling out the
questionnaire, subjects handed out their answer sheets and received the experimental
instructions for the second part of the experiment. In conditions D and Q_D, the
experiment ended when the dictators made their allocation decisions. Dictators and
receivers were then privately paid in accordance with their own decisions or the
decisions of their partners, respectively. In conditions U and Q_U, proposers and
responders made their decisions sequentially. Subjects were paid as explained in the
previous section. In conditions I and Q_I, trusters completed their decisions on an
answer sheet and handed them to the experimenter. She then carried over these
12
decisions into the answer sheets of the trustees together with a number
corresponding to the tripled investment and distributed them to the trustees who in
turn made their decisions. After this, the experiment ended and subjects were
privately paid.
The duration of the experiment varied across conditions, ranging between 20
and 45 minutes. For filling out the questionnaire, no remuneration was provided.
However, subjects were instructed that their answers will be used for a research
project and they were asked to try to be as accurate in their answers as possible. For
the participation in the three games, subjects were paid in accordance with their own
decisions and the decisions of their partners. Depending on the condition and the
role that subjects had, payoffs varied between 0 euro and 40 euros.
3. Hypotheses and Results We now present our hypotheses and results. The internal consistency of preferences
assumption of standard economic theory states that in theoretically equivalent
situations people will always choose the same alternative. We use this assumption to
make predictions about the relationship between the act of stating one’s own risk
preferences and behavioral choices in the DG, UG, and IG: The act of stating one’s
own risk preferences does not have any impact on behavioral choices made in a
subsequently played dictator game (Hypothesis 1), ultimatum game (Hypotheses 2),
and investment game (Hypothesis 3). We test these hypotheses for dictators in the
DG, proposers in the UG, and both trusters and trustees in the IG.
The experimental data from the DG, UG, and IG experiments are given in
Table 1. The first row of the table reports the total number of dictators in conditions
D and Q_D, proposers in conditions U and Q_U, trusters in conditions I and Q_I,
and trustees in conditions I and Q_I. The number of trustees in both conditions I and
Q_I is lower than the number of trusters in the same conditions because we excluded
from our analysis trustees who did not receive anything from their partners. In the
next two rows, we report the mean and median choices. The mean and median
dictator’s and proposer’s offers are expressed as a percentage of the total
endowment of 10 euros. The mean and median truster’s investments are expressed
as a percentage of truster’s show-up fee of 10 euros and the mean and median
13
amount trustees send back to their partner are expressed as a percentage of truster’s
investment. The last row of the first panel reports the p-values obtained by means of
the Wilcoxon rank-sum test, which we use to test the null hypothesis that behavioral
choices in the conditions with and without questionnaire are independent samples
from identical continuous distributions with equal medians. For the moment, we
postpone the discussion of the results depicted in the lower panel of Table 1.
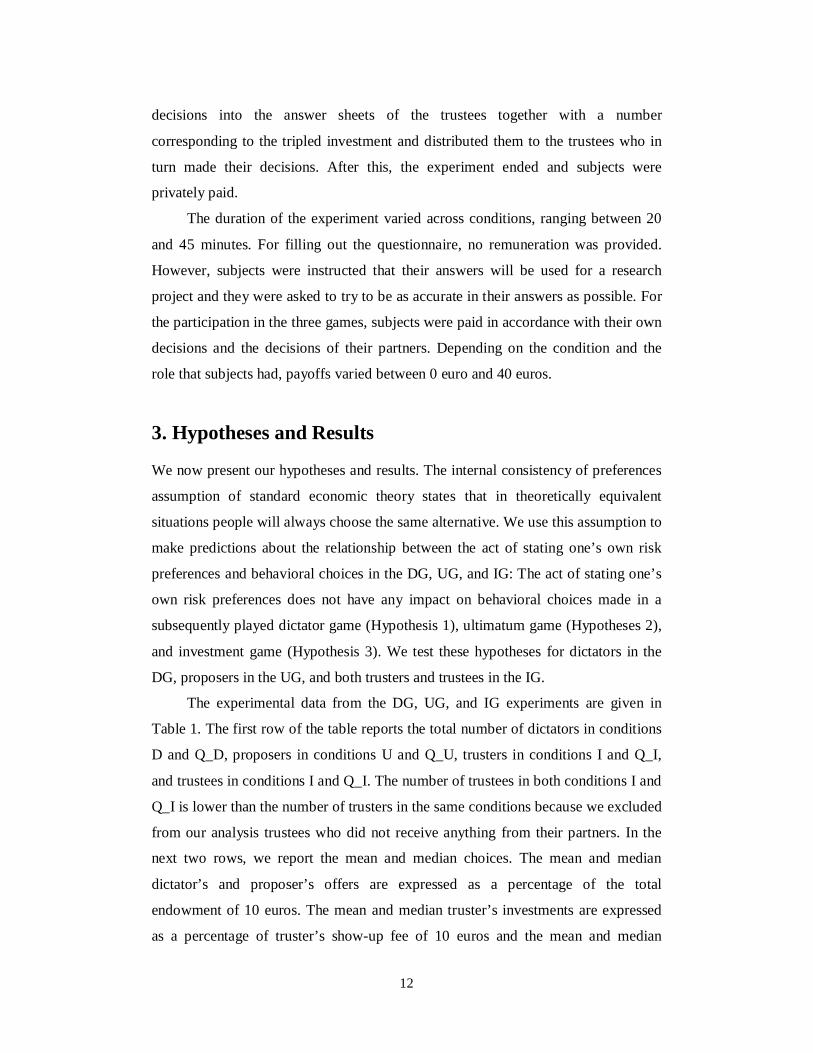
TABLE I
Summary statistics from the Dictator, Ultimatum, and Investment Games
Condition D Q_D U Q_U I Q_I I Q_I Dictators Proposers Trusters Trustees Participants 30 30 56 62 34 44 25 35 Mean 23% 24% 43.2%39.5% 43.1%46.0% 132% 120% Median 20% 20% 50% 40% 40% 50% 150% 133% p-value 0.74 0.045 0.65 0.37 (**) Correlation - - - 0.13 0.42 p-value - - - 0.26 0.006 (one-tailed) (***) * Significant at the 10 percent level ** Significant at the 5 percent level *** Significant at the 1 percent level
Looking first at the summery data from the DG experiments, we observe that
dictators from condition Q_D made a slightly higher average offer than dictators in
condition D did. The median dictator’s offers are identical in both conditions. The p-
value of 0.74 indicates that dictators’ allocations in condition Q_D were not affected
by the act of answering the questionnaire. Panel a) in Figure 1 also confirms this
observation. It shows that the histograms of dictators’ offers in conditions Q_D and
D are indeed very similar. Based on these findings, we cannot reject Hypothesis 1.
We conclude that the act of stating one’s own risk preference does not change
subjects’ preferences for fairness. This observation will be useful when we analyze
the results from the UG experiments.
Proposers in the UG made an average offer of 39.5 percent in condition Q_U,
which is 3.7 percent lower than the average offer from condition U. The difference
between choices in conditions U and Q_U is more pronounced when we look at the
median offer. While in condition U, the median proposer offered half of the total

14
prize to her partner, the median proposer in condition Q_U was less generous and
offered only 40 percent. The null hypothesis that offers from condition U and Q_U
are independent samples from identical continuous distributions with equal medians
is rejected at the 5 percent level (p-value = 0.045). This result indicates that
proposers who filled out the questionnaire about their own risk preferences were
more often making offers different from the equal (and presumably fair) division
than proposers who did not complete the questionnaire. The difference between the
distribution of proposers’ offers in condition U and Q_U is also easy to see in panel
b) of Figure 1. The relative frequencies of offers between 1 euro and 5 euros are
higher in condition Q_U. Offers of exactly 5 euros, however, were made more often
in condition U than in condition Q_U. These results indicate that the act of stating
one’s own risk preferences significantly alters behavioral choices in the UG and we
thus reject Hypothesis 2. The observation from the DG experiments that subjects’
preferences for fairness do not change after completing the risk questionnaire
implies that the change in behavioral choices in the UG has been induced by a
change in subjects’ risk considerations. That is, our data provide evidence that
proposers’ behavioral choices are strategic. In the next section, we will comment in
more detail on the effect we observe in the UG experiments. We now look at the
results from the IG.
The experimental data for trusters in the IG indicate that subjects who first
answered the questionnaire offered on average a bit more than subjects who did not
answer the questionnaire. The median truster in condition Q_I invested 50 percent of
her show-up fee, which is 10 percent more than the median truster in condition I.
The distributions of investments in the two conditions, however, are not
significantly different (p-value = 0.65). In panel c) of Figure 1, we also observe that
the relative frequencies with which investments from all magnitudes occur are
indeed very similar in the two conditions. Hence, the act of completing the
questionnaire did not change the distribution of behavioral choices in the first part of
the IG and we cannot reject Hypothesis 3 (for trusters). We will postpone the
discussion of the question whether trusters’ decisions are strategic until the next
section.
15
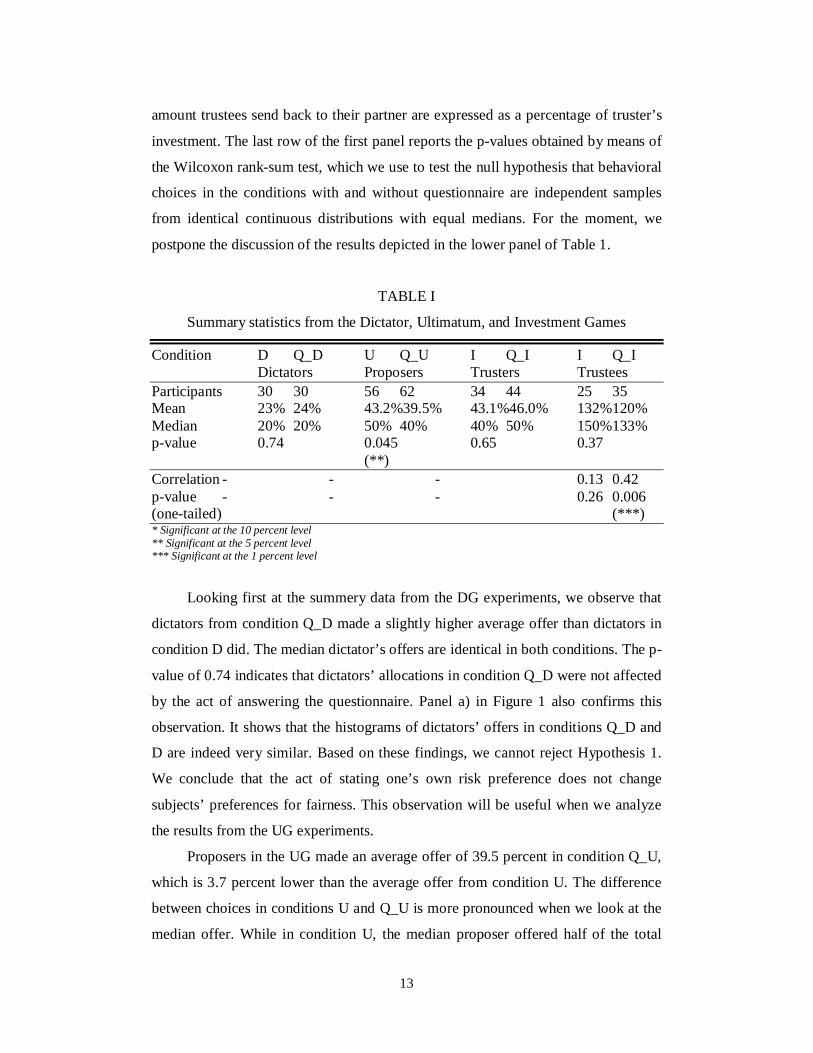
FIGURE 1.—Distribution of choices in the DG, UG, and IG
The last two columns of Table 2 summarize the experimental data of trustees’
decisions. We observe that the average and median amounts returned (expressed as a
percentage of the initial investments) in condition Q_I are 12 and 17 percent,
respectively lower than in condition I. This difference is large but statistically
insignificant (p-value = 0.37). The sample size of trustees in both conditions is
relatively small and it is difficult to draw conclusions whether the insignificant p-
value is due to a lack of effect of the questionnaire on trustees’ behavioral choices or
it is an artifact of the small sample size. To gain some additional insights on this
question, we examine the histograms of trustees choices depicted in panel d) of
Figure 1. The histogram from the choices in condition Q_I bears some resemblance
0.0
0.1
0.2
0.3
0.4
0 0.5 1 1.5 2 2.5 3 3.5 4 4.5 5 6Dictators' offers
a) Allocations in the Dictator Game
Q_D D
0.0
0.1
0.2
0.3
0.4
0.5
0.6
0.7
1 2 3 3.5 4 4.5 5 6Proposers'offers
b) Allocations in the Ultimatum Game
Q_U U
0.0
0.1
0.2
0.3
0.4
Trustees' choices
d) Return on investment in the Investment Game
Q_I I
0.0
0.1
0.2
0.3
0 1 2 3 4 5 6 7 8 9 10
Trusters' investments
c) Investments in the Investment Game
Q_I I
0.0
0.2
0.4
0.6
0.8
0 0.1 0.2 0.3 0.4 0.5
e) Percentage of the total prize received by trusters in the IG
Q_I I
0.00
0.03
0.06
0.09
0.12
0.15
0 10 20 30 40 50 60 70 80 90 100Risk loving Risk averse
f) Distribution of self-reported risk preferences
DG, UG and IG

16
to the uniform distribution. There are choices in the interval between 0 percent and
200 percent that are never played but all choices that are played are chosen with
approximately the same frequency (there is an exception at 43 percent, a choice
made by a single trustee). In contrast, in condition I, there is an upward trend in the
relative frequencies of trustees’ choices with the peak of the distribution being at
200 percent. The different forms of the empirical distributions of trustees’ decisions
in conditions Q_I and I suggest that trustees who completed the questionnaire might
have had different motivational bases from subjects who did not complete the
questionnaire. In an attempt to understand this difference, we look closer at the
determinants of trustees’ behavior.
We already argued that trustees in the IG and dictators in the DG face very
similar behavioral choices. Both types of players must divide an endowment of a
fixed size between themselves and another party in any way that they prefer. The
difference between the two games lies in who provides the endowment to be
divided. While the trustee in the IG owes the chance to earn more on the truster, the
dictator in the DG is provided the endowment directly from the experimenter and
she owes nothing to the other party. The behaviorally identical decision situations
faced by trustees and dictators suggest that we should observe similar empirical
distributions of choices made by trustees and dictators. A comparison between panel
a) and panel d) of Figure 1 reveals that this is not the case. The difference in the
distribution of actual choices of trustees and dictators suggest that different factors
determine behavior of the two types of players.
It is interesting to observe that the empirical distribution of trustees choices
(in condition I) is in fact very similar to the empirical distribution of proposers’
offers in the UG (see panel b) and d) of Figure 1). To make the choices of proposers
and trustees directly comparable, we first computed, for each pair in the IG, the total
size of the prize or the combined amount of money received by the players (it varies
with the different levels of investment made by trusters), and then we calculated the
percentage of the total prize that was received by each truster. Trusters have some
control over the division of the total prize by deciding how much from their show-up
fee to pass on to their partners. The less they invest, the more even will the
distribution of the prize for any decision of the trustees be. However, as any amount
17
invested is tripled the driving force behind the shape of the distribution of the total
prize between the two players is in the control of trustees. In panel e) of Figure 1, we
plot the relative frequency with which each possible distribution of the total prize
occurred in the IG. The data depicted in panel e) is more directly comparable to the
data depicted in panel b) and it confirms the impression that the distribution of
proposers’ offers in the UG is very similar to the distribution of trustees’ choices in
the IG. This observation is interesting because proposers and trustees are faced with
inherently different behavioral choices. The similarity between the distributions of
actual choices, however, suggests that people might perceive the two decision
situations as being similar. Andreoni et al. (2003) find that half of the subjects in the
UG care only about money-maximization, while the other half reveal a preference
for fairness. This means that proposers who are only interested in the maximization
of their own pay-off, form expectations about the expectation of their partners and
make the minimal offer that they believe will be accepted. Dufwenberg and Gneezy
(2000) measure beliefs in an experimental game similar to the IG and find that the
amount that trustees give back to their partners is positively correlated with trustees’
expectations of trusters’ return expectations. It is reasonable to assume that part of
the total population of trustees cares about fairness exactly as some of the proposers.
Combining the results of Andreoni et al. (2003) and Dufwenberg and Gneezy
(2000), it is clear that the factors motivating proposers and trustees are very
similar—one part of both types of players care about fairness and make choices
leading to the equal distribution of the prize, and the other part of players make
choices that are the best responses to their expectations of the other party’s
expectations. This conclusion finds support in our data (see panel b) and e) of Figure
1).
We argued earlier in this section that proposers in the UG who answered the
questionnaire make offers that are lower than the offers made by proposers who
directly play the game. Also, we find evidence that trustees in the IG and proposers
in the UG perceive the decision situations they face as similar. Trustees who
completed the questionnaire also return less to their partners than trustees who
played the IG right away and when graphed, the empirical distributions from the
condition Q_I and I take a different form. The Wilcoxon rank-sum test, however,

18
reveals no significant difference between the two distributions. These somehow
conflicting results motivate us to investigate another aspect of trustees’ behavior—
namely the reciprocation of trusters’ trust.
Berg et al. (1995) address the question on whether being trusted by someone
makes the trusted more trustworthy by studying the correlation between the amount
invested by trusters’ and the amount returned by trustees (expressed as a percentage
of the show-up fee and the tripled investment, respectively). Berg et al. (1995) do
not find significant correlation between the choices of trusters and trustees and
reason that the trustee’s decision is not affected by how much she is trusted by her
partner. Snijders and Keren (1999) and Dufwenberg and Gneezy (2000) use similar
designs and also fail to find significant correlations. We calculated the Spearman
correlation coefficients between trusters’ and trustees’ choices (expressed as a
percentage of the show-up fee of 10 euros and the tripled investment, respectively)
in condition I and Q_I. These correlations together with their p-values are presented
in the last two rows of Table I. In condition I, consistent with the results of previous
studies, we find no significant correlation. In contrast, in condition Q_I, the positive
correlation of 0.42 is significant at the 1 percent level and indicates that trustees who
answered the questionnaire reciprocate the trust bestowed on them by their partners.
Based on our findings about the behavioral choices of trustees in conditions Q_I and
I, we argue that our experimental data provides some evidence that trustees’
decisions include also strategic elements.
To supplement our analysis about the role of risk preferences in the DG, UG,
and IG we now discuss how the answers, given for question three of the
questionnaire, relate to behavioral choices in the three games. The distributions of
self-reported risk preferences on the risk scale in the DG, UG, and IG are
statistically identical. We pool the data from the three games together and plot the
resulted empirical distribution in panel f) of Figure 1. The empirical distribution of
self-reported risk preferences is approximately symmetric around 50. Slightly more
subjects scored a value less than 50 on the scale (54 percent), where values to the
left of 50 are associated with higher risk tolerance. This result is different from the
results of Holt and Laury (2002) who find that the majority of people are risk-
averse. MacCrimmon and Wehrung (1986) note that most people overestimate their
19
risk tolerance on one-dimensional scales. Hence, the difference between our results
and those of Holt and Laury (2002) should come as no surprise.
We already briefly discussed that incentive incompatible questionnaires and
one-dimensional questions might not provide a reliable measure of risk preferences.
However, it is interesting to analyze how the correlations between self-reported risk
preferences and behavioral choices in the DG, UG, and IG relate to our findings. In
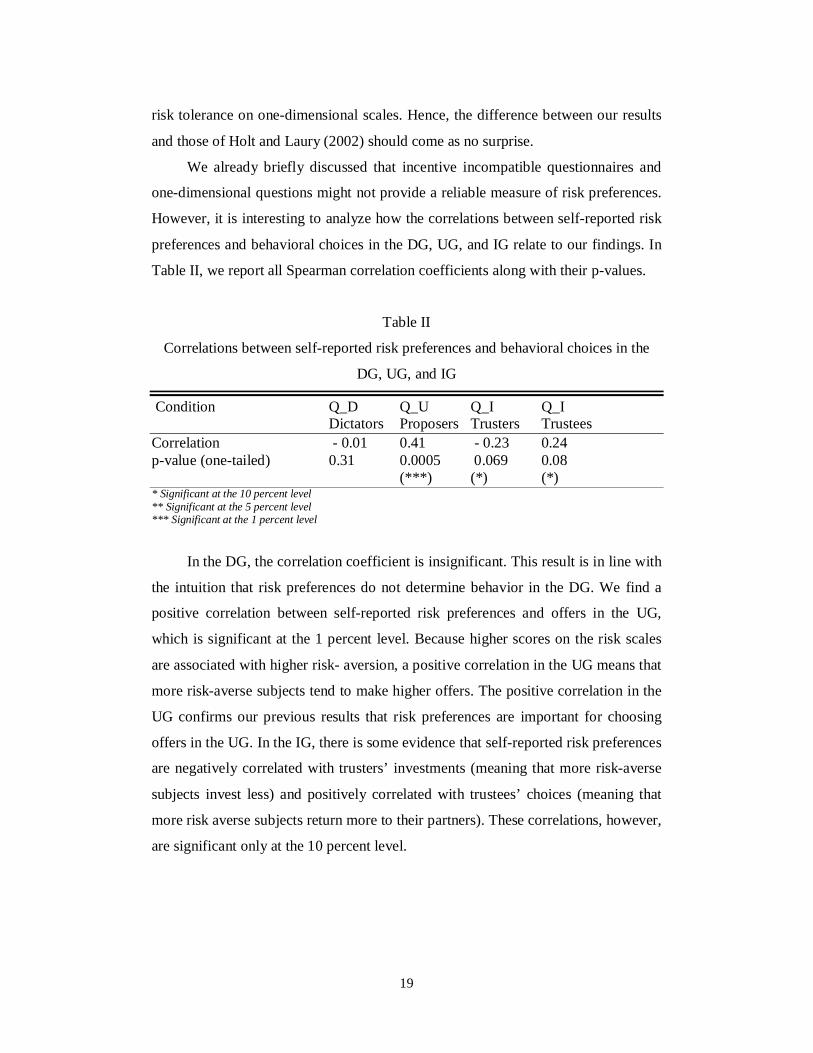
Table II, we report all Spearman correlation coefficients along with their p-values.
Table II
Correlations between self-reported risk preferences and behavioral choices in the
DG, UG, and IG
Condition Q_D Q_U Q_I Q_I Dictators Proposers Trusters Trustees Correlation - 0.01 0.41 - 0.23 0.24 p-value (one-tailed) 0.31 0.0005 0.069 0.08 (***) (*) (*) * Significant at the 10 percent level ** Significant at the 5 percent level *** Significant at the 1 percent level
In the DG, the correlation coefficient is insignificant. This result is in line with
the intuition that risk preferences do not determine behavior in the DG. We find a
positive correlation between self-reported risk preferences and offers in the UG,
which is significant at the 1 percent level. Because higher scores on the risk scales
are associated with higher risk- aversion, a positive correlation in the UG means that
more risk-averse subjects tend to make higher offers. The positive correlation in the
UG confirms our previous results that risk preferences are important for choosing
offers in the UG. In the IG, there is some evidence that self-reported risk preferences
are negatively correlated with trusters’ investments (meaning that more risk-averse
subjects invest less) and positively correlated with trustees’ choices (meaning that
more risk averse subjects return more to their partners). These correlations, however,
are significant only at the 10 percent level.
20
4. Discussion In this section we discuss some possible explanations of the effects that the act of
stating one’s own risk preferences produces on behavioral choices in the UG and IG.
In the UG, we find that proposers who answered the questionnaire made lower
offers than proposers who did not answer the questionnaire. There is, however, a
significant positive correlation between the answers given on the questionnaire and
offers made in the UG, suggesting that more risk-averse subjects make higher offers.
We explain these results by the following argument. The act of answering the
questionnaire makes subjects think about risk. When they are presented with the
UG, they probably try to evaluate how risky each possible offer is by making
expectations about the actions of their partners. Making small offers, such as 10 or
20 percent of the total endowment, involves high risk because small offers might be
perceived as offensive or unfair by responders who might be willing to punish the
greedy proposers by rejecting these offers. Rejecting small offers is attractive for
proposers because in this way they can punish their partners, without incurring too
high personal costs. Offers higher than 20 percent but less than that of equal division
make the cost of rejecting for responders substantial and proposers might think it is
reasonable to assume that such offers will be seldom rejected. Offering 50 percent of
the total endowment involves almost no risk but this strategy is not very profitable
for the proposers. The most attractive strategy for proposers therefore is to make
offers between 20 percent and 50 percent. This is exactly what we observe in
condition Q_U where the median offer is 40 percent. The act of answering the
questionnaire might be interpreted as a catalyst that makes proposers realize their
bargaining power and as a result take a full advantage of it. In contrast, proposers
who did not answer the questionnaire are less aware of their bargaining power and
make higher and safer offers. This explanation is consistent with the results of
Andreoni et al. (2003) who find that proposers offer less in a convex ultimatum
game in which they have more bargaining power than in the standard ultimatum
game.
In the IG, we do not find evidence that self-reporting risk preferences
influences trusters’ choices. The results from the UG suggest that the act of
completing the risk questionnaire changes subjects’ risk consideration. The failure
21
of the risk questionnaire to alter the distribution of trusters’ choices could then be
interpreted as evidence that trusters’ decisions are not related to risk preferences.
This conclusion, however, might be incorrect because of at least two reasons. First,
it is not straightforward to determine what investments will be attractive for subjects
with different levels of risk aversion. It is often assumed in the literature that less
risk-averse people will be willing to invest more in the IG (see e.g. Schechter 2007).
But this assumption is not easy to justify. Ahmed (2011), for example, examines
whether the return (which trusters earn on their investment) as a proportion of the
investment in the IG is increasing with the investment. He finds that marginal effects
of investment are constant. That is, whatever amount trusters invest, they earn on
average the same return. If a truster could somehow expect this, as soon as she
decides to put some of her show-up fee at risk, she will always be better off when
she invests higher amounts and whatever her risk preferences are she will probably
prefer to invest more than less. This is just an example, but it illustrates an important
point—different assumptions about the returns that might be expected for different
levels of investment can make the same behavioral choice attractive for both risk-
loving and risk-averse individuals. A second difficulty in discerning the
motivational bases of trusters’ behavior arises from the fact that too many factors
influence choices in the first part of the IG. Trusters in the IG may make choices
based on the expectation of reciprocation of their trust, expectation of altruistic and
fairness concerns of their partner, their own altruistic motives, their attitude toward
risk, or any combination of the above-mentioned. This means that if we are able to
somehow manipulate the subjects’ risk preferences or risk considerations (for
example, by making them report their risk preferences on a questionnaire), it will
still be difficult to expect a specific effect on trusters’ choices because we do not
know how risk preferences interact with the other determinants of behavior and
whether these other determinants stayed constant after the manipulation of risk
preferences. To sum it up, we believe that because of the specific nature of the first
part of the IG, it is very difficult to find strong experimental evidence that risk
preferences are important determinants of trusters’ behavior.
In the second part of the IG, we find that the median choice in condition Q_I is
17 percent lower than the median choice in condition I. This difference is
22
considerable (although statistically insignificant) and one argument that can explain
it is as follows: Trustees who completed the questionnaire realized that the decision
of trusters’ involves uncertainty and the risk of making losses. They also realized
that trusters’ make their investment decisions with the full awareness of the risk they
face. Trustees then might conclude that trusters’ at the time of making their choices
are prepared to incur some losses on their investments but are willing to run this risk
in order to take the chance of earning high returns. In other words, trustees might
guess that trusters’ return expectations are lower than a return associated with an
equal division and as a result do not feel any moral obligation to give too generous
returns. In contrast, trustees who did not complete the questionnaire are thinking less
about the expectations of their partners and as a result, they give on average higher
returns. This reasoning resembles very much the reasoning we used in explaining
the results from the UG. This is not by chance, because as we already argued, we
find some evidence in our data that trustees in the IG perceive their decision
situation as similar to the way proposers in the UG perceive their decision situation
(see e. g. panel e) and b) of Figure 1, or the discussion in Andreoni et al. 2003 and
Dufwenberg and Gneezy 2000). As we find that behavioral choices in the UG are
strategic, it follows from the latter argument that trustees’ choices in the IG might
also be driven by some strategic considerations. Another result from the second part
of the IG is that we find evidence that trustees in condition Q_I, but not in condition
I, care about reciprocation. We reason from all these observations, that trustees’
decisions involve strategic considerations.
5. Conclusion In this study, we focus on two types of goals. First, we are interested in extending
the result of Berninghaus et al. (2011) such that strategic behavior in a coordination
game is systematically altered by the act of reporting one’s own risk preferences to
three further games—the dictator, ultimatum, and investment games. Second, we
explicitly address the question, whether behavior in the UG and IG is strategic or is
entirely driven by other nonstrategic considerations.
We use an experimental design based on two conditions between-subject
comparison. In one condition, subjects’ only task was to play one of the three games
23
we consider. In the other condition, subjects first stated their own risk preferences
on a short questionnaire and then they played one of the games. We hypothesize that
the act of self-reporting risk preferences will not alter behavioral choices in the
subsequently played economic games (internal consistency of preferences
assumption). This hypothesis finds no support for the coordination game experiment
reported by Berninghaus et al. (2011). Our analysis of the DG, UG, and IG show
that self-reporting risk preferences does not alter dictators’ offers and trusters’
investments, while it significantly decreases proposers’ offers and leads to a
substantial decrease in the amount trustees’ give back to their partners.
Our results from the DG experiments show that the act of completing the risk
questionnaire does not influence subjects’ preferences for fairness. Combining this
finding with the results from the UG experiments, we conclude that the change in
the proposers’ offers triggered by the act of self-reporting risk preferences is induced
by a change in the subjects’ risk considerations. In other words, our experimental
data indicate that behavioral choices of proposers in the UG are strategic. In the IG,
we do not find a significant difference between the empirical distributions of
trusters’ choices in the conditions with and without questionnaire. This result
implies that decisions in the first part of the IG are not strategic. We, however, also
offer an alternative explanation of our findings. We argue, that because of the
specific nature of the decision situation trusters’ face in the IG (i.e., there are many
factors that influence behavioral choices), it is difficult to specify in what way risk
preferences would relate to trusters’ decisions, were they important for the
determination of behavioral choices. That is, there is a nontrivial identification
problem in the first part of the IG. Our experimental design does not explicitly
address this identification problem and it might, therefore, be inappropriate to study
the relationship between risk preferences and trusters’ choices.
In the second part of the IG, along with the result that, self-reporting risk
preferences substantially decreases the amount trustees send to their partners, we
also find that only trustees who self-reported their risk preferences on the
questionnaire show concerns for reciprocation. We also argue that trustees in the IG
and proposers in the UG perceive the decision situations they face as similar. Our
conclusion is that the behavioral choices of trustees include also strategic elements.
24
References Ahmed, A. 2011. Conditional reciprocity in the investment game. The Social
Science Journal 48 (2), 404-408.
Andreoni, J., Castillo, M., Petrie, R., 2003. What do bargainers’ preferences look
like? Experiments with a convex ultimatum game. American Economic
Review 93 (3), 672-685.
Ashraf, N., Bohnet, I., Piankov, N., 2006. Decomposing trust and trustworthiness.
Experimental Economics 9 (3), 193-208.
Bahry, D. L., Wilson, R. K., 2006. Confusion or fairness in the field? Rejections in
the ultimatum game under the strategy method. Journal of Economic Behavior
and Organization 60 (1), 37-54.
Berg, J., Dickhaut, J., McCabe, K., 1995. Trust, reciprocity, and social history.
Games and Economic Behavior 10 (1), 122-142.
Berninghaus, S. K., Todorova, L., Vogt, B., 2011. A simple questionnaire can
change everything: are strategy choices in coordination games stable?
Working Paper Series in Economics, Karlsruhe Institute of Technology.
Camerer, C. F., Thaler, R. H. 1995. Anomalies: ultimatums, dictators and manners.
The Journal of Economic Perspectives 9 (2), 209-219.
Carpenter, J., Verhoogen, E., Burks, S., 2005. The effect of stakes in distribution
experiments. Economic Letters 86 (3), 393-398.
Dufwenberg, M., Gneezy, U., 2000. Measuring beliefs in an experimental lost wallet
game. Games and Economic Behavior 30 (2), 163-182.
Eckel, C. C., Wilson, R. K., 2004. Is trust a risky decision? Journal of Economic
Behavior and Organization 55 (4), 447-465.
Fehr, E. and Schmidt, K. 1999. A theory of fairness, competition and cooperation.
The Quarterly Journal of Economics 114 (3), 817-868.
Forsythe, R., Horowitz, J. L., Savin, N. E., Sefton, M., 1994. Fairness in simple
bargaining experiments. Games and Economic Behavior 6 (3), 347-369.
Grable, J. 2008. Risk tolerance, Pp. 3-19 in Handbook of Consumer Finance
Research, edited by J. J. Xiao, Springer US.
25
Grainer, B., 2004. The online recruitment system ORSEE 2.0—a guide for the
organization of experiments in economics. Working Paper Series, University
of Cologne.
Güth, W., Schmittberger, R., Schwarze, B., 1982. An experimental analysis of
ultimatum bargaining. Journal of Economic Behavior and Organization 3 (4),
367-388.
Güth, W., van Damme, E., 1998. Information, strategic behavior, and fairness in
ultimatum bargaining: an experimental study. Journal of Mathematical
Psychology 42 (2-3), 227-247.
Henrich, J., Boyd, R., Bowles, S., Camerer, C., Fehr, E., Gintis, H., McElreath, R.,
Alvard, M., Barr, A., Ensminger, J. et al. 2005. “Economic Man” in cross-
cultural perspective: behavioral experiments in 15 small scale societies.
Behavioral and Brain Sciences 28 (6), 795-855.
Holt, C. A., Laury, S. K., 2002. Risk aversion and incentive effects. American
Economic Review 92 (5), 1644-1655.
Houser, D., Schunk, D., Winter, J., 2010. Distinguishing trust from risk: an anatomy
of the investment game. Journal of Economic Behavior and Organization 74
(1-2), 72-81.
Johansson-Stenman, O., Mahmud, M., Martinsson, P., 2005. Does stake size matter
in trust games? Economic Letters 88 (3), 365-369.
Kagel, J. H., Kim, C., Moser, D. 1996. Fairness in ultimatum games with
asymmetric information and asymmetric payoffs. Games and Economic
Behavior 13 (1), 100-110.
Kahneman, D., Knetsch, J. L., Thaler, R. H. 1986. Fairness and the assumptions of
economics. The Behavioral Foundations of Economic Theory 59 (4), 285-300.
Karlan, D., 2005. Using experimental economics to measure social capital and
predict financial decisions. American Economic Review 95 (5), 1688-1699.
Kiyonari, T., Yamagishi, T., Cook, K. S., Cheshire, C. 2006. Does trust begets
trustworthiness? Trust and trustworthiness in two games and two cultures: a
research note. Social Psychology Quarterly 69 (3), 270-283.
MacCrimmon, K. R., Wehrung, D. A. 1986. Taking risks. New York: The Free
Press.
26
Roth, A. E., Prasnikar, V., Okuno-Fujiwara, M., Zamir, S., 1991. Bargaining and
market behavior in Jerusalem, Ljuljana, Pittsburgh, and Tokio: an
experimental study. American Economic Review 81 (5), 1068-1095.
Schechter, L., 2007. Traditional trust measurement and the risk confound: an
experiment in rural Paraguay. Journal of Economic Behavior and
Organization 62 (2), 272-292.
Snijders, C., Keren, G. 1999. Determinants of trust, Pp. 355-385 in Games and
Human Behavior, edited by D. V. Budescu, I. Erev, and R. Zwig, Lawrence
Erlbaum Associates.


Otto von Guericke University MagdeburgFaculty of Economics and ManagementP.O. Box 4120 | 39016 Magdeburg | Germany
Tel.: +49 (0) 3 91 / 67-1 85 84Fax: +49 (0) 3 91 / 67-1 21 20
www.ww.uni-magdeburg.de