arcos dorados 3q19 conference call presentation november ... · 1q20 conference call presentation...
TRANSCRIPT

Arcos Dorados
1Q20 conference call presentationMay 13, 2020

This presentation contains forward-looking statements that represent our beliefs, projections and predictions about future events or
our future performance. Forward-looking statements can be identified by terminology such as “may,” “will,” “would,” “could,”
“should,” “expect,” “intend,” “plan,” “anticipate,” “believe,” “estimate,” “predict,” “potential,” “continue” or the negative of these terms
or other similar expressions or phrases. These forward-looking statements are necessarily subjective and involve known and
unknown risks, uncertainties and other important factors that could cause our actual results, performance or achievements or
industry results to differ materially from any future results, performance or achievement described in or implied by such statements.
The forward-looking statements contained herein include statements about the Company’s business prospects, its ability to attract
customers, its affordable platform, its expectation for revenue generation and its outlook. These statements are subject to the
general risks inherent in Arcos Dorados' business. These expectations may or may not be realized. Some of these expectations
may be based upon assumptions or judgments that prove to be incorrect. In addition, Arcos Dorados' business and operations
involve numerous risks and uncertainties, many of which are beyond the control of Arcos Dorados, which could result in Arcos
Dorados' expectations not being realized or otherwise materially affect the financial condition, results of operations and cash flows
of Arcos Dorados. Additional information relating to the uncertainties affecting Arcos Dorados' business is contained in its filings
with the Securities and Exchange Commission. The forward-looking statements are made only as of the date hereof, and Arcos
Dorados does not undertake any obligation to (and expressly disclaims any obligation to) update any forward-looking statements to
reflect events or circumstances after the date such statements were made, or to reflect the occurrence of unanticipated events.
Disclaimer
2

Discussion Topics
➢ First Quarter 2020 Results
➢ COVID-19 Update and Recent Trends
➢ Outlook for a Post-COVID World
3

1Q20 Key Highlights
February 2020 YTD
+10.9%SW Comp Sales
March 2020
(33.5)%SW Comp Sales
First Quarter 2020
(4.5)%SW Comp Sales
Revenues
$615.9 m(15.4)% YoY
(1.0)% YoY (in CC)
Adj. EBITDA
$30.0 m (51.4)% YoY
(52.7)% YoY (in CC)
Adj. EBITDA margin
4.9%down 360 bps
➢ Strong systemwide comp sales through Feb 2020
✓ Carried 2019 momentum of three-pillared strategy
✓ Market share gains and comp sales above inflation
✓ Delivery and Digital maintained strong growth
➢ March 2020 negatively impacted by COVID-19
✓ Quarantines and “stay at home” orders
✓ Restaurant closures and limited segment availability
✓ Significantly lower guest traffic
➢ By month-end, 55% of restaurants were open
✓ Adapted operation to leverage strength of footprint
✓ Drive-Thru, Delivery and/or Take-away were only
available segments
Note: Financial results exclude Venezuela 4
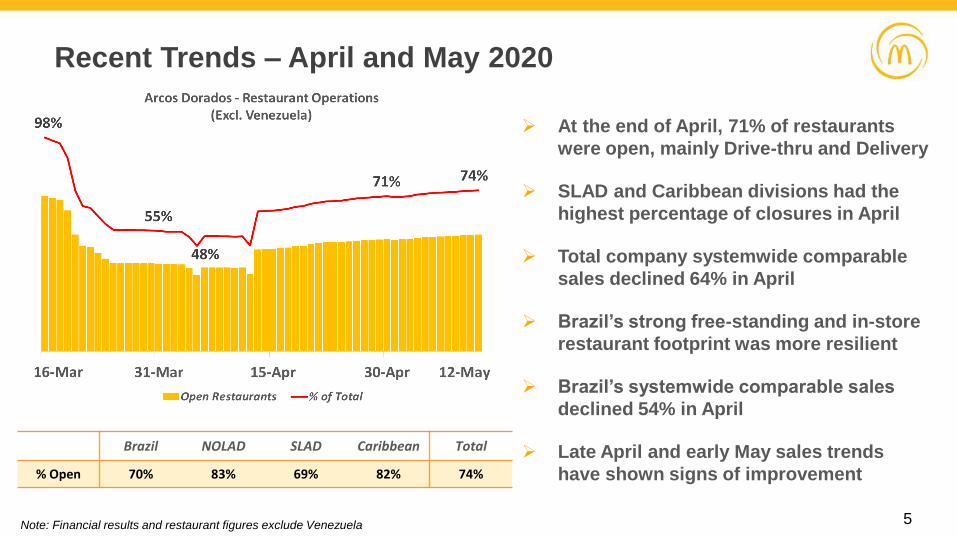
Recent Trends – April and May 2020
➢ At the end of April, 71% of restaurants
were open, mainly Drive-thru and Delivery
➢ SLAD and Caribbean divisions had the
highest percentage of closures in April
➢ Total company systemwide comparable
sales declined 64% in April
➢ Brazil’s strong free-standing and in-store
restaurant footprint was more resilient
➢ Brazil’s systemwide comparable sales
declined 54% in April
➢ Late April and early May sales trends
have shown signs of improvement
Note: Financial results and restaurant figures exclude Venezuela 5
Brazil NOLAD SLAD Caribbean Total
% Open 70% 83% 69% 82% 74%

94.687.6 90.5
1Q19 1Q20 (in US$) 1Q20 (inconstantcurrency)
➢ Strong start to the year with systemwide comparable sales above inflation in three of four Divisions
➢ Government quarantine measures and restaurant closures impacted traffic, starting in mid-March
➢ Total revenue contracted by just 1% in the quarter as a result of the COVID-19 pandemic
➢ Strong depreciation of Latin American currencies, including the Brazilian real and Argentine peso,
caused total revenue to decline 15.4% in US dollar terms
BRAZIL($ million)
SLAD($ million)
NOLAD($ million)
CARIBBEAN (Ex-Vzla)($ million)
1Q20 Sales Performance
Comparable sales growth %
340.8
284.4
331.8
1Q19 1Q20 (asreported)
1Q20 (inconstantcurrency)
(2.6)% (CC)(6.0)%
(16.5)%
99.496.1 95.3
1Q19 1Q20 (asreported)
1Q20 (inconstantcurrency)
(4.1)% (CC)
(3.3)%
193.2147.9
203.0
1Q19 1Q20 (asreported)
1Q20 (inconstantcurrency)
+5.0% (CC)
(4.3)% (CC)
(7.4)%
(6.3)% 3.2% (10.2)%
(23.5)%
6

Drive-thru and Delivery Performing well
7
Over 39 million Mobile App downloads
Drive-thru growing20% to 40%
Delivery growingmore than 100%
The Largest Free-Standing Restaurant Footprint in Latin America and the Caribbean

8.5
4.90.4
2.2
1.6 0.1
0.9
0.5
0.3
1Q19 Margin Food & Paper Payroll Occupany &
other
operating
expenses
Royalty Fees Franchised
restaurants -
occupancy
expenses
G&A Other Op
Income /
(Expense)
1Q20 Margin
Título del gráfico
7.2%
Note: Financial results exclude Venezuela
1Q20 Operating Costs & Expenses, Adjusted EBITDA
Breakdown of main variations contributing to 1Q20 Adjusted EBITDA margin
(%)
➢Adj. EBITDA increased
11.3% for February YTD
➢ 1Q20 Adj EBITDA fell
due to COVID-driven
sales decline in March
➢Adj. EBITDA margin
declined 360 bps YoY
➢Payroll and Occupancy
expenses drove the
margin contraction
➢G&A was 6.7% lower in
US dollars, rising below
inflation on a constant
currency basis, YoY
8
1Q 2020 QUARTER-END FOOTPRINT
DIVISIONSTORE TYPE
TOTAL
RESTAURANTSMCCAFES
DESSERT
CENTERSFS & IS MS & FC
BRAZIL 555 470 1,025 81 2,014
NOLAD 324 207 531 13 633
SLAD 241 165 406 127 399
CARIBBEAN 260 76 336 37 347
TOTAL 1,380 918 2,298 258 3,393

Three Phases of Our Plan
Managing the Short-Term with an eye on the Long-Term
9
Crisis Management
RecoveryFull
Revival
➢ Prioritize safety of
people and guests
➢ Reduce investments and
costs to preserve cash
➢ Leverage Drive-thru,
Delivery & Take-away
➢ Reopening of majority of
restaurants
➢ Customer trust low and
competition elevated
➢ Convenience and Value
drive guest decisions
➢ All restaurant segments
resume operations
➢ Trust in favorite Brands
support sales revival
➢ Renew enthusiasm for
the McDonald’s Brand

Uniquely Positioned for Future Growth
Protecting our People and Leveraging our Strengths
10
BRAZIL
NOLAD
SLAD
CARIBBEAN
+5
(*) Restaurant Addition LTM (net)
-1
+57
+12
612 Company Operated
413 Sub-Franchised
354 Company Operated
52 Sub-Franchised
271 Company Operated
65 Sub-Franchised
369 Company Operated
162 Sub-Franchised
709

11
Cost and Expense Reduction Initiatives
➢ Menu offerings reduced by 30% to simplify operations, streamline supply chain and
increase customer satisfaction
➢ McProtegidos program to take care of employees and guests while using all
available tools to reduce payroll costs
➢ Shifted lease agreements to variable rent regimes, based on restaurant sales
➢ Agreed with McDonald’s to:
✓ Have the flexibility to reduce Advertising and Promotion spending down to 4%
from 5% of gross sales for 2020
✓ Receive a deferral, until 2021, of Royalties related to March, April, May and June
2020 sales
➢ Tightening already-streamlined G&A expenses to minimize cash needs

Notes:
1) Total financial debt includes short-term debt, long-term debt and derivative instruments
2) Net Debt = Total financial debt less cash and cash equivalents
3) Leverage ratio = Net financial debt / LTM adjusted EBITDA
$ million
654620 621
590
596648
87163
328
197122 142
567
457
293 392
474506
2015 2016 2017 2018 2019 1Q20
Total Debt Cash & Equivalents Net Debt
1.6x1.0x1.7x2.3x
12
LEVERAGE RATIO
(*) Balance sheet as reported, including Venezuela
➢ Net leverage ratio of 1.9x, well below target range, and in full compliance with debt covenants
➢ Expect to breach debt covenants in 2Q20 due mostly to COVID-19 impact on TTM Adjusted EBITDA
➢ 2020 to 2022 Plan to be Revised once COVID-19 outbreak has been brought under control
➢ No significant debt maturities until 2023 and full discretion on deployment of capital
Balance Sheet and Financial Leverage*
1.5x
3.2 3.2 3.4 3.0 2.3 0.1 0.1 0.1
348
265
2020 2021 2022 2023 2024 2025 2026 2027
Other LT Debt 2023 Notes 2027 Notes
DEBT MATURITY PROFILE
$ m
illio
n
AVERAGE MATURITY
5 YEARS
1.9x

➢ Strong business momentum and financial position prior to beginning of crisis
➢ Omnichannel Approach to serve customer needs, including most extensive Delivery,
Drive-thru and Take-away capabilities.
➢ Management team applying decades of experience in Latin America to guide the
Three Phases of Recovery
➢ Leveraging benefits of being largest franchisee of World’s premier QSR Brand
➢ Balancing the needs of our people and customers with the financial performance of
Arcos Dorados to ensure long-term shareholder value creation
➢ Expect to emerge from the COVID-19 pandemic in a position of competitive strength
13
Closing Remarks
Long-Term Fundamentals Remain Strong for
Latin America and the Caribbean’s Favorite QSR Brand

IR Contact
Patricio Iñaki Esnaola
Director of Investor Relations
+54.11.4711.2561
Dan Schleiniger
Vice President of Investor Relations
+54.11.4711.2535