agenda arcos dorados 2q2014 conf call... · arcos dorados' business is contained in its...
TRANSCRIPT

Agenda
ARCOS DORADOS
2Q2014 Conference Call Presentation
August 5, 2014

Disclaimer
This presentation contains forward-looking statements that represent our beliefs, projections and predictions
about future events or our future performance. Forward-looking statements can be identified by terminology
such as “may,” “will,” “would,” “could,” “should,” “expect,” “intend,” “plan,” “anticipate,” “believe,” “estimate,”
“predict,” “potential,” “continue” or the negative of these terms or other similar expressions or phrases.
These forward-looking statements are necessarily subjective and involve known and unknown risks,
uncertainties and other important factors that could cause our actual results, performance or achievements
or industry results to differ materially from any future results, performance or achievement described in or
implied by such statements.
The forward-looking statements contained herein include statements about the Company’s business
prospects, its ability to attract customers, its affordable platform, its expectation for revenue generation and
its outlook. These statements are subject to the general risks inherent in Arcos Dorados' business. These
expectations may or may not be realized. Some of these expectations may be based upon assumptions or
judgments that prove to be incorrect. In addition, Arcos Dorados' business and operations involve numerous
risks and uncertainties, many of which are beyond the control of Arcos Dorados, which could result in Arcos
Dorados' expectations not being realized or otherwise materially affect the financial condition, results of
operations and cash flows of Arcos Dorados. Additional information relating to the uncertainties affecting
Arcos Dorados' business is contained in its filings with the Securities and Exchange Commission. The
forward-looking statements are made only as of the date hereof, and Arcos Dorados does not undertake any
obligation to (and expressly disclaims any obligation to) update any forward-looking statements to reflect
events or circumstances after the date such statements were made, or to reflect the occurrence of
unanticipated events.
1

2Q14 Results & Highlights
LENGTHY RUNWAY FOR FUTURE GROWTH, DESPITE
SHORT-TERM CHALLENGES
Achieved double-digit organic revenue growth and adjusted G&A
leverage
2
Double-digit organic revenue growth, despite weak economic growth
in key markets
o High single-digit increase in comparable sales
o Brazil’s topline growth impacted by the FIFA World Cup
and tough year-over-year comparison
Excluding Venezuela:
o Organic revenue growth of 9.6%
o As reported Adjusted EBITDA declined 1.7%
o Organic Adjusted EBITDA was flat year-over-year
o Adjusted EBITDA margin increased 15 bps, driven by lower labor and G&A expenses
46 bps of G&A leverage, excluding one-time expenses related to the G&A optimization
Opened 12 new restaurants in 2Q14 (21 as of 1H14), expanding our portfolio to 2,075 units

Key Marketing Initiatives
FIFA World Cup marked once-in-a-lifetime marketing opportunity
3
FIFA World Cup, a long-term branding opportunity
o McDonald’s was the only restaurant brand visible across the event venues
during all 64 games
o New products and event-related promotions positively impacted sales in the
lead up to the event
o Second most recognized official sponsor
FIFA World Cup promotions included:
o World Cup Sandwiches in Brazil
o Combo de la Copa in SLAD
o Campeones Mundialistas in NOLAD
High single-digit comparable sales growth underpinned by:
o Promotions in the value platform designed to stimulate traffic
o Monopoly promotion in Argentina
Ongoing campaigns across the region continue to enhance the brand
o Quality, “Más allá de la cocina”
focus on high quality ingredients
o Happy character

2Q14 Performance: Brazil
As anticipated, traffic was impacted by the FIFA World Cup
4
Topline growth impacted by a soft consumption environment, a tough y-o-y comp and
a negative impact from the FIFA World Cup
Reported revenues were flat due to the 8% y-o-y BRL depreciation
+7.7% organic revenue growth
o Comparable sales growth of 0.8%, driven by
Average check, offset by
Declines in traffic during World Cup matches
Key marketing drivers:
o World Cup Sandwiches
o Crispy Tasty sandwich in the value platform
o McFlurry Kit Kat
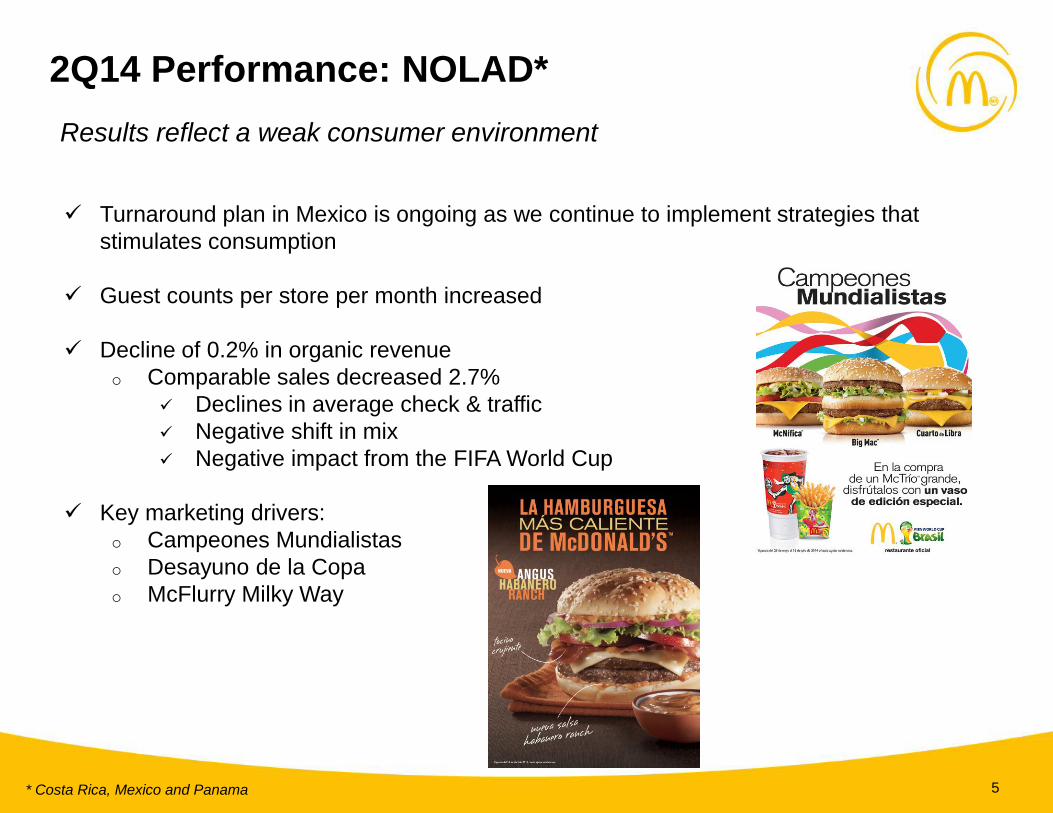
2Q14 Performance: NOLAD*
Results reflect a weak consumer environment
5
Turnaround plan in Mexico is ongoing as we continue to implement strategies that
stimulates consumption
Guest counts per store per month increased
Decline of 0.2% in organic revenue
o Comparable sales decreased 2.7%
Declines in average check & traffic
Negative shift in mix
Negative impact from the FIFA World Cup
Key marketing drivers:
o Campeones Mundialistas
o Desayuno de la Copa
o McFlurry Milky Way
* Costa Rica, Mexico and Panama
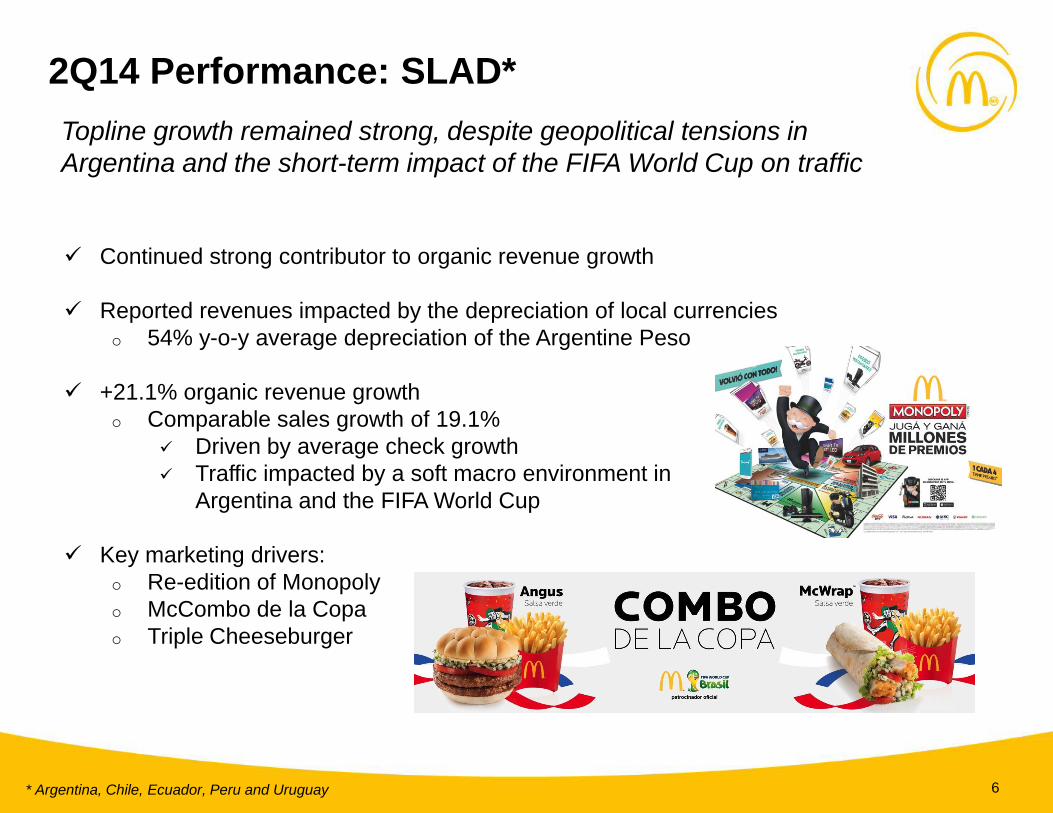
2Q14 Performance: SLAD*
Topline growth remained strong, despite geopolitical tensions in
Argentina and the short-term impact of the FIFA World Cup on traffic
6 * Argentina, Chile, Ecuador, Peru and Uruguay
Continued strong contributor to organic revenue growth
Reported revenues impacted by the depreciation of local currencies
o 54% y-o-y average depreciation of the Argentine Peso
+21.1% organic revenue growth
o Comparable sales growth of 19.1%
Driven by average check growth
Traffic impacted by a soft macro environment in
Argentina and the FIFA World Cup
Key marketing drivers:
o Re-edition of Monopoly
o McCombo de la Copa
o Triple Cheeseburger

2Q14 Performance: Caribbean*
Maintained leading market share despite ongoing challenging
conditions in Venezuela
7 * Colombia, Puerto Rico, Venezuela and Caribbean Islands
Results impacted by the transition to the SICAD II exchange rate in Venezuela
+15.8% organic revenue growth
o Comparable sales grew 19.2%
Driven by average check growth
Excluding Venezuela:
o +1.7% organic revenue growth
o Comparable sales declined 5.4%
Stable to slightly positive traffic
Negative shift in mix
Key marketing drivers:
o Combos de la Copa
o Bacon Clubhouse
o Bone in Chicken

Mexico
Colombia
Brazil
Argentina
NOLAD
Costa Rica, Mexico,
Panama
BRAZIL
SLAD
Argentina, Chile,
Ecuador, Peru,
Uruguay
CARIBBEAN
Aruba, Colombia, Curaçao, French Guyana,
Guadeloupe, Martinique, Puerto Rico, St.
Croix, St. Thomas, Trinidad & Tobago,
Venezuela
78 Restaurant Additions LTM (net)
23 Reimagings LTM
9 Restaurant Additions LTM (net)
6 Reimagings LTM
7 Restaurant Additions LTM (net)
9 Reimagings LTM
10 Restaurant Additions LTM (net)
4 Reimagings LTM
2Q14 & 1H New Unit Development & Reimaging
SLAD
Brazil
Caribbean
NOLAD
Number of systemwide
restaurants(1)
378
824
364
509
18%
40%
17%
25%
2,075 100%
8 (1) As of June 30, 2014; does not include McCafé units & Dessert Centers

$ 67.4
$ 8.0 $ 18.0
$ 20.1
$ 4.7 $ 42.0
0
10
20
30
40
50
60
70
80
EBITDA 2Q2013 Revenues Variation @2Q2013 EBITDA Margin
EBITDA Margin Variationexcl. Special Items in CC
Fluctuation of the localcurrencies
Special Items EBITDA 2Q2014
In constant currencies
2Q14 Adjusted EBITDA Bridge
Adjusted EBITDA variations ($ Million)
9
2Q14 Non-Operating Results
10
$22.7 million increase in foreign currency exchange losses
o Mainly driven by the impact of the transition to the SICAD II exchange rate for
remeasurement purposes in Venezuela
$3.0 million increase in net interest expense
o Mainly attributable to additional year-over-year debt and derivative instruments
$5.7 million increase in Income tax expense
The company registered a net loss of $99.0 million, compared to net income of $8.8
million in 2Q13
o Mainly due to the transition to the SICAD II FX rate in Venezuela, which included
an impairment on Venezuelan fixed assets of $45.2 million
Largely driven by the losses in our Venezuela operation

(i) Total financial debt includes short-term debt, long-term debt and derivative instruments (including the
asset portion of derivatives amounting to $0.5 million as a reduction of financial debt as of December 31,
2013).
(ii) Total financial debt less cash and cash equivalents.
2Q14: Financial Indicators
Solid financial ratios
11
As of As of
June 30, December 31,
(In million of U.S. dollars, except ratios) 2014 2013
Cash & cash equivalents 101.0 175.6
Total Financial Debt 891.3 785.0
Net Financial Debt 790.3 609.4
Total Financial Debt / LTM Adjusted EBITDA ratio 3.0 2.3
Net Financial Debt / LTM Adjusted EBITDA ratio 2.6 1.8

12
2014: Guidance Update
Guidance revised due to lower than expected economic and
consumption growth
2014 1 2014 Revised1
Consolidated Revenue Growth +13% to 16% +9% to 11%
Consolidated Adj. EBITDA Growth +15% to 18% +5% to 8%
Effective Tax Rate (ETR)2 35% to 37% 35% to 37% (unchanged)
Capital Expenditures (US$) $200 million approx $180 million approx
Restaurant Openings (gross) App. 90 App. 84
1 On an organic basis (constant currency and excludes special items) and excluding Venezuela 2 Excluding any financing activities
13
2Q14: Closing Remarks
In the current environment we are focused on those factors within our control
such as:
o Continuing targeted cost savings
o Providing a compelling value proposition
o Re-focusing our marketing efforts on the family experience and McDonald’s
iconic properties
Economic growth in our region is inherently cyclical
The QSR industry is backed by strong, long-term demographic trends
System wide advances in information technology to streamline the business
Capitalize on scale and competitive advantages from being a single brand with a
single cooking system
Strong long-term growth prospects despite current challenges
TAKING STEPS TO IMPROVE THE EFFICIENCY OF OUR OPERATIONS

14
IR Contact
For additional information:
Daniel Schleiniger
IR Director
+1.305.961.2848
Patricio Iñaki Esnaola
IR Manager
+54.11.4711.2675
www.arcosdorados.com/ir