arbitron ebook reference guidemarcomm.arbitron.com/downloads/purplebook.pdfarbitron ebook reference...
TRANSCRIPT


Arbitron eBook Reference Guide
1© 2009 Arbitron Inc. 1
Contents
The Basic Estimate Types 2
Arbitron eBook Web Site 5 • Welcome Screen 5 • Market Info 7 • Listener Estimates 19 • Methodology 33
What You Can/Can’t Do With the Numbers 34
Basic Equations and Buying/Selling Formulas 36
Radio Ratings Review Quiz 43
Information and Training Resources 44
Glossary of Terms and Abbreviations 45
About Arbitron 49
Arbitron Offices 50
This guide is designed to help you get the most value from the listening estimates found in the Arbitron eBooksm. As an online software service, the Arbitron eBook provides fast, convenient access to your Arbitron ratings data subscription wherever you have an Internet connection.
Arbitron clients are welcome to download this publication at my.arbitron.com, in the “Survey & Market Info” section.
Expanded Information, Easier-to-Use
The Arbitron eBook provides all the data found previously in the printed book plus a lot more. The Arbitron eBook includes an expanded range of demos and dayparts as well as in-depth Metro Market Profile information. And since it is a software service, the Arbitron eBook gives you greater control over how ratings data are viewed than the static, black- and white-pages of the traditional printed book. The Arbitron eBook has been designed in a printer-friendly format, making it easy for you to save reports as a PDF for later printing. If you need, you can even save the complete report with a single click.
For questions and more information on the Arbitron eBook, please contact your Arbitron representative.
Users of this report should become familiar with the Arbitron Description of Methodology. Instructions for estimating reliability and effective sample bases for this report can be found in the “Methodology” section of the Arbitron eBook Web site.
Understanding and Using Radio Audience Estimates

Arbitron eBook Reference Guide
2© 2009 Arbitron Inc.
Making the most out of your Arbitron Radio Market Report is easy once you understand the three basic audience estimates reported. They are:
• Persons estimates: the estimated number of persons listening
• Rating: the percent of listeners in the universe of the measured survey area population
• Share: the percent of one station’s total daypart estimated listening audience
Each Radio Market Report covers either radio listening during a four-week survey period in markets mea-sured with the Portable People MeterTM (PPMTM) or a 12-week survey period in Diary markets. Every esti-mate found in the book is given for a particular survey area (or geography), a demographic (sex and age) and a time period (or daypart).
Persons and Rating estimates are produced for both Average Quarter-Hour (AQH) and Cume; Share esti-mates apply to AQH only.
Estimates Reported: PPM and Diary
1. Average Quarter-Hour Persons, Ratings and Shares
Average Quarter-Hour Persons identifies the average number of persons estimated to have listened to a sta-tion for a minimum of five minutes during any quarter-hour in a time period. The Average Quarter-Hour Persons estimate helps to determine the audience and cost of a spot schedule rotating within a time period.
ExampleWAAA has an Average Quarter-Hour Persons audience of 9,000 for Saturday 6AM-10AM. This means that an average of 9,000 people are estimated to have listened to WAAA during any quarter-hour from 6AM-6:15AM to 9:45AM-10AM during the survey period. By buying one spot on WAAA during any quarter-hour during this daypart, an advertiser would reach an estimated average audience of 9,000 people.
Average Quarter-Hour Rating expresses the estimat-ed number of listeners (Average Quarter-Hour Per-sons) as a percentage of the survey area population. The Average Quarter-Hour Rating is calculated by dividing the number of Average Quarter-Hour Persons by the survey area population within the same sex/age group and multiplying by 100.
Average Average Quarter-Hour Persons x 100 = Quarter-Hour Rating
Survey Area Population
ExampleSince the Average Quarter-Hour Persons estimate for WAAA is 9,000 for Men 18-49 and the Metro population for this sex/age group is 175,600, the Average Quarter-Hour Rating for WAAA is 5.1.
9,000 x 100 = 5.1 175,600
Average Quarter-Hour Share is the percent of the total listening audience tuned in to each station. This estimate reveals the share of listening each station captures out of the total listening in the survey area.
ExampleThe total number of Persons 18-49 listening to radio in the Metro is 40,300 AQH Persons during Monday-Friday 6AM-10AM. With its AQH Persons audience of 9,000, WAAA’s share of this listening would be 22.3%.
Average Quarter-Hour Share does not reveal the absolute size of a station’s audience. WBBB has a 15% share in the morning and a 20% share at night. But that 15% share in the morning may actually represent a greater number of listeners than a 20% share at night.
ExampleTotal Listenersto All Stations
WBBBShare
WBBBAudience
AM 25,000 15% 3,750
PM 15,000 20% 3,000
The Basic Estimate Types

Arbitron eBook Reference Guide
3© 2009 Arbitron Inc.
AQH Composition: The size of a station’s AQH target audience relative to its total AQH audience.
To obtain AQH audience composition, divide target AQH Persons by total P6+ AQH Persons.
Target AQH Persons = AQH CompositionTotal P6+ AQH
Audience
2. Cume Persons and Ratings
Average Daily Cume Composition: The size of an encoded station’s Cume target audience relative to its total Cume audience.
How it is used: This calculation is similar to AQH and provides an indication of how efficiently a radio station is reaching its target audience.
Average Daily Cume Composition is calculated by dividing the target Cume Persons by total P6+ Cume Persons.
Target Average Daily Cume Persons
= Average Daily Cume CompositionTotal P6+ Average Daily
Cume Audience
Cume Duplication: This estimate answers the ques-tion, “What percentage of my station’s audience also listens to another station?” It is the percentage of Cume Persons for one station that was exposed to a second station.
How it is used: In selling advertising, stations that duplicate the least will add the most reach to a radio schedule while stations that share the most audience will yield a higher schedule frequency.
Cume Persons identifies the estimated number of different people who listened to a station for a minimum of five minutes in a quarter-hour within a reported daypart. No matter how long the listening occurred, each person is counted only once. Cume is also referred to as unduplicated audience, reach or circulation.
Cume Rating is the number of Cume Persons ex-pressed as a percentage of the survey population. To calculate Cume Ratings:
Cume Persons Pop. for sex/age group
x 100 = Cume Rating
ExampleThe Cume Persons estimate for WCCC is 75,000 for Men 18-49. The Metro population for the same sex/age group is 175,600. The Cume Rating for WCCC is 42.7. This means that almost 43% of all Men 18-49 in the Metro area listen to WCCC.
Exclusive Cume Persons is the estimated number of Cume Persons in the survey area who listened to only one station within a reported daypart.
The Basic Estimate Types
Arbitron eBook Reference Guide
4© 2009 Arbitron Inc.
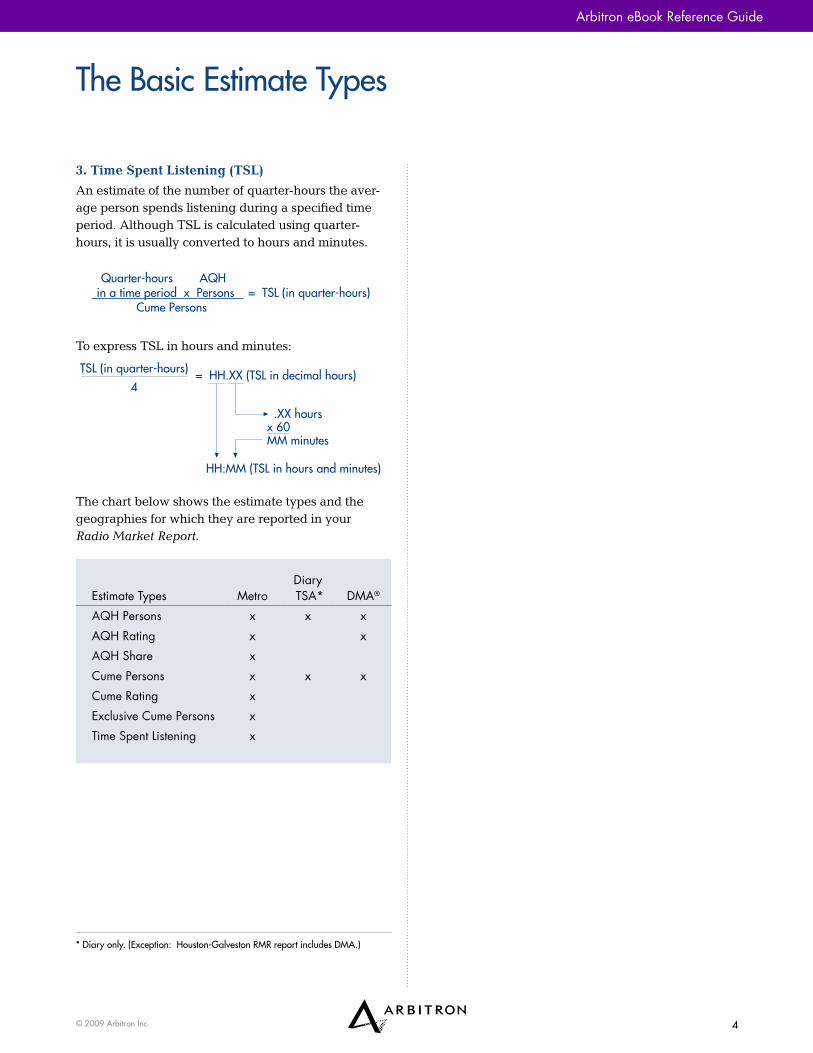
3. Time Spent Listening (TSL)
An estimate of the number of quarter-hours the aver-age person spends listening during a specified time period. Although TSL is calculated using quarter-hours, it is usually converted to hours and minutes.
Quarter-hours AQHin a time period x Persons = TSL (in quarter-hours)
Cume Persons
To express TSL in hours and minutes:
TSL (in quarter-hours)4
= HH.XX (TSL in decimal hours)
.XX hoursx 60MM minutes
HH:MM (TSL in hours and minutes)
The chart below shows the estimate types and the geographies for which they are reported in your Radio Market Report.
Estimate Types MetroDiary TSA* DMA®
AQH Persons x x xAQH Rating x xAQH Share xCume Persons x x xCume Rating xExclusive Cume Persons xTime Spent Listening x
The Basic Estimate Types
* Diary only. (Exception: Houston-Galveston RMR report includes DMA.)
5© 2009 Arbitron Inc.
Arbitron eBook Reference Guide
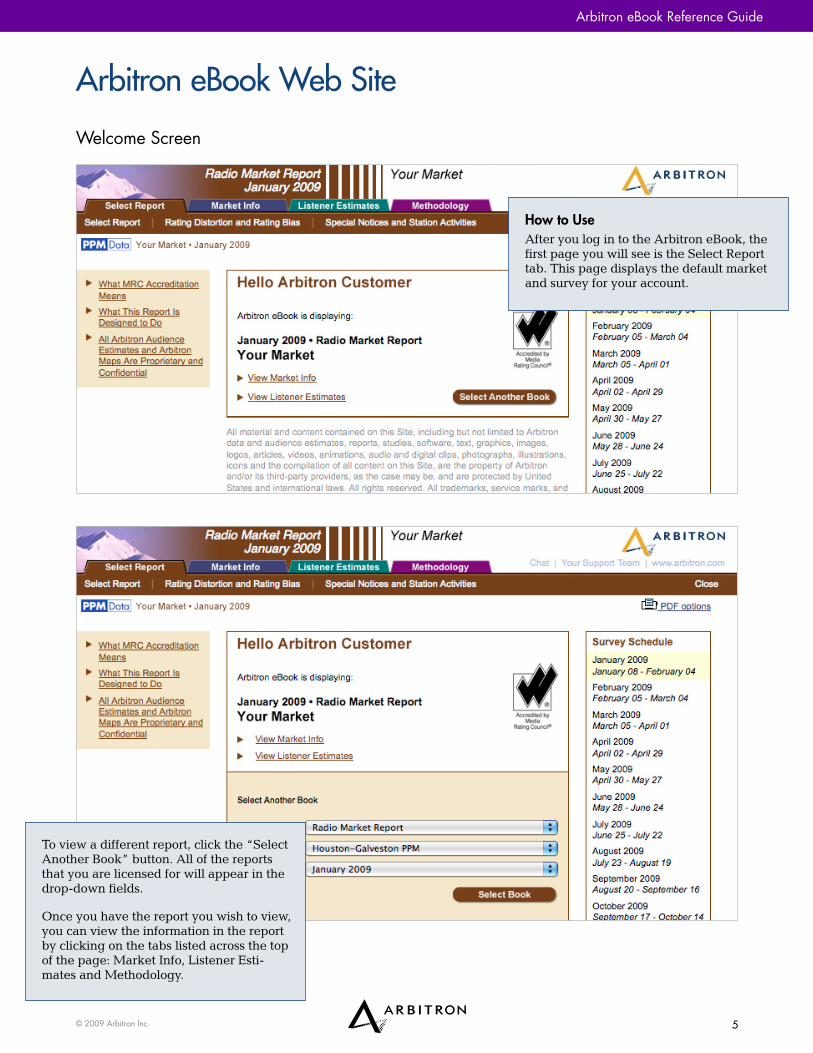
How to UseAfter you log in to the Arbitron eBook, the first page you will see is the Select Report tab. This page displays the default market and survey for your account.
To view a different report, click the “Select Another Book” button. All of the reports that you are licensed for will appear in the drop-down fields.
Once you have the report you wish to view, you can view the information in the report by clicking on the tabs listed across the top of the page: Market Info, Listener Esti-mates and Methodology.
Arbitron eBook Web Site
Welcome Screen

6© 2009 Arbitron Inc.
Arbitron eBook Reference Guide
Arbitron eBook Web Site
Welcome Screen (continued)
Throughout the Arbitron eBook, you can save a PDF copy of any page sim-ply by clicking the “PDF options” link in the upper right corner of the page.
On the right side of the page, you can see the current survey schedule.
Along the top, you will find links to the Rating Distortion and Rating Bias and Special Notices and Station Activities pages.
On the left side are links to informa-tion on MRC accreditation and legal notices on the use of Arbitron audience estimates.
7© 2009 Arbitron Inc.
Arbitron eBook Reference Guide
Arbitron eBook Web Site
Market Info Section
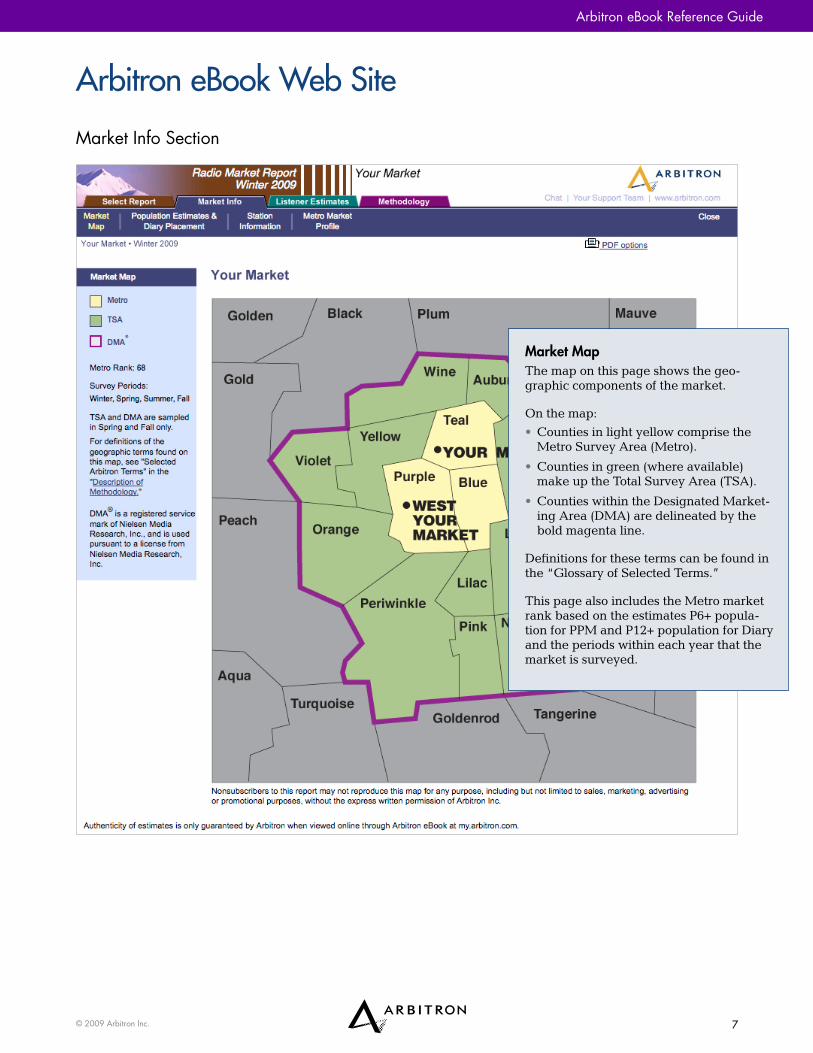
Market MapThe map on this page shows the geo-graphic components of the market.
On the map:
• Counties in light yellow comprise the Metro Survey Area (Metro).
• Counties in green (where available) make up the Total Survey Area (TSA).
• Counties within the Designated Market-ing Area (DMA) are delineated by the bold magenta line.
Definitions for these terms can be found in the “Glossary of Selected Terms.”
This page also includes the Metro market rank based on the estimates P6+ popula-tion for PPM and P12+ population for Diary and the periods within each year that the market is surveyed.

8© 2009 Arbitron Inc.
Arbitron eBook Reference Guide
PPM
Arbitron eBook Web Site
Market Info Section (continued)
Population Estimates and Average Daily In-Tab Persons/In-Tab Diaries by CountyPopulation Estimates are given for the Metro in each market report. Estimates for the TSA are contained in the Spring and Fall Diary reports.
This page provides the number of Aver-age Daily In-Tab (PPM) or in-tab diaries for each county and the estimated population for each county. The codes “M,” “T” and “D” identify the geography of the sampling units as Metro, TSA and DMA. More than one code can appear for each county.
DIARY For Diary markets, the demo used for this table is P12+.

9© 2009 Arbitron Inc.
Arbitron eBook Reference Guide
PPM
DIARY
Arbitron eBook Web Site
Market Info Section (continued)
Population Estimates and Average Daily In-Tab Persons/In-Tab Diaries by DemographicsThis page breaks out the number of Aver-age Daily In-Tab (PPM) or in-tab diaries by age and sex as well as the estimated population by age and sex. In addition, for applicable markets, this page also includes information on Black and Hispanic in-tab as well as language use (English- dominant and Spanish-dominant) in Hispanic households.
For Diary markets, the demo used for this table is P12+.

10© 2009 Arbitron Inc.
Arbitron eBook Reference Guide
PPM
DIARY
Arbitron eBook Web Site
Market Info Section (continued)
For Diary markets, the demo used for this table is P12+.
Spanish Language Usage Population Estimates and Average Daily Installed and In-Tab Persons/Spanish Language Usage Population Estimates and In-Tab DiariesThis table shows the population breakout and related installed persons (for PPM) and in-tab sample for Spanish-Dominant and English-Dominant as a percentage of the Hispanic Population.

11© 2009 Arbitron Inc.
Arbitron eBook Reference Guide
PPM
Arbitron eBook Web Site
Market Info Section (continued)
Metro Black/Hispanic High-Density Ethnic Area(s)Portions of geographic areas that exceed a specified threshold of ethnic (black or Hispanic) population density are identified by zip code so that sample planning may be done at a more discrete level. In-tab and population details for these areas are displayed.
DIARY For Diary markets, the demo used for this table is P12+.

12© 2009 Arbitron Inc.
Arbitron eBook Reference Guide
Arbitron eBook Web Site
Market Info Section (continued)
Persons Sample Summary (PPM)This page provides survey-specific sample information that includes target and actual in-tab, installed panelists and other PPM panel information. It also contains panel turnover and panel recruitment informa-tion for landline and cell-phone-only households.

13© 2009 Arbitron Inc.
Arbitron eBook Reference Guide
DIARY
Arbitron eBook Web Site
Market Info Section (continued)
Diary Placement/ReturnThis page provides Diary recruitment infor-mation from usable households to in-tab Diaries.

14© 2009 Arbitron Inc.
Arbitron eBook Reference Guide
Arbitron eBook Web Site
Market Info Section (continued)
Station InformationThis list includes every radio station that met the Minimum Reporting Standards for publication for the market report.
Stations on this list are listed in one of three sections:
1. Home to the Metro
2. Outside of the Metro but home to the DMA
3. Outside of both the Metro and DMA
Any stations that are placed “below-the-line” for Special Station Activities viola-tions come last, and they are noted.
Clicking “Detail View” provides additional station information.

15© 2009 Arbitron Inc.
Arbitron eBook Reference Guide
Arbitron eBook Web Site
Market Info Section (continued)
Station Information (continued)
The “Detail View” provides extensive information on each station listed:
• Call letters and exact frequency. Digital radio stations will be indicated by an identifying code in place of a frequency. A link to a list of these codes is located on the page.
• Address, phone number and fax number.
• National sales representative.
• Network(s) with which the station is affiliated.
• Format as provided quarterly to Arbitron by each station from a list of industry-recognized formats.
• City of license and/or its alternate city of identification are listed as well as county of license. Where Arbitron has split the county for survey purposes, the location will be identified by the name of the split.
• Signal: Effective Radiated Power (ERP) of an FM station along with its Height Above Average Terrain (HAAT) are given. For AM stations, the power for day and night is given. Users of the report can estimate the station’s coverage based on these data. Digital Radio stations will not display these figures.

16© 2009 Arbitron Inc.
Arbitron eBook Reference Guide
Arbitron eBook Web Site
Market Info Section (continued)
Metro Market ProfileThe Metro Market Profile section provides a snapshot of consumers in a metropolitan area.
Profiles include household data from the U.S. Census showing income, education, household size, occupation, car ownership, method of transportation to work and other characteristics of the market.

17© 2009 Arbitron Inc.
Arbitron eBook Reference Guide
Arbitron eBook Web Site
Market Info Section (continued)
Metro Market Profile (continued)
The Metro Market Profile gives you access to information that describes local lifestyles. Metro Market Profiles help radio stations and advertisers identify opportunities and answers questions like:
• How much does the market spend on retail? See information for top advertiser categories like Grocery Stores, Food Ser-vices, Furniture Store and more.
• What is the median income and average income per household?
• What are the top car brands?
• What is the ethnic population in the mar-ket? See details by age and sex on black and Hispanic populations and identify opportunities.
• What are the top 10 employer categories?
• What magazines are being read in this market?
• What is the circulation of newspapers in this market?
• How much time do radio listeners spend with the medium in this market by age and sex?
• What percentage of the market is reached by radio by demographic group? See radio’s reach over the seven-day, 24-hour period.
The Household Data are also available in charted format. Simply click on the “chart this table” link above the table. You can copy and paste them into your own sales presentations.

18© 2009 Arbitron Inc.
Arbitron eBook Reference Guide
Arbitron eBook Web Site
Market Info Section (continued)
Metro Market Profile (continued)
You can also download the Metro Market Profile as a printer-friendly, one-page PDF. This format gives you a quick one-page market snapshot.
19© 2009 Arbitron Inc.
Arbitron eBook Reference Guide
DIARY
PPM
Arbitron eBook Web Site
Listener Estimates Section
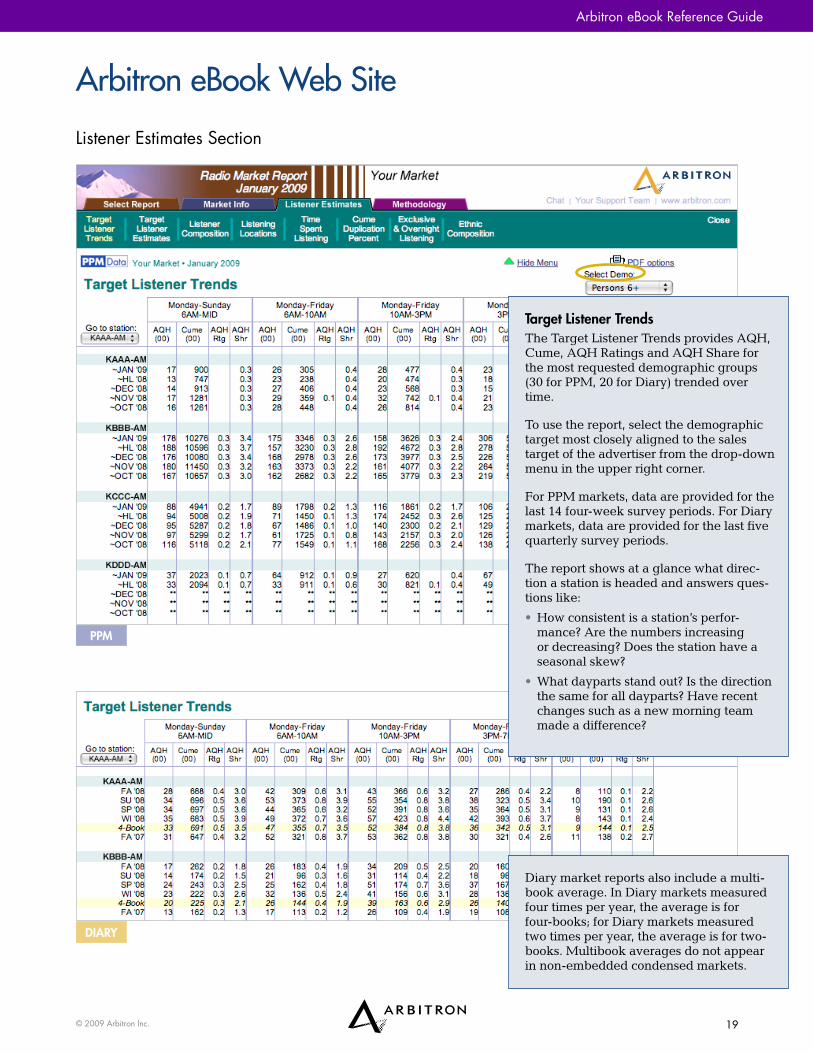
Target Listener TrendsThe Target Listener Trends provides AQH, Cume, AQH Ratings and AQH Share for the most requested demographic groups (30 for PPM, 20 for Diary) trended over time.
To use the report, select the demographic target most closely aligned to the sales target of the advertiser from the drop-down menu in the upper right corner.
For PPM markets, data are provided for the last 14 four-week survey periods. For Diary markets, data are provided for the last five quarterly survey periods.
The report shows at a glance what direc-tion a station is headed and answers ques-tions like:
• How consistent is a station’s perfor-mance? Are the numbers increasing or decreasing? Does the station have a seasonal skew?
• What dayparts stand out? Is the direction the same for all dayparts? Have recent changes such as a new morning team made a difference?
Diary market reports also include a multi-book average. In Diary markets measured four times per year, the average is for four-books; for Diary markets measured two times per year, the average is for two-books. Multibook averages do not appear in non-embedded condensed markets.

20© 2009 Arbitron Inc.
Arbitron eBook Reference Guide
Arbitron eBook Web Site
Listener Estimates Section (continued)
Target Listener Trends (continued)
Report Features: Standard Report
PPM Diary
DemosPersons, Men and Women:
6+* •12+ • •18+* •12-24* • •18-34 • •18-49 • •25-54 • •35-64 • •
Teens 12-17* • •Children 6-11* •EstimatesAQH (00) • •Cume (00) • •AQH Rating • •AQH Share Trends • •Multibook Average** •DaypartsMon-Sun 6AM-Mid • •Mon-Fri 10AM-3PM • •Mon-Fri 3PM-7PM • •Mon-Fri 7PM-Mid • •
* Demo not available in Condensed Market Report (Diary only).
** Continuous measurement markets report a four-book average. Markets measured twice a year (Spring and Fall) report a two-book average.

21© 2009 Arbitron Inc.
Arbitron eBook Reference Guide
Arbitron eBook Web Site
Listener Estimates Section (continued)
Target Listener EstimatesThis report shows daypart estimates for the most current survey available. In Diary markets, the two- or four-survey multibook average is also provided.
To use the report, select the demographic target most closely aligned to the sales target of the advertiser from the drop-down menu in the upper right corner.
Want to find the percentage of persons that listen only on weekdays (“Exclusive Week-day Cume”)? Simply subtract the Weekend 6AM to Midnight Cume from the Monday-Sunday 6AM to Midnight Cume.

22© 2009 Arbitron Inc.
Arbitron eBook Reference Guide
Arbitron eBook Web Site
Listener Estimates Section (continued)Target Listener Estimates (continued)
Report Features: Standard Report
PPM Diary
DemosPersons, Men and Women:
6+* •12+ • •18+* •12-24* • •18-34 • •18-49 • •25-54 • •35-64 • •
Teens 12-17* • •Children 6-11* •EstimatesAQH (00) • •Cume (00) • •AQH Rating • •AQH Share Trends • •Multibook Average** •DaypartsWeekend 6AM-Mid • •Mon-Fri 6AM-7PM • •Sat 6AM-10AM • •Sat 10AM-3PM • •Sat 3PM-7PM • •Sat 7PM-Mid • •Sun 6AM-10AM • •Sun 10AM-3PM • •Sun 3PM-7PM • •Sun 7PM-Mid • •
* Demo not available in Condensed Market Report (Diary only).
** Continuous measurement markets report a four-book average. Markets measured twice a year (Spring and Fall) report a two-book average.

23© 2009 Arbitron Inc.
Arbitron eBook Reference Guide
PPM
DIARY
Arbitron eBook Web Site
Listener Estimates Section (continued)
Listener Composition (AQH and Cume)This report helps you determine whether a station’s audience is concentrated in a demographic cell or spread across a broader demographic target.
To see the percentage of the total audience by age or sex, you can add across cells in this section to form a custom demographic for both AQH and Cume.
This report provides answers to the follow-ing questions:
• Is a station effectively reaching its stated target audience?
• Are the highest AQH ratings and highest Cume rating occurring in the same cells? If not, there is a difference in time spent listening.

24© 2009 Arbitron Inc.
Arbitron eBook Reference Guide
DIARY
Arbitron eBook Web Site
Listener Estimates Section (continued)
Listener Composition (AQH and Cume) (continued)
Report Features
PPM Diary
DemosP6+ •Children 6-11 •Teens 12-17 • •P12+ • •Persons, Men and Women:
18+ • •18-24 • •25-34 • •35-44 • •45-54 • •55-64 • •65+ • •
EstimatesAQH (00) • •AQH Composition % • •AQH Rating • •AQH ShareCume (00) • •Cume Composition % • •Cume Rating • •DaypartMon-Sun 6AM-Mid • •
PPM
25© 2009 Arbitron Inc.
Arbitron eBook Reference Guide
PPM
DIARY
Arbitron eBook Web Site
Listener Estimates Section (continued)
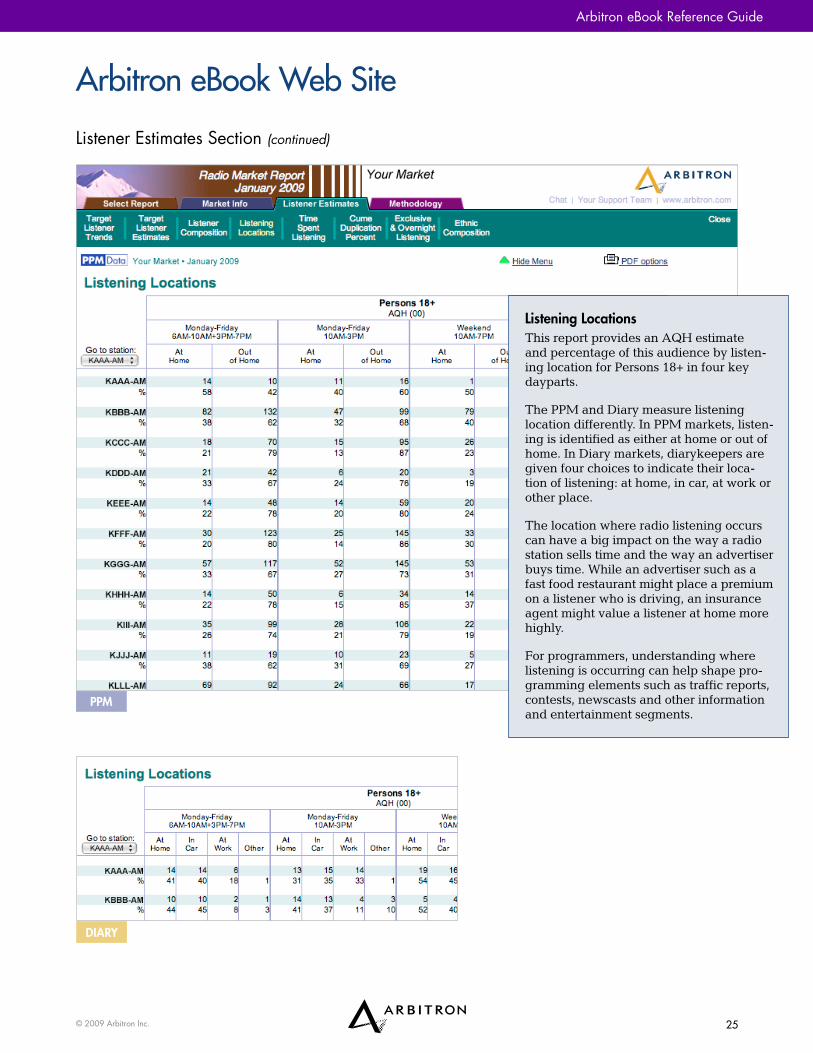
Listening LocationsThis report provides an AQH estimate and percentage of this audience by listen-ing location for Persons 18+ in four key dayparts.
The PPM and Diary measure listening location differently. In PPM markets, listen-ing is identified as either at home or out of home. In Diary markets, diarykeepers are given four choices to indicate their loca-tion of listening: at home, in car, at work or other place.
The location where radio listening occurs can have a big impact on the way a radio station sells time and the way an advertiser buys time. While an advertiser such as a fast food restaurant might place a premium on a listener who is driving, an insurance agent might value a listener at home more highly.
For programmers, understanding where listening is occurring can help shape pro-gramming elements such as traffic reports, contests, newscasts and other information and entertainment segments.

26© 2009 Arbitron Inc.
Arbitron eBook Reference Guide
PPM
DIARY
Arbitron eBook Web Site
Listener Estimates Section (continued)
Listening Locations (continued)
Report Features
PPM Diary
LocationsOut of Home •At Home • •In Car •At Work •Other •DemoP18+ • •Estimates • •AQH (00) • •Location % Within Daypart • •
DaypartsMon-Fri 6AM-10AM • •Mon-Fri 3PM-7PM • •Mon-Fri 10AM-3PMWeekend 10AM-7PMMon-Sun 6AM-Mid • •

27© 2009 Arbitron Inc.
Arbitron eBook Reference Guide
PPM
DIARY
Arbitron eBook Web Site
Listener Estimates Section (continued)
Time Spent ListeningThe Time Spent Listening (TSL) report is how long listeners spend with a radio sta-tion in a week. In a typical scenario, the demographic with the highest time spent listening for a station should match the sta-tion’s stated target audience.
For advertisers, TSL provides valuable insight on the connection listeners make with a station. TSL is also an essential tool for making programming decisions.
For PPM markets, TSL is reported for 11 demographic targets; for Diary markets, TSL is reported for 10 demographic targets. Diary markets also include a two- or four-book average.
Report Features
PPM Diary
DemoP6+ •P12+ • •Persons, Men and Women:
18-34 • •25-54 • •35-64 • •
EstimateTime Spent Listening • •DaypartMon-Sun 6AM-Mid • •

28© 2009 Arbitron Inc.
Arbitron eBook Reference Guide
PPM
DIARY
Arbitron eBook Web Site
Listener Estimates Section (continued)
Cume Duplication PercentThis report answers the question “What percentage of a station’s audience also lis-tens to other radio stations and which ones are they?”
The total week Cume is listed under each station’s call letters at the top of the page. For PPM markets, Cume is available for both 6+ and 12+; for Diary markets Cume is listed for 12+. As you look down each station’s column, you will see the percent-age of Cume it shared with the station in the left-hand column of that row.
For radio stations, this report can be used to identify which stations compete most strongly for the attention of your current listeners.
For advertisers, this report can help deter-mine which stations to include on a buy. If you are attempting to build the most reach into a radio schedule, you would choose the stations that duplicate the least. If you want to add frequency to a schedule, you would choose stations that share the most audience.
Report Features
PPM Diary
DemoP6+ •P12+ • •EstimatesCume (00) and % Duplication Each Pair of Stations
• •
DaypartMon-Sun 6AM-Mid • •

29© 2009 Arbitron Inc.
Arbitron eBook Reference Guide
PPM
DIARY
Arbitron eBook Web Site
Listener Estimates Section (continued)
Exclusive & Overnight ListeningExclusive This report provides the percentage of a station’s audience that listens to no other radio station. This report can be very useful in demonstrating the loyalty of a station’s audience. If an advertiser wants to reach this audience by radio, it can be done only on one station!
Overnight While Midnight to 6AM generally has a smaller audience than Morning Drive, there is substantial inventory during this daypart and there are many advertisers that would find this daypart beneficial. Some examples include convenience stores, after-hours clubs, all-night restau-rants and 24-hour pharmacies.
To find how many listeners are listening exclusively during Midnight to 6AM, sim-ply subtract the Monday-Sunday 6AM to Midnight Cume from the 24-hour Cume.
Report Features
PPM Diary
DemoP6+ •P12+ • •EstimatesAQH (00) • •Cume (00) • •DaypartExclusive Cume Mon-Sun 6AM-Mid • •
Mon-Sun Mid-6AM • •Mon-Sun 6AM-Mid • •

30© 2009 Arbitron Inc.
Arbitron eBook Reference Guide
PPM
DIARY
Arbitron eBook Web Site
Listener Estimates Section (continued)
Ethnic CompositionThis report is a great tool for stations with a strong ethnic audience and for advertisers wishing to reach ethnic consumers.
In Metros that are controlled for black population, Hispanic population or both, estimates are provided for AQH and Cume for the controlled population. The percent-age of a station’s audience that is black or Hispanic is shown for both AQH and Cume.
Report Features
PPM Diary
DemoP6+ •P12+ • •EstimatesAQH (00), Ethnic % and Rating • •
Cume (00), Ethnic % and Rating • •
DaypartMon-Sun 6AM-Mid • •

31© 2009 Arbitron Inc.
Arbitron eBook Reference Guide
DIARY
Arbitron eBook Web Site
Listener Estimates Section (continued)
TSA Target Listeners (Diary Only)(Available Spring and Fall surveys. Includes corresponding Metro estimates.)
This report shows audience estimates for both the Metro and non-Metro TSA counties.
To calculate the non-Metro audience for a station, subtract the Metro AQH or Cume from the corresponding TSA AQH or Cume.
Report Features Diary
DemosP12+ •Persons, Men and Women:
18-34 •25-54 •35-64 •
EstimatesTSA and Metro AQH (00) •TSA and Metro Cume (00) •DaypartsMon-Sun 6AM-Mid •

32© 2009 Arbitron Inc.
Arbitron eBook Reference Guide
DIARY
Arbitron eBook Web Site
Listener Estimates Section (continued)
DMA Target Listeners (Diary Only)(Available Spring and Fall surveys.)
This report provides radio listening esti-mates based on Nielsen Media Research, Inc.’s Designated Market Area (DMA). The DMA is a geography defined by televi-sion viewing patterns. Every county in the United States is assigned to a single DMA. The DMA is a standard market definition for buying and selling television, newspa-pers, outdoor advertising and other media.

33© 2009 Arbitron Inc.
Arbitron eBook Reference Guide
Arbitron eBook Web Site
Methodology Section
The Methodology section is where you’ll find information including links to the Local Syndicated Services Descriptions of Meth-odology, Audience Estimates Reliability tables and other useful information.

Arbitron eBook Reference Guide
34© 2009 Arbitron Inc.
What You Can/Can’t Do With the Numbers
Certain estimates can be added together and others cannot. Since it’s often difficult to remember which estimates are compatible, here’s a convenient chart:
Do’s and Don’ts
Station+ Station
Demographic+ Demographic
Daypart+ Daypart
AQH Persons Yes Yes No
AQH Ratings Yes No No
AQH Shares Yes No No
Cume Persons No Yes No
Cume Ratings No No No
This chart assumes a constant geography and non-overlapping demographics/dayparts (Metro compared to Metro; 18-34 added to 35-64).
AQH Persons, Ratings, SharesStations: For all AQH estimates (Persons, Ratings and Shares), stations may be added together so long as the demo and daypart for the individual station estimates are the same.
Demographics: For AQH Persons, demographic cells may be added together to produce broader demo-graphics (e.g., Teens and Persons 18-24 can be added together to produce Persons 12-24) so long as the daypart is held constant. However, for AQH Ratings, demos are not additive because their denominators are entirely different populations. Likewise, for AQH shares, demos are not additive because their denomi-nators are entirely different AQH PUR* (or PUMM** for PPM) Totals.
In order to combine demos for Ratings, it is necessary to uncalculate the station rating, combine the demos, then recalculate the Rating:
Men 18-24 + Men 25-34 = AQH Rating AQH Rating
Men 18-24 Men 25-34 AQH Pers AQH Pers M18-24 Pop
+ M25-34 Pop
=
(Men 18-24 + Men 25-34) AQH Pers AQH Pers (M18-24 Pop + M25-34 Pop)
=
M18-34 AQH Persons = Men 18-34 Rating M18-34 Pop
Similarly, in order to combine demos for Shares, it is necessary to uncalculate the station Share, com-bine the demos, then recalculate the Share (for PPM, PUMM replaces PUR):
Men 18-34 Share + Men 25-34 Share =
Men 18-24 AQH Pers + Men 25-34 AQH Pers = M18-24 AQH PUR M25-34 AQH PUR
M18-24 AQH Pers + Men 25-34 AQH Pers = M18-24 AQH PUR + M25-34 AQH PUR
M18-34 AQH Persons = Men 18-34 Share M18-34 AQH PUR
* PUR = Persons Using Radio. It is a convenient shorthand for Metro or DMA Totals.
** PUMM = Persons Using Measured Media. Also known as Metro Totals.

Arbitron eBook Reference Guide
35© 2009 Arbitron Inc.
Dayparts: Daypart AQH estimates are not additive under any circumstance since, by definition, daypart is not held constant. It was demonstrated above that AQH Ratings and Shares for combined demos are not the sums of the Ratings and Shares for the individual demos, but the weighted averages of the Ratings and Shares for the individual demos. Likewise for com-bined dayparts: They are the weighted averages of the component dayparts, not the sum of the compo-nent dayparts; and they, too, are computed by first un-averaging AQH Persons for the component dayparts, summing the Quarter-Hour Persons and then dividing by the number of quarter-hours in the combined day-part to get the Average Quarter-Hour Persons for the combined daypart:
Mon-Fri 6A-7P + Mon-Fri 7P-MID = AQH Persons AQH Persons
(Mon-Fri 6A-7P x 260 ) + (Mon-Fri 7P-MID x 100 ) = AQH Pers QHs AQH Pers QHs 360 QHs
Mon-Fri 6A-7P + Mon-Fri 7P-MID = QH Persons* QH Persons 360 QHs
Mon-Fri 6A-MID QH Persons = Mon-Fri 6A-MID 360QHs AQH Persons
What You Can/Can’t Do With the Numbers
Cume Persons, RatingsStations: The definition of Cume is the number of dif-ferent persons listening to a particular station or group of stations. Cume estimates for individual stations can-not be added together because of possible duplication: The same listener would be counted more than once if she/he listened to more than one of the stations in the combination.
Demographics: Cume Persons for nonoverlapping de-mographic groups may be added together, since there is no possibility of counting the same person twice, so long as the daypart for the individual station estimates is the same. However, Cume Ratings are not addi-tive, for the same reason that AQH Ratings are not additive: because they are calculated using different denominators (i.e., population bases).
Dayparts: Cume estimates for different dayparts are not additive under any circumstances—for the same reason that AQH estimates for different dayparts are not additive and also because of possible duplication of Cume persons across dayparts.

Arbitron eBook Reference Guide
36© 2009 Arbitron Inc.
Basic Equations and Buying/Selling Formulas
This section contains equations and formulas you can use to make the most of the audience estimates in your Radio Market Report. Whether you’re buying or selling radio, following these simple equations can give you the information you need to be on top of any buying/selling situation.
Designed in a workbook format, this section allows you to provide your own information and apply your ratings skills right away using your own current Radio Market Report.
With this information (below), you’ll be able to calculate:
• Average Quarter-Hour Rating
• Average Quarter-Hour Share
• Cume Rating
• Target Audience Efficiency
• Exclusive Cume Percent
• Exclusive Cume Rating
• Time Spent Listening
• Turnover
Basic Reference Data
Metro:
Station:
Daypart:
Demo:
Station Metro*
Persons 12+AQH Persons
Demo AQH Persons
Demo Cume Persons
Demo Exclusive Persons
Demo Total AQH Persons
(AQH PUR)** Demo Population
* Could also be calculated for TSA or DMA, so long as all estimates and populations reflect the same geography.
** PUMM for PPM.

Arbitron eBook Reference Guide
37© 2009 Arbitron Inc.
Basic Equations and Buying/Selling Formulas
Basic CalculationsAverage Quarter-Hour Rating expresses the AQH Persons estimate for a demographic group as a per-centage of that population in a geographic area. A rating of 1 represents 1% of the population.
AQH Persons x 100 = Average Quarter-Hour Rating Population
Metro:
Station:
Daypart:
Demo:
AQH Persons ( ) x 100 = AQH Rating Population ( ) ( )
Average Quarter-Hour Share is a station’s AQH Per-sons audience expressed as a percentage of total radio listening (Metro Total or DMA Total) for a demograph-ic group.
AQH Persons x 100 = AQH Share Metro Total AQH Persons
Metro:
Station:
Daypart:
Demo:
AQH Persons ( ) x 100 = AQH ShareMetro Total ( ) AQH Persons ( )
Cume Rating expresses the Cume Persons estimate for a demographic group as a percentage of that popula-tion in a geographic area. A Cume Rating of 20 means that a station is reaching an estimated 20% of the total population.
Cume Persons x 100 = Cume Rating Population
Metro:
Station:
Daypart:
Demo:
Cume Persons ( ) x 100 = Cume Rating Population ( ) ( )
Target Audience Efficiency (Audience Composition) expresses a station’s AQH Persons audience for a particular demographic target as a percentage of the station’s total (P12+ for Diary and P6+ for PPM) audi-ence. This figure demonstrates a station’s coverage of a particular demographic target and is valuable when deciding between two alternatives; the more pre-cisely targeted station (i.e., the station with the higher percent) is the more efficient. This concept can also be applied to Cume and Time Spent Listening.
Station Demo AQH Persons x 100 = TAE Station Total AQH Persons
Metro:
Station:
Daypart:
Demo:
Station Demo AQH Persons ( ) x 100 = TAE ( )Station Total AQH Persons ( )

Arbitron eBook Reference Guide
38© 2009 Arbitron Inc.
Exclusive Cume Percent is a station’s Exclusive Cume Persons audience expressed as a percentage of its to-tal Cume Persons audience. This figure is the percent of a station’s total Cume audience that listens only to that station and reflects the loyalty of the station’s audience.
Exclusive Cume Persons x 100 = Exclusive Cume Percent
Cume Persons
Metro:
Station:
Daypart:
Demo:
Exclusive Exclusive Cume Persons ( ) x 100 = Cume Percent Cume Persons ( ) ( )
Exclusive Cume Rating is a station’s Exclusive Cume Persons audience for a target demographic expressed as a percentage of the population for that demograph-ic. This figure demonstrates the percentage of target customers that can only be reached by that station.
Exclusive Cume Persons x 100 = Exclusive Cume Rating
Population
Metro:
Station:
Daypart:
Demo:
Exclusive Exclusive Cume Persons ( ) x 100 = Cume RatingPopulation ( ) ( )
Time Spent Listening (TSL) is the amount of time the average listener spends with a particular station during a daypart. It is calculated by dividing the total amount of listening (in quarter-hours) by the total number of listeners. Total quarter-hours is computed by “unaveraging” Average Quarter-Hour Persons—that is, multiplying AQH Persons by the number of quarter-hours in the daypart (see calculation below):
AQH Persons x Quarter-Hours in Daypart = TSL Cume Persons
Metro:
Station:
Daypart:
Demo:
AQH Persons QHs in Daypart ( ) x ( ) = TSL ( ) Cume Persons ( )
Turnover is the number of different groups of persons that make up a station’s audience. It is the ratio Cume Persons to AQH Persons. The lower the turnover fac-tor, the more loyal the station’s audience. The higher the turnover factor, the faster the rate of Cume growth. Turnover reflects the relationship between AQH and Cume.
Cume Persons = Turnover Factor AQH Persons
Metro:
Station:
Daypart:
Demo:
Cume Persons ( ) = Turnover ( ) AQH Persons ( )
Basic Equations and Buying/Selling Formulas

Arbitron eBook Reference Guide
39© 2009 Arbitron Inc.
Buying/Selling FormulasGross Impressions (GIs) are the number of impres-sions a schedule will deliver. GIs are computed by multiplying the AQH Persons estimate for the par-ticular daypart by the number of spots to be run in the daypart. The GIs for the individual dayparts are then summed to obtain the total number of GIs a schedule will deliver.
Note: As the name implies, Gross Impressions repre-sent the total number of times a spot will be heard—not the number of persons who will hear it.
Metro:
Station:
Demo:
AQH Daypart Persons x # Spots = GIsExample: M-F 6A-10A 4700 x 5 = 23500( ) ( ) x ( ) = ( )( ) ( ) x ( ) = ( )( ) ( ) x ( ) = ( )( ) ( ) x ( ) = ( )( ) ( ) x ( ) = ( )
Total Schedule GIs = ( )
Gross Rating Points (GRPs) are the number of rating points a schedule will deliver. The most precise way to compute GRPs is to compute GIs as shown above, and then divide Schedule GIs by the population for the particular demographic group.
Note: Although Gross Rating Points are Gross Im-pressions expressed as a percentage of the popula-tion, GRPs should not be understood as the actual percentage of the population that would be exposed to the spot (more below).
Schedule Gross Impressions = Schedule GRPs Population
Metro:
Station:
Daypart:
Demo:
Schedule GIs ( ) = Schedule GRPs ( )Population ( )
Basic Equations and Buying/Selling Formulas
How to Calculate Quarter-Hours in Daypart: # days in daypart x # hours in daypart x # QHs in an hour = # QHs in a daypart
Example:
Mon-Fri 6A-10A = 5 days x 4 hours x 4 QHs = 80 QHs in daypart

Arbitron eBook Reference Guide
40© 2009 Arbitron Inc.
An alternative method of computing GRPs is to multi-ply the AQH Rating for each daypart by the number of spots to be run in the daypart. Then, sum the GRPs for the individual dayparts to obtain the Schedule GRPs.
Metro:
Station:
Demo:
AQH AQH Daypart Rating x # Spots = GRPsExample: M-F 6A-10A 2.3 x 5 = 11.5( ) ( ) x ( ) = ( )( ) ( ) x ( ) = ( )( ) ( ) x ( ) = ( )( ) ( ) x ( ) = ( )( ) ( ) x ( ) = ( )
Total Schedule GRPs = ( )
Caution: 100 GRPs do not deliver 100% of the market
Some users of audience ratings mistakenly believe that if they buy 100 Gross Rating Points in a market, they are buying 100% of the available listeners. It sounds reasonable: If one rating point equals 1% of the population, then 100 rating points must equal everyone in the market.
But remember that Gross Impressions (the basis for Gross Rating Points) equals the number of spots times the estimated number of persons hearing the spot, and does not necessarily represent different people; in fact, there is always some duplication, and there may be quite a lot of duplication.
For example, in a Metro consisting of 125,000 Persons 12+, it wouldn’t even be possible for 125,000 GIs (or
100 GRPs) to represent everyone in the market. First, not every person in a market listens to radio; then, of those who do listen to radio (approximately 95%), many listen to more than one station. So, even if it was considered desirable to completely avoid duplication, it probably wouldn’t be achievable.
One final note: Just as 100 GRPs does not represent 100% coverage of a market, 200 or 300 GRPs does not represent reaching the entire market two or three times. Three hundred (300) GRPs, for example, may represent a reach of 30 and an average frequency of 10—or a reach of 50 and an average frequency of 6.
Reverse Gross Impressions is a term often used when calculating the number of spots needed on a compet-ing station to match your station’s Gross Impressions.
Your Station Gross Impressions = # of spots needed Competing Station AQH Persons
Metro:
Demo:
Daypart:
Your Station:
Competing Station:
Your Station GIs ( ) = # of spots ( )Competing Station AQH ( )
Basic Equations and Buying/Selling Formulas

Arbitron eBook Reference Guide
41© 2009 Arbitron Inc.
Cost Per Gross Rating Point (“Cost Per Point”) is the average cost of one GRP in a given schedule. It is calculated by dividing the total cost of the schedule by the total number of GRPs the schedule is expected to deliver.
Cost of Schedule = Cost Per Point GRPs
Metro:
Station:
Daypart:
Demo:
Cost of Schedule ( ) = Cost Per Point ( )GRPs ( )
Cost Per Thousand (CPM) is the estimated cost of each 1,000 Gross Impressions delivered by a schedule.
Cost of Schedule x 1,000 = CPM GIs
Metro:
Station:
Daypart:
Demo:
Cost of Schedule ( ) x 1,000 = CPM ( )GIs ( )
Reverse Cost Per Thousand is the maximum rate per spot a competing station can charge to be as cost-effective as your station.
Your Competing
Station CPM x Station AQH Persons = Reverse CPM
1,000
Metro:
Demo:
Daypart:
Your Station:
Competing Station:
Your Competing Station Station CPM x AQH ( ) = Reverse CPM ( ) 1,000
Listeners Per Dollar expresses the number of persons reached (or impressions achieved) with a single adver-tising dollar. This calculation often demonstrates the advantage of radio over direct mail.
AQH Persons = Listeners Per Dollar Spot Cost
Metro:
Station:
Daypart:
Demo:
AQH Persons ( ) = Listeners Per Dollar ( )Spot Cost ($ )
Basic Equations and Buying/Selling Formulas

Arbitron eBook Reference Guide
42© 2009 Arbitron Inc.
Reach and FrequencyReach and Frequency is the process of answering two questions:
• How many different people hear the spot at least once during its series of plays on the air?
• How many times, on average, does the listener hear the spot?
Reach identifies the estimated number of different people reached by a schedule. It is the unduplicated audience a station delivers. Reach can be expressed either as different persons or as a rating.
Frequency is the average number of times the undu-plicated listener will hear an advertising message.
Gross ImpressionsFrequency = Reach of Schedule (Persons)
OR
Gross Rating PointsFrequency = Reach of Schedule (Rating)
Advertisers have been using Reach and Frequency for many years to estimate the delivery of advertis-ing schedules. This estimate helps determine the total number of different people that will hear an advertis-ing schedule at least once. However, since the spot is not on the air constantly, the estimate is less than the station’s Cume estimate for the same time period. Once Reach has been determined, Frequency can be easily calculated.
Most Reach and Frequency formulas used for evalu-ating radio advertising schedules are models or mathematical simulations. Reach, when calculated on models, uses probability analysis to determine an estimated audience size.
Arbitron’s software applications provide an efficient and easy way to calculate Reach and Frequency.
Station:
Daypart:
Demo:
AQH Persons:
Cume Persons:
No. of Spots in Schedule:
Gross Impressions:
Cost-Per-Thousand Net Reach is the cost of reaching 1,000 different people on a station.
Cost of Schedule $ (000) = CPM Net Reach Net Reach of Schedule
Daypart:
Demo:
Station:
Cost of Schedule ($ ) = CPM Net Reach ($ )Net Reach of Schedule ( )
Basic Equations and Buying/Selling Formulas

Arbitron eBook Reference Guide
43© 2009 Arbitron Inc.
Radio Ratings Review Quiz
Here’s a brief True/False quiz to help you test your knowledge of radio audience estimates and the information contained in Arbitron eBook. All the answers can be found within this reference guide.
True or False
1. A station’s share is based on population.
2. To calculate Gross Impressions, multiply the number of spots by the AQH Persons audience.
3. To find changes in a station’s market share over time, you would refer to the “Target Listener Trends” section.
4. You can’t add Cume estimates across stations.
5. Cume Ratings can indicate the audience penetration of stations.
6. 100 GRPs deliver 100% of the available audience of a market.
7. Exclusive Cume listening estimates identify the number of different people who listened to one station during a time period.
8. If a station has an average audience of 12,000 and a cost-per-spot of $45, the cost-per-thousand for 20 spots would be $3.75.
9. You can add Cume Ratings across stations and dayparts.
10. A person listening to all quarter-hours during a time period counts more in the Cume Persons estimate than someone only tuning in during one quarter-hour.
11. A station has an Average persons audience of 25,700 and a Cume persons audience of 135,500. The TSL for M-F 6AM-10AM is 15.2 quarter-hours.
12. Using the above example, the turnover factor for this station is 5.3.
13. Average Quarter-Hour Ratings and Cume Ratings have the same base.
14. Gross Impressions represent the number of people that have heard an advertising spot.
15. The higher the turnover factor, the faster the rate of Cume growth.
Answers
1. F 2. T 3. T 4. T 5. T 6. F 7. T 8. T 9. F 10. F 11. T 12. T 13. T 14. F 15. T
Arbitron eBook Reference Guide
44© 2009 Arbitron Inc.
Information and Training Resources
Arbitron offers many free resources to help you get the most value for your subscription. You can get information on radio markets, reports on the evolving way consumers use media and a lot more at www.arbitron.com. Here’s a sampling of some of what’s available:
Arbitron Radio Market RankingsOnline list showing the population rankings for all Arbitron-rated markets. Includes information on measurement type (PPM or Diary), Differential Survey Treatments, Qualitative data and the Metro 12+ population.
www.arbitron.com/home/mm001050.asp
Arbitron Market Survey SchedulesOnline guide detailing survey dates for Diary and PPM markets.
www.arbitron.com/home/surveysched.asp
Arbitron Ratings Data Delivery SchedulesOnline lookup tool for market delivery dates for Arbi-tron ratings data services. Includes delivery informa-tion for Arbitron eBook, ArbitrendsSM, Black summary data, Hispanic summary data, Maximi$er®, Media ProfessionalSM, PPM WeekliesSM and PPM Monthlies services.
www.arbitron.com/home/delivsched.asp
Arbitron Qualitative Data Delivery SchedulesOnline lookup tool for market delivery dates for Arbitron qualitative consumer data services. Includes delivery information for Scarborough, Retail Direct and Qualitative Diary services.
www.arbitron.com/radio_stations/QualSched.asp
Glossary of Selected TermsAn online glossary of terms used in radio ratings is included in Arbitron’s Local Syndicated Services Description of Methodology (DOM), which can be accessed through Arbitron eBook.
Rating Distortion & Ratings Bias HandbookPrinter-friendly downloadable guide that provides infor-mation on Arbitron’s Special Station Activities policies. The guide is designed to help station personnel avoid activities that sensitize or bias radio listeners about the survey process.
www.arbitron.com/downloads/ratingdistortionandbias.pdf
Training and Support CenterOnline site that provides a wide array of self-paced interactive courses, recorded classes and live interactive training sessions on a wide variety of Arbitron services.
http://www.arbitrontraining.com
Free Studies and ReportsCheck out Arbitron’s acclaimed series of studies and reports on emerging trends in consumer behavior and media usage. Recent studies have includes a review of radio’s emerging digital platforms, an evaluation of the effectiveness of product sampling as a marketing and sales tool and the way Hispanic Americans use radio.
http://www.arbitron.com/home/studies.htm

Arbitron eBook Reference Guide
45© 2009 Arbitron Inc.
Glossary of Terms and Abbreviations
Arbitron’s Local Syndicated Services Description of Methodology can be accessed through Arbitron eBook and includes a comprehensive glossary of terms. A subset of frequently used terms is listed below.
Glossary of Terms
Average Quarter-Hour Composition: An encoded sta-tion’s Target AQH Persons divided by its Total Persons 6+ AQH audience. P D
Average Quarter-Hour (AQH) Persons: The estimated average number of persons who were exposed to or listened to a station for a minimum of five minutes within a reported daypart. (Note: the five minutes of exposure need not be continuous). AQH is used to es-timate duration of listening (TSL or AWTE). Expressed in hundreds (00). P D
Average Quarter-Hour (AQH) Rating: A station’s Average Quarter-Hour Persons estimate expressed as a percentage of all persons estimated to be in the specified demographic group. P D
AQH Persons x 100 = AQH Rating (%) Population
Average Quarter-Hour Share: The Average Quarter-Hour Persons estimate for a given station expressed as a percentage of the Metro Total Average Quarter-Hour Persons estimate within a reported daypart. P D
Average Weekly Time Exposed (AWTE): See “Time Spent Listening (TSL).” P
Condensed Radio Market Report (CRMR): Con-densed Reports have smaller sample objectives for the Metro and TSA, and contain fewer dayparts and demographics than Standard Radio Market Reports. Effective Fall 2005, estimates published in Radio Market Reports for non-embedded condensed radio markets consist of averages from the two most recent survey periods. D
Cost Per Gross Rating Point (or “Cost Per Point”): The cost of achieving a number of impressions equiva-lent to one percent of the population in a given demo-graphic group. P D
Cost of Schedule = Cost Per Gross Rating Point GRPs
Cost Per Thousand (CPM): The cost of delivering 1,000 Gross Impressions (GIs). P D
Cost of Schedule x 1,000 = CPM Gross Impressions
OR
Spot Cost x 1,000 = CPM AQH Persons
“Cell-Phone-Only” Household: Households with cel-lular telephone service that do not also have landline telephone service. P D
Compliance Rate (PPM): The percentage of Metered panelists eligible to be included in the In-Tab sample. A panelist may be ineligible due to factors such as an extended period of travel away from home. P
Cume Duplication Percent: The percentage of one station’s estimated Cume audience that listened to a second station. P D
Cume Persons: The estimated number of different persons who were exposed to or listened to a station for a minimum of five minutes in a quarter-hour within a reported daypart. (Cume estimates may also be referred to as cumulative or unduplicated estimates.) This estimate is expressed in hundreds (00). P D
Cume Rating: The Cume persons audience expressed as a percentage of all persons estimated to be in the specified demographic group. P D
Cume Persons x 100 = Cume Rating (%) Population
Demographics: Characteristics of the population such as age, sex, race/ethnicity, etc. P D
P D= PPM = Diary

Arbitron eBook Reference Guide
46© 2009 Arbitron Inc.
Designated Delivery Index (DDI): A measure of sample delivery that indicates how the PPM and Diary services deliver specific demographic groups, such as race/ethnicity and age cells. It is based on how well Arbitron meets its In-Tab goals. A 100 DDI is consid-ered ideal. DDI is calculated as follows:
Demo or Geo Average Daily In-Tab
= Designated Delivery IndexDemo or Geo
Population Percent
xAverage
Daily Target
DDI reflects the extent to which the In-Tab sample aligns with “perfect” sample distributions based on the population universe and the total In-Tab target, as opposed to proportionality for Diary, compares the ac-tual share of in-tab to the targeted share of in-tab. DDI is not affected by higher or lower actual In-Tab results for other demos. P D
Designated Market Area (DMA): Nielsen Media Re-search, Inc.’s geographic market design, which defines each television market exclusive of others based on measurable viewing patterns. Every county (or county equivalent) in the U.S. is assigned exclusively to one DMA. Arbitron reports radio listening estimates for the Top 50 DMAs (ranked on TV households) in the Radio Market Reports of all Standard radio markets whose Metros are located within the DMA and whose names are contained in the DMA name. P D
Discrete Demographics: This term refers to uncom-bined or nonoverlapping sex/age groups, such as Men and/or Women 18-24, 25-34, 35-44, as opposed to “tar-get” or aggregate demographics, such as Men and/or Women 18+, 18-34, 18-49 or 25-49. P D
Effective Sample Base (ESB): The theoretical sample size used to estimate the sampling error of audience estimates. P D
Exclusive Cume: The number of different persons listening to only one station during a reported daypart. P D
Frequency: The average number of times a person is exposed to a radio spot schedule. P D
Gross Impressions = Frequency Net Reach
Gross Impressions (GIs): The sum of the AQH Persons audience for all spots in a given schedule. P D
AQH Persons x The number of spots in
= GIs
an advertising schedule
Group Quarters: Living arrangements of 10 or more, such as college dormitories, military barracks, nursing homes and prisons. P D
In-Tab Rate (PPM): Metered panelists who qualify for in-tab as a percent of all metered panelists. P
In-Tab Sample (Diary): The number of usable diaries tabulated to produce the market report. D
Listening Location: A location for which Arbitron reports audience estimates. In Diary-based reports, listening locations include: “At Home,” “In a Car,” “At Work” and “Other Place.” In PPM-based reports, listening locations include: “At Home” and “Away from Home.” P D
Metro: Arbitron Metros generally correspond to the Metropolitan Statistical Areas (MSAs, PMSAs, CMSAs) defined by the U.S. Government’s Office of Management and Budget. They are subject to exceptions dictated by historical industry usage and other marketing considerations as determined by Arbitron. P D
Metro Totals and/or DMA Totals (Total listening in the Metro and/or DMA): These total listening esti-mates include listening to reported stations, nonquali-fying commercial stations, noncommercial stations, cable-only stations and unidentified stations. P D
Minimum Reporting Standards (MRS): Criteria used to determine which stations qualify to be listed in a market report. P D
Glossary of Terms and Abbreviations
P D= PPM = Diary

Arbitron eBook Reference Guide
47© 2009 Arbitron Inc.
Net Reach: The number of unique persons reached in a given schedule. P D
Persons-Per-Diary Value (PPDV): The weight as-signed to each diary by sample balancing (based on the diarykeeper’s age, sex, county and, if applicable, ethnic and/or language usage [English/Spanish] group) immediately prior to report processing. It is the number of persons in the population which that diary represents for purposes of processing audience estimates. D
Persons-Per-Meter Value (PPMV): The weight as-signed to each panelist by sample balancing (based on the panelist’s age, sex, county, presence of children, employment status and, if applicable, ethnic and/or language usage [English/Spanish] group) immediately prior to report processing. It is the number of persons in the population that a panelist represents for pur-poses of processing audience estimates. P
Persons Using Radio (PUR): The total amount of listening to radio for a particular demo/daypart/geog-raphy. The term PUR can refer to Persons or Ratings, AQH or Cume. (See also “Metro Totals and/or DMA Totals,” above.) D
Persons Using Measured Media (PUMM): See “Metro Totals.” P
Portable People Meter (PPM): An electronic- measurement device that detects and stores CBET codes as it is exposed to encoded audio. P
Rating (AQH or Cume): The AQH or Cume Persons audience expressed as a percentage of the total popu-lation. P D
Persons x 100 = Rating (%) Population
Sample Performance Indicator (SPI): A metric with which to measure sample performance for a panel de-sign. SPI is tracked at both the household and person levels and is reported for individual media days and for the month. P
Sample Turnover: When a household exits the panel. All households are phased out of the panel after two years, but may be phased out earlier. P
Sampling Unit: A geographic area consisting of a county or county equivalent (e.g., geographic or ethnic split county, or independent city) for which sample is separately selected and monitored. P D
Sex/Age Populations: Various sex/age groups are determined from population estimates within a county. P D
Share: See definition for AQH and/or Cume Share. P D
Station AQH Persons x 100 = Share (%) Metro AQH Persons
Simulcast: The simultaneous broadcast of one station’s broadcast flow by another station (noted in the “Sta-tion Information” section, from information supplied to Arbitron by stations). P D
Target Demographics: Audience groups consisting of multiple discrete demographic cells (e.g., Men 18-34, Women 25-54). P D
Technical Difficulty (TD): Time period(s) of five or more consecutive minutes during the survey period for which an RMR-qualifying station notified Arbitron, in writing, of reduced power, intermittent power, signal interference or time off-air during the station’s autho-rized broadcast day. P D
Glossary of Terms and Abbreviations
P D= PPM = Diary

Arbitron eBook Reference Guide
48© 2009 Arbitron Inc.
Time Spent Listening (TSL): An estimate of the amount of time the average listener spent with a station (or total radio) during a particular daypart. Expressed in hours and minutes. P D
Quarter-hours AQHin a time period x Persons = TSL (in quarter-hours)
Cume Persons
To express TSL in hours and minutes:
TSL (in quarter-hours)4
= HH.XX (TSL in decimal hours)
.XX hoursx 60MM minutes
HH:MM (TSL in hours and minutes)
Total Line Reporting: The reporting of audience esti-mates for stations that simulcast 100 percent of their broadcast day throughout the report period, including commercials and PSAs, under a single set of call let-ters (e.g., the “primary” station’s call letters). P D
Total Survey Area (TSA): A geographic area that includes the Metro Survey Area and may include ad-ditional counties (or county equivalents). D
Turnover: The total number of different groups of persons that make up a station’s audience. P
Cume Persons = Turnover AQH Persons
Universe: The estimated population for an age/sex group in a geographic area. P D
Glossary of Terms and Abbreviations
Frequently Used AbbreviationsAQH Average Quarter-Hour
CMSA Consolidated Metropolitan Statistical Area
CPM Cost Per Thousand
CRMR Condensed Radio Market Report
DDI Designated Delivery Index
DMA Nielsen Media Research, Inc.’s Designated Market Area
DST Differential Survey Treatment
ERP Effective Radiated Power
ESB Effective Sample Base
GIs Gross Impressions
GRPs Gross Rating Points
HAAT Height Above Average Terrain
HDBA High-Density Black Area
HDHA High-Density Hispanic Area
MRC Media Rating Council
MRS Minimum Reporting Standards
MSA Metropolitan Statistical Area
PMSA Primary Metropolitan Statistical Area
PPDV Persons-Per-Diary Value
PUMM Persons Using Measured Media
PUR Persons Using Radio
RMR Radio Market Report
SPI Sample Performance Indicator
SRMR Standard Radio Market Report
TSA Total Survey Area
TSL Time Spent Listening

Arbitron eBook Reference Guide
49© 2009 Arbitron Inc.
About Arbitron
Arbitron Inc. (NYSE: ARB) is a media and market-ing research firm serving the media—radio, televi-sion, cable, online radio and out-of-home—as well as advertisers and advertising agencies. Arbitron’s core businesses are measuring network and local market radio audiences across the United States; surveying the retail, media and product patterns of local market consumers; and providing application software used for analyzing media audience and marketing informa-tion data. The company has developed the Portable People MeterTM, a new technology for media and marketing research.

Arbitron eBook Reference Guide
50© 2009 Arbitron Inc.
Arbitron Offices
Headquarters9705 Patuxent Woods DriveColumbia, MD 21046-1572(410) 312-8000
Atlanta9000 Central ParkwaySuite 300Atlanta, GA 30328-1639(770) 668-5400
Chicago222 South Riverside PlazaSuite 630Chicago, IL 60606-6101(312) 542-1900
Dallas13355 Noel RoadSuite 1120Dallas, TX 75240-6646(972) 385-5388
Los Angeles10877 Wilshire BoulevardSuite 1400Los Angeles, CA 90024-4341(310) 824-6600
New York142 West 57th StreetNew York, NY 10019-3300(212) 887-1300
www.arbitron.com
Arbitron eBookSM, ArbitrendsSM, Maximi$er®, Media ProfessionalSM, Portable People MeterTM, PPMTM and PPM WeekliesSM are marks of Arbitron Inc. DMA® is a registered service mark of Nielsen Media Research, Inc., and is used pursuant to a license from Nielsen Media Research, Inc.
RMR-09-03124