arab petroleum investments corporation (“apicorp”) presentation - apicorp sukuk.pdf · neither...
TRANSCRIPT

October 2015
Arab Petroleum Investments Corporation
(“APICORP”)
Investor Presentation

2
Disclaimer
IMPORTANT: YOU ARE ADVISED TO READ THE FOLLOWING CAREFULLY BEFORE READING, ACCESSING OR MAKING ANY OTHER USE OF THE MATERIALS THAT FOLLOW.
The following applies to this document, the oral presentation of the information in this document by Arab Petroleum Investments Corporation (the “Company”) or any person on behalf of the Company, and
any question-and-answer session that follows the oral presentation (collectively, the “Information”). In accessing the Information, you agree to be bound by the following terms and conditions.
The Information has been prepared by and is the sole responsibility of the Company and has not been verified, approved or endorsed by any lead manager, bookrunner or underwriter retained by the
Company (the "Managers"). The Managers are acting exclusively for the Company and no one else, and will not be responsible for providing advice in connection with the Information to any other party.
Subject to applicable law, none of the Managers accepts any responsibility whatsoever and makes no representation or warranty, express or implied, for the contents of the Information, including its
accuracy, completeness or verification or for any other statement made or purported to be made in connection with the Company and nothing in this document or at this presentation shall be relied upon as
a promise or representation in this respect, whether as to the past or the future. The Managers accordingly disclaim all and any liability whatsoever, whether arising in tort, contract or otherwise (save as
referred above) which any of them might otherwise have in respect of the Information or any such statement.
The Information is an advertisement and does not constitute a prospectus for the purposes of the Prospectus Directive (as defined below). The Information does not constitute or form part or all of, and
should not be construed as, any offer of, or any invitation to sell or issue, or any solicitation of any offer to purchase, subscribe for, underwrite or otherwise acquire, or a recommendation regarding, any
securities of the Company, nor shall it or any part of it nor the fact of its presentation or distribution form the basis of, or be relied upon in connection with, any contract or any commitment whatsoever or any
investment decision. The Information is confidential and is being provided to you solely for your information and may not be reproduced, retransmitted or further distributed to any other person or published,
in whole or in part, for any purpose. If any such offer or invitation is made, it will be made through a separate and distinct documentation in the form of a prospectus, offering circular or other equivalent
document and any decision to purchase or subscribe for any securities pursuant to such offer or invitation should be made solely on the basis of such prospectus and not the Information.
The Information is only being distributed to and is only directed at: (A) persons in member states of the European Economic Area (other than the United Kingdom) who are “qualified investors” within the
meaning of Article 2(1)(e) of Directive 2003/71/EC (as amended and together with any applicable implementing measures in that member state, the “Prospectus Directive”) (“Qualified Investors”); (B) in
the United Kingdom, Qualified Investors who are investment professionals falling within Article 19(5) of the Financial Services and Markets Act 2000 (Financial Promotion) Order 2005 (the “Order”) and/or
high net worth companies, and other persons to whom it may lawfully be communicated, falling within Article 49(2)(a) to (d) of the Order; and (C) such other persons as to whom the Information may be
lawfully distributed and directed under applicable laws (all such persons in (A) to (C) above together being referred to as “relevant persons”). Securities issued by the Company are only available to, and
any invitation, offer or agreement to purchase securities will be engaged in only with, relevant persons. Any person who is not a relevant person should not act or rely on the Information.
The Information contains data compilations, writings and information that are proprietary and protected under copyright and other intellectual laws and may not be redistributed or otherwise transmitted by
you to any other person for any purposes.
The Information should not be considered as a recommendation that any investor should subscribe for or purchase any securities. Any person who subsequently acquires securities must rely solely on the
final prospectus published by the Company in connection with such securities, on the basis of which alone purchases of or subscription for such securities should be made. In particular, investors should
pay special attention to any sections of the final prospectus describing any risk factors. Any such determination should involve, inter alia, an assessment of the legal, tax, accounting, regulatory, financial,
credit and other related aspects of the securities or such transaction.
The Information has not been independently verified and no responsibility is accepted, and no representation, undertaking or warranty is made or given, in either case, expressly or impliedly, by the
Company or any of its officers or advisers as to accuracy, reliability or completeness of the Information or as to the reasonableness of any assumptions on which any of the same is based or the use of any
of the same.
The Information is not intended for distribution or publication in the United States. Neither this document nor any part or copy of it may be distributed, directly or indirectly, in the United States. The
distribution of this document in certain jurisdictions may be restricted by law and persons in to whose possession this presentation comes should inform themselves about and observe any such restrictions.
By reviewing these materials, you represent and agree that you are located outside the United States and you are permitted under the laws of your jurisdiction to receive this presentation. This presentation
is not an offer to sell or a solicitation of any offer to buy the securities of the Company in the United States. The Company’s securities have not been and will not be registered under the Securities Act of
1933, as amended.
Nothing contained in the Information shall be deemed to be a forecast projection or estimate of the Company's future economic performance. The Information contains forward-looking statements. These
forward-looking statements can be identified by the use of forward-looking terminology, including the terms “believes”, “estimates”, “projects”, “expects”, “intends”, “may”, “will”, “seeks” or “should” or, in each
case, their negative or other variations or comparable terminology, or by discussions of strategy, plans, objectives, goals, future events or intentions. Forward-looking statements are statements that are not
historical facts and include statements about the Company’s beliefs and expectations. These statements are based on current plans, estimates and projections and, therefore, undue reliance should not be
placed on them. Forward-looking statements speak only as of the date they are made. Although the Company believes that the beliefs and expectations reflected in such forward-looking statements are
reasonable, no assurance can be given that such beliefs and expectations will be realised.
By accepting the Information, you will be deemed to acknowledge and agree to the matters set forth above. FCA/ICMA stabilisation applies.

3
Agenda
Section 1 4 OVERVIEW OF APICORP
Section 2 11 FINANCIAL POSITION AND PERFORMANCE
Section 3 14 ASSET PROFILE
Section 4 18 FUNDING OVERVIEW
Section 5 21 LIQUIDITY, CAPITAL ADEQUACY & RISK FRAMEWORK
Section 6 24 PEER GROUP ANALYSIS
Section 7 26 KEY CREDIT STRENGTHS
Section 8 28 STRUCTURE OVERVIEW

4
OVERVIEW OF APICORP
Section 1

5
APICORP - Introduction
Arab Petroleum Investments Corporation (APICORP) is a multilateral development bank established on
23 November 1975 under the terms of an agreement signed by the ten Member States of the Organization of Arab
Petroleum Exporting Countries (OAPEC)
APICORP’s mission is to contribute to the development and the
transformation of the Arab hydrocarbon and energy industries through equity
and debt financing, advisory and research.
Mission
Net Worth US$ 1.94 billion
Capital Adequacy Ratio 29.31%
Moody’s Rating Aa3
Key Highlights (as at 30 June 2015)
APICORP is wholly owned by member states of the OAPEC
Kuwait 17%
Saudi Arabia 17%
UAE 17%
Libya 15%
Iraq 10%
Qatar 10%
Algeria 5%
Egypt 3%
Bahrain 3%
Syria 3%
Algeria Libya Egypt
Saudi Arabia
UAE
Qatar
Bahrain
Kuwait
Iraq
Syria

6
APICORP’s Board of Directors
10 Directors representing each of the 10 member states. Board members represent their country’s interest in
APICORP
The Board elects its Chairman. Membership of the Board is for a term of four years and can be renewed for any
number of successive terms.
Algeria
Mr. Farid Baka Member, Audit & Compensation
Committee
Iraq
Nihad A. Moosa Engineer
Egypt
Sherin Ahmed Mohamed Engineer
Saudi Arabia
Dr. Aabed A. Al-Saadoun Chairman of the Board
Chairman of Remuneration &
Nomination Committee
Libya
Mr. Khaled Amr Al-Qunsul Deputy Chairman of the Board
Member of Remuneration &
Nomination Committee
Kuwait
Shaikh Talal Naser A. Al-Sabah Chairman of Audit & Risk Committee
Member of Remuneration &
Nomination Committee
Bahrain
Mr. Mahmood Hashim Al-
Kooheji Member of Remuneration &
Nomination Committee
Qatar
Mr. Mohamed Khalid Al-
Ghanem Member of Audit & Risk Committee
United Arab Emirates
Dr. Matar Al-Neyadi Deputy Chairman of Audit & Risk
Committee
Syria
H.E. Eng. Suleiman Al-Abbas

7
APICORP’s Governance and Organizational Structure
Organizational Structure
Board Remuneration
& Nomination
Committee
Board of Directors
Chief Executive &
General Manager
Board Audit & Risk
Committee
CE&GM Office
PA’s
Advisors
Corporate Business
Strategy & PMO
Deputy Chief
Executive & General
Manager
Corp
Communication
& CSR
Operations IT Administration
Human
Resources Finance
Investments Corporate
Finance
Treasury &
Capital
Markets
Internal Audit
Manager
Governance
Group
Legal
Risk
Management
Compliance
Energy
Research
Dr. Raed Al-Rayes
Deputy Chief Executive and General Manager
Mr. Bennie Burger
Head of Corporate Strategy & PMO, Acting Head of Investments
Mr. Nicolas Thévenot
Head of Corporate Finance
Mr. Hesham Farid
Head of Treasury & Capital Markets
Mr. Ayman Zeyada
Head of Financial Control
Mr. Ali Hassan Fadel
General Counsel & Board Secretary and Compliance Officer
Mr. Ajay Kumar Jha
Head of Risk Management
Mr. Mohammed Al-Mubarak
Head of Operations
Mr. Hamdi Said Bata
Head of Human Resources & Administration
Mr. Raed Sirhan
Head of Information Technology

8
Making Sound Progress Across All Core Business Lines
All three core business lines namely Investments, Corporate Finance and Treasury and Capital Markets recorded
significant growth in 2014.
Dividend income generated by direct equity investment portfolio reached
US$ 91 million, in 2014, 26% higher
than income generated in 2013
Share of Islamic finance assets grew to
29% of total loan portfolio in 2014 from
27% in 2013
Key Achievements of 2014 and 2015 YTD
Awarded Best Dual Syndicated Loan Deal of 2014 from Islamic Finance News for
APICORP’s active management of financial obligations, extending tenors, reducing
funding costs and diversifying investor base
APICORP’s direct equity investments portfolio
comprises of seven petrochemical companies, four oil
and gas field service companies, one LPG extraction
company, one engineering products manufacturer and
one petroleum products storage company in six Arab
countries.
Direct equity investments increased from US$866
million at end 2014 to US$944 million at June 30, 2015.
In 2014, APICORP was involved in the acquisition of
National Petroleum Services (NPS), which represents
one of the largest regional private equity transactions
of 2014.
APICORP also committed capital to the Powervest
Fund, the first Shariah compliant specialised
infrastructure fund to be established in Saudi Arabia,
and acquired a 15% shareholding in Saudi Mechanical
Industries (SMI), a Saudi Arabian engineering
company engaged in manufacturing products with a
focus on fluid flow and control equipment in 2015.
The Corporate Finance business arranges financing
through loans and credit for projects developed by
local, regional and international sponsors in the energy
and hydrocarbon sectors.
Total income generated by corporate finance activities
in 2014 amounted to US$59 million and US$ 29 million
for the six months ending 30 June 2015
Average loan balance at June 30, 2015 remained
stable at US$2.86 billion compared with US$2.94 billion
at end 2014, in line with its strategy to re-balance the
asset composition of the balance sheet.
APICORP concluded 15 transactions in 2014 totaling
over US$608 million ensuring active presence of the
corporation in both project and trade finance and
increased its support to key clients comprising top 10
energy commodity players worldwide. During H1 2015,
APICORP concluded 12 transactions totaling US$ 355
million.
The Treasury and Capital Markets business is to
ensure that APICORP is adequately funded, market
risks are proactively managed and the investment
portfolio provides enhanced earnings not correlated to
APICORP’s other two cyclical business lines.
Total income generated by treasury and
capital markets activities in 2014 amounted to
US$ 36.9 million and US$ 18 million for the six months
ending 30 June 2015
Total market value of investments in the
fixed income securities portfolio amounted to
US$1.12 billion at end June 2015 and continued to
remain focused on strong credits with an average
portfolio rating of ‘A’.
Treasury and capital market assets recorded at US$
1.9 billion at end June 2015.
As at 30 June 2015, APICORP had six fully drawn
bank term loans and one issue of debt securities
outstanding.
Investments Corporate Finance Treasury and Capital Markets

9
Rating Agency Review of APICORP
APICORP’s asset quality and capital adequacy remain strong, despite the drop in global oil prices.
APICORP’s shareholders have explicitly committed to support the institution on a “joint and several” basis.
“The Member States undertake, jointly and severally, to support the corporation, protect it and embrace its causes in every way
that ensures the protection of its rights and interests internationally and otherwise and undertake to facilitate all the activities
related to its objectives and to adopt all possible measures to that end.”
Strong Capital Adequacy
High Quality Asset Portfolio
Relatively Low Leverage
Benefits from de facto preferred creditor status
Strong ability of shareholders to support
Rated Aa3, Stable Outlook Since September 2012
Reconfirmed in September 2015
Provisional (P)Aa3 senior unsecured MTN rating on APICORP Sukuk Limited’s US$
3.0billion Trust Certificate Issuance Programme assigned in June 2015
10
Forward Strategy
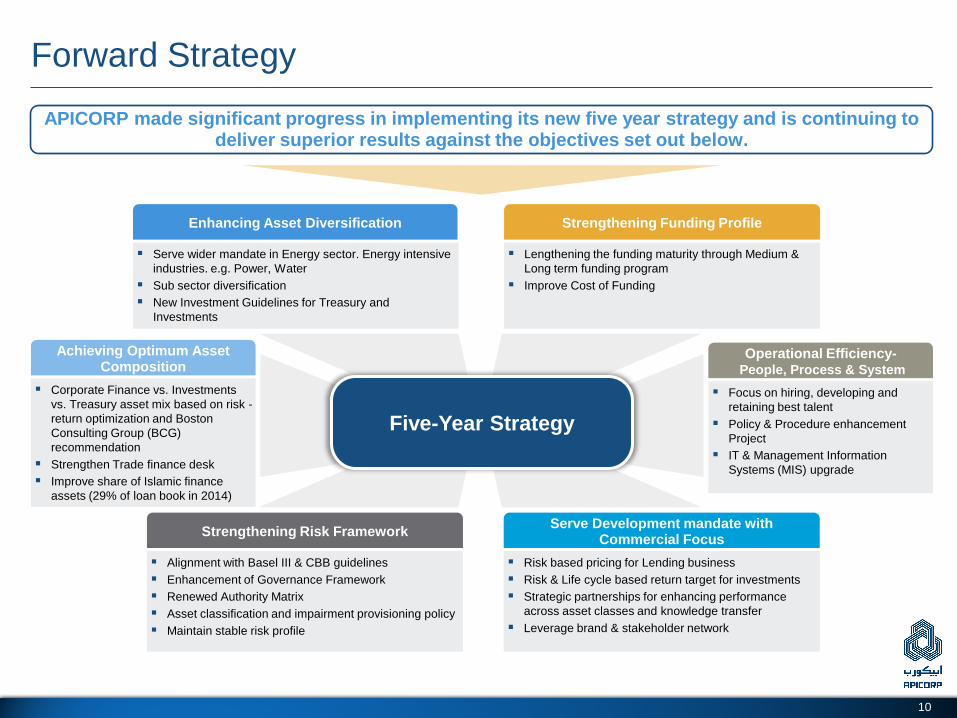
APICORP made significant progress in implementing its new five year strategy and is continuing to deliver superior results against the objectives set out below.
Focus on hiring, developing and
retaining best talent
Policy & Procedure enhancement
Project
IT & Management Information
Systems (MIS) upgrade
Operational Efficiency- People, Process & System
Risk based pricing for Lending business
Risk & Life cycle based return target for investments
Strategic partnerships for enhancing performance
across asset classes and knowledge transfer
Leverage brand & stakeholder network
Serve Development mandate with Commercial Focus
Alignment with Basel III & CBB guidelines
Enhancement of Governance Framework
Renewed Authority Matrix
Asset classification and impairment provisioning policy
Maintain stable risk profile
Strengthening Risk Framework
Corporate Finance vs. Investments
vs. Treasury asset mix based on risk -
return optimization and Boston
Consulting Group (BCG)
recommendation
Strengthen Trade finance desk
Improve share of Islamic finance
assets (29% of loan book in 2014)
Achieving Optimum Asset Composition
Enhancing Asset Diversification
Serve wider mandate in Energy sector. Energy intensive
industries. e.g. Power, Water
Sub sector diversification
New Investment Guidelines for Treasury and
Investments
Strengthening Funding Profile
Lengthening the funding maturity through Medium &
Long term funding program
Improve Cost of Funding
Five-Year Strategy

11
FINANCIAL POSITION AND
PERFORMANCE
Section 2

12
Increasing Profitability Amidst Growing Asset Base
Continuous growth in profits leading to a growing asset portfolio while maintaining low leverage
Increasing Profitability coupled with Stable Efficiency Ratio (Gross Income US$ mn, Efficiency Ratio: Operating Expenses/ Gross Income)
Profitable Institution with a Healthy Balance Sheet
APICORP continues to remain profitable despite challenging
economic environment with gross income rising 4% to US$ 156
million in 2014
Net income recorded at US$ 105 million as an investment provision
was built in 2014 on the back of uncertain geopolitical outlook for the
MENA region.
Similarly, APICORP’s total assets reached US$ 5.64 billion as on
June 30, 2015 vs. US$ 5.67 billion on 31 December 2013.
Total liabilities dropped to US$ 3.70 billion as on 30 June 2015 from
US$ 4.02 billion at end 2014, while equity reached US$ 1.93 billion on
June 30, 2015 from US$ 1.85 billion at end 2014
4,119 4,312 4,629
5,078 5,675 5,884 5,643
0
1,000
2,000
3,000
4,000
5,000
6,000
7,000
8,000
2009 2010 2011 2012 2013 2014 30-Jun-15
3,117 3,171 3,411
3,768 3,868 4,025 3,707
1,002 1,141 1,219 1,309
1,807 1,859 1,936
0
1,000
2,000
3,000
4,000
5,000
2009 2010 2011 2012 2013 2014 30-Jun-15
Liabilities Equity
Total Assets (US$ mn) Total Liabilities and Equity (US$ mn)
82
119
159
131
150 156
81
58
95 105 109 112 105
56
27%
21% 23%
22%
26% 26%
24%
10%
15%
20%
25%
30%
35%
0
20
40
60
80
100
120
140
160
180
2009 2010 2011 2012 2013 2014 30-Jun-15
Gross Income Net Income Efficiency Ratio

13
Track Record of Strong Shareholders Support
In addition to the five capital increases, shareholders’ decision not to receive dividends for 6 years from 2008-2010
& 2012-2014 evidences strong shareholder support. Capital Adequacy Ratio of 29.3% at end June 2015 is
significantly higher than the Basel III requirement of 13%
Capital Adequacy Ratio (%)
25.7%
29.2%
28.4%
27.2%
28.7% 28.8% 29.3%
23%
24%
25%
26%
27%
28%
29%
30%
2009 2010 2011 2012 2013 2014 30-Jun-15
Shareholders’ Equity (US$ mn) Shareholders’ Deposits (US$ mn)
370
222
103 104 105 106 107
1,000
0
200
400
600
800
1,000
1,200
2009 2010 2011 2012 2013 2014 30-Jun-15 Approved Amount
1,002 1,141 1,219 1,309
1,807 1,859 1,936
0
500
1,000
1,500
2,000
2,500
2009 2010 2011 2012 2013 2014 30-Jun-15
Authorized
Capital
Subscribed
Capital
Issued and
Fully Paid
Callable
Capital
2,400 1,500 1,000 500
APICORP’s Capital Structure – 30 June 2015 (US$ mn)

14
ASSET PROFILE
Section 3

15
Distribution of Group’s Assets
Despite APICORP’s growing asset base, focus on GCC states and the petroleum industry is maintained
Asset Class Breakdown Focus on GCC Region and the Petroleum Industry Maintained
Majority of APICORP’s assets are in syndicated and direct loans
followed by available for sale securities and direct equity investments
at 46%, 20% and 17% respectively of total assets as of end June
2015
APICORP’s net cash position remained strong with total cash and
bank placements of US$ 769 million recorded at end June 2015
APICORP’s majority assets (82%) are based out of the GCC region,
with 35% of total assets based out of the Kingdom of Saudi Arabia
itself
Geographical Distribution of Assets – 30 June 2015 Industry Distribution of Assets – 30 June 2015
16% 10% 17% 14%
57% 52%
46% 47%
6% 15% 15% 17%
19% 21% 20% 20%
0%
20%
40%
60%
80%
100%
2012 2013 2014 30-Jun-15
Cash&Bank Placements Loans Equity AFS Securities PP&E Other Assets
35%
23%
24%
6%
4% 2%
2% 4% KSA (35%)
Qatar (23%)
Other GCC (24%)
Egypt and North Africa (6%)
Europe (4%)
Asia pacific (2%)
United States (2%)
Other North and South America (4%)
11%
11%
3%
2%
23%
1% 8%
9%
13%
4%
15%
Refineries
Oilfield production development services
Floating production, storage and offloading Facilities
Liquefied natural gas (LNG) plants
Petroleum and petrochemicals
Maritime transportation
Power generation
Other petroleum
Banks and financial institutions
Other industries
Governments and public sector

16
Focus on GCC States Across All Asset Classes
Represents 46% of total assets (H1 2015)
Directed towards large corporates and real
projects backed by strong sponsors and/ or
governments
Similar to total assets, majority loans are in
the GCC region with focus on the petroleum
sector
Investment Securities Loan Portfolio Direct Equity Investment
Represents 20% of total assets (H1 2015)
Average rating for the fixed income portfolio is
A, mainly comprised of fixed and floating rate
securities
GCC exposure is the maximum at 76%
followed by Europe at 17% and US at 7%
Total investment in direct equity reached US$
944 million as on 30 June 2015, representing
17% of total assets
Dividend income generated by the portfolio
reached US$ 91 million in 2014 equal to 58%
of APICORP’s total income in 2014. In H1
2015, dividend income reached US$ 49
million
Breakdown by Security Type (30 June 2015) Breakdown by Sector (30 June 2015) Breakdown by Security Type (30 June 2015)
18%
6%
22%
1% 22%
15%
16%
Oilfield production development services Floating production, storage and offloading Facilities Petroleum and petrochemicals
Maritime transportation
Refineries
Power generation
Other petroleum
69%
15%
1%
15% Fixed-rate bonds
Floating-rate bonds
Structured notes
Funds & Equities 90%
10%
Unlisted Equities
Listed Equities
Breakdown by Geography (30 June 2015) Breakdown by Geography (30 June 2015) Breakdown by Geography (30 June 2015)
40%
25%
23%
4% 4% 4% KSA
Qatar
Other GCC
Egypt and North Africa
Europe
Asia Pac.
20%
11%
45%
17%
7% KSA
Qatar
Other GCC
Europe
US
66%
10%
24% KSA
Egypt and N. Africa
UAE

17
APICORP’s Direct Equity Investments
Investment in Direct Equity Reached US$ 944 million as on June 30, 2015
Paid-up capital: LD 60 million
APICORP Share: 20%
Drilling and related operations in the Arab world.
Arab Drilling and Workover
Company (ADWOC), Libya
www.adwoc.com
Paid-up capital: TD 30 million
APICORP Share: 20%
Storage and handling of petroleum products at La Skhira terminal.
Paid-up capital: LD 35 million
APICORP Share: 16.67%
Providing seismic services for the oil and gas industry in the Arab world.
Paid-up capital: SR 1,025 million
APICORP Share: 10%
Production and marketing of MTBE and Poly Propylene (PP).
Arab Company for Detergent
Chemicals (ARADET), Iraq
www.aradetco.com
Tankage Mediterranee
(TANKMED), Tunisia
www.tankmed.com
Arab Geophysical Exploration
Services Company (AGESCO),
Libya
www.agesco-ly.com
Saudi European Petrochemical
Company (IBN ZAHR), Saudi
Arabia
www.sabic.com
Paid-up capital: SR 8,510 million
APICORP Share: 3.45%
Production and marketing of aromatics, PTA and polyester fibers.
The Arabian Industrial Fibers
Company (IBN RUSHD), Saudi
Arabia
www.sabic.com
Paid-up capital: SR 5,625 million
APICORP Share: 1.32%
Production and marketing of poly ethylene, ethylene glycol, poly propylene and other by-products.
Paid-up capital: US$ 215 million
APICORP Share: 17%
Production and marketing of methanol.
Paid-up capital: LE 1,992 million
APICORP Share: 3.03%
Production and marketing of ammonia and urea.
Alexandria Fiber Company
(AFCO), Egypt
www.adityabirla.com
Yanbu National Petrochemical
Company (YANSAB), Saudi
Arabia
www.yansab.com.sa
Egyptian Methanex Methanol
Company (EMethanex), Egypt**
www.methanex.com
Misr Oil Processing Company
(MOPCO)*, Egypt
www.mopco-eg.com
Paid-up capital: SR 2 billion
APICORP Share: 5.86%
Energy and related sectors (drilling, geophysical, oil field services, seamless pipe manufacturing, industrial gases etc.)
Paid-up capital: US$ 370 million
APICORP Share: 28.33%
Well services and intervention, wireline logging, testing, drilling and work-over activities.
The Egyptian Bahraini Gas
Derivative Company
(EBGDCO)**, Egypt
www.danagas.com
The Industrialization & Energy
Services Company (TAQA),
Saudi Arabia
www.taqa.com.sa
National Petroleum Services
(NPS)
www.npsintl.com
Paid-up capital: US$ 25 million
APICORP Share: 20%
Recovery and marketing of propane and butane.
Paid-up capital: ID 36 million
APICORP Share: 32%
Production and marketing of linear alkyl benzene (LAB) and byproducts.
Paid-up capital: US$ 48.3 million
APICORP Share: 10%
Production and marketing of acrylic fibers.
AS AT 30 June 2015
* Mopco 1 and 2 (expansion projects) works are progressing which were stopped for 28 months. Line 1 has commissioned in 2015 while Line 2 is planned to commission in Q4 2015
** The project is still not passing the commercial test/operations. (pre-test operations done on August 07, 2012).
Paid-up capital: SAR 250 million
APICORP Share: 15%
Provides manufacturing, distribution, installation and maintenance services to numerous sectors
Saudi Mechanical Industries
Company, Saudi Arabia
www.smi.com.sa

18
FUNDING OVERVIEW
Section 4

19
Access to Diverse Funding Sources
Amount Signing Date Tenor Status
US$ 300 million 1997 5 yrs Matured
US$ 200 million 2000 5 yrs Matured
US$ 300 million 2002 5 yrs Matured
US$ 250 million 2005 5 yrs Matured
US$ 400 million 2007 5 yrs Matured
SAR 2.5 billion (US$ 667 million) 2012 3 yrs Matured
SAR 500 million(US$ 133 million) 2012 5 yrs Outstanding
SAR 400 million(US$ 117 million) 2012 5 yrs Outstanding
US$ 105 million 2012 6 yrs Outstanding
SAR 1.0 billion (US$ 267 million) 2014 5 yrs Outstanding
US$ 150 million 2014 3 yrs Outstanding
SAR 3.0 billion (US$ 800 million) 2014 5 yrs Outstanding
Issue Type Amount Signing Date Tenor Status
Floating Rate Notes SAR 2billion (US$ 533million) 25-Oct-10 5 yrs callable 3 yrs Outstanding
APICORP’s Debt Capital Market Financing
Accessed different pools of funding including term loans, deposits, repo activities and debt capital markets, in
addition to strong shareholder support, and is successfully diversifying its funding sources.
APICORP’s Term Loan Financing – 30 June 2015

20
Maturity Profile for Assets and Liabilities
Maturity Profile of Assets and Liabilities – 2014
Loans and liabilities maturities overview
Given the nature of APICORP’s development mandate and business
focus, over 70% of its assets have a long maturity
APICORP’s unique access to term funding, low leverage and solid net
worth position is effectively reducing the maturity gaps. In 2014,
APICORP successfully raised a SAR 3.0 billion Club Murabaha term
facility, for the repayment of SAR 2.5 billion maturities due in
January, 2015 which reduced the maturity mismatch significantly
Moreover, short-term mismatch between maturities of assets and
liabilities has substantially reduced as majority deposits from banks are
routinely rolled over on maturity
Assets and Liabilities Maturities – 30 June 2015 (US$ mn)
2014 (US$ mn) Up to 3 months 3 months to 1 year 1 year to 5 years 5 years and above Total
Total Assets 812.5 924.2 2,108.5 2,038.7 5,884.0
Total Liabilities and Equity (1,970.9) (1,282.9) (755.9) (1,874.3) (5,884.0)
Maturity Gap (1,158.4) (358.7) 1,352.6 164.4 -
Cumulative Maturity Gap (1,158.4) (1,517.0) (164.4) - -
Maturity Profile of Assets and Liabilities – 30 June 2015
2015 (US$ mn) Up to 3 months 3 months to 1 year 1 year to 5 years 5 years and above Total
Total Assets 596.1 697.1 1,762.4 2,587.5 5,643.1
Total Liabilities and Equity (1,267.5) (899.7) (1,539.6) (1,936.3) (5,643.1)
Maturity Gap (671.4) (202.6) 222.8 651.2 -
Cumulative Maturity Gap (671.4) (873.9) (651.2) - -
596 697
1,762
2,588
1,267
900
1,540
1,936
0
500
1,000
1,500
2,000
2,500
3,000
Up to 3 months 3 months to 1 year 1 to 5 years 5 years and over

21
LIQUIDITY, CAPITAL ADEQUACY & RISK
FRAMEWORK
Section 5

22
Improving Capital Adequacy Amidst High Liquidity
Profile
(US$ million) 2012 2013 2014 30 June 2015
Placement with Islamic Financial Institutions 90 54 328 192
Placements with conventional financial institutions 429 437 561 493
Reverse purchase agreements 265 52 25 0
Margin call accounts on securities sold under agreement to repurchase 8 2 3 6
Total Placement with Banks 792 546 918 691
Cash 17 25 65 77
Total Liquidity 809 571 983 768
APICORP monitors its capital based on capital adequacy ratios prescribed by the Basel Committee (Basel II)
As at 30 June 2015, Capital adequacy ratio reached 29.3%, significantly higher than the Basel III requirement
of 13%
(US$ million, except percentages) 2012 2013 2014 30 June 2015
Risk Weighted Exposures
On balance sheet assets 3,859 4,751 5,147 5,135
Off balance sheet exposures 536 412 275 443
Total risk weight exposures 4,395 5,164 5,422 5,578
Capital Adequacy Ratio
Tier 1 Capital* 1,097 1,208 1,313 1,369
Tier 2 Capital** 98 274 251 266
Qualifying Capital 1,195 1,482 1,564 1,635
Total Capital Adequacy Ratio 27.2% 28.7% 28.8% 29.3%
* Comprise share capital, legal and general reserves and retained earnings
** Comprises investments fair value reserve and collective impairment allowance
June 2015 from APICORP’s internal sources
Liquidity
Capital Adequacy

23
Conservative Risk Management
The Board of Directors have overall responsibility for the establishment and oversight of APICORP’s risk management framework and have established a Board
Audit and Risk committee which is responsible for developing and monitoring APICORP’s risk management policies.
In addition, the Risk and ALCO Committee, which is a management committee, is responsible for developing and monitoring APICOR’s risk management policies to
maintain effective oversight of the key risks faced.
Risk Governance
Liquidity Risk Credit Risk Operational Risk
APICORP has established policies, procedures and
limits established to control, monitor and manage all
credit risks namely:
Credit Evaluation of obligors and counterparties;
Robust rating model;
Consultative approval procedure;
Transactional strength and risk based pricing
methodology; and
Concentration by country, product, industry sub-
sector and risk grade reviewed regularly to avoid
excessive exposure and ensure a broad
diversification.
APICORP’s liquidity management policies are:
Aiming towards aligning liquidity risk
management policies with Basel III standards
during 2015;
Line of credit from shareholders amounting to
US$ 1billion. Unutilised funding from this credit
line was US$ 894 million at end June 2015;
Maintaining adequate level of quality liquid
assets, well diversified funding sources and
liquidity mismatches monitored on a proactive
basis; and
Liquidity stress testing under scenarios covering
both normal and more severe market conditions.
APICORP has developed a framework and
methodology to identify and control APICORP’s
operational risks; including:
Internal audit function makes regular,
independent appraisals of the control
environment in all identified risk areas;
Incident management system developed to
report, assess and control operational risks
across the organisation; and
Adequately tested contingency arrangements
are in place to support operations in the event of
a possible disaster scenario.
Currency Risk Interest Rate Risk
APICORP’s funding is principally denominated in US Dollars and interest
rates are typically linked to U.S. dollar LIBOR
Exposure to interest rate fluctuations on certain financial assets and liabilities
are hedged by entering into interest rate swap agreements
Exposures in currencies other than US Dollars is hedged by entering into
forward contracts
Key Developments of 2014
Liquidity risk policy in line with Basel guidelines
developed for approval by Board
Established Asset Classification and impairment
provisioning policy Operational risk management practice developed

24
PEER GROUP ANALYSIS
Section 6

25
APICORP in Perspective
APICORP offers significant value versus similarly rated supranational peers. These include return on average
assets coupled with high liquidity levels
2013
Central
American Bank
for Economic
Integration
Corporacion
Andina de
Fomento
Arab
Petroleum
Investments
Corporation
Council of
Europe
Development
Bank
North America
Development
Bank
Caribbean
Development
Bank
Nordic
Investment
Bank
Islamic
Development
Bank
CABEI CAF APICORP CoE NADB CDB NIB IsDB
Issuer Rating A1 Aa3 Aa3 Aa1 Aa1 Aa1 Aaa Aaa
Weighted Median Shareholders Rating Ba1 Ba2 Aa3 – – Baa1 – –
Total Assets
(US$ million) 7,537 27,418 5,675 33,767 1,578 1,315 26,182 20,565
Return on Average Assets
(%) 1.57 0.79 2.00 0.5 0.5 0.20 0.9 1.4
Usable Equity / Gross Loans Outstanding +
Equity Operations*
(%)
42.0 42.9 46.9 19.3 51.7 71.8 – –
Gross NPLs / Gross Loans Outstanding **
(%) 0.6 0.0 2.3 0.0 0.7 0.5 0.2 1.0
ST Debt + CMLTD/ Liquid Assets***
(%) 63.8 69.3 10.0 49.3 0.0 44.1 67.0 47.9
Total Debt/ Discounted Callable Capital ****
(%) 546.8 1,910.2 360.9 488.6 40.9 87.1 329.7 121.7
Aaa Credits Aa3 Credits
Source: Moody’s Investor Service; Audited Financial Statements of the respective multilateral development bank
* Usable Equity is shareholder’s equity and excludes callable capital
** Non Performing Loans
*** Short term debt and current maturing long term debt
**** Callable capital pledge by members rated Baa3 or higher, discounted by Moody’s 30-year expected loss rates associated with ratings

26
KEY CREDIT STRENGTHS
Section 7

27
Key Credit Strengths
De facto Preferred Creditor
Status amidst Strong Ability
of Shareholders to Support
100% Sovereign Owned
Multilateral Development
Bank
Consistently Delivering
Superior Financial Results
Conservative leverage levels
with total liabilities divided
by total equity at 1.9 times
as at end June 2015
Highly Rated Institution with
Stable Outlook
High Grade Asset Portfolio
Coupled with Extremely Low
Leverage
Explicit Shareholder
Commitment on a “joint and
several” basis
Solid Capitalisation with
Capital Adequacy Ratio
determined in accordance
with Basel II methodology at
29.3% as at end June 2015

28
STRUCTURE OVERVIEW
Section 8

29
Structure Diagram
Special Purpose Vehicle
as Issuer and Trustee
APICORP
as Wakeel
APICORP
as Obligor /
Beneficiary
APICORP
as Purchaser
Investors
as Certificateholders
APICORP
as Seller Broker 1
Broker 2
Master Trust
Deed
Commodity
Purchase LOU
Commodity
Sale LOU
Master Murabaha
Agreement
Purchase / Sale
Undertaking Wakala Agreement
Master
Purchase
Agreement
8. Commodities
9. Cost Price (no
greater than 49%)
7. Commodities
Under Murabaha
Contract
10. Deferred
Payment
Price
14. Wakala
Assets
13. Exercise
Price
11. Principal
Revenues and
Income Revenues
5. Cost Price (no
greater than 49%)
6. Commodities 4. The Wakala
Assets
3. No less than
51% of Series
Issuance
1. Certificates 2. Series
Issuance
12. Periodic
Distribution
15. Dissolution
Amount

30
THANK YOU!