april 8, 2013 valuation of solar photovoltaic (pv) projects for ad
TRANSCRIPT

April 8, 2013
George E. Sansoucy, P.E., LLC7 Greenleaf Woods Drive, Unit 102Portsmouth, NH 03801(603) 431-7636
Valuation ofSolar Photovoltaic (PV) Projects
for Ad Valorem Tax Purposesor for Negotiation of PILOT Agreements
Prepared for the:Massachusetts Department of Revenue

Massachusetts DOR Workshop April 8, 2013George E. Sansoucy, P.E., LLC © 2
Introduction
George E. Sansoucy, P.E., LLC (GES) is an engineering and appraisal firm specializing in the valuation and financial feasibility of special purpose properties and consulting on regulatory matters
In-house staff includes engineers, appraisers, and consultants Presenters: George E. Sansoucy, P.E. Glenn C. Walker, ASA

Massachusetts DOR Workshop April 8, 2013George E. Sansoucy, P.E., LLC ©
Presentation Overview
3
Section 1: Renewable Portfolio Standard (RPS) and Solar Overview
Section 2: Massachusetts Solar Energy Program
Section 3: Appraisal of PV Solar Energy Projects
Section 4: Payment in Lieu of Tax (PILOT) Agreement Overview and Discussion
Massachusetts DOR Workshop April 8, 2013George E. Sansoucy, P.E., LLC © 4
Section 1: Renewable Portfolio Standard (RPS) and Solar Overview
Massachusetts DOR Workshop April 8, 2013George E. Sansoucy, P.E., LLC ©
Renewable Portfolio Standard (RPS) Overview
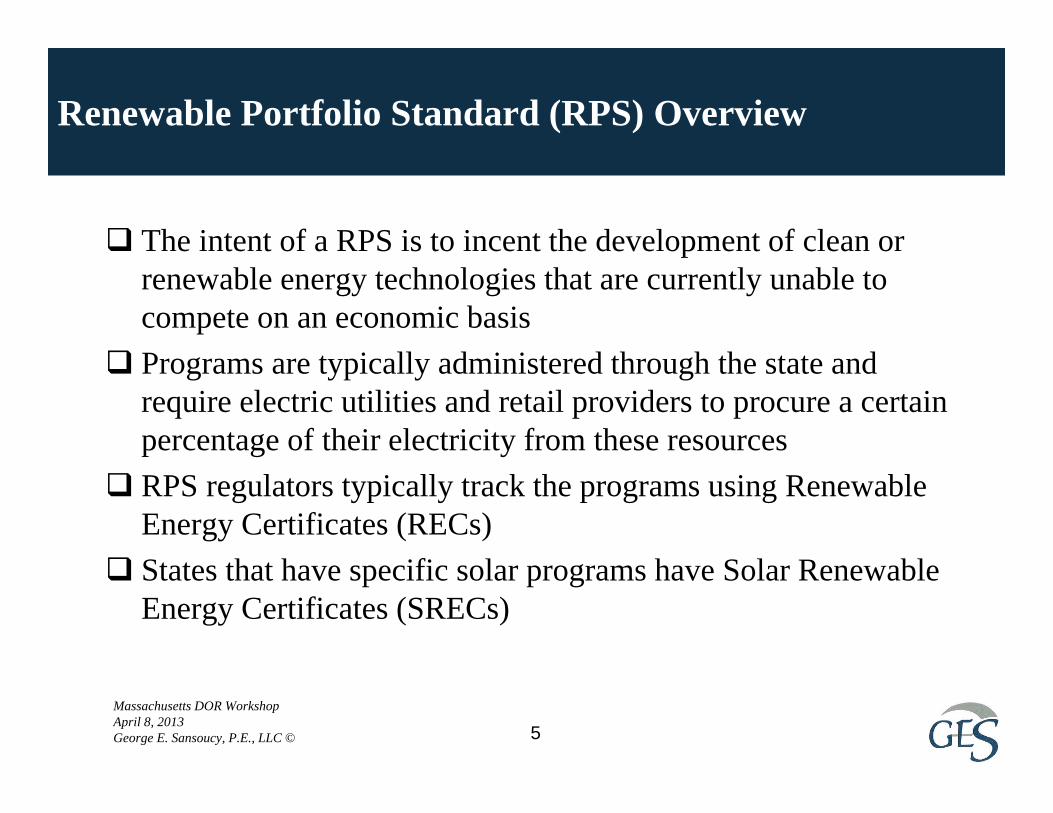
The intent of a RPS is to incent the development of clean or renewable energy technologies that are currently unable to compete on an economic basis
Programs are typically administered through the state and require electric utilities and retail providers to procure a certain percentage of their electricity from these resources
RPS regulators typically track the programs using Renewable Energy Certificates (RECs)
States that have specific solar programs have Solar Renewable Energy Certificates (SRECs)
5

Massachusetts DOR Workshop April 8, 2013George E. Sansoucy, P.E., LLC ©
What is a Solar PV System?
6
EnergySource
EnergyConversion
EnergyInversion &
Conditioning
EnergyUse
EnergyDistribution
ElectricUtility
• Direct Consumption• Net Metering• Virtual Net Metering
Wholesale

Massachusetts DOR Workshop April 8, 2013George E. Sansoucy, P.E., LLC © 7
Types of Solar Modules
Single and multi-crystalline modules Mono or single-crystalline modules are the most expensive and
typically most efficient Multi-crystalline are less expensive and also less efficient Crystalline modules represent largest percentage of market Efficiency in the range of 13 to 20% Degradation approximately 0.5% per year
Thin film technology Low cost but also lower efficiency Efficiency in the range of 12 to 15%
All systems have lives of 25± years (based on warranty) and most likely 30+ years

Massachusetts DOR Workshop April 8, 2013George E. Sansoucy, P.E., LLC © 8
Demand for Solar Generation is Created by State Programs
Demand for solar power is primarily driven by government regulations requiring utilities in states that have adopted solar carve-outs to supply a portion of their electricity from solar systems
Examples include: Delaware Maryland Massachusetts New Jersey Ohio Pennsylvania

Massachusetts DOR Workshop April 8, 2013George E. Sansoucy, P.E., LLC ©
SREC Prices Driven by Market and Regulatory Forces
9
Regulatory changes can shift prices in the near term
Loss of regulatory requirements would send prices to zero
Shifting requirements from 2 million to 4 million SRECs would drive prices up in the near term
However, over time prices will typically fall

Massachusetts DOR Workshop April 8, 2013George E. Sansoucy, P.E., LLC ©
California and Arizona Lead the U.S. in Solar PV Installations (3rd Quarter 2012)
10
3rd Quarter 2012 State Rankings
Rank (Q3 2012) State1 California2 Arizona3 New Jersey4 Massachusetts5 Nevada6 Maryland7 Texas8 North Carolina9 Hawaii10 Pennsylvania
U.S. solar PV market installed 864 MW in Q3 2012
Represents 44% growth over same period last year
Currently 5.9 gigawatts (GW) of PV operating in U.S. from more than 271,000 installations
Colorado, Florida, Maryland, Massachusetts, and Pennsylvania saw growth of 5 MW or greater
Behind Maryland, Massachusetts saw the greatest quarter-over-quarter increase, up from 25 MW to 40 MW
Massachusetts growth (Q3 2012) came from commercial and residential sectors, boosted by the expansion of net metering allowances
Source: U.S. Solar Market Insight, 3rd Quarter Review (latest data available)

Massachusetts DOR Workshop April 8, 2013George E. Sansoucy, P.E., LLC ©
Incentives Vary by State and are Evolving
11
Incentives include: SRECs Net metering Reduced or no property tax No sales tax on equipment Income tax credits No permitting costs Public benefits fund and
government sponsored loan programs
Incentives encourage solar installations by providing SREC revenue which reduces initial equipment and operating costs

Massachusetts DOR Workshop April 8, 2013George E. Sansoucy, P.E., LLC ©
Utility-Scale Installations Lead Solar PV Growth
12
According to the Energy Information Administration (EIA), total on-grid PV capacity nearly doubled in 2011
Utility-scale solar PV capacity grew from 70 MW in 2008 to 1,052 MW in 2011
Source: http://www.eia.gov/todayinenergy/detail.cfm?id=8570,10/31/12.
Massachusetts DOR Workshop April 8, 2013George E. Sansoucy, P.E., LLC © 13
Section 2: Massachusetts Solar Energy Program

Massachusetts DOR Workshop April 8, 2013George E. Sansoucy, P.E., LLC ©
Massachusetts Solar Carve-Out Program
14
A market-based program designed to support 400 MW (DC) of solar PV After 400 MW of qualified projects, new projects are not eligible
Solar carve-out participants must meet the following eligible criteria Have a capacity of 6 MW (DC) or less per parcel of land Be located within the Commonwealth Use some of its generation on-site and be interconnected to the
utility grid Must have an installation date of 1/1/08 or later
The program also has a Solar Credit Clearinghouse Auction designed to support the value of SRECs
Massachusetts DOR Workshop April 8, 2013George E. Sansoucy, P.E., LLC ©
Solar Renewable Energy Certificates (SRECs)
15
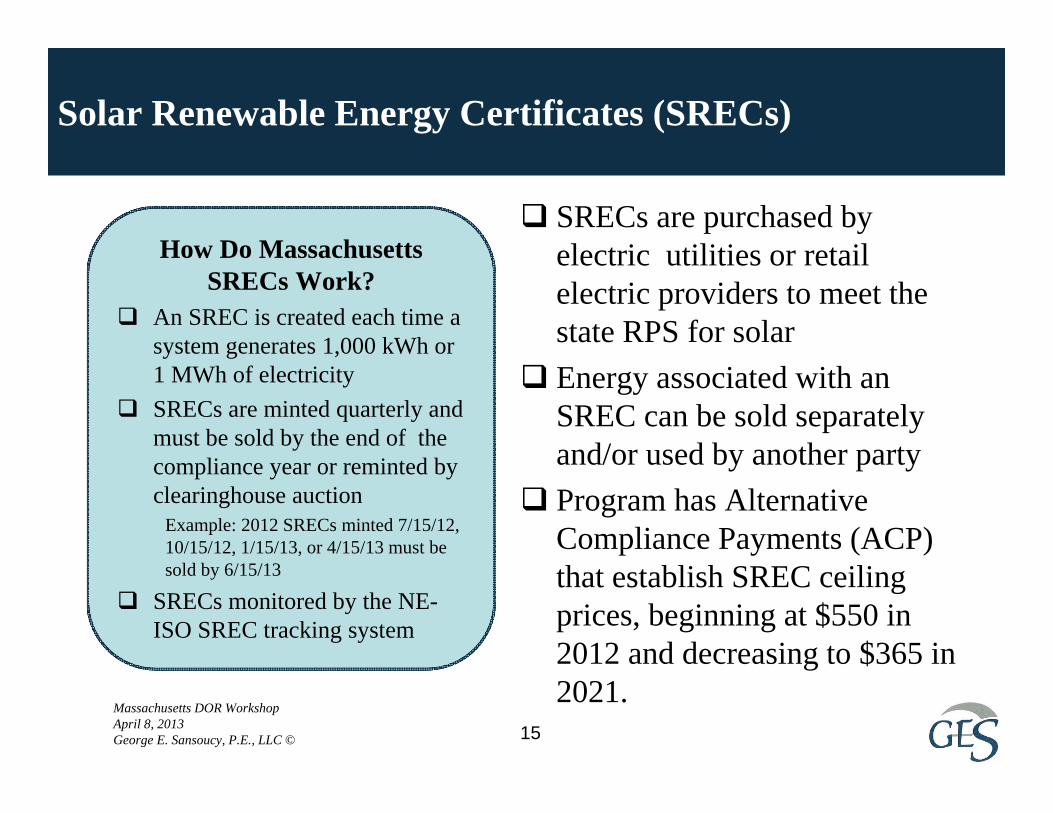
SRECs are purchased by electric utilities or retail electric providers to meet the state RPS for solar
Energy associated with an SREC can be sold separately and/or used by another party
Program has Alternative Compliance Payments (ACP) that establish SREC ceiling prices, beginning at $550 in 2012 and decreasing to $365 in 2021.
How Do Massachusetts SRECs Work?
An SREC is created each time a system generates 1,000 kWh or 1 MWh of electricity
SRECs are minted quarterly and must be sold by the end of the compliance year or reminted by clearinghouse auction
Example: 2012 SRECs minted 7/15/12, 10/15/12, 1/15/13, or 4/15/13 must be sold by 6/15/13
SRECs monitored by the NE-ISO SREC tracking system

Massachusetts DOR Workshop April 8, 2013George E. Sansoucy, P.E., LLC ©
SREC Markets
16
SRECs can be sold under short or long-term contracts or using the Massachusetts Solar Clearinghouse Auction
Buyers include: Local distribution companies Energy suppliers
The auction is a unique feature of the Massachusetts solar markets designed to provide a price support of $300/SREC and a $285/SREC price to the seller The term to utilize the auction was originally 10 years,
likely to be reset to 8 years in 2013

Massachusetts DOR Workshop April 8, 2013George E. Sansoucy, P.E., LLC ©
Recent Trends in SREC Prices in Massachusetts
17
Source: http://www.srectrade.com/srec_prices.php
$0
$100
$200
$300
$400
$500
$600
$700
Aug‐2010 Jan‐2011 Jun‐2011 Nov‐2011 Apr‐2012 Sep‐2012 Feb‐2013
$/SR
EC Clearing Price
SREC Auction Prices
Clearing Price Solar Alternative Compliance Payment (SACP)

Massachusetts DOR Workshop April 8, 2013George E. Sansoucy, P.E., LLC © 18
Solar Carve-Out SREC Supply and Demand
Year EndingQualified
Project (MW) SRECs ObligationSurplus /
Deficiency2010 17.4 2,738 34,164 (31,426)2011 45.7 26,598 78,577 (51,979)2012 174.2 116,000 [1] 81,559 34,441
2013[2] 250.0± 225,000± 135,495 89,505
[1] The 2012 figure estimates are based on 91,684 actual through Q3 and 25,000± of new SRECs in Q4.[2] The 2013 qualified project and SREC figures are conservative estimates of project installation and SREC production. DOER’s proposed SREC program regulations would increase the 2013 obligation to 189,297 MWh, thereby substantially reducingthe projected oversupply.

Massachusetts DOR Workshop April 8, 2013George E. Sansoucy, P.E., LLC © 19
Price Support – Auction Mechanism
No price guarantee
Payments to producers of SRECs pushed into future
Compliance obligation is increased based on number of SRECs in auction
10-year term is likely to be adjusted downward to 8 years based on surplus of SRECs likely to be deposited in auction
Auction provides SREC producers ability to dispose of SRECs in years of oversupply.
For questions on the Massachusetts solar program, contact [email protected].

Massachusetts DOR Workshop April 8, 2013George E. Sansoucy, P.E., LLC © 20
Section 3: Appraisal of PV Solar Energy Projects
Massachusetts DOR Workshop April 8, 2013George E. Sansoucy, P.E., LLC ©
Massachusetts Taxation of Solar and Wind Projects
21
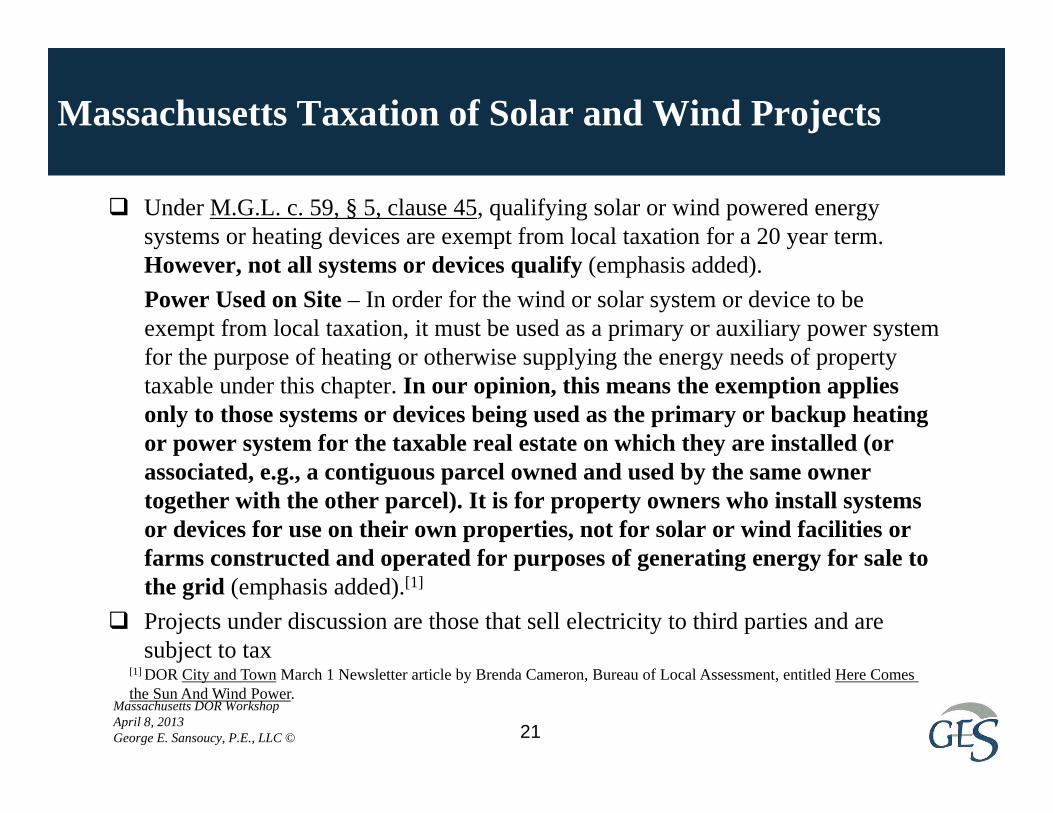
Under M.G.L. c. 59, § 5, clause 45, qualifying solar or wind powered energy systems or heating devices are exempt from local taxation for a 20 year term. However, not all systems or devices qualify (emphasis added).Power Used on Site – In order for the wind or solar system or device to be exempt from local taxation, it must be used as a primary or auxiliary power system for the purpose of heating or otherwise supplying the energy needs of property taxable under this chapter. In our opinion, this means the exemption applies only to those systems or devices being used as the primary or backup heating or power system for the taxable real estate on which they are installed (or associated, e.g., a contiguous parcel owned and used by the same owner together with the other parcel). It is for property owners who install systems or devices for use on their own properties, not for solar or wind facilities or farms constructed and operated for purposes of generating energy for sale to the grid (emphasis added).[1]
Projects under discussion are those that sell electricity to third parties and are subject to tax
[1] DOR City and Town March 1 Newsletter article by Brenda Cameron, Bureau of Local Assessment, entitled Here Comes the Sun And Wind Power.

Massachusetts DOR Workshop April 8, 2013George E. Sansoucy, P.E., LLC ©
Valuation Overview
22
Cost Approach Useful for new solar projects if markets are in equilibrium Potential for economic obsolescence due to low SREC prices
and/or removal of other government incentives Sales Comparison Approach Few true arms-lengths sales of operating projects Projects or interests in projects are selling prior to construction Market data expected to expand in the future
Income Capitalization Approach Most common method used to value solar projects Accounts for current and future revenue and expenses
Massachusetts DOR Workshop April 8, 2013George E. Sansoucy, P.E., LLC ©
Cost Approach
23
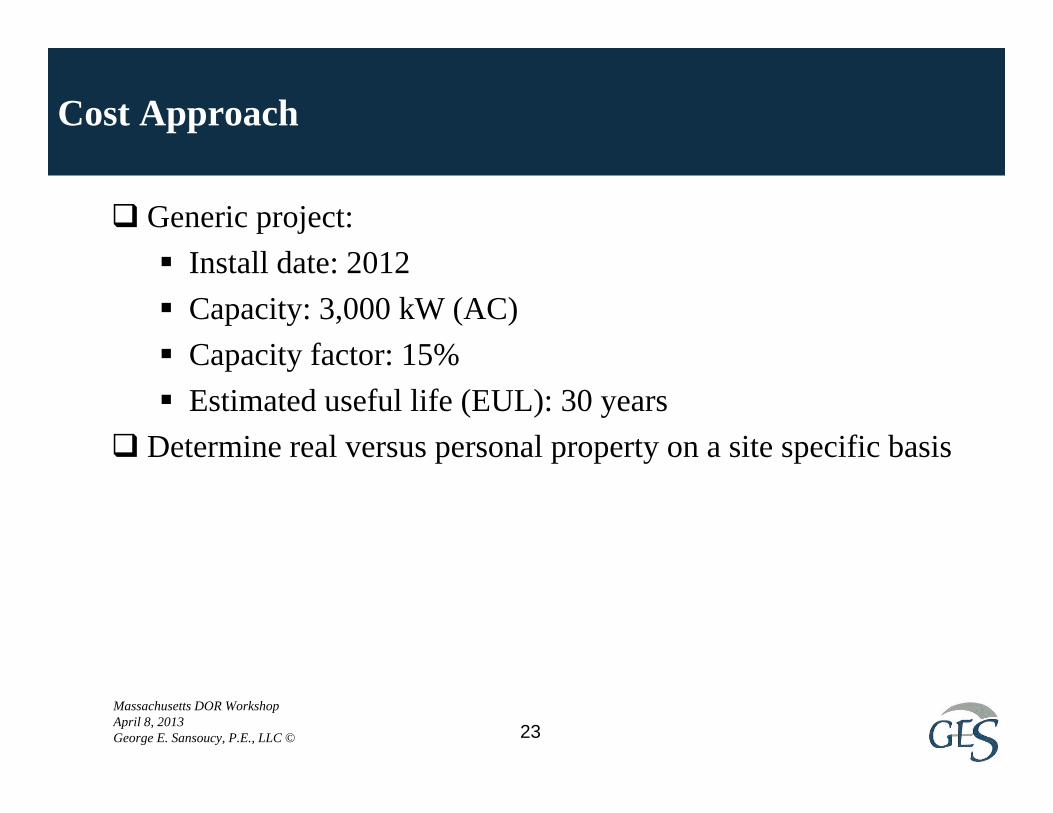
Generic project: Install date: 2012 Capacity: 3,000 kW (AC) Capacity factor: 15% Estimated useful life (EUL): 30 years
Determine real versus personal property on a site specific basis

Massachusetts DOR Workshop April 8, 2013George E. Sansoucy, P.E., LLC © 24
Cost Approach Discussion – Cost New
Original Cost of project available from developer Confirm by recent reported costs Price will vary depending on panel type, civil works,
interconnection, etc. Current price of $3,000/kW-DC is reasonable

Massachusetts DOR Workshop April 8, 2013George E. Sansoucy, P.E., LLC © 25
RPS Solar Carve-Out QualifiedRenewable Generation Units
City/TownNameplate Capacity (kW)-DC
Commercial Operation Date
Total Installation
Costs
Installation Cost/Watt
Installation Cost/kW
GLC-(MA) Easthampton, LLC Easthampton 2,260.70 6/1/2012 $11,427,146 $5.05 $5,055Uxbridge Solar Facility-1 Uxbridge 2,283.26 6/1/2012 $8,320,000 $3.64 $3,644Axio - Greenfield Greenfield 2,009.28 6/19/2012 $6,115,173 $3.04 $3,043Norfolk Solar-1 Norfolk 1,598.48 6/25/2012 $6,666,562 $4.17 $4,171GLC-(MA) Acushnet, LLC Wrentham 4,729.76 7/17/2012 $18,999,230 $4.02 $4,017Canton Landfill Solar Facility Canton 5,657.40 8/3/2012 $28,000,000 $4.95 $4,949True North Energy, LLC Salisbury 5,709.00 8/3/2012 $20,000,000 $3.50 $3,503Westford Solar IV Westford 1,186.20 9/17/2012 $4,080,300 $3.44 $3,440Airport Way Solar Barnstable 1,370.88 9/27/2012 $4,500,000 $3.28 $3,283Arrowsmith & Sons LLC Kingston 9.60 10/2/2012 $44,106 $4.59 $4,594Jacob's House Real Estate Trust Hanover 10.00 10/22/2012 $46,944 $4.69 $4,694Falmouth Service Center Falmouth 4.23 10/26/2012 $23,069 $5.45 $5,454Hyannis Air Services, Inc., dba Cape AirBarnstable 103.84 11/8/2012 $353,279 $3.40 $3,402DW Clark Inc. Taunton 500.57 12/4/2012 $2,000,000 $4.00 $3,995Clark's Covair Parts Shelburne 79.43 12/6/2012 $392,214 $4.94 $4,938Russel's Excavation Oak Bluffs 4.50 12/12/2012 $31,050 $6.90 $6,900Groveland Solar, LLC Groveland 3,659.26 12/22/2012 $8,569,773 $2.34 $2,342EBZ Solar Shirley 3,022.50 1/15/2013 $12,090,000 $4.00 $4,000Marcotte Holdings, LLC FoxBorough 389.40 1/17/2013 $973,500 $2.50 $2,500
Source:
Generation Unit Name
http://www.mass.gov/eea/energy-utilities-clean-tech/renewable-energy/solar/rps-solar-carve-out/current-status-of-the-rps-solar-carve-out-program.html

Massachusetts DOR Workshop April 8, 2013George E. Sansoucy, P.E., LLC © 26
Cost Approach Discussion – Physical Deterioration
Useful life for projects ranges from 20 to 35 years Assume an inverter replacement at approximately 15 years Panels degrade at the rate of about 0.5%± per year

Massachusetts DOR Workshop April 8, 2013George E. Sansoucy, P.E., LLC © 27
Cost Approach Discussion – Economic Obsolescence
1603 Grants reimburse original project developer for a maximum 30% of construction costs – the actual reimbursement is in the range of 28±%
Grants are not transferrable, are consumed at end of construction, and consider obsolescence after first day of commercial operation
Last date to file grant application was 10/1/12 1603 Grant program allows for “Began Construction” criteria
that allows projects to be completed prior to the grant or credit termination date of 1/1/17

Massachusetts DOR Workshop April 8, 2013George E. Sansoucy, P.E., LLC © 28
Cost Approach Example
Description $ in 000s % to the Good
Cost New: 3,000 kW (AC) × $3,000/kW $9,000 100.0%
Less: Physical Deterioration: 1 year ÷ 30 year EUL = 3.3% $297
Subtotal: $8,703 96.7%
Less Economic Obsolescence for 1603 Grant ($9,000,000 × 28% net Grant) $2,520
Subtotal Cost New Less Deterioration and Obsolescence $6,183 68.7%
Plus Land Value: $100
Total Project Cost New Less Deterioration and Obsolescence $6,283

Massachusetts DOR Workshop April 8, 2013George E. Sansoucy, P.E., LLC © 29
Sales Comparison Approach
Few, if any, sales of operating projects Predevelopment sales and partial interest sales have occurred No firm pricing to date Sales will be on a $/kW or $/MW basis
Massachusetts DOR Workshop April 8, 2013George E. Sansoucy, P.E., LLC © 30
Factors Impacting Comparability of Sales
Location Power prices/contracts SREC prices/contracts Age of system Efficiency Type of interconnection

Massachusetts DOR Workshop April 8, 2013George E. Sansoucy, P.E., LLC © 31
Income Capitalization Approach
Most common method of valuing solar PV projects Direct capitalization or discounted cash flow (DCF)
applicationMost common method is after-income tax DCF Allows for changes in SREC prices Typically accounts for tax benefits

Massachusetts DOR Workshop April 8, 2013George E. Sansoucy, P.E., LLC © 32
Key Assumptions in Income Capitalization Approach
Description Sample ProjectProject size kW (DC) 3,000 DCTotal cost of project ($/Kw-DC) $3,000Project Cost ($) $9,000,000Initial kWh Production @ 15% Capacity Factor 3,942,000Degradation Factor 0.5%Power Purchase Agreement (PPA) rate ($/kWh-DC)
$0.10
SREC price (1 SREC = 1,000 kWh-DC) $200

Massachusetts DOR Workshop April 8, 2013George E. Sansoucy, P.E., LLC © 33
Inputs Used in DCF (generic solar project)
SREC price most volatile input
Generation is declining by 0.5% per year
Inverter replacement at 15± years
PROJECTION BASIS: GESNOMINAL DOLLARS IN THOUSANDS UNLESS NOTED
2013 2014 2015 2016 2017 2018 2019 2020 2021 2022 2023 2024 2025 2026 2027 2028 2029 2030 2031 2032Projection Period Year 1 2 3 4 5 6 7 8 9 10 11 12 13 14 15 16 17 18 19 20Electric Price ForecastsAnnual Contract/PPA Price ($/MWh) 100.00$ 100.00$ 100.00$ 100.00$ 100.00$ 100.00$ 100.00$ 100.00$ 100.00$ 100.00$ 100.00$ 100.00$ 100.00$ 100.00$ 100.00$ 100.00$ 100.00$ 100.00$ 100.00$ 100.00$
SREC Rate ($/MWh) 200.00$ 200.00$ 200.00$ 200.00$ 200.00$ 200.00$ 200.00$ 200.00$ 200.00$ 200.00$
Net Generation (MWh) 3,942 3,922 3,903 3,883 3,864 3,844 3,825 3,806 3,787 3,768 3,749 3,731 3,712 3,693 3,675 3,656 3,638 3,620 3,602 3,584
Contract/PPA Revenue 394$ 392$ 390$ 388$ 386$ 384$ 383$ 381$ 379$ 377$ 375$ 373$ 371$ 369$ 367$ 366$ 364$ 362$ 360$ 358$ SREC Revenue 788$ 784$ 781$ 777$ 773$ 769$ 765$ 761$ 757$ 754$ -$ -$ -$ -$ -$ -$ -$ -$ -$ -$ Total Revenue 1,183$ 1,177$ 1,171$ 1,165$ 1,159$ 1,153$ 1,148$ 1,142$ 1,136$ 1,130$ 375$ 373$ 371$ 369$ 367$ 366$ 364$ 362$ 360$ 358$
ExpensesFixed O&M ($/kW-year) 10$ 10$ 11$ 11$ 11$ 11$ 12$ 12$ 12$ 12$ 13$ 13$ 13$ 14$ 14$ 14$ 15$ 15$ 16$ 16$ Administrative & General ($/kW-year) 5$ 5$ 5$ 5$ 6$ 6$ 6$ 6$ 6$ 6$ 6$ 7$ 7$ 7$ 7$ 7$ 7$ 8$ 8$ 8$ Insurance ($/kW-year) 35$ 36$ 37$ 38$ 39$ 40$ 41$ 42$ 43$ 44$ 45$ 46$ 47$ 48$ 49$ 51$ 52$ 53$ 55$ 56$ Total Fixed O&M 50$ 51$ 53$ 54$ 55$ 57$ 58$ 59$ 61$ 62$ 64$ 66$ 67$ 69$ 71$ 72$ 74$ 76$ 78$ 80$
Cash Flow or EBITDA 1,133$ 1,125$ 1,118$ 1,111$ 1,104$ 1,097$ 1,090$ 1,082$ 1,075$ 1,068$ 311$ 307$ 304$ 300$ 297$ 293$ 290$ 286$ 282$ 278$
Plant Capital Additions 5$ 5$ 5$ 5$ 5$ 5$ 5$ 5$ 5$ 5$ 5$ 5$ 5$ 5$ 700$ 5$ 5$ 5$ 5$ 5$
Total Cash Flow 1,128$ 1,120$ 1,113$ 1,106$ 1,099$ 1,092$ 1,085$ 1,077$ 1,070$ 1,063$ 306$ 302$ 299$ 295$ (403)$ 288$ 285$ 281$ 277$ 273$
DESCRIPTION31-Dec

Massachusetts DOR Workshop April 8, 2013George E. Sansoucy, P.E., LLC © 34
Typical Solar Project Projection
$‐
$200
$400
$600
$800
$1,000
$1,200
2013 2014 2015 2016 2017 2018 2019 2020 2021 2022 2023 2024 2025 2026 2027 2028 2029 2030 2031 2032
$ in Tho
usan
ds
Typical Generic Solar Project Revenue and Cash Flow Forecast
Contract/PPA Revenue SREC Revenue Cash Flow or EBITDA

Massachusetts DOR Workshop April 8, 2013George E. Sansoucy, P.E., LLC © 35
Income Capitalization Approach Variables
SREC revenue volatile PPA typically fixed and varies from $0.08 - $0.12/kWh Inverter replacement at approximately 15± years O&M typically fixed and includes monitoring and insurance Income tax benefits provide a significant number of incentives
for development 1603 Grant Five year depreciation for tax purposes Production tax credits

Massachusetts DOR Workshop April 8, 2013George E. Sansoucy, P.E., LLC © 36
Discount Rates Used in DCF
Typically use two discount rates 10%± rate typical for long-term PPA revenues 15%± typical for SREC revenue Significantly more volatility At the mercy of state lawmakers State programs can dramatically alter pricing
Property tax rate typically added to discount rate

Massachusetts DOR Workshop April 8, 2013George E. Sansoucy, P.E., LLC © 37
Sample Solar DCF
NOMINAL DOLLARS IN THOUSANDS UNLESS NOTED
Year Ended 31-Dec 2013 2014 2015 2016 2017 2018 2019 2020 2021 2022 2023 2024 2025 2026 2027 2028 2029 2030 2031 2032Projection Period Year 1 2 3 4 5 6 7 8 9 10 11 12 13 14 15 16 17 18 19 20Valuation Date 1/1/2013O&M Escalation Rate 2.5%
Electric Price ForecastsAnnual Contract/PPA Price ($/MWh) 100.00$ 100.00$ 100.00$ 100.00$ 100.00$ 100.00$ 100.00$ 100.00$ 100.00$ 100.00$ 100.00$ 100.00$ 100.00$ 100.00$ 100.00$ 100.00$ 100.00$ 100.00$ 100.00$ 100.00$
SREC Rate ($/MWh) 200.00$ 200.00$ 200.00$ 200.00$ 200.00$ 200.00$ 200.00$ 200.00$ 200.00$ 200.00$
Net Generation (MWh) 3,942 3,922 3,903 3,883 3,864 3,844 3,825 3,806 3,787 3,768 3,749 3,731 3,712 3,693 3,675 3,656 3,638 3,620 3,602 3,584Capacity Factor (calculated using 3 MW) 15% 15% 15% 15% 15% 15% 15% 14% 14% 14% 14% 14% 14% 14% 14% 14% 14% 14% 14% 14%
PROJECTED CASH FLOW STATEMENTREVENUE
Contract/PPA Revenue 394$ 392$ 390$ 388$ 386$ 384$ 383$ 381$ 379$ 377$ 375$ 373$ 371$ 369$ 367$ 366$ 364$ 362$ 360$ 358$ SREC Revenue 788$ 784$ 781$ 777$ 773$ 769$ 765$ 761$ 757$ 754$ -$ -$ -$ -$ -$ -$ -$ -$ -$ -$
TOTAL REVENUE 1,183$ 1,177$ 1,171$ 1,165$ 1,159$ 1,153$ 1,148$ 1,142$ 1,136$ 1,130$ 375$ 373$ 371$ 369$ 367$ 366$ 364$ 362$ 360$ 358$
EXPENSESFixed Operation and Maintenance Expenses
Fixed O&M ($/kW-year) 10$ 10$ 11$ 11$ 11$ 11$ 12$ 12$ 12$ 12$ 13$ 13$ 13$ 14$ 14$ 14$ 15$ 15$ 16$ 16$ Administrative & General ($/kW-year) 5$ 5$ 5$ 5$ 6$ 6$ 6$ 6$ 6$ 6$ 6$ 7$ 7$ 7$ 7$ 7$ 7$ 8$ 8$ 8$ Insurance ($/kW-year) 35$ 36$ 37$ 38$ 39$ 40$ 41$ 42$ 43$ 44$ 45$ 46$ 47$ 48$ 49$ 51$ 52$ 53$ 55$ 56$
Total Fixed O&M 50$ 51$ 53$ 54$ 55$ 57$ 58$ 59$ 61$ 62$ 64$ 66$ 67$ 69$ 71$ 72$ 74$ 76$ 78$ 80$
Cash Flow or EBITDA 1,133$ 1,125$ 1,118$ 1,111$ 1,104$ 1,097$ 1,090$ 1,082$ 1,075$ 1,068$ 311$ 307$ 304$ 300$ 297$ 293$ 290$ 286$ 282$ 278$
Plant Capital Additions 5$ 5$ 5$ 5$ 5$ 5$ 5$ 5$ 5$ 5$ 5$ 5$ 5$ 5$ 700$ 5$ 5$ 5$ 5$ 5$
Cash Available from Contract 339$ 336$ 333$ 329$ 326$ 323$ 320$ 316$ 313$ 309$ 306$ 302$ 299$ 295$ (403)$ 288$ 285$ 281$ 277$ 273$ Cash Flow From Sale of SRECs 788$ 784$ 781$ 777$ 773$ 769$ 765$ 761$ 757$ 754$ -$ -$ -$ -$ -$ -$ -$ -$ -$ -$ % of Cash Flow From SRECs 70% 70% 70% 70% 70% 70% 71% 71% 71% 71% 0% 0% 0% 0% 0% 0% 0% 0% 0% 0%
Taxable Cash Flow 1,128$ 1,120$ 1,113$ 1,106$ 1,099$ 1,092$ 1,085$ 1,077$ 1,070$ 1,063$ 306$ 302$ 299$ 295$ (403)$ 288$ 285$ 281$ 277$ 273$ Annual Depreciation 4,536$ 1,037$ 622$ 373$ 373$ 187$ -$ -$ -$ -$ -$ -$ -$ -$ -$ -$ -$ -$ -$ -$
Taxable Income (3,408)$ 84$ 491$ 733$ 726$ 905$ 1,085$ 1,077$ 1,070$ 1,063$ 306$ 302$ 299$ 295$ (403)$ 288$ 285$ 281$ 277$ 273$ Taxable Income With Loss Carry Forward (3,408)$ (3,325)$ (2,834)$ (2,101)$ (1,375)$ (470)$ 615$ 1,077$ 1,070$ 1,063$ 306$ 302$ 299$ 295$ (403)$ (115)$ 170$ 281$ 277$ 273$ Income Taxes 40% -$ -$ -$ -$ -$ -$ 434$ 431$ 428$ 425$ 122$ 121$ 120$ 118$ -$ -$ 114$ 112$ 111$ 109$
Total After-Tax Net Cash Flow 1,128$ 1,120$ 1,113$ 1,106$ 1,099$ 1,092$ 651$ 646$ 642$ 638$ 184$ 181$ 179$ 177$ (403)$ 288$ 171$ 169$ 166$ 164$
Partial Period 1.00 1.00 1.00 1.00 1.00 1.00 1.00 1.00 1.00 1.00 1.00 1.00 1.00 1.00 1.00 1.00 1.00 1.00 1.00 1.00 Mid-Year Convention 1.00 2.00 3.00 4.00 5.00 6.00 7.00 8.00 9.00 10.00 11.00 12.00 13.00 14.00 15.00 16.00 17.00 18.00 19.00 20.00 PV Factor 1st 10 years @ Discount Rate 16.5% 0.85837 0.73680 0.63244 0.54287 0.46598 0.39999 0.34334 0.29471 0.25297 0.21714 PV Factor 2nd 10 yrs @ Discount Rate 11.5% 0.30198 0.27083 0.24290 0.21785 0.19538 0.17523 0.15715 0.14095 0.12641 0.11337
Present Value of Contract Cash Flows 968$ 826$ 704$ 600$ 512$ 437$ 223$ 191$ 162$ 138$ -$ -$ -$ -$ -$ -$ -$ -$ -$ -$ Present Value of SREC Cash Flows -$ -$ -$ -$ -$ -$ -$ -$ -$ -$ 55$ 49$ 44$ 39$ (79)$ 51$ 27$ 24$ 21$ 19$
Total Cash Flows 968$ 826$ 704$ 600$ 512$ 437$ 223$ 191$ 162$ 138$ 55$ 49$ 44$ 39$ (79)$ 51$ 27$ 24$ 21$ 19$
PRESENT VALUE CASH FLOWS 5,010$
DESCRIPTION

Massachusetts DOR Workshop April 8, 2013George E. Sansoucy, P.E., LLC © 38
Section 4: PILOT Agreement Overview and Discussion

Massachusetts DOR Workshop April 8, 2013George E. Sansoucy, P.E., LLC © 39
Payment in Lieu of Tax (PILOT) Agreements
PILOT agreements: Allowed for solar projects Provide stability to both municipality and project owner Can be for 5, 10, or 20 years Should reflect market value over term

Massachusetts DOR Workshop April 8, 2013George E. Sansoucy, P.E., LLC © 40
Revenue-Based Versus Fixed Payment
Payments can be based on gross revenue or cash flow Requires more monitoring and auditing Potentially more volatile Volatility can result in more or less benefits
Fixed payments Create most certainty Simple to administer

Massachusetts DOR Workshop April 8, 2013George E. Sansoucy, P.E., LLC © 41
PILOT Agreement Considerations
Contract(s) with municipalityMunicipal land or site is the host for solar project Type of PPA Applicable municipal tax rate Future consideration of SREC pricing

Massachusetts DOR Workshop April 8, 2013George E. Sansoucy, P.E., LLC © 42
Examples of PILOT Agreements in Massachusetts
PILOT Agreements in Massachusetts are being compiled and will be posted at a later date.

Massachusetts DOR Workshop April 8, 2013George E. Sansoucy, P.E., LLC ©
Supplemental Note
The cost valuation in this presentation starts with the assumption that the 1603 IRS grant of approximately 30%, while used to fund the construction, is not transferable value in the market sales approach. The grant is consumed by the developer the moment the site goes online.
The 20% direct capitalization rate of the first year’s income in the valuation model summary, while high by real estate standards, is necessary to discount the high SREC revenue in the first years and recognize the lower energy revenue in the out years.
We realize that both of these items are unusual in mass appraisal for towns and cities in Massachusetts, but are unique to this solar buildout program.
43

Massachusetts DOR Workshop April 8, 2013George E. Sansoucy, P.E., LLC ©
Questions
44
GEORGE E. SANSOUCY, P.E.279 Main StreetLancaster, NH 03584(603) [email protected]
GLENN C. WALKER7 Greenleaf Woods Drive, Unit 102Portsmouth, NH 03801(603) [email protected]
Contact Information:
Any specific questions regarding the workshop should be addressed to:
Mike Waddell(603) [email protected]
Presenters:

Page 1 of 2 Massachusetts DOR Workshop April 8, 2013 George E. Sansoucy, P.E., LLC ©
Assessor’s Generic Request for Information from Developer Relating to a Solar Photovoltaic (PV) Project
Please provide the following information for the Solar PV Project (Project) as it pertains to your specific site.
A. A brief narrative description of the Project that includes:
1) Name of Project owner(s) (individual, LLC, corporation, etc.) 2) Address 3) Map and lot number(s) 4) Total site acreage 5) Number of panels 6) Type of panel(s) 7) Type of inverter 8) Total AC and DC watts or kilowatts capacity 9) Total onsite use per year (include electric bills), total onsite generation estimated
per year
B. The Original Cost (as defined below) of the following major components:
1) Panels 2) Inverter 3) Interconnections 4) Civil works 5) All other project Original Costs
Original Cost is defined as: “The cost of the property at the time of installation as part of the system. This includes the amount of money paid for the property or the estimated monetary value of the property, if acquired by other consideration or by grant or gift, at the time of acquisition. Such cost shall also include all direct and indirect costs of construction to place said property in operation, including, but not limited to, labor, engineering, materials and supplies, transportation, contract work, protection, taxes, allowance for funds used during construction, insurance, construction services and any other indirect construction costs.”
C. The warranty terms in years for the following components:
1) Panels 2) Inverter 3) Any other component subject to warranty
D. Annual delivery of net AC kilowatts since the commercial operation date. (If any year is partial, indicate as such in the response.)

Page 2 of 2 Massachusetts DOR Workshop April 8, 2013 George E. Sansoucy, P.E., LLC ©
E. The annual net forecast of kilowatt (AC) and Solar Renewable Energy Certificate (SREC) production for the life of the Project.
F. The assumption of panel degradation for the life of the Project.
G. All contracts for the sale of electric commodities or SRECs for the Project, including all schedules and attachments.
H. The annual revenue and expenses for the Project since the commercial operation date for the following items. (If any year is partial, indicate as such in the response.)
1) Revenue from the sale of electricity 2) Revenue from the sale of SRECs 3) Any other miscellaneous revenue 4) Land lease expenses 5) Operating and maintenance expenses including inverter replacement cycle 6) Insurance expenses 7) Any other expenses 8) Capital replacement costs capitalized on the accounting records of the Project’s
owner(s)
I. A copy of all pro formas used to obtain financing (either equity or debt) for the Project.
J. The most recent pro forma or forecast for the Project.
K. The year of any planned inverter replacement along with the planned cost of such replacement.
L. Identify if the Project site is owned or leased.
M. If the Project site is owned identify the date of purchase, book and page of deed, and all consideration paid.
N. If the site is leased, provide a copy of the lease.
O. If the panels and or inverters are leased, a copy of the lease(s).

Massachusetts DOR Workshop April 8, 2013 George E. Sansoucy, P.E., LLC ©
GLOSSARY
AC Alternating current, electricity that changes voltage periodically, typically 60 times a second (or 50 in Europe). This kind of electricity is easier to move.
Crystalline Silicon The material from which most photovoltaic cells are made; in a single crystal cell, the entire cell is a slice of a single crystal of silicon, while a multicrystalline cell is cut from a block of smaller (centimeter-sized) crystals. The larger the crystal, the more exacting and expensive the manufacturing process.
DC Direct current, the complement of AC, or alternating current, presents one unvarying voltage to a load.
Interconnect To connect two systems, often an independent power producer and the grid.
Intertie The electrical connection between an independent power producer – for example, a PV-powered household – and the utility’s distribution lines, in such a way that each can supply or draw from the other.
Inverter The electrical device that changes direct current into alternating current.
Kilowatt 1,000 watts, a measure of instantaneous work. Ten 100-watt bulbs require a kilowatt of energy to light up.
Kilowatt-hour The standard measure of household electrical energy use. If the 10 bulbs left unfrugally burning in the preceding example are on for an hour, they consume 1 kilowatt-hour of electricity.
Net-metering A desirable form of buy-back agreement in which the line-tied house’s electric meter turns in the utility’s favor when grid power is being drawn, and in the system owner’s favor when the house generation exceeds its needs and electricity is flowing into the grid. At the end of the payment period, when the meter is read, the system owner pays (or is paid by) the utility depending on the net metering.
Panel Any flat modular structure; solar panels may collect solar energy by many means; a number of photovoltaic modules may be assembled into a panel using a mechanical frame, but this should more properly be called an array or subarray.
Photovoltaic cell The proper name for a device manufactured to pump electricity when light falls on it.
Photovoltaics PVs or modules that utilize the photovoltaic effect to generate useable amounts of electricity.

Massachusetts DOR Workshop April 8, 2013 George E. Sansoucy, P.E., LLC ©
Photovoltaic system The modules, controls, storage, and other components that constitute a stand-alone solar energy system.
Power Purchase Agreement (PPA)
A common contract instrument used in energy project development. A solar PPA is a contract between a project owner and a project host through which the project host buys the electricity generated by the PV array from the project owner at a predetermined rate.
Renewable Energy An energy source that renews itself without effort; fossil fuels, once consumed, are gone forever, while solar energy is renewable in that the sun we harvest today has no effect on the sun we can harvest tomorrow.
Solar panels Any kind of flat devices placed in the sun to harvest solar energy. Thin-film module An inexpensive way of manufacturing photovoltaic modules;
thin-film modules typically are less efficient than single-crystal or multi-crystal devices; also called amorphous silicon modules.