apresentação do powerpoint - martifer results 2013 metallic construction | sector trends...
TRANSCRIPT


DESTAQUES

ANNUAL RESULTS 2013
• Total Operating Revenues of 592.9 M€, increasing by 15 % YoY, reflecting the significant
improvement in volume of the core businesses areas Metallic Constructions and Solar, and also
leveraged by the sale of wind farms in the RE Developer
• Total Operating Revenues in the 4Q13 was 128.6 M€
• EBITDA of 29.3 M€ in the end of 2013 (versus 3.9 M€ in 2012)
• EBITDA in the 4Q13 was 9.6 M€, corresponding to an EBITDA margin of 7 %
• Net consolidated Profit at the end of 2013 of -70.8 M€; Net consolidated Profit in 4Q13
was -22 M€
• Total Order Book of 567 M€: Metallic Construction (297 M€) and Solar (270 M€)
• Total Net Consolidated Debt of 335 M€, 42 M€ below the FY12 level, due to disinvestment in
non core activities and working capital improvements
page 3
DESTAQUES

ANNUAL RESULTS 2013
ECONOMIC AND FINANCIAL ANALYSIS
• Revenues increased by 14.5 % YoY
to 592.9 M€.
• Annual EBITDA registered 29.3 M€,
an YoY increase >100 %, with a 4.9 %
margin, which compares with 0.8 %
in 2012.
• Net Financial Expenses totalled 49.2
M€, comparable with 36.3 M€ in 2012.
Net Interest Expense was 27.0 M€,
the Net Foreign Exchange reached net
losses of 3.7 M€ and the other
financial costs were 18.5 M€.
• Consolidated Net Profit in 2013 was
-70.8 M€, which compares with
-54.4 M€ in 2012.
FY2013 FY2012 YoY
M€ Var. %
Revenues 592.9 517.9 14.5%
EBITDA 29.3 3.9 >100%
Margin % 4,9% 0.8% 4.2 p.p
EBIT -21.3 -15.9 -34.2%
Margin % -3.6% -3.1% -0.5 p.p.
Financial Results -49.2 -36.3 -35.5%
Profit before tax -70.5 -52.2 -35.1%
Income tax -0.3 -2.3 88.4%
Result from assets held for sale 0.0 0.1 n.m.
Consolidated Net Profit -70.8 -54.4 -30.0%
Attributable
to non-controlling interests -1.8 1.4 n.m.
to shareholders -69.0 -55.9 -23.5%
page 5

ANNUAL RESULTS 2013
-54.2
-7.6
9.9
1.6
-26.6
-60
-50
-40
-30
-20
-10
0
10
20RE Developer Solar
Prio Energy*
Nutre*
Metallic
Constructions
“BIG PICTURE” OF NET PROFIT CONTRIBUTIONS
* Both Nutre and Prio Energy are consolidated by the equity method
page 6

ANNUAL RESULTS 2013
REVENUES
• In 2013 the Total of Operating Revenues increased
by 14.5 % YoY to 592.9 M€, reflecting the significant
improvement in volume of the core business areas
Solar and Metallic Constructions, and leveraged
by the sale of wind farms in the RE Developer.
The contribution of Portugal for the total Revenues
was only 18 % and the remaining 82 % come from
four different regions: European Union (excluding
Portugal) 33 %, Latin America 27 %, Africa and
Saudi Arabia 15 % and North America 4 %.
• Metallic Construction business area reported an
increase of 4.7 % YoY in Revenues to 276.1 M€,
in a year marked by projects with greater complexity,
in terms of engineering, with the strongest markets
being Brazil, Saudi Arabia, Angola and France.
• Solar business ended the FY2013 with 274.7 M€
of Total Operating Revenues, increasing by 17.2 %
YoY, justified by the conclusion of projects in several
geographies, highlighting the project in Mexico,
currently the biggest project in Latin America,
projects in Portugal and the UK.
Revenues FY 2013 FY 2012
M€ Weight M€ Weight Var. %
Martifer Consolidated 592.9 517.9 14.5%
Metallic Construction 276.1 46.6% 263.6 50.9% 4.7%
Solar 274.7 46.3% 234.4 45.3% 17.2%
RE Developer 44.1 7.4% 18.3 3.5% >100%
Other, Holding and Adjust. -2.0 -0.3% 1.6 0.3% n.m.
page 7
ANNUAL RESULTS 2013
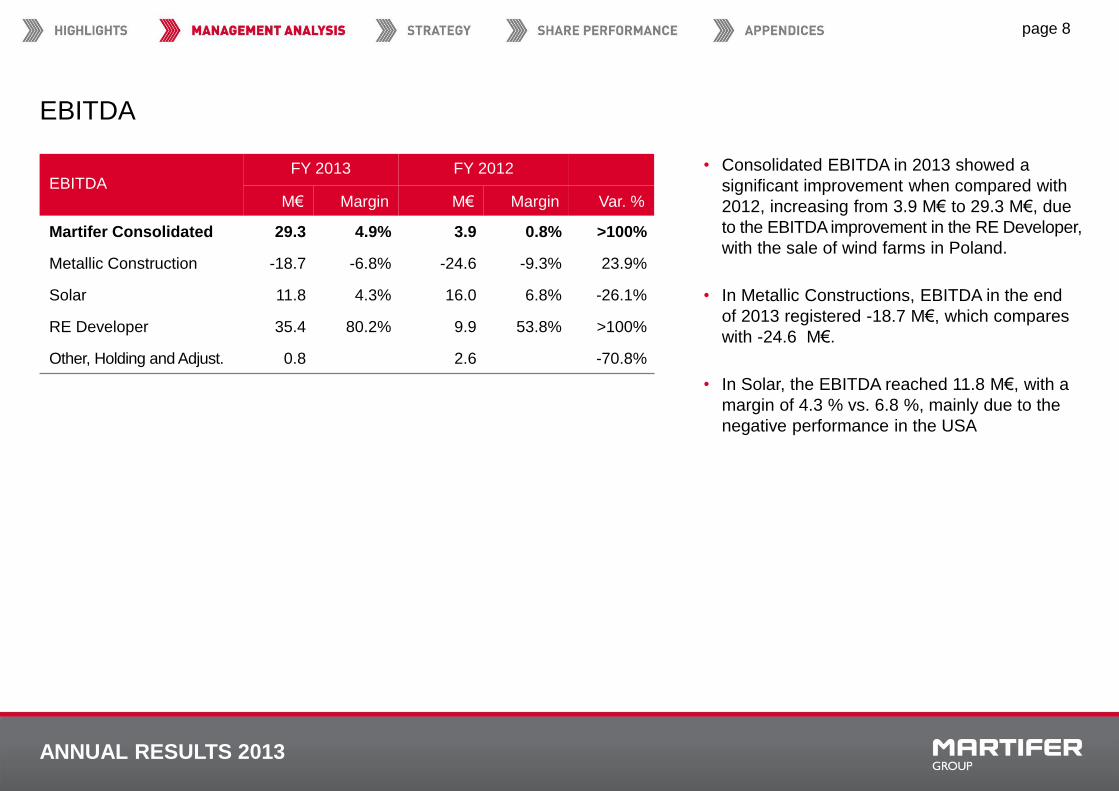
EBITDA
• Consolidated EBITDA in 2013 showed a
significant improvement when compared with
2012, increasing from 3.9 M€ to 29.3 M€, due
to the EBITDA improvement in the RE Developer,
with the sale of wind farms in Poland.
• In Metallic Constructions, EBITDA in the end
of 2013 registered -18.7 M€, which compares
with -24.6 M€.
• In Solar, the EBITDA reached 11.8 M€, with a
margin of 4.3 % vs. 6.8 %, mainly due to the
negative performance in the USA
EBITDA FY 2013 FY 2012
M€ Margin M€ Margin Var. %
Martifer Consolidated 29.3 4.9% 3.9 0.8% >100%
Metallic Construction -18.7 -6.8% -24.6 -9.3% 23.9%
Solar 11.8 4.3% 16.0 6.8% -26.1%
RE Developer 35.4 80.2% 9.9 53.8% >100%
Other, Holding and Adjust. 0.8 2.6 -70.8%
page 8

ANNUAL RESULTS 2013
METALLIC CONSTRUCTION | Sector Trends
INTERNATIONAL OUTLOOK
page 9
• European construction experienced severe declines within the
last years as a result of various crises
• Production output declined by 2.7 % in real terms in 2013 in
Western Europe
• The construction outlook is more favourable for the 2014-2016
period. Construction is expected to grow moderately by 0.9% in
2014.
• Further more dynamic performance should follow in the
forecast period 2015-16, given a stable economic framework
• Growth and need for infrastructures in Latin America continues
• Eastern Europe, Middle East and Africa with a strong demand,
despite a strong competition environment
ANNUAL RESULTS 2013
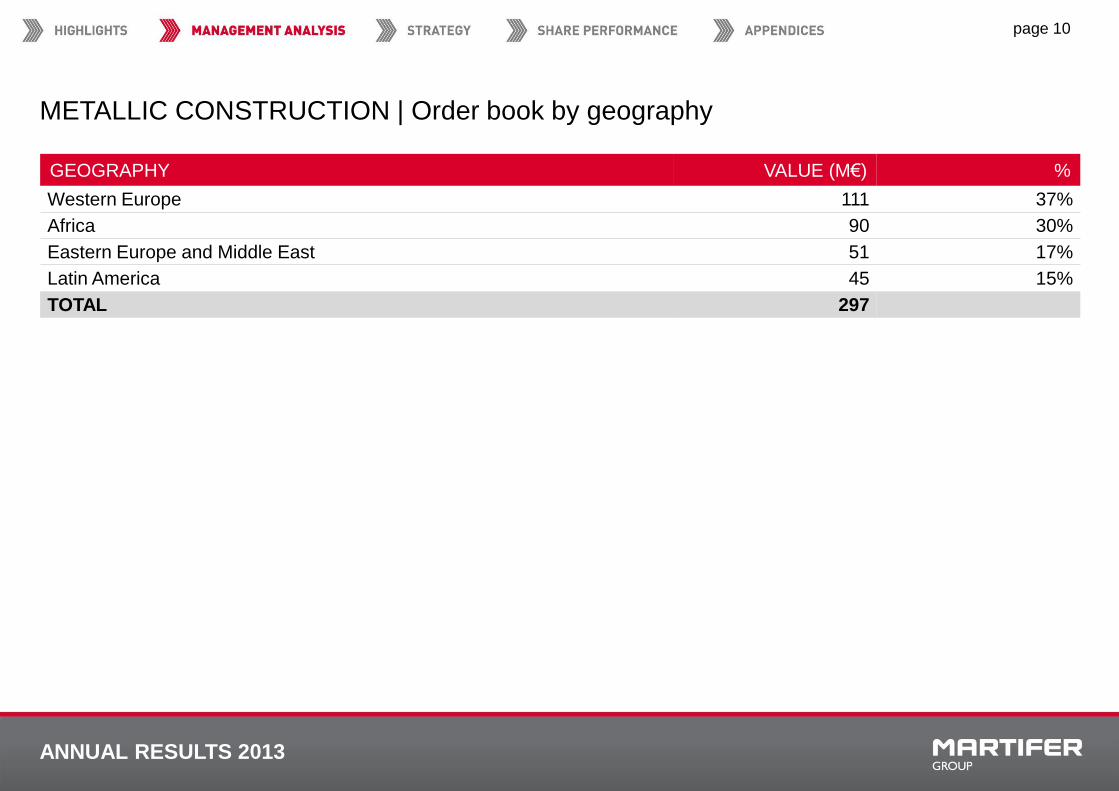
METALLIC CONSTRUCTION | Order book by geography
page 10
GEOGRAPHY VALUE (M€) %
Western Europe 111 37%
Africa 90 30%
Eastern Europe and Middle East 51 17%
Latin America 45 15%
TOTAL 297

ANNUAL RESULTS 2013
METALLIC CONSTRUCTION | Earnings
• Revenues increased by 4.7 % to 276.1 M€, despite the
difficulties in the sector, mainly in Europe.
• EBITDA in the FY13 registered -18.7 M€, which compares
with -24.6 M€ in the FY12, reflecting the following effects:
(1) Deterioration of market conditions in Europe, with effects
on the margins; (2) Remaining effect of the exit of the Polish
market; (3) Additional costs in projects.
• Net Financial Expenses in 2013 had an increase of 5.2 %
to 15.1 M€, due to the increase in the spreads and financing
commissions applied by the banks.
METALLIC CONSTRUCTION FY2013 FY2012 Var.%
M€
Revenues 276.1 263.6 4.7%
EBITDA -18.7 -24.6 23.9%
EBITDA Margin -6.8% -9.3% 2.5 pp
EBIT -34.6 -32.0 -8.0%
EBIT Margin -12.5% -12.1% -0.4 pp
Net Financial Expenses 15.1 14.4 5.2%
Income tax 4.5 -0.3 n.m.
Results from assets held for sale 0.0 0.0 n.m.
Net Profit -54.2 -46.1 -17.5%
Attributable to non-controlling interests 0.2 0.3 -35.2%
Attributable to shareholders -54.4 -46.4 -17.2%
page 11

ANNUAL RESULTS 2013
SOLAR | Sector Trends - I
page 12
INTERNATIONAL OUTLOOK
• PV market with a renewed sense of optimism at the end of
2013, although prices are flat and margins are only slightly
positive for a few companies
• 2013 expected to finish up at 35.8-40.4 GW total new build and
expectation is that in 2014 demand will be between 41.4 and
49.9 GW, which means a volume growth between +16 % /+24 %.
• Consolidation continues, and orders keep flowing to large and
medium manufacturers
• Active players plan expansion in 2014
• Growing markets: India, Latin America, US
• Continuing markets: UK, France and Italy
• Declining markets: Germany and Spain
SO
UR
CE
: Blo
om
be
rg N
ew
En
erg
y F
ina
nce

ANNUAL RESULTS 2013
SOLAR | Sector Trends - II
page 13
LATIN AMERICA
• Brazil no longer dominant in renewable energy demand
• Chile, Mexico and Uruguay stronger
• Solar energy at a steady pace, with a strong growth expected
for the next years
• 322 % growth forecast for 2014
SO
UR
CE
: Blo
om
be
rg N
ew
En
erg
y F
ina
nce
ANNUAL RESULTS 2013
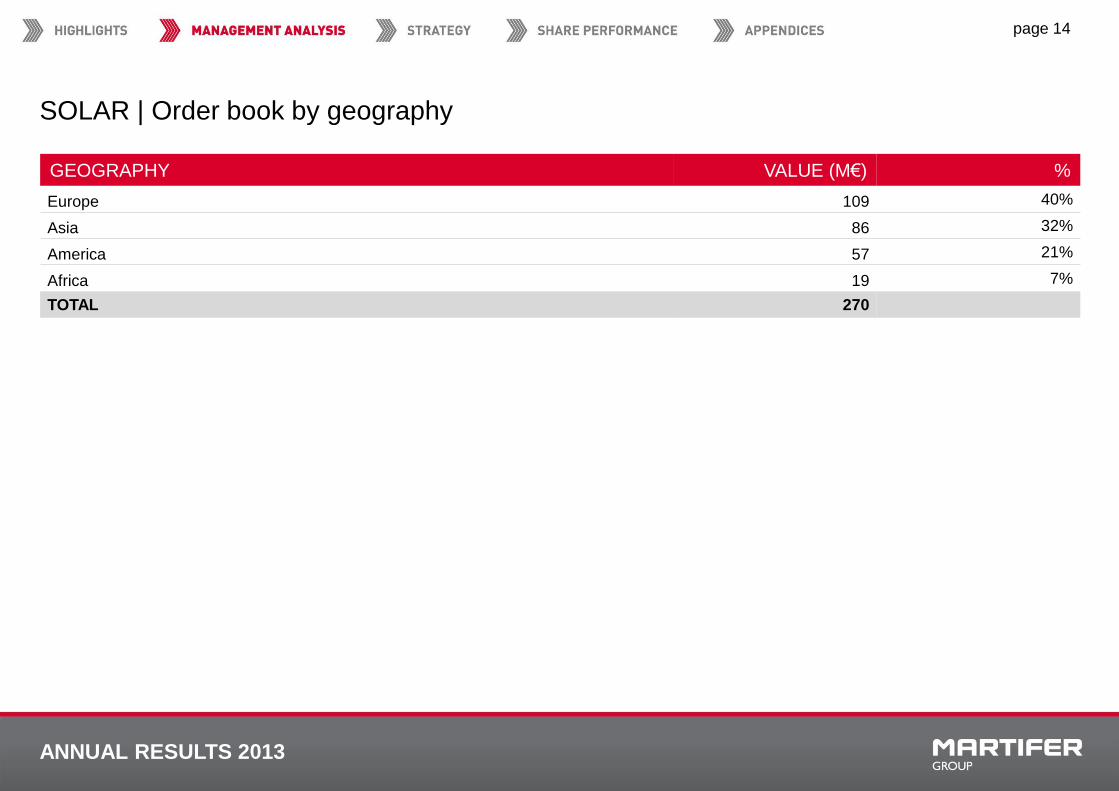
SOLAR | Order book by geography
page 14
GEOGRAPHY VALUE (M€) %
Europe 109 40%
Asia 86 32%
America 57 21%
Africa 19 7%
TOTAL 270

ANNUAL RESULTS 2013
SOLAR | Earnings
• Revenues increased by 17.2 % YoY, totalling 274.7 M€,
justified by the strong take-off of projects in several geographies,
highlighting the project in Mexico, currently the biggest project
in Latin America, in Portugal and in the UK.
• EBITDA in Solar in the FY13 totalled 11.8 M€, decreasing by
26.1 %, with a margin of 4.3 % vs. 6.8 % YoY, mainly due to
the negative performance in the USA.
• Net Debt in the FY13 was 51.0 M€, 1.4 M€ below 2012. This
decrease was due mainly to the sale of projects in France,
Italy and Portugal and a more efficient management of
working capital. The sale of Silverado projects and the
transfer of related liabilities had also a positive contribution
in debt reduction, after the deconsolidation effect.
SOLAR FY2013 FY2012 Var.%
M€
Revenues 274.7 234.4 17.2%
EBITDA 11.8 16.0 -26.1%
EBITDA Margin 4.3% 6.8% -2.5 pp
EBIT 3.9 13.3 -70.9%
EBIT Margin 1.4% 5.7% -4.3 pp
Net Financial Expenses 14.8 7.4 >100%
Income tax -3.3 2.3 n.m.
Net Profit -7.6 3.6 n.m.
Attributable to non-controlling interests 1.6 -1.4 n.m.
Attributable to shareholders -9.2 5.0 n.m.
page 15
ANNUAL RESULTS 2013
RE DEVELOPER | Tendências Setoriais
INTERNATIONAL OUTLOOK
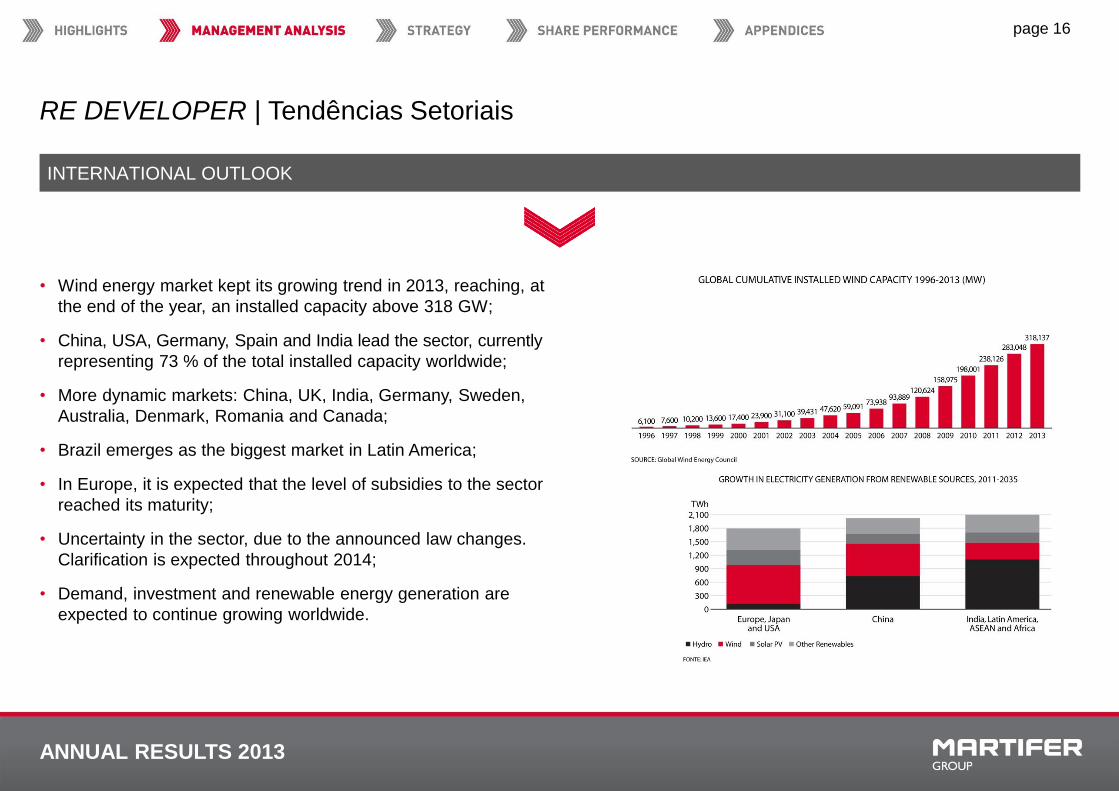
• Wind energy market kept its growing trend in 2013, reaching, at
the end of the year, an installed capacity above 318 GW;
• China, USA, Germany, Spain and India lead the sector, currently
representing 73 % of the total installed capacity worldwide;
• More dynamic markets: China, UK, India, Germany, Sweden,
Australia, Denmark, Romania and Canada;
• Brazil emerges as the biggest market in Latin America;
• In Europe, it is expected that the level of subsidies to the sector
reached its maturity;
• Uncertainty in the sector, due to the announced law changes.
Clarification is expected throughout 2014;
• Demand, investment and renewable energy generation are
expected to continue growing worldwide.
page 16

ANNUAL RESULTS 2013
OTHER | RE Developer’s Earnings
• Total Operating Revenues increased significantly in 2013
YoY to 44.1 M€, mainly explained by the sale of the wind
farms in Poland to IKEA.
• Revenues from the wind and solar farms in operation in the
period, totalling 64 MW, located in Spain, Romania and
Brazil, were 17.9 M€ versus 17.1 M€ in 2012.
• EBITDA reached 35.4 M€ in 2013, showing an improvement
YoY, and reflecting also a 26.4 p.p. increase in its margin.
• Net Debt at the end of 2013 was 13 million eurso, 27 M€
less than final year 2012. To the significant net financial debt
reduction in the RE Developer area has decisively
contributed the sale of the Rymanów wind farm and the
signature of the sale agreement for Rosa dos Ventos.
RE Developer FY2013 FY2012 Var.%
M€
Revenues 44.1 18.3 >100%
EBITDA 35.4 9.9 >100%
EBITDA Margin 80.2% 53.8% 26.4 pp
EBIT 11.1 2.0 >100%
EBIT Margin 25.1% 11.1% 14 pp
Net Financial Expenses 1.9 1.5 24.3%
Income tax -0.8 0.1 n.m.
Net Profit 9.9 0.3 >100%
Attributable to non-controlling interests 0.6 0.6 0.0%
Attributable to shareholders 9.3 -0.3 n.m.
page 17

ANNUAL RESULTS 2013
DÍVIDA LÍQUIDA
Note: Net Debt = Borrowings + Financial Leases (+/-) Derivatives – Cash and Cash Equivalents
€M Metallic Construction Solar RE Developer Holding Martifer Consolidated
Corporate Net Debt allocated to operating activities 108 51 13 136 308
Corporate Net Debt allocated to non-operating activities 27 27
Non-Recourse Net Debt
Total Net Debt 135 51 13 136 335
Net Debt FY12 120 62 40 155 377
+15 -11 -27 -19 -42
• The Group’s Consolidated Net Debt at 31st Dezember 2013
totalled 335 M€.
• When compared with 2012, it registered a 42 M€ decrease.
This variation is totally justified by the divestment in non core
assets, according to the priorities in the ongoing strategic
plan and improvements in working capital.
page 18
485 444
321 330
377 335
0
100
200
300
400
500
600
2008 2009 2010 2011 2012 2013

ANNUAL RESULTS 2013
NET DEBT STRUCTURE
NET DEBT STRUCTURE NET DEBT STRUCTURE – FIXED VS. FLOATING – 2013
page 19
29%
71%
Short Term M/L Term
3%
97%
Fixed - M/L Term Floating - M/L Term

ANNUAL RESULTS 2013
CAPEX
• The amount of investment in fixed assets in 2013
was 9.8 M€, mostly applied as follows:
1) Development of solar projects by Martifer Solar
(1.9 M€). This does not mean long term
investment, as they are assets held for sale.
2) In Metallic Construction business area, 5.5 M€,
which corresponds to maintenance Capex,
namely in the conclusion of investments in Brazil,
such as the new aluminium factory, and a new
transportation crane in Navalria;
3) Finally, RE Developer’s investment was
approximately 2.4 M€.
NET CAPEX
page 20
122.4
213
102.4
46.3 61.3 56.6
9.8
0
50
100
150
200
250
2007 2008 2009 2010 2011 2012 2013

DESTAQUES

ANNUAL RESULTS 2013
PRINCIPAL MENSAGEM
page 22
Debt decrease via the sale of non core assets
Growth in Revenues
Improvements in operational efficiency
2013 IN ANALYSIS, GOALS PARTIALLY ACHIEVED:
Action Plan for 2014 - 4 goals:
Decrease in debt through the sale of non core assets
Increase of operational efficiency
Order Book growth, leveraged by partnerships
Strengthened capital structure

DESTAQUES

ANNUAL RESULTS 2013
SHARE PERFORMANCE
SHARE PRICE VARIATION | 2013 TRADED VOLUME | 2013 –‘000 shares
page 24
• Martifer’s share price ended 2013 with 29.4% gains, above Euronext Lisbon’s main index, PSI-20, which increased by 16.3 %, compared with the
end of 2012.
• Martifer’s share price closed 2013 at 0.73 €/share.
• Maximum price achieved was 0.82 €/share and minimum 0.45 €/share.
• average volume of stocks traded during the period was 66,474 shares, which translates a significant increase when compared with the average volume
registered at the end of 2012 (12,652 shares).
0
20
40
60
80
100
120
140
160
01
-201
3
01
-201
3
01
-201
3
02
-201
3
02
-201
3
03
-201
3
03
-201
3
04
-201
3
04
-201
3
05
-201
3
05
-201
3
06
-201
3
06
-201
3
07
-201
3
07
-201
3
07
-201
3
08
-201
3
08
-201
3
09
-201
3
09
-201
3
10
-201
3
10
-201
3
11
-201
3
11
-201
3
12
-201
3
12
-201
3
Martifer PSI20 Index
0
100000
200000
300000
400000
500000
600000
700000
j-13 f-13 m-13 a-13 m-13 j-13 j-13 a-13 s-13 o-13 n-13 d-13

DESTAQUES

ANNUAL RESULTS 2013
page 26
49% 10%
Steel Structures
Aluminium and Glass
Oil & Gas Equipment
Naval Industry
Project Development
EPC
PV Solutions
Distribution
O&M
Development of wind energy
assets
Construction Management
Operation and Technical
Management
OTHER
100% 55% 100%
MARTIFER GROUP STRUCTURE
ANNUAL RESULTS 2013
page 27
PROFIT & LOSS
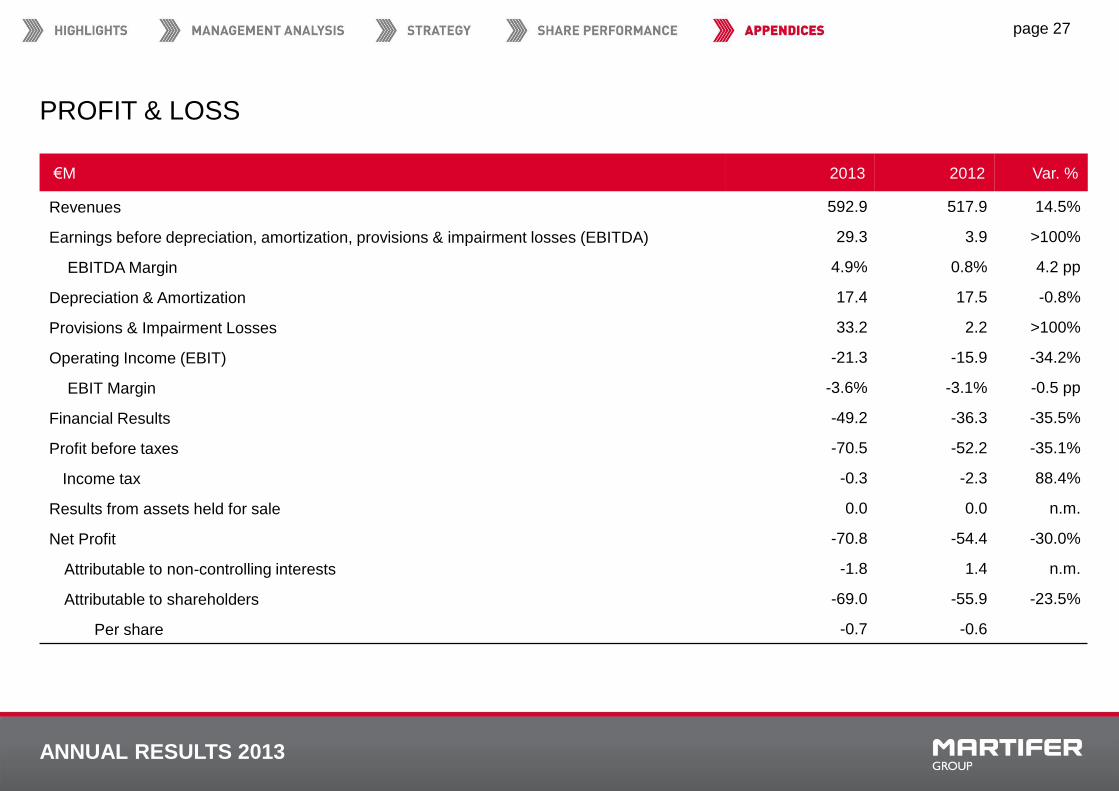
€M 2013 2012 Var. %
Revenues 592.9 517.9 14.5%
Earnings before depreciation, amortization, provisions & impairment losses (EBITDA) 29.3 3.9 >100%
EBITDA Margin 4.9% 0.8% 4.2 pp
Depreciation & Amortization 17.4 17.5 -0.8%
Provisions & Impairment Losses 33.2 2.2 >100%
Operating Income (EBIT) -21.3 -15.9 -34.2%
EBIT Margin -3.6% -3.1% -0.5 pp
Financial Results -49.2 -36.3 -35.5%
Profit before taxes -70.5 -52.2 -35.1%
Income tax -0.3 -2.3 88.4%
Results from assets held for sale 0.0 0.0 n.m.
Net Profit -70.8 -54.4 -30.0%
Attributable to non-controlling interests -1.8 1.4 n.m.
Attributable to shareholders -69.0 -55.9 -23.5%
Per share -0.7 -0.6

ANNUAL RESULTS 2013
page 28
BALANCE SHEET
€M 2013 2012 Var. %
Fixed Assets (including Goodwill) 230.0 331.8 -30.7%
Other non-current assets 164.9 187.7 -12.2%
Inventory and Receivables 322.9 383.8 -15.9%
Cash and cash equivalents 39.2 38.0 3.1%
Assets held for sale 30.8 35.1 -12.3%
Total Assets 787.8 976.4 -19.3%
Shareholders’ Equity 100.0 176.3 -43.3%
Non-controlling interests 39.7 51.0 -22.1%
Total Equity 139.7 227.3 -38.5%
Non-current debt and leasings 236.8 177.1 33.7%
Other non-current liabilities 37.5 38.2 -1.8%
Current debt and leasings 138.1 237.6 -41.9%
Other current liabilities 224.5 286.7 -21.7%
Liabilities related with Assets held for sale 11.2 9.5 17.6%
Total Liabilities 648.1 749.1 -13.5%

ANNUAL RESULTS 2013
REPRESENTATIVE FOR MARKET
RELATIONS
Mário Rui Rodrigues Matias
T. +351 232 767 702
F. +351 232 767 750
www.martifer.com
page 29