being global - martifer.com · 1q 2013 report page 7 main eventssubsequent events january 2013...
TRANSCRIPT

BEING GLOBAL REPORT
1Q 2013

PAGE 2 1Q 2013 REPORT
CONTENTS
MANAGEMENT REPORT 03
01 | MARTIFER GROUP 05
Highlights 06
Key Financial Indicators 06
Main Events 07
02 | FINANCIAL PERFORMANCE 09
Results Analysis 10
Revenues 11
EBITDA and Net Profit 12
CAPEX 13
Capital Structure Analysis 13
03 | ANALYSIS BY SEGMENT 15
Metallic Constructions 16
Solar 18
RE Developer 19
04 | MARTIFER SHARE’S PERFORMANCE 21
CONSOLIDATED FINANCIAL INFORMATION 23
05 | INTERIM CONSOLIDATED FINANCIAL STATEMENTS 25
06 | NOTES TO INTERIM CONSOLIDATED FINANCIAL STATEMENTS 31

MANAGEMENT
REPORT

PAGE 4 1Q 2013 REPORT

01 MARTIFER
GROUP

PAGE 6 1Q 2013 REPORT
01 | MARTIFER GROUP
HIGHLIGHTS
Operating Revenues of 128 M€ increasing by 14 % comparing with the same period last
year, reflecting the significant improvement in volume of the core business areas: Metallic
Construction and Solar
Portugal only represents 12 % of the total Operating Revenues, which proves the
efforts of internationalization
EBITDA of 2.6 M€ (versus 10.3 M€ in 1Q 2012), reflecting mostly: 1) Costs incurred in
Australia in the Metallic Construction business area related with the restructuring of the
business in the country and 2) the weak performance of USA market in Martifer Solar which
impacted negatively the business margin
Net consolidated Profit of -13.9 M€, negatively impacted by 11.2 M€ net financial costs
Total Order Book of 550 M€: Metallic Construction (307 M€) and Solar (243 M€)
Total Net Debt of 385 M€, slightly above the FY 2012 of 377 M€, mostly due to the CAPEX
of 4.7 M€ and Working Capital
MAIN FINANCIAL INDICATORS
€M – IFRS 1Q2013 Margin 1Q2012 Margin Var. %
Revenues 128.0 112.2 14.0%
EBITDA 2.6 2.0% 10.3 9.2% -74.5%
EBIT -2.9 -2.2% 5.4 4.8% n.m.
Financial Results -11.2 -8.2 -36.3%
Profit Before Tax -14.0 -2.9 <-100%
Income tax 0.0 -1.7 n.m.
Results from assets held for sale
0.2 0.0 n.m.
Consolidated Net Profit -13.9 -10.8% -4.6 -4.1% <-100%
Attributable
to non-controlling interests 0.3 0.1 >100%
to shareholders -14.2 -4.7 <-100%

1Q 2013 REPORT PAGE 7
MAIN EVENTSSUBSEQUENT EVENTS
JANUARY 2013
Inspira Martifer Solar signs contract for first rooftop project in India
Inspira Martifer Solar, a subsidiary of Martifer Solar for the Indian market, has signed an EPC contract with Mapro Foods for the
construction of a 350 kW rooftop project in India.
Martifer Solar and the Valouro Group sign a new contract for the construction
of seven PV projects
Martifer Solar signed a new contract with Valouro Group, for the construction of seven new PV small generation projects, with
a 1.3 MW peak power.
MARCH 2013
Martifer Solar and Montepio Crédito establish a partnership for financing small
generation projects
Martifer Solar signed a protocol with Montepio Crédito, a company of the Montepio Group, to facilitate the access to the possibility
of financing of PV small generation projects to companies in Portugal.
Martifer concludes two ships for Douro Azul
Navalria, a subsidiary of Martifer Metallic Constructions, concluded the construction of Queen Isabel and Amavida. The baptism of
these two hotel ships took place on March 23rd
. The two ships were built in only nine months.
MAIN SUBSEQUENT EVENTS
APRIL 2013
Martifer concludes the Arena Fonte Nova Stadium’s roof structure
Martifer Construções Metálicas, a subsidiary of Martifer Metallic Constructions in Brazil, concluded, in April, the construction of the
structural steelwork for the roof of its second stadium for the Brazil World Cup.
Martifer Solar completes a utility scale solar PV plant cluster in the UK with a total capacity of
28.1 MWp
Martifer Solar developed a cluster of utility scale photovoltaic plants totalling 28.1 MWp in the United Kingdom. This is one of the
largest clusters of utility scale solar PV plants ever built simultaneously in the country to date.
Martifer ships the first pieces for the structural steelwork and roof of Arena Amazônia
Martifer Metallic Constructions shipped the first pieces for Arena Amazônia, the third 2014 World Cup Stadium, which is expected to
be concluded in December 2013.

PAGE 8 1Q 2013 REPORT
MAY 2013
Martifer Solar to build Latin America’s largest PV plant in Mexico
Martifer Solar is building a 30 MW photovoltaic plant in Mexico, the largest to date in Latin America. The company is responsible for
the EPC (engineering, procurement and construction) services of the plant and will also provide the Operation and Maintenance
(O&M) services upon completion.

02 FINANCIAL
PERFORMANCE

PAGE 10 1Q 2013 REPORT
03 | FINANCIAL PERFORMANCE
RESULTS ANALYSIS
M€ 1Q2013 1Q2012 Var. %
Revenues 128.0 112.2 14.0%
Earnings before depreciation, amortization and provisions & impairment losses (EBITDA) 2.6 10.3 -74.5%
EBITDA margin 2.0% 9.2% -7.2 p.p.
Depreciation & Amortization 4.5 4.5 -1.5%
Provisions & Impairment Losses 1.0 0.4 >100%
Operating Income (EBIT) -2.9 5.4 n.m.
EBIT margin -2.2% 4.8% -7.0 p.p.
Financial Results -11.2 -8.2 -36.3%
Profit before taxes -14.0 -2.9 <-100%
Income tax 0.0 1.7 n.m.
Results from assets held for sale 0.2 0.0 n.m.
Net Profit -13.9 -4.6 <-100%
Attributable to non-controlling interests 0.3 0.1 >100%
Attributable to shareholders -14.2 -4.7 <-100%
per share € -0.146 -0.048
.

1Q 2013 REPORT PAGE 11
REVENUES
In the 1Q 2013 Operating Revenues increased by 14.0 % YoY to 128.0 million euro, reflecting the significant improvement in volume of
the core business areas: Metallic Construction and Solar
Metallic Construction business area reported an increase of 8.4 % YoY in Revenues, with stronger markets such as Brazil, Saudi Arabia,
Angola and France.
The Solar business ended 1Q 2013 with 58.8 million euro of Operating Revenues, increasing by 14.6 % YoY. Portugal, United Kingdom
and Mexico were the countries with the higher contribution for the revenues.
REVENUES
1Q2013 1Q2012
M€ WEIGHT M€ WEIGHT VAR.
Martifer Consolidated 128.0 112.2 14.0%
Metallic Construction 66.3 51.8% 61.2 54.5% 8.4%
Solar 58.8 46.0% 51.3 45.7% 14.6%
RE Developer 3.8 3.0% 3.4 3.1% 10.4%
Others -1.0 -0.8% -3.7 -3.3% 73%
Note: Others include Holding, Shared Services and eliminations
Portugal represented in the 1T 2013 only 12 % of the total Operating Revenues, which is comparable with 19 % in the FY2012 and
which proves the strong efforts of the Group internationalization
REVENUES BREAKDOWN
Portugal 12%
European Union 44%
Excl. PT North America
3%
Africa & Saudi Arabia
17%
Latin America 23%
Others 1%

PAGE 12 1Q 2013 REPORT
EBITDA AND NET PROFIT
Consolidated EBITDA in the 1Q 2013 reached 2.6 million euro, versus 10.3 million euro in the same period last year, which reflects a
margin of 2.0 %, reflecting a decrease of 7.1 p.p. in margin on a YoY basis.
EBITDA of 2.6 M€ (versus 10.3 M€ in 1Q 2012), reflecting mostly: 1) Costs incurred in Australia in the Metallic Construction business
area related with the restructuring in the country and 2) the weak performance of USA market in Martifer Solar which impacted
negatively the business margin. Or in other words:
Metallic Construction reported approximately 4.5 million euro of losses in Australia which were related with the restructuring taking place
and the negative margin accounted in some of the works. We stress that, in this geography, a reorganization plan is under implementation.
In Solar the EBITDA was mostly affected by the weak performance of USA market, which showed a negative EBITDA of 2.9 million euro.
Meanwhile since the beginning of 2013 that company is running a plan with several measures under way, such as the control of the
business at 100 %, change in the management and the implementation of a new operational and strategic plan.
From remaining companies with contribution for the EBITDA, RE Developer had a positive contribution of 2.5 million euro, reaching an
improvement of 49.7 % YoY.
EBITDA
1Q2013 1Q2012
M€ Margin M€ Margin Var.
Martifer Consolidated 2.6 2.0% 10.3 9.2% -74.5%
Metallic Construction -1.0 -1.6% 4.1 6.6% <-100%
Solar 1.4 2.3% 4.9 9.5% -71.6%
RE Developer 2.5 66.6% 1.7 49.1% 49.7%
Others -0.3 -0.3 -21.0%
Note: Others include Holding, Shared Services and eliminations
The Depreciation & Amortization has shown a slight decrease of 1.5 % to 4.5 million euros. Meanwhile, the Provisions & Impairment
Losses has an increase from 0.4 million euro to 1.0 million euro, due to the report of 0.6 million euro of impairments, from the sale
of a real state asset from the portfolio set for disposal.
In the 1Q 2013, net financial expenses totalled 11.2 million euro, comparable with 8.2 million euro in the 1Q 2012. This increase is
totally explained by the losses record from subsidiary companies in the 1Q 2013 from 0.4 million euro to 3.8 million euro. In other
words, the net contribution of equity consolidated associated companies, Prio Energy and Nutre, controlled at 49 % was negative
in 4.1 million euro.
Net interest expense was 4.9 million euro in the 1Q 2013, totally in line with the same period last year with 4.8 million euro.
Taxes suffered a significant change, from -0.02 to1.7 million euro what can be explained by the record of deferred tax assets.
Therefore, the Net Profit attributable to shareholders in the 1Q 2013 amounted to negative 13.9 million euro, decreasing from the
negative 4.6 million euro in the 1Q 2012.

1Q 2013 REPORT PAGE 13
CAPEX
The amount of investment in fixed assets in the 1Q 2013 was 4.7 million euros, mostly applied as follows:
(1) Development of solar projects in Italy by Martifer Solar (1.8 million euros). This does not mean long term investment for the company;
(2) Approx. 0.7 million euros invested in Metallic Construction business area in Saudi Arabia and maintenance CAPEX (2.2 million euro);
(3) In the RE Developer area, investment of 0.7 million euros in the development and construction of wind farms
CAPITAL STRUCTURE ANALYSIS
FINANCIAL POSITION
1Q2013 2012 Var.
€M
Fixed Assets (including Goodwill) 296.0 331.8 -10.8%
Other non-current assets 186.4 187.7 -0.7%
Inventory and Receivables 447.1 383.8 16.5%
Cash and cash equivalents 33.0 38.0 -13.2%
Assets held for sale 42.0 35.1 19.5%
Total Assets 1,004.5 976.4 2.9%
Shareholders’ Equity 162.9 176.3 -7.6%
Non-controlling interests 53.0 51.0 3.9%
Total Equity 215.9 227.3 -5.0%
Non-current debt and leasings 164.1 177.1 -7.3%
Other non-current liabilities 39.8 38.2 4.3%
Current debt and leasings 254.3 238.1 6.8%
Other current liabilities 312.2 286.2 9.1%
Liabilities related to assets held for sale 18.2 9.5 91.1%
Total Liabilities 788.6 749.1 5.3%
Regarding the Balance Sheet position of the Group, it is worth to highlight that there are no significant changes from the last reported
period (1H 2012), and Martifer continues to show a robust capital structure with a financial autonomy ratio of approximately 22 %.
Total assets at 31st March 2013, amounted to 1,004.5 million euro, which compares to 976.4 million euro at 31
st December 2012.
Non-current assets reached 482.4 million euro compared with 519.5 million euro, at the end of 2012.
Total Equity at 31st March 2013 was 215.9 million euro with compares with 227.3 million euro in the end of 2012.

PAGE 14 1Q 2013 REPORT
NET DEBT
M€ Metallic
Construction Solar RE Developer Holding
Martifer
Consolidated
Corporate Net Debt 93 63 26 161 343
Corporate Net Debt allocated to non-operating activities
27 27
Non-Recourse Net Debt 15 15
Total Net Debt 122 63 41 161 385
Note: Net Debt = Borrowings + Financial Leases (+/-) Derivatives – Cash and Cash Equivalents
The Group’s Consolidated Net Debt at 31st March 2013 totalled 385 million euro, slightly above the 377 million euro registered at the
end of 2012. This value was already adjusted by the Net Debt of the asset held for sale (Wiatrowa) of approximately 11.7 million euro.
The Group is focused in its objective to have a debt level between 230 and 250 million euro by the end of 2014. Considering the
present debt level (385 million euro) it is the company’s goal to pursue further debt reduction of 135 up to 155 million euro until the
end of 2014 by the sale of non-core assets, mainly wind farms, solar projects and, residually, from the sale of real estate projects.

03 ANALYSIS
BY SEGMENT

PAGE 16 1Q 2013 REPORT
04 | ANALYSIS BY SEGMENT
METALLIC CONSTRUCTIONS
SECTOR TRENDS
− In Europe, the environment around construction sector had no major changes in the 1Q 2013, comparing with 2012.
Indicators continue depressed in Europe, from north to south, and in all segments. Austerity measures across several
countries and financial heath in the public sector totally affected the demand of infrastructures and buildings. Euroconstruct
institute has made again a downgrade of its construction forecasts for Europe, i.e., from +0.4 % to -1.5 % in 2013.
− Only emerging markets have been driving economic growth and there has been significant demand for metallic structure,
mostly in Asia and South America. Above all, Brazil continues to be a hot spot, with the sector pushed by several
infrastructures projects.
ACTIVITY
The order book in the 1Q 2013 accumulated 307 million euros of projects. The current list of works is mostly in 11 countries as can
be seen in the table below with Brasil, Saudi Arabia and France in the top 3. The main projects are:
• In Brazil, the Transcarioca Bridges and Tomorrow’s Museum in Rio de Janeiro, and the Arena Amazônia stadium in Manaus
• In Saudi Arabia, the King Abdullah Financial City in Riyadh, and the Stadium of King Abdullah Sports City in Jeddah
• In Portugal, we highlight the ships under construction in Navalria
• In the UK, the spotlight goes to Scotland’s National Arena and Birmingham New Street Station
BACKLOG BY GEOGRAPHY
COUNTRY VALUE (M€) %
Brasil 90.0 29%
Saudi Arabia 61.4 20%
France 46.0 15%
Angola 30.0 10%
United Kingdom 23.4 8%
Portugal 22.0 7%
Spain 14.9 5%
Romania 8.8 3%
Poland 4.0 1%
Australia 3.4 1%
Peru 3.0 1%
TOTAL 307

1Q 2013 REPORT PAGE 17
RESULTS
Metallic Construction Revenues achieved 66.3 million euro in the 1Q 2013, corresponding to a growth of 8.4 % YoY, despite the difficulties across the sector particularly in Europe. The shift of weight from Iberia to Brazil in the Operating Revenues explains the opposite trend in Revenues. In other words, the effort made in the last three years to focus on countries with positive growth rates and strong infrastructures plans is starting to bear fruit. These strategic moves obviously still have a marked negative impact, partly reflected in the cost structure. The EBITDA in the 1Q 2013 was -1.0, which compares with 4.1 million euro in the 1Q 2012; the difference is in part explained by
the losses reported of approximately 4.5 million euro in Australia, which was related with the restructuring taking place and the
negative margin accounted in some of the works.
Net Financial Expenses in the 1Q 2013 had an increase of 4.2 % to the 3.4 million euro.
Net Profit totalled -7.5 million euro, of which 0.1 million euro attributable to non-controlling interests in Martifer Angola.
Net Financial Debt in Metallic Constructions at 31st March 2013 reached the 122 million euro, more 2 million euro than FY 2012. Of
the total Net Debt, 27 million euro is allocated to projects in the Retail area, not considered core business, and set to be sold in the future. Total CAPEX at the 1Q 2013 reached 2.2 million euro mostly of it applied in the maintenance investment in machinery and facilities.
METALLIC CONSTRUCTION 1Q2013 1Q2012 VAR. %
M€
Revenues 66.3 61.2 8.4%
EBITDA -1.0 4.1 n.m.
EBITDA Margin -1.6% 6.6% -8.2 pp
EBIT -3.0 1.9 n.m.
EBIT Margin -4.5% 3.1% -7.6 pp
Net Financial Expenses 3.4 3.3 4.2%
Income tax 1.1 0.6 97.7%
Results from assets held for sale 0.0 0.0 n.m.
Net Profit -7.5 -1.9 <-100%
Attributable to non-controlling interests 0.1 0.1 43.0%
Attributable to shareholders -7.7 -2.0 <-100%

PAGE 18 1Q 2013 REPORT
SOLAR
SECTOR TRENDS
− According to Bloomberg New Energy Finance (BNEF) the PV sector in the 1Q 2013, margins remain under pressure and
at unsustainable negative levels for the PV Manufacturer.
− Nevertheless BNEF estimates that 2013 will be better than 2012 as demand is strong and prices are expected to stabilise.
− Demand in the 1Q 2013 was stronger than expected, with UK and Greece surprisingly strong.
− BNEF revised expectations upwards for 2013 with the median scenario now on the 36.46 GW new build.
− Japan and China are now the main drivers in Demand.
− Global oversupply of all components continues. According to BNEF there may be some light at the end of the tunnel in the
2014-15, as consolidation reduces overcapacity and production stabilises while demand rises.
− 1Q 2013 was a fairly quiet for institutional finance for solar projects and companies, with about $5.2 bn invested worldwide,
mostly in the large PV assets.
ACTIVITY
The backlog of turnkey contracts is currently 243 million euro, with Mexico, United Kingdom, Portugal and USA with the higher weight.
BACKLOG BY GEOGRAPHY
COUNTRY VALUE (M€)
Mexico 81.5
United Kingdom 31.6
Portugal 18.7
USA 17.7
Canada 17.4
Ukraine 14.8
France 12.0
Romania 7.0
Greece 5.9
Spain 4.3
Brazil 4.0
Italy 3.4
India 0.4
Belgium 0.17
Other 24.13
TOTAL 243

1Q 2013 REPORT PAGE 19
RESULTS
In 1Q 2013 Solar Revenues increased by 14.6 % totalling 58.8 million euro. This performance was already expected. Looking at the
Revenues Breakdown the markets with the higher contribution were: Mexico, Portugal, Italy, United Kingdom, and USA.
The EBITDA in the solar in the 1Q 2013 totalled 1.4 million euro, with the margin 7.1 p.p. bellow the margin reported in 1Q 2012.
This is, EBTDA level was mostly negatively affected by the performance in the USA, which presented a negative EBITDA of 2.9 million
euro. Meanwhile since the beginning of 2013 that is running a plan with several measures under way such as the control of the business
at 100%, change in the management and the implementation of a new operational and strategic plan.
Net Financial Expenses dropped by 37 % in the 1Q 2013 related with the 1Q 2012, to 1.3 million euro.
Net Profit in the 1Q 2013 totalled 0.2 million euro, less 77 % compared with same period last year.
CAPEX in the 1Q 2013 was 1.8 million euro. This value is explained by the investment in project development, mostly in Italy
(1.3 million euro)
Net Debt in the 1Q 2013 was stable at 62 million euro, compared with the end of the 2012.
SOLAR 1Q2013 1Q2012 VAR. %
M€
Revenues 58.8 51.3 14.6%
EBITDA 1.4 4.9 -71.6%
EBITDA Margin 2% 9% -7.1 pp
EBIT 0.3 4.1 -91.8%
EBIT Margin 0.6% 7.9% -7.3 pp
Net Financial Expenses 1.3 2.0 -37.0%
Income tax -1.2 1.1 n.m.
Net Profit 0.2 1.0 -77.0%
Attributable to non-controlling interests -0.3 -0.4 31.0%
Attributable to shareholders 0.5 1.4 -64.0%

PAGE 20 1Q 2013 REPORT
RE DEVELOPER
RESULTS
RE Developer’s Operating Revenues reached 3.8 million euro in the 1Q 2013, what represents a growth of 10.4 % YoY; Explained
by the beginning of operations of the wind farm in Romania (Babadag).
Currently, the company has 64 MW of wind farms and solar parks in operation and with contribution to the total revenues.
EBITDA in the 1Q 2013 reached 2.5 million euros in the 1Q 2013, showing an improvement of 49.7 % YoY; it represents a margin
of 67 % compared with 49 % at the 1Q12.
Net Profit registered in the 1Q 2013 was positive at 0.4 million euros compared with the 0.5 Net Loss in the 1Q 2012.
CAPEX in the reported period was 0.7 million euro, already adjusted by the value of the wind project in Poland (Wiatrowa), as this
was already classified as an asset held for sale.
Net Debt at 31st March 2013 was 40.8 million euro, already adjusted from the value invested in Wiatrowa of 11.7 million euro.
RE DEVELOPER 1Q2013 1Q2012 VAR. %
M€
Revenues 3.8 3.4 10.4%
EBITDA 2.5 1.7 49.7%
EBITDA Margin 66.6% 49.1% 17.5 pp
EBIT 0.5 0.2 >100%
EBIT Margin 13.7% 5.5% 8.2 pp
Net Financial Expenses 0.1 0.6 -84%
Income tax 0.0 0.1 -99%
Net Profit 0.4 -0.5 s.s.
Attributable to non-controlling interests 0.1 0.1 -5%
Attributable to shareholders 0.3 -0.6 s.s.

04 SHARE
PERFORMANCE

PAGE 22 1Q 2013 REPORT
04 | SHARE PRICE PERFORMANCE
SHARE PERFORMANCE | since 2011
Source: Reuters
In the 1Q 2013 all the main stock indexes registered slight positive performances. The quarter was booked by several events, as in
March the Cyprus’ Bailout, Political instability in Italy, which made Fitch to downgrade the country rating, and in Portugal was
concluded the 7th troika assessment, with the downwards revision on the economic growth for the country: -2.3 % GDP in 2013 and
+0.6 % GDP in 2014 (versus the previous estimates of -1 % in 2013 and +0.8 % in 2014).
Martifer’s share price performance had a 16 % positive performance in the 1Q 2013, above the PSI-20, the major Euronext Lisbon
market index that had a valorization of 6.7 %.
Martifer’s share price ended the 1Q 2013 at 0.64 €/share. The highest price achieved was 0.82 €/share and the lowest price was 0.57
€/share. The daily average volume of stock traded during the 1Q 2013 was 39,984 which mean a significant increase compared with
the average volume in 1Q 2012 of 12,983 shares daily average.
Overall, Martifer’s market capitalization totalled 64 million euro at the end of the first quarter period of 2013.
0
20
40
60
80
100
120
01-2
011
02-2
011
03-2
011
04-2
011
05-2
011
06-2
011
07-2
011
08-2
011
09-2
011
10-2
011
11-2
011
12-2
011
01-2
012
02-2
012
03-2
012
04-2
012
05-2
012
06-2
012
07-2
012
08-2
012
09-2
012
10-2
012
11-2
012
12-2
012
01-2
013
02-2
013
03-2
013
Martifer PSI20 Index

INTERIM CONSOLIDATED
FINANCIAL INFORMATION

PAGE 24 1Q2013 REPORT
05 INTERIM
CONSOLIDATED FINANCIAL
STATEMENTS

PAGE 26 1Q2013 REPORT
05 | INTERIM CONSOLIDATED FINANCIAL STATEMENTS
CONSOLIDATED INCOME STATEMENTS FOR THE QUARTERS ENDED 31 MARCH 2013
AND 31 MARCH 2012 (Amounts expressed in Euro)
(Translation of consolidated financial statements originally issued in Portuguese - note 38)
NOTES
3M’ 2013 (NON AUDITED)
3M’ 2012 (NON AUDITED)
Sales and services rendered 3 and 4 126,279,990 111,062,342
Other income 5 1,701,302 1,173,024
Cost of goods sold 6 (48,330,282) (49,230,107)
Subcontractors 6 (38,255,801) (22,159,227)
Gross profit 41,395,209 40,846,032
External supplies and services 7 (17,399,470) (17,354,331)
Staff costs 8 (20,570,677) (20,781,832)
Other operational gains and losses 9 (803,540) 7,582,366
2,621,522 10,292,235
Amortizations 3, 16 and 17 (4,462,855) (4,529,638)
Impairment losses 10 (621,068) (410,222)
Provisions 10 and 30 (396,616) -
Operating income (2,859,017) 5,352,375
Financial income 11 3,667,979 6,492,947
Financial expenses 11 (11,094,812) (14,289,652)
Gains / (losses) on associate companies and joint arrangements 12 (3,761,270) (410,291)
Profit before tax (14.047.121) (2.854.621)
Income tax 13 21,689 (1,700,476)
Profit after tax (14,025,432) (4,555,097)
Earnings of the assets as held for sale 26 158,086 (2,152)
Attributable to:
non-controlling interests - -
owners of Martifer 158,086 (2,152)
Profit for the year (13,867,346) (4,557,249)
Attributable to:
non-controlling interests 287,823 141,300
owners of Martifer (14,155,169) (4,698,549)
Earnings per share:
Basic 14 (0.1448) (0.0479)
from continuing operations (0.1464) (0.0479)
from Assets held for sale 0.0016 -
Diluted 14 (0.1448) (0.0479)
from continuing operations (0.1464) (0.0479)
from Assets held for sale 0.0016 -
The accompanying notes are part of these financial statements

1Q2013 REPORT PAGE 27
CONSOLIDATED STATEMENTS OF COMPREHENSIVE INCOME FOR THE QUARTERS
ENDED 31 MARCH 2013 AND 31 MARCH 2012
(Amounts expressed in Euro)
(Translation of consolidated financial statements originally issued in Portuguese - note 38)
3M’ 2013
(NON AUDITED)
3M’ 2012 (NON
AUDITED)
Profit for the year (13,867,346) (4,557,249)
Fair value of cash flow hedges (derivatives), net of tax 493,090 (5,660)
Fair value of available for sale financial assets, net of tax - -
Exchange differences arising on (i) translating foreign operations; (ii) net investment in subsidiaries and (iii) goodwill (98,084) 1,074,943
Gains on revaluation of tangible fixed assets, net of tax - -
Income recognized directly in equity 395,006 1,069,283
Total comprehensive income for the period (13,472,340) (3,487,966)
Attributable to:
non-controlling interests 348,482 219,817
owners of Martifer (13,820,821) (3,707,783)
The accompanying notes are part of these financial statements

PAGE 28 1Q2013 REPORT
CONSOLIDATED STATEMENTS OF FINANCIAL POSITION AT 31 MARCH 2013 AND 31 DECEMBER 2012
(Amounts expressed in Euro)
(Translation of consolidated financial statements originally issued in Portuguese - note 38)
NOTES 31 MARCH 2013 (NON AUDITED)
31 DECEMBER 2012 (AUDITED)
ASSETS
Non-current assets
Goodwill 15 19,287,831 18,947,967
Intangible assets 16 10,249,166 39,441,872
Tangible assets 17 266,439,845 273,367,524
Investment property 18 16,217,257 16,206,768
Financial assets under the equity method 19 14,730,200 15,680,011
Available for sale investments 20 2,635,759 2,310,267
Other non-current receivables 22 139,040,869 140,174,902
Deferred tax assets 13,821,915 13,343,738
482,422,842 519,473,049
Current assets
Inventories 21 68,072,411 24,392,062
Trade receivables 22 156,949,731 150,357,128
Other receivables 22 60,147,968 62,272,521
Income tax 23 2,425,926 2,692,473
Current tax assets 23 21,400,825 18,337,239
Other current assets 24 138,142,223 125,718,650
Cash and cash equivalents 25 33,017,868 38,024,569
Assets held for sale 26 41,963,183 35,107,509
522,120,134 456,902,151
Total assets 1,004,542,976 976,375,200
EQUITY
Issued capital 27 50,000,000 50,000,000
Share premium 186,500,000 186,500,000
Treasury stock (2,868,519) (2,868,519)
Reserves (56,539,872) (1,499,182)
Profit for the year (14,155,169) (55,852,988)
Equity attributable to owners of Martifer 162,936,440 176,279,311
Non-controlling interests 27 52,975,165 50,975,912
Non-controlling interests attributable to Assets held for sale - -
Total equity 27 215,911,605 227,255,223
LIABILITIES
Non-current liabilities
Borrowings 28 152,315,164 164,900,867
Obligation under finance leases 11,814,515 12,169,176
Other non-current liabilities 29 23,054,305 22,068,545
Provisions 30 13,139,316 12,520,693
Deferred tax liabilities 3,626,116 3,583,895
203,949,416 215,243,176
Current liabilities
Borrowings 28 245,387,817 229,030,832
Obligation under finance leases 8,174,500 8,586,378
Trade payables 29 164,244,406 165,013,219
Other payables 29 58,046,885 50,500,917
Income tax 31 4,534,272 3,623,443
Current tax liabilities 31 14,509,877 16,596,598
Other current liabilities 32 70,855,063 50,489,688
Derivatives 724,279 510,804
Liabilities related with Assets held for sale 26 18,204,856 9,524,921
584,681,955 533,876,801
Total liabilities 788,631,371 749,119,977
Total equity and liabilities 1,004,542,976 976,375,200
The accompanying notes are part of these financial statements

PAGE 29 1Q2013 REPORT
CONSOLIDATED STATEMENTS OF CHANGES IN EQUITY FOR THE QUARTERS ENDED 31 MARCH 2013 AND 31 MARCH 2012
(Amounts expressed in Euro)
(Translation of consolidated financial statements originally issued in Portuguese - note 38)
FAIR VALUE RESERVES
ISSUED CAPITAL
TREASURY STOCK
SHARE PREMIUM
REVALUATION OF FIXED
ASSETS
AVAILABLE FOR SALE
INVESTMENS
CASH FLOW HEDGE
DERIVATIVES
FOREIGN CURRENCY
TRANSLATION RESERVES
STOCK OPTIONS
RESERVES
OTHER RESERVES
NET PROFIT OF THE YEAR
EQUITY ATTRIBUTABLE TO OWNERS OF
THE PARENT
NON-CONTROLLING
INTERESTS TOTAL EQUITY
Balance at 1 January 2012 50,000,000 (2,415,630) 186,500,000 - - (289,985) (19,563,611) 198,979 69,908,833 (48,587,256) 235,751,330 31,783,623 267,534,953
Appropriation of the profit of 2011 - - - - - - - - (48,587,256) 48,587,256 - - -
Comprehensive income for the year: - -
Profit for the year - - - - - - - - - (4,698,549) (4,698,549) 141,300 (4,557,249)
Exchange differences arising on (i) translating foreign operations and (ii) net investment in subsidiaries
- - - - - - 871,983 - - - 871,983 85,336 957,318
Exchange differences arising on goodwill - - - - - - 117,583 - - - 117,583 42 117,625
Other changes in equity of subsidiaries - - - - - 1,200 - - - - 1,200 (6,860) (5,660)
Total comprehensive income for the year - - - - - 1,200 989,566 - - (4,698,549) (3,707,783) 219,817 (3,487,966)
Acquisition of treasury stock - (407,279) - - - - - - - - (407,279) - (407,279)
Stock options - - - - - - - - - - - - -
Other changes in equity of subsidiaries - - - - - - - - (863,858) - (863,858) 302,904 (560,954)
Changes in the consolidation perimeter - - - - - - - - - - - - -
Non-controlling interests transactions - - - - - - - - (692,811) - (692,811) (191,126) (883,937)
Balance at 31 March 2012 50,000,000 (2,822,909) 186,500,000 - - (288,785) (18,574,045) 198,979 19,764,907 (4,698,549) 230,079,598 32,115,219 262,194,816
Balance at 1 January 2013 50,000,000 (2,868,519) 186,500,000 - - (902,433) (18,903,670) - 18,306,920 (55,852,988) 176,279,310 50,975,912 227,255,223
Appropriation of the profit of 2012 - - - - - - - - (55,852,988) 55,852,988 - - -
Comprehensive income for the year:
Profit for the year (14,155,169) (14,155,169) 287,823 (13,867,346)
Exchange differences arising on (i) translating foreign operations and (ii) net investment in subsidiaries
- - - - - - (484,462) - - - (484,462) 32,135 (452,327)
Exchange differences arising on goodwill - - - - - - 346,975 - - - 346,975 7,269 354,243
Other changes in equity of subsidiaries - - - - - 471,835 - - 471,835 21,255 493,090
Total comprehensive income for the year - - - - - 471,835 (137,487) - - (14,155,169) (13,820,821) 348,482 (13,472,340)
Acquisition of treasury stock - - - - - - - - - - - - -
Stock options - - - - - - - - - - - - -
Other changes in equity of subsidiaries - - - - - - - - 1,454,215 - 1,454,215 1,798,347 3,252,562
Changes in the consolidation perimeter - - - - - - - - (41,915) - (41,915) (75,706) (117,621)
Non-controlling interests transactions - - - - - - - - (934,350) - (934,350) (71,870) (1,006,219)
Balance at 31 March 2013 50,000,000 (2,868,519) 186,500,000 - - (430,598) (19,041,158) (37,068,117) (14,155,169) 162,936,440 52,975,165 215,911,605
The accompanying notes are part of these financial statements

PAGE 30 1Q2013 REPORT
CONSOLIDATED STATEMENTS OF CASH FLOWS FOR THE QUARTERS ENDED 31 MARCH
2013 AND 31 MARCH 2012 (Amounts expressed in Euro)
(Translation of consolidated financial statements originally issued in Portuguese - note 38)
3M’ 2013
(NON AUDITED) 3M’ 2012
(NON AUDITED)
OPERATING ACTIVITIES
Receipts from customers 154,257,566 156,992,976
Payments to suppliers (131,893,836) (129,463,256)
Payments to employees (19,575,072) (19,665,495)
Cash generated from operations 2,788,658 7,864,225
Income tax paid 737,446 (544,159)
Other receipts/(payments) relating to operating activities 660,151 (5,207,442)
Cash generated from other operating activities 1,397,596 (5,751,600)
Net cash generated by operating activities (1) 4,186,255 2,112,624
INVESTING ACTIVITIES
Receipts arising from:
Financial assets 137,780 -
Tangible assets 783,743 409,093
Intangible assets 2,164 411,512
Investment grants - -
Interest and similar income 656,929 1,238,807
Dividends - -
Others 61,859 408,500
1,642,475 2,467,912
Payments arising from:
Financial assets (500,000) (883,937)
Tangible assets (2,926,165) (7,418,236)
Intangible assets (4,638,929) (4,210,234)
Others (1,598) (5,000)
(8,066,692) (12,517,407)
Net cash generated by investing activities (2) (6,424,218) (10,049,495)
FINANCING ACTIVITIES
Receipts arising from:
Borrowings 91,532,067 75,190,448
Issue of equity shares, supplementary capital and share premiums - -
Grants and donations - 16,043
Others 504,324 258,196
92,036,391 75,464,687
Payments arising from:
Borrowings (87,760,785) (83,256,225)
Leasings (766,539) (1,549,805)
Interest and similar costs (5,263,207) (6,360,912)
Dividends - -
Acquisition of treasury stock - (2,822,909)
Others (534,913) (271,480)
(94,325,444) (94,261,331)
Net cash generated by financing activities (3) (2,289,053) (18,796,644)
Net increase in cash and cash equivalents (4)=(1)+(2)+(3) (4,527,016) (26,733,515)
Changes in the consolidation perimeter and others (453,779) (20,902,522)
Effect of foreign exchange currencies (25,906) (470,242)
Cash and cash equivalents at the beginning of the year 38,024,569 77,886,483
Cash and cash equivalents at the end of the year 33,017,868 29,780,204
The accompanying notes are part of these financial statements

06 NOTES TO INTERIM
CONSOLIDATED FINANCIAL
STATEMENTS

PAGE 32 1Q2013 REPORT
06 | NOTES TO INTERIM CONSOLIDATED
FINANCIAL STATEMENTS
INTRODUCTORY NOTE
Martifer SGPS, S.A., with its head-office at Zona Industrial, Apartado 17, Oliveira de Frades – Portugal (‘Martifer SGPS’ or ‘the
Company’), and its group of companies (‘Group’), have as its main activity the construction of steel infrastructures and solar activity
- which focuses on the development of photovoltaic projects, the installation of turnkey photovoltaic parks or under the EPC and the
development of architectural integration projects and microgeneration. They also have other activities which highlight the promotion
and development of renewable energy projects (Note 3).
Martifer SGPS was incorporated on 29 October 2004, its share capital having been realized through the delivery of shares, valued
at its market value, that the shareholders held in Martifer - Construções, S.A., a company that was incorporated in 1990 and which,
at that time, was the holding company of the current Martifer Group.
As of June 2007, after the initial public offering Martifer SGPS, S.A. shares have been listed on Euronext Lisbon.
At 31 March 2013, the Group has developed its activity in Portugal, Spain, Poland, Slovakia, Romania, Czech Republic, Angola,
Brazil, Greece, United States of America, Australia, Mozambique, Ireland, Italy, Belgium, Bulgaria, Netherlands, France, Morocco,
United Kingdom, Canada, Mexico, Saudi Arabia, Germany, Chile, Ecuador, Ukraine, Turkey, Senegal, Singapore and India.
The accompanying notes were selected to help the understanding of the more significant changes in the financial position and the
financial performance of the Group since the last annual reporting, dated of 31 December 2012.
All the amounts presented in these notes are expressed in Euros (rounded at unit), unless otherwise stated.
These consolidated financial statements are not audited.
1. SIGNIFICANT ACCOUNTING POLICIES
BASIS OF PREPARATION
These accompanying consolidated financial statements relate to the consolidated financial statements of the Martifer Group and
were prepared in accordance with the International Financial Reporting Standards (“IFRS”), as adopted by the European Union, in
force at the beginning of the economic period started 1 January 2013. These are the International Financial Reporting Standards,
issued by the International Accounting Standards Board ("IASB"), and interpretations issued by the International Financial
Reporting Interpretations Committee ("IFRIC") or by the previous Standing Interpretations Committee ("SIC"), that have been
endorsed by the European Union.
The interim consolidated financial report for the period ended at 31 March 2013 has been prepared in accordance with IAS 34 -
‘Interim Financial Reporting’ as adopted by the European Union.
These consolidated financial statements have been prepared on a going concern basis from the books and accounting records of
the companies included in the consolidation (Note 2) and have been prepared under the historical cost convention, except for the
revaluation of certain financial instruments, which are stated at fair value.
The accounting policies adopted are consistent with those considered in the financial statements for the year ended as of 31
December 2012 and disclosed in the corresponding notes. During the quarter ended in 31 March 2013 there were not
ammendments or new International Financial Reporting Standards (IFRS) and/or Interpretations issued or entering into force.
The consolidated financial statements were presented in Euros since this is the main currency of the Group’s operations.
In the preparation of the consolidated financial statements, in accordance with the IAS/IFRS, the Group’s Board of Directors
adopted certain assumptions and estimations that affect the assets and liabilities reported, as well as the profits and losses incurred

1Q2013 REPORT PAGE 33
related to the reported periods. All the estimations and assumptions of the Board of Directors were performed taking into
consideration the best knowledge available at the financial statements approval date of the events and the dealings in progress.
2. GROUP COMPANIES INCLUDED IN THE CONSOLIDATED FINANCIAL
STATEMENTS
Group companies included in the consolidated financial statements, their consolidation methods, head offices and percentage of
share capital held by the Group, at 31 March 2013 are as follows:
COMPANIES CONSOLIDATED THROUGH THE FULL CONSOLIDATION METHOD
PERCENTAGE OF SHARE CAPITAL HELD
COMPANY HEAD OFFICE DESIGNATION DIRECTLY INDIRECTLY TOTAL
Martifer SGPS, S.A. Oliveira de Frades Martifer SGPS Holding
Martifer Inovação e Gestão, S.A. Oliveira de Frades Martifer Inovação 100.00% - 100.00%
Martifer Gestiune Si Servicii, S.R.L. Bucharest Martifer Inovação Roménia 100.00% - 100.00%
Martifer Metallic Constructions SGPS, S.A. Oliveira de Frades Martifer Metallic Constructions 100.00% - 100.00%
Martifer - Construções Metalomecânicas, S.A. Oliveira de Frades Martifer Construções - 100.00% 100.00%
Martifer Mota-Engil Coffey Construction Joint Venture Limited
Dublin MMECC - 60.00% 60.00%
Martifer – Construcciones Metálicas España, S.A. Madrid Martifer Espanha - 100.00% 100.00%
Martifer – Construções Metálicas Angola, S.A. Luanda Martifer Angola - 78.75% 78.75%
Martifer Construction Limited Dublin Martifer Irlanda - 100.00% 100.00%
Martifer Polska Sp. Zo.o. Gliwice Martifer Polska - 100.00% 100.00%
Martifer Constructions, SAS Rungis Martifer França - 100.00% 100.00%
Martifer Constructii SRL Bucharest Martifer Constructii - 100.00% 100.00%
Park Logistyczny Biskupice Gliwice Biskupice - 100.00% 100.00%
Martifer Konstrukcje Sp. Z o.o. Gliwice Martifer Konstrukcje - 100.00% 100.00%
Martifer Slovakia S.R.O. Bratislava Martifer Slovakia - 100.00% 100.00%
Sociedade de Madeiras do Vouga, S.A. Albergaria-a-Velha Madeiras do Vouga - 100.00% 100.00%
Martifer - Gestão de Investimentos, S.A. Oliveira de Frades MGI - 100.00% 100.00%
Nagatel Viseu, Promoção Imobiliária, S.A. Oliveira de Frades Nagatel Viseu - 100.00% 100.00%
Martifer Retail & Warehousing Angola, S.A. Luanda Martifer Retail Angola - 100.00% 100.00%
Martifer - Alumínios, S.A. Oliveira de Frades Martifer Alumínios - 100.00% 100.00%
Martifer Alumínios Angola, S.A. Luanda Martifer Alumínios Angola - 100.00% 100.00%
Martifer Aluminium Pty, Ltd Sidney Sassall - 100.00% 100.00%
Martifer Aluminium Limited Dublin Martifer Aluminium Irlanda - 100.00% 100.00%
Martifer Aluminium UK Limited London Martifer Aluminium Reino Unido - 100.00% 100.00%
Martifer Aluminium SAS Rungis Martifer Aluminium França - 100.00% 100.00%
Martifer UK Limited London Martifer UK - 100.00% 100.00%
MT Construction Maroc, S.A.R.L. Tânger Martifer Marrocos - 100.00% 100.00%
Martifer - Construções Metálicas, Ltda. Fortaleza Martifer Brasil - 99.80% 99.80%
Saudi Martifer Constructions LLC Riyadh Martifer Arábia Saudita - 100.00% 100.00%
Martifer Beteiligungsverwaltungs GmbH Wien Martifer GmbH 100.00% - 100.00%
M City Gliwice Sp. Zo.o Gliwice M City Gliwice - 100.00% 100.00%
Martifer Energy Systems SGPS, S.A. Oliveira de Frades Martifer Energy Systems 100.00% - 100.00%
Martifer Energia S.R.L. Bucharest Martifer Energia Roménia - 100.00% 100.00%
Martifer Energia LLC Kiev Martifer Energia Ucrânia - 100.00% 100.00%
Martifer Wind Energy Systems LLC San Angelo TX Martifer Wind USA - 100.00% 100.00%
Martifer Energy Systems PTY Cape Town Martifer Energia África do Sul - 85.00% 85.00%
Navalria – Docas, Construções e Reparações Navais, S.A.
Aveiro Navalria - 100.00% 100.00%
Gebox, S.A. Ílhavo Gebox - 100.00% 100.00%
Martifer Global SGPS, S.A. Oliveira de Frades Martifer Global 100.00% - 100.00%
Martifer Construcciones Peru, S.A. Lima Martifer Peru - 100.00% 100.00%

PAGE 34 1Q2013 REPORT
PERCENTAGE OF SHARE CAPITAL HELD
COMPANY HEAD OFFICE DESIGNATION DIRECTLY INDIRECTLY TOTAL
Martifer Solar SGPS, S.A. Oliveira de Frades Martifer Solar SGPS 100.00% - 100.00%
Martifer Solar, S.A. Oliveira de Frades Martifer Solar - 55.00% 55.00%
Martifer Solar Sistemas Solares, S.A. Madrid Martifer Solar Sistemas Solares - 55.00% 55.00%
Solar Parks Construccion Parques Solares ETVE, S.A.
Madrid Solar Parks - 55.00% 55.00%
Parque Solar Seseña III, S.L. Madrid Seseña III - 55.00% 55.00%
MTS Solar Sistemas Solares, S.A. Mexico city Martifer Solar México - 54.45% 54.45%
Martifer Solar Chile Holding, Lda Santiago do Chile Martifer Solar Chile - 55.00% 55.00%
Martifer Solar Chile Operaciones Limitada Santiago do Chile Solar Chile Operaciones - 55.00% 55.00%
Martifer Solar Sistemas Solares Equador S.A. Sangolquí Martifer Solar Equador - 54.45% 54.45%
Martifer Solar S.R.L. Milan Martifer Solar Itália - 55.00% 55.00%
MTS1 S.R.L. Syracuse MTS1 - 55.00% 55.00%
MTS2 S.R.L. Syracuse MTS2 - 55.00% 55.00%
MTS3 S.R.L. Syracuse MTS3 - 55.00% 55.00%
MTS4 S.R.L. Syracuse MTS4 - 55.00% 55.00%
Martifer Solar RO S.R.L. Bucharest Martifer Solar Roménia - 55.00% 55.00%
Martifer Solar Inc. S. Francisco CA Martifer Inc. - 55.00% 55.00%
Martifer Solar USA, Inc. Santa Monica CA AEM 1) - 34.93% 34.93%
Martifer Aurora Solar, LLC Santa Monica CA Solar Aurora 1) - 34.58% 34.58%
MT Silverado Fund LLC S. Francisco CA Silverado 1) - 31.42% 31.42%
Martifer Solar Finance LLC S. Francisco CA Martifer Solar Finance - 55.00% 55.00%
Martifer Solar Hellas, A.T.E. Athens PVI 1) - 39.13% 39.13%
Martifer Solar Angola Luanda Martifer Solar Angola 1) - 41.25% 41.25%
Martifer Solar N.V. Deerlijk Martifer Solar Bélgica - 55.00% 55.00%
Martifer Solar UK Limited London Martifer Solar UK - 55.00% 55.00%
Martifer Solar S.A.S. Lyon Martifer Solar França - 55.00% 55.00%
Martifer Solar CZ Prague Martifer Solar República Checa - 55.00% 55.00%
Home Energy France SAS Lyon Home Energy França - 55.00% 55.00%
PVGlass, S.A. Oliveira de Frades PVGlass - 55.00% 55.00%
PVGlass S.r.l Milan PVGlass Itália - 55.00% 55.00%
MPrime Solar Solutions, S.A. Oliveira de Frades Mprime - 55.00% 55.00%
MPrime Italia S.r.l Oliveira de Frades MPrime Itália - 55.00% 55.00%
MPrime GMBH Munich MPrime GMBH - 55.00% 55.00%
Sol Cativante, Lda. Sever do Vouga Sol Cativante - 55.00% 55.00%
Sol Cativante VII, Lda. Viseu Sol Cativante VII - 55.00% 55.00%
Martifer Solar Investments, B.V. Amsterdam Martifer Solar Holanda - 55.00% 55.00%
Martifer Solar Canadá, Ltd. Toronto Martifer Solar Canadá - 55.00% 55.00%
MTS6 S.R.L. Syracuse MTS61) - 46.75% 46.75%
Martifer Solar SK s.r.o. Dolny Kubin Martifer Solar Eslováquia - 55.00% 55.00%
Ginosa Solar Farm, S.R.L. Rome Ginosa Solar Farm - 55.00% 55.00%
Solar Spritehood S.R.L Rome Solar Spritehood - 55.00% 55.00%
MTS7, S.R.L. Rome MTS7 - 55.00% 55.00%
Canopy - Naos Paris Canopy Naos - 55.00% 55.00%
MTS Trewidland Solar, Ltd London MTS Trewidland Solar - 55.00% 55.00%
Steadfast Fairview Solar, Ltd Andover Steadfast Fairview Solar - 55.00% 55.00%
Steadfast Molland Solar, Ltd Andover Steadfast Molland Solar - 55.00% 55.00%
Steadfast Apsley Solar, Ltd Andover Steadfast Apsley Solar - 55.00% 55.00%
Martifer Solar UA, LLC Kyiv Martifer Solar Ucrânia - 55.00% 55.00%
Inspira Martifer Solar Limited Mumbai Inspira Martifer Solar 1)
- 28.05% 28.05%
Societé Developpement Local SA Dakar Martifer Solar Senegal 1) - 28.05% 28.05%
Martimak Solar Besiktas Martimak1) - 44.00% 44.00%
Martiper Solar Besiktas Martiper1) - 44.00% 44.00%
Martifer Solar Singapura PTE. LTD. Singapura Martifer Solar Singapura - 55.00% 55.00%
EVIVA SOLAR 1 LTD Athens Eviva Solar 1 - 54.90% 54.90%
EVIVA SOLAR 2 LTD Athens Eviva Solar 2 - 54.90% 54.90%
Martifer Solar MZ, S.A. Maputo Martifer Solar Moçambique 1) - 28.05% 28.05%
Greencoverage Unipessoal, Lda. Oliveira de Frades Greencoverage - 55.00% 55.00%
Martifer Solar, Ltda Pindamonhangaba Martifer Solar Brasil - 54.45% 54.45%

1Q2013 REPORT PAGE 35
PERCENTAGE OF SHARE CAPITAL HELD
COMPANY HEAD OFFICE DESIGNATION DIRECTLY INDIRECTLY TOTAL
LRCC – La Rad Campo Charro – Energias Renováveis, Lda.
São Martinho do Porto
LRCC - 55.00% 55.00%
Inovsun, Lda. Oliveira de Frades Inovsun - 55.00% 55.00%
Martifer Renewables SGPS, S.A. Oliveira de Frades Martifer Renewables SGPS 100.00% - 100.00%
Martifer Renewables, S.A. Oliveira de Frades Martifer Renewables SA - 100.00% 100.00%
Martifer Renovables ETVE, S.A.U. Madrid Martifer Renovables - 100.00% 100.00%
Eurocab FV 1 S.L. Madrid Eurocab 1 - 100.00% 100.00%
Eurocab FV 2 S.L. Madrid Eurocab 2 - 100.00% 100.00%
Eurocab FV 3 S.L. Madrid Eurocab 3 - 100.00% 100.00%
Eurocab FV 4 S.L. Madrid Eurocab 4 - 100.00% 100.00%
Eurocab FV 5 S.L. Madrid Eurocab 5 - 100.00% 100.00%
Eurocab FV 6 S.L. Madrid Eurocab 6 - 100.00% 100.00%
Eurocab FV 7 S.L. Madrid Eurocab 7 - 100.00% 100.00%
Eurocab FV 8 S.L. Madrid Eurocab 8 - 100.00% 100.00%
Eurocab FV 9 S.L. Madrid Eurocab 9 - 100.00% 100.00%
Eurocab FV 10 S.L. Madrid Eurocab 10 - 100.00% 100.00%
Eurocab FV 11 S.L. Madrid Eurocab 11 - 100.00% 100.00%
Eurocab FV 12 S.L. Madrid Eurocab 12 - 100.00% 100.00%
Eurocab FV 13 S.L. Madrid Eurocab 13 - 100.00% 100.00%
Eurocab FV 14 S.L. Madrid Eurocab 14 - 100.00% 100.00%
Eurocab FV 15 S.L. Madrid Eurocab 15 - 100.00% 100.00%
Eurocab FV 16 S.L. Madrid Eurocab 16 - 100.00% 100.00%
Eurocab FV 17 S.L. Madrid Eurocab 17 - 100.00% 100.00%
Eurocab FV 18 S.L. Madrid Eurocab 18 - 100.00% 100.00%
Eurocab FV 19 S.L. Madrid Eurocab 19 - 100.00% 100.00%
Eviva Energy S.R.L. Bucharest Eviva Roménia - 100.00% 100.00%
Eviva Nalbant S.R.O. Bucharest Eviva Nalbant - 99.00% 99.00%
Eviva Agighiol S.R.L. Bucharest Eviva Agighiol - 99.00% 99.00%
Eviva Casimcea S.R.O. Bucharest Eviva Casimcea - 99.00% 99.00%
Premium Management Consulting, S.R.L. Bucharest Premium Management - 85.00% 85.00%
MW Topolog, S.R.L. Bucharest MW Topolog - 99.00% 99.00%
Martifer Renewables, S.A. Gliwice Eviva Polónia - 100.00% 100.00%
Martifer Renewables Pty, Ltd. Sidney Eviva Austrália - 100.00% 100.00%
Eviva Beteiligungsverwaltungs GmbH Wien Eviva GmbH - 100.00% 100.00%
Eviva Hidro S.R.L. Bucharest Eviva Hidro 1.00% 99.00% 100.00%
Martifer Deutschland GmbH Berlin Martifer Deutschland - 100.00% 100.00%
Wind Farm Odrzechowa Sp. Zo.o Gliwice Wind Odrzechowa - 100.00% 100.00%
Energia Wiatrowa Sp. Zo.o Gliwice Energia Wiatrowa 3)
- 100.00% 100.00%
Eviva Gizalki Sp. Zo.o Miastko Eviva Gizalki - 100.00% 100.00%
Wind Farm Bukowsko Sp. Zo.o Gliwice Wind Farm Bukowsko - 100.00% 100.00%
Wind Farm Markowa Sp. Zo.o Gliwice Wind Farm Markowa - 100.00% 100.00%
Wind Farm Lada Sp. Zo.o Gliwice Wind Farm Lada - 100.00% 100.00%
Wind Farm Jawornik Sp. Zo.o Gliwice Wind Farm Jawornik - 100.00% 100.00%
Wind Farm Piersno Sp. Zo.o Gliwice Wind Farm Piersno - 100.00% 100.00%
Wind Farm Oborniki Sp. Zo.o Gliwice Wind Farm Oborniki - 100.00% 100.00%
Martifer Renewables Brazil B.V. Amsterdam Renewables Holanda - 100.00% 100.00%
Vesto EAD Varna Vesto - 100.00% 100.00%
DVP1 Limited Varna DVP1 - 100.00% 100.00%
DVP2 Limited Varna DVP2 - 100.00% 100.00%
Martifer Renewables Investments ETVE, S.A. Madrid Eurocab 21 - 100.00% 100.00%
Martifer Renewables Italy BV Amsterdam Renewables Italy Holanda - 100.00% 100.00%
Martifer Renewables Brasil Participações LTDA Fortaleza Martifer Renewables Brasil - 100.00% 100.00%
Martifer Renováveis - Geração de Energia e Participações S.A.
Fortaleza Ventania - 55.00% 55.00%
Eólica Cajueiro da Praia, Ltda . Fortaleza Cajueiro - 55.00% 55.00%
Eólica Cacimbas, Ltda. Fortaleza Cacimbas - 55.00% 55.00%
SBER – Sociedade Brasileira de Energias Renováveis, Ltda.
Fortaleza SBER 1) - 41.25% 41.25%
Melosa – Geração de Energia e Participações, Ltda.
Fortaleza Melosa - 55.00% 55.00%

PAGE 36 1Q2013 REPORT
PERCENTAGE OF SHARE CAPITAL HELD
COMPANY HEAD OFFICE DESIGNATION DIRECTLY INDIRECTLY TOTAL
Eólica Paraipaba, Ltda . Fortaleza Paraipaba - 55.00% 55.00%
Eólica Chapadão, Ltda. Fortaleza Chapadão - 55.00% 55.00%
Rosa dos Ventos - Geração e Comercialização de Energia, S.A
Fortaleza Rosa dos Ventos - 53.63% 53.63%
Eólica Macaúbas, Ltda. Fortaleza Macaúbas - 54.99% 54.99%
Eólica Sobradinho, Ltda. Fortaleza Sobradinho - 54.99% 54.99%
Ventinveste Indústria SGPS, S.A. Oliveira de Frades Ventinveste Indústria 2) - 46.00% 46.00%
1) The full consolidation of these companies is justified as the Group has ultimate control.
2) The consolidation of this company through the full consolidation method results from shareholder agreements that regulate the control of the investee.
3) This company has been classified as Asset held for sale (Note 26).
COMPANIES CONSOLIDATED THROUGH THE EQUITY METHOD
PERCENTAGE OF SHARE CAPITAL HELD
COMPANY HEAD OFFICE DESIGNATION DIRECTLY INDIRECTLY TOTAL
Metallic Construction
Associate companies:
Liszki Green Park, Sp. Zo.o Gliwice Liszki Green Park - 45.00% 45.00%
Martifer Amal, S.A. Nacala Martifer Amal - 35.00% 35.00%
Jointly controlled companies:
Promoquatro – Investimentos Imobiliários, Lda. Oliveira de Frades Promoquatro - 50.00% 50.00%
M City Bialystok Sp. Zo.o Gliwice M City Bialystok - 50.00% 50.00%
M City Radom Sp. Zo.o Gliwice M City Radom - 50.00% 50.00%
M. City Szczecin Sp. Z o.o. Gliwice M City Szczecin - 50.00% 50.00% -
Solar
Associate companies:
Parque Solar Seseña I, S.L. Madrid Seseña I - 20.63% 20.63%
Canaverosa Renovables, SL Madrid Canaverosa - 26.94% 26.94%
Empresa de Energia Renovable Maria del Sol Norte S.A.
Santiago Maria del Sol - 26.95% 26.95%
Other
Associate companies:
Nutre SGPS, S.A. Oliveira de Frades Prio SGPS 49.00% - 49.00%
Nutre, S.A. Oliveira de Frades Prio Foods - 49.00% 49.00%
Nutre - Industrias Alimentares, S.A. Oliveira de Frades Prio Alimentar - 49.00% 49.00%
Nutre MZ. S.A. Maputo Nutre Moçambique - 49.00% 49.00%
Nutre Farming, S.R.L. Bucharest Nutre Farming Roménia - 49.00% 49.00%
Prio Agromart S.R.L. Bucharest Prio Agromart - 49.00% 49.00%
Prio Balta S.R.L. Bucharest Prio Balta - 49.00% 49.00%
Prio Facaieni S.R.L. Bucharest Prio Facaieni - 49.00% 49.00%
Prio Ialomita S.R.L. Bucharest Prio Ialomita - 49.00% 49.00%
Prio Rapita S.R.L. Bucharest Prio Rapita - 49.00% 49.00%
Nutre Farming West Part S.R.L. Bucharest Nutre West Part - 49.00% 49.00%
Prio Terra Agricola S.R.L. Bucharest Prio Terra Agricola - 49.00% 49.00%
Prio Turism Rural S.R.L Bucharest Prio Turism Rural - 49.00% 49.00%
Agromec Balaciu Bucharest Agromec Balaciu - 42.60% 42.60%
Miharox S.R.L. Bucharest Miharox - 40.47% 40.47%
Zimbrul. S.A. Bucharest Zimbrul - 49.00% 49.00%
Agrozootehnica. S.A. Bucharest Agrozootehnica - 48.98% 48.98%
Prio Agrotrans S.R.L. Bucharest Prio Agrotrans - 49.00% 49.00%
Prio Foods Brasil LTDA S. Luís do Maranhão
Prio Foods Brasil - 49.00% 49.00%
Prio Extractie S.R.L. Bucharest Prio Extractie - 22.05% 22.05%
Prio Agro Industries. Sp. Z o.o. Gliwice Prio Polónia - 49.00% 49.00%
1Q2013 REPORT PAGE 37
PERCENTAGE OF SHARE CAPITAL HELD
COMPANY HEAD OFFICE DESIGNATION DIRECTLY INDIRECTLY TOTAL
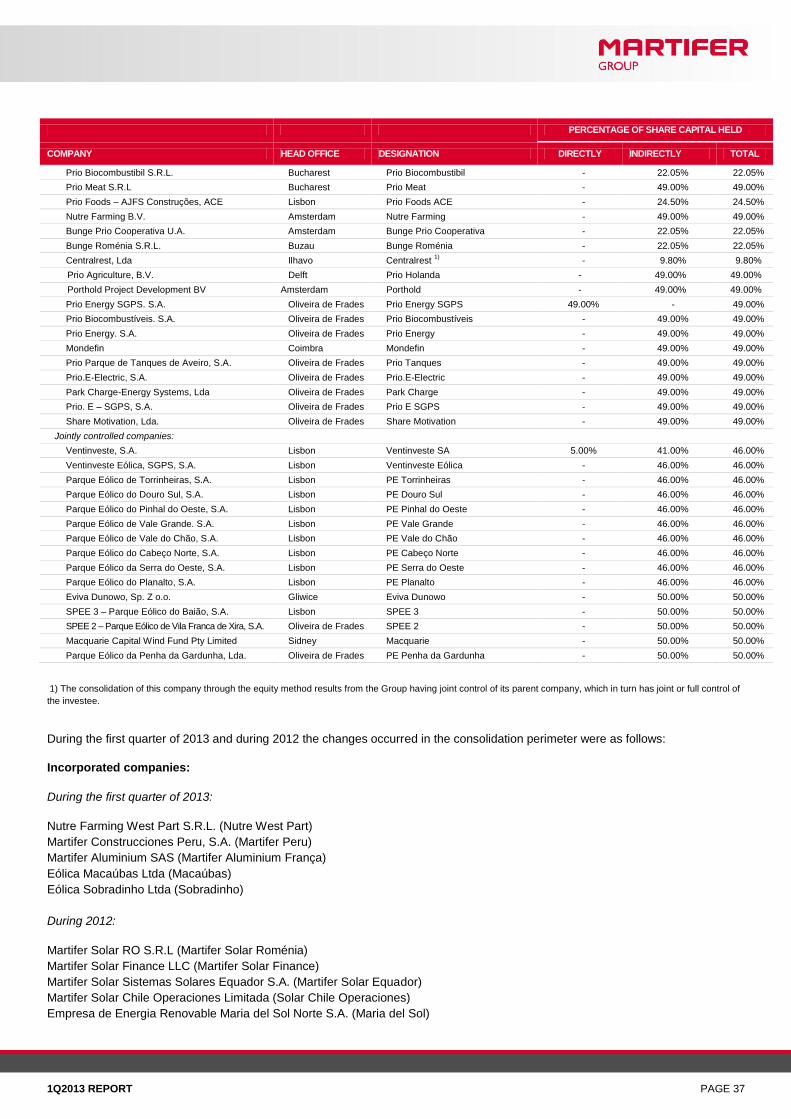
Prio Biocombustibil S.R.L. Bucharest Prio Biocombustibil - 22.05% 22.05%
Prio Meat S.R.L Bucharest Prio Meat - 49.00% 49.00%
Prio Foods – AJFS Construções, ACE Lisbon Prio Foods ACE - 24.50% 24.50%
Nutre Farming B.V. Amsterdam Nutre Farming - 49.00% 49.00%
Bunge Prio Cooperativa U.A. Amsterdam Bunge Prio Cooperativa - 22.05% 22.05%
Bunge Roménia S.R.L. Buzau Bunge Roménia - 22.05% 22.05%
Centralrest, Lda Ilhavo Centralrest 1)
- 9.80% 9.80%
Prio Agriculture, B.V. Delft Prio Holanda - 49.00% 49.00%
Porthold Project Development BV Amsterdam Porthold - 49.00% 49.00%
Prio Energy SGPS. S.A. Oliveira de Frades Prio Energy SGPS 49.00% - 49.00%
Prio Biocombustíveis. S.A. Oliveira de Frades Prio Biocombustíveis - 49.00% 49.00%
Prio Energy. S.A. Oliveira de Frades Prio Energy - 49.00% 49.00%
Mondefin Coimbra Mondefin - 49.00% 49.00%
Prio Parque de Tanques de Aveiro, S.A. Oliveira de Frades Prio Tanques - 49.00% 49.00%
Prio.E-Electric, S.A. Oliveira de Frades Prio.E-Electric - 49.00% 49.00%
Park Charge-Energy Systems, Lda Oliveira de Frades Park Charge - 49.00% 49.00%
Prio. E – SGPS, S.A. Oliveira de Frades Prio E SGPS - 49.00% 49.00%
Share Motivation, Lda. Oliveira de Frades Share Motivation - 49.00% 49.00%
Jointly controlled companies:
Ventinveste, S.A. Lisbon Ventinveste SA 5.00% 41.00% 46.00%
Ventinveste Eólica, SGPS, S.A. Lisbon Ventinveste Eólica - 46.00% 46.00%
Parque Eólico de Torrinheiras, S.A. Lisbon PE Torrinheiras - 46.00% 46.00%
Parque Eólico do Douro Sul, S.A. Lisbon PE Douro Sul - 46.00% 46.00%
Parque Eólico do Pinhal do Oeste, S.A. Lisbon PE Pinhal do Oeste - 46.00% 46.00%
Parque Eólico de Vale Grande. S.A. Lisbon PE Vale Grande - 46.00% 46.00%
Parque Eólico de Vale do Chão, S.A. Lisbon PE Vale do Chão - 46.00% 46.00%
Parque Eólico do Cabeço Norte, S.A. Lisbon PE Cabeço Norte - 46.00% 46.00%
Parque Eólico da Serra do Oeste, S.A. Lisbon PE Serra do Oeste - 46.00% 46.00%
Parque Eólico do Planalto, S.A. Lisbon PE Planalto - 46.00% 46.00%
Eviva Dunowo, Sp. Z o.o. Gliwice Eviva Dunowo - 50.00% 50.00%
SPEE 3 – Parque Eólico do Baião, S.A. Lisbon SPEE 3 - 50.00% 50.00%
SPEE 2 – Parque Eólico de Vila Franca de Xira, S.A. Oliveira de Frades SPEE 2 - 50.00% 50.00%
Macquarie Capital Wind Fund Pty Limited Sidney Macquarie - 50.00% 50.00%
Parque Eólico da Penha da Gardunha, Lda. Oliveira de Frades PE Penha da Gardunha - 50.00% 50.00%
1) The consolidation of this company through the equity method results from the Group having joint control of its parent company, which in turn has joint or full control of
the investee.
During the first quarter of 2013 and during 2012 the changes occurred in the consolidation perimeter were as follows:
Incorporated companies:
During the first quarter of 2013:
Nutre Farming West Part S.R.L. (Nutre West Part)
Martifer Construcciones Peru, S.A. (Martifer Peru)
Martifer Aluminium SAS (Martifer Aluminium França)
Eólica Macaúbas Ltda (Macaúbas)
Eólica Sobradinho Ltda (Sobradinho)
During 2012:
Martifer Solar RO S.R.L (Martifer Solar Roménia)
Martifer Solar Finance LLC (Martifer Solar Finance)
Martifer Solar Sistemas Solares Equador S.A. (Martifer Solar Equador)
Martifer Solar Chile Operaciones Limitada (Solar Chile Operaciones)
Empresa de Energia Renovable Maria del Sol Norte S.A. (Maria del Sol)

PAGE 38 1Q2013 REPORT
Nutre Farming B.V. (Nutre Farming)
Prio.E – SGPS, S.A. (Prio E SGPS)
Martifer Solar Chile Holding, Lda (Solar Chile)
Martifer Global SGPS, S.A. (Martifer Global)
Martifer Aluminium UK Limited (Martifer Aluminium UK)
MTS Trewidland Solar, Ltd (MTS Trewidland Solar)
MTS Trefinnick Solar, Ltd (MTS Trefinnick Solar)
MTS Hatchlands Solar, Ltd. (MTS Hatchlands Solar)
Martifer Solar UA, LLC (Martifer Solar Ucrânia)
Inspira Martifer Solar Limited (Inspira Martifer Solar)
Bunge Prio Cooperativa U.A. (Bunge Prio Cooperativa)
Martifer-Amal, S.A (Martifer Amal)
Martimak Solar Initiative Enerji Uretim Dagitim Sanayi Ve Ticaret Limited Sirketi (Martimak Solar)
Martiper Solar Initiative Enerji Uretim Dagitim Sanayi Ve Ticaret Limited Sirketi (Martiper Solar)
Societé Developpement Local SA (Solar Senegal)
Martifer Solar Singapura PTE. LTD. (Solar Singapura)
Sol Cativante VII, S.A. (Sol Cativante VII)
Eviva Solar 1 Ltd (Eviva Solar 1)
Eviva Solar 2 Ltd (Eviva Solar 2)
Acquired companies:
During 2012:
M. City Szczecin Sp. Z o.o. (M. City Szczecin)
LRCC – La Rad Campo Charro – Energias Renováveis, Lda. (LRCC)
Share Motivation – Inv. Imobiliários Unipessoal, Lda. (Share Motivation)
Magnum Cap Electrical Power, Lda. (Magnum Cap)
Martifer Solar, Ltda (Martifer Solar Brasil)
Steadfast Fairview Solar, Ltd (Steadfast Fairview Solar)
Steadfast Molland Solar, Ltd (Steadfast Molland Solar)
Steadfast Rudge Solar, Ltd (Steadfast Rudge Solar)
Steadfast Shipton Belinger Solar, Ltd (Steadfast Shipton Belinger Solar)
Steadfast Apsley Solar, Ltd (Steadfast Apsley Solar)
Bunge Roménia s.r.l. (Bunge Roménia)
Sol Cativante III, S.A. (Sol Cativante III)
Steadfast Parkhouse Solar Limited (Parkhouse)
Centralrest, Lda. (Centralrest)
Sold companies:
During the first quarter of 2013:
Martifer Renewables Bippen GmbH (Eviva Bippen)
Eviva Mepe (Eviva Grécia)
During 2012:
Eviva Energy SGPS, S.A. (Enerpetra)
Sol Cativante IV, S.A. (Sol Cativante IV)
Sol Cativante II, S.A. (Sol Cativante II)
Sol Cativante VI, Lda.(Sol Cativante VI)
Martifer – Hirschfeld Energy Systems LLC (Martifer – Hirschfeld Energy Systems)
Silverton Wind Farm Holding (Silverton Wind Farm)
Parque Solar Seseña II, S.L. (Parque Solar Seseña II)
Parque Solar Segovia, S.L. (Parque Solar Segovia)
Parque Solar Quintanar, S.L. (Parque Solar Quintanar)
Eurocab FV 20 S.L. (Eurocab FV 20)
Veiga & Seabra. S.A. (Veiga & Seabra)

1Q2013 REPORT PAGE 39
Parque Tecnologico do Tamega (PTT)
Proempar, S.A (Proempar)
MTS 5 (MTS5)
Magnum Cap, Lda. (Magnum Cap)
Sol Cativante III, S.A. (Sol Cativante III)
Sol Cativante V, S.A. (Sol Cativante V)
Steadfast Parkhouse Solar Limited (Parkhouse)
Steadfast Shipton Belinger Solar, Ltd (Steadfast Shipton Belinger Solar)
Steadfast Rudge Solar, Ltd (Steadfast Rudge Solar)
MTS Trefinnick Solar, Ltd (MTS Trefinnick Solar)
MTS Hatchlands Solar, Ltd. (MTS Hatchlands Solar)
Changes in the consolidation method:
During the first quarter of 2013:
Prio Agriculture B.V. (Prio Holanda) - from full consolidation method to equity method after its sale by Martifer Renewables SGPS,
S.A. to Nutre SGPS, S.A.
Porthold Project Development BV (Porthold) - from full consolidation method to equity method after the sale of Prio Agriculture B.V.
by Martifer Renewables SGPS, S.A. to Nutre SGPS, S.A.
In 2012:
Resun Developments, S.A. – In 2011 was consolidated through the full consolidation method. In 2012, after the sale of its financial
participation in this entity, Martifer Group maintainsonly 10% of participation, which is recorded at the cost.
MS – Participações Societárias, S.A. (MS Brasil) – from equity method to the cost, after the lost of join control of this company with
Santander Brazil.
Eólica Embuaca, Ltda. (Embuaca) - from equity method to the cost, after the lost of join control of this company with Santander
Brazil.
Eólica Mar e Terra, Ltda (Mar e Terra) - from equity method to the cost, after the lost of join control of this company with Santander
Brazil.
Eólica Bela Vista, Ltda. (Bela Vista) - from equity method to the cost, after the lost of join control of this company with Santander
Brazil.
Eólica Icaraí, Ltda. (Icaraí) - from equity method to the cost, after the lost of join control of this company with Santander Brazil.
Other changes in the consolidation perimeter:
During the first quarter of 2013:
Porthold Project Development BV (Porthold) - increase in financial participation by Prio Agriculture B.V from 55% to 100%.
Eviva Gizalki Sp.Zo.o (Eviva Gizalki) – increase in financial participation by Martifer Renewables SGPS, S.A. from 72% to 100%.
In 2012:
Martifer Recycling Sp. Z.o.o. (Martifer Recycling Polónia) – merge by incorporation in Martifer Konstrukcje Sp. Z o.o. (Martifer
Konstrukcje)
Martifer - Alumínios, S.A. (Martifer Alumínios Espanha) - merge by incorporation in Martifer – Construcciones Metálicas España,
S.A. (Martifer Espanha)
Gebox, S.A (Gebox) – increase in financial participation by Martifer Energy Systems SGPS, S.A. from 65% to100%.
Martifer Solar SGPS, S.A. (Martifer Solar SGPS) – decrease in financial participation by Martifer SGPS, S.A. from 75% to 55%.
Sol Cativante, Lda (Sol Cativante) – increase in financial participation by Martifer Solar, S.A. from 9.1% to 100%.
Ennebiuno S.R.L – acquisition of 100% of shares by MTS4, s.r.l., followed by merge in this company.
Ennebidue S.R.L – acquisition of 100% of shares by MTS4, s.r.l., followed by merge in this company.

PAGE 40 1Q2013 REPORT
Ennebitre S.R.L – acquisition of 100% of shares by MTS4, s.r.l., followed by merge in this company.
Fvexcava S.R.L – acquisition of 100% of shares by MTS3, s.r.l., followed by merge in this company.
Rosa dos Ventos S.A. (Rosa dos Ventos) – increase in financial participation by MS - Participações Societárias, S.A. from 95% to
97.5%.
3. INFORMATION BY BUSINESS SEGMENTS
The Group bases its disclosure of information for primary segments on its internal organisation in terms of management.
The Group is organised in three business areas: ‘Metallic Construction’, ‘Solar’ and ‘RE Developer’ that are coordinated and
supported by Martifer SGPS.
The Metallic Construction business area includes all the construction activities of steel structures, aluminium façades and glass and
stainless steel solutions. It includes also the wind power division, components, turbine assembly and turnkey wind farm delivery,
engineering division and navy. In the ‘Solar’ segment the focus is on the production of PV panels, as well as the turnkey solar parks
delivery, promotion, licensing, operation and maintenance of projects. The ‘RE Developer’ segment includes the promotion and
development of projects of renewable energy, with special emphasis in the wind sector. Amounts related with Martifer SGPS,
Martifer Inovação e Gestão S.A. (MIG) and Martifer Gestiune Si Servicii, S.R.L. (MIG RO) are reported as ‘Others’.
The accounting policies used in the preparation of the information by business segments is the same used in the preparation of the
attached financial statements (Note 1).
At 31 March 2013 and 2012, the breakdown of sales and services rendered by primary segments is as follows:
SALES TO EXTERNAL CUSTOMERS INTERSEGMENT SALES
3M’ 2013 3M’ 2012 3M’ 2013 3M’ 2012
Metallic Construction 64,924,474 58,155,428 8,872,132 21,752,579
Solar 57,394,257 49,113,016 14,373,021 9,179,441
RE Developer 3,698,810 3,283,173 84,718 2,952,464
Others 262,449 510,725 777,086 678,064
126,279,990 111,062,342 24,106,957 34,562,548
TOTAL
3M’ 2013 3M’ 2012
Metallic Construction 73,796,606 79,908,007
Solar 71,767,278 58,292,457
RE Developer 3,783,528 6,235,637
Others 1,039,535 1,188,789
150,386,947 145,624,890
Intersegment eliminations (22,689,966) (33,385,182)
Own work capitalized (Note 5) (1,416,991) (1,177,366)
Sales and services rendered to external customers 126,279,990 111,062,342
Sales and services rendered to external clients – ‘Metallic Construction’ and ‘Solar’- increased in the first quarter, when compared
with the same period of previous year, as a result of the internationalization strategy of the group. ‘RE Developer’ segment keeps its
focus in the markets with assets in operation– Brazil, Romania, Spain and Poland.

1Q2013 REPORT PAGE 41
Sales and services rendered by geographical segments are as follows:
3M’ 2013 3M’ 2012
Iberian Peninsula 41,074,372 32,231,009
European Union (other) 43,729,169 42,912,559
Other markets 41,476,449 35,918,773
126,279,990 111,062,342
‘Metallic Construction’ segment’s sales and services rendered are mainly related with the activity developed in Brazil, Saudi Arabia,
Angola, France and UK. In the 'Solar' segment has particular significance the projects developed in Mexico and UK. Sales and
services of ‘RE Developer’ are mainly related with projects developed in Romania and Brazil.
At 31 March 2013 and 2012, the earnings before interest, taxes, amortizations, provisions and impairment losses (EBITDA),
earnings before interest and taxes (EBIT) and profit after tax by primary segments are as follows:
EBITDA EBIT
3M’ 2013 3M’ 2012 3M’ 2013 3M’ 2012
Metallic Construction (1,034,879) 4,061,367 (2,973,997) 1,897,455
Solar 1,381,526 4,869,613 331,762 4,066,055
RE Developer 2,502,148 1,689,199 491,143 186,245
Others (227,273) (327,944) (707,925) (797,380)
2,621,522 10,292,235 (2,859,017) 5,352,375
PROFIT AFTER TAX
3M’ 2013 3M’ 2012
Metallic Construction (7,513,119) (1,941,712)
Solar 237,349 1,017,421
RE Developer 262,887 (511,736)
Others (7,012,550) (3,119,070)
(14,025,432) (4,555,097)
The Group’s net assets and liabilities by operating segments at 31 March 2013 and 31 December 2012 are as follows:
ASSETS LIABILITIES
31 MARCH 2013 31 DECEMBER 2012 31 MARCH 2013 31 DECEMBER 2012
Metallic Construction 402,630,949 382,567,279 350,101,147 322,965,218
Solar 290,575,979 288,991,897 209,164,648 208,354,852
RE Developer 231,401,996 224,126,986 101,336,681 94,798,380
Others 550,093,061 550,627,281 173,993,715 168,533,767
Intra-group eliminations (470,159,009) (469,938,243) (45,964,820) (45,532,240)
1,004,542,976 976,375,200 788,631,371 749,119,977

PAGE 42 1Q2013 REPORT
The Group’s capital expenditures (acquisition of tangible and intangible assets) and amortizations, by operating segments, till 31
March 2013 and 2012, are as follows:
CAPITAL EXPENDITURES AMORTIZATIONS
31 MARCH 2013 31 MARCH 2012 3M’ 2013 3M’ 2012
Metallic Construction 2,170,005 2,683,634 1,860,521 2,077,663
Solar 1,799,373 8,228,346 748,186 670,668
RE Developer 664,905 551,326 1,373,495 1,311,871
Others 42,453 379,347 480,653 469,436
4,676,736 11,842,653 4,462,855 4,529,638
The amount invested in tangible fixed assets and intangible assets during the first quarter of 2013 was mainly applied to the
development of solar projects Italy (1.3 million euro) and to Metallic Construction’s maintenance investment (2 million euro),
particularly in the markets of Brazil, Saudi Arabia and the Iberian Peninsula.
4. SALES AND SERVICES RENDERED
At 31 March 2013 and 2012, the breakdown of sales and services rendered is as follows:
3M’ 2013 3M’ 2012
Revenue from the sale of merchandise 16,212,608 22,929,767
Revenue from the sale of goods 30,516,555 25,755,679
Services rendered 79,550,827 62,376,896
126,279,990 111,062,342
5. OTHER INCOME
At 31 March 2013 and 2012, the breakdown of the caption ‘Other income’ is as follows:
3M’ 2013 3M’ 2012
Change in production 284,311 (4,342)
Own work capitalized 1,416,991 1,177,366
1,701,302 1,173,024
The amount included under the heading 'Own work capitalized’, during the first quarter of 2013 is related primarily to the construction of solar parks in the segment 'Solar' in Italy, and with work carried out in Saudi Arabia in the segment 'Metallic Construction’.

1Q2013 REPORT PAGE 43
6. COST OF GOODS SOLD AND SUBCONTRACTORS
At 31 March 2013 and 2012 the cost of goods sold and subcontractors is as follows:
31 MARCH 2012 MERCHANDISE RAW-MATERIALS, SUBSIDIARIES
AND OTHER CONSUMABLES TOTAL
Opening balance of the continued operations 7,959,678 14,706,812 22,666,490
Purchases 4,830,703 44,028,554 48,859,257
Changes in the consolidation perimeter, currency exchange differences, transfers and others
907,562 430,802 1,338,364
Closing balance of the continued operations 8,827,302 14,806,702 23,634,004
4,870,641 44,359,466 49,230,107
Subcontractors 22,159,227
31 MARCH 2013 MERCHANDISE RAW-MATERIALS, SUBSIDIARIES
AND OTHER CONSUMABLES TOTAL
Opening balance of the continued operations 6,557,447 10,825,365 17,382,812
Purchases 13,585,986 36,890,926 50,476,912
Changes in the consolidation perimeter, currency exchange differences, transfers and others 6,779,641
(114,028) 6,665,613
Closing balance of the continued operations 13,806,517 12,388,538 26,195,055
13,116,557 35,213,725 48,330,282
Subcontractors 38,255,801
7. EXTERNAL SUPPLIES AND SERVICES
At 31 March 2013 and 2012 the external supplies and services are as follows:
3M’ 2013 3M’ 2012
Specialized works 3,509,500 4,612,417
Leases and rents 3,367,200 2,969,205
Transportation of goods 3,615,032 2,700,767
Travelling expenses 1,305,441 1,209,918
Insurance 920,125 1,072,151
Electricity and Fuel 927,069 937,496
Legal and notarial fees 747,776 417,883
Commissions 192,663 461,795
Communications 392,533 443,192
Maintenance and repairs 497,918 318,927
Security 333,669 401,914
Advertising 244,667 267,809
Tools and devices 82,895 255,892
Cleaning, health and safety 117,422 156,980
Service Fees 314,433 102,631
Other 831,127 1,025,354
17,399,470 17,354,331
8. STAFF COSTS
At 31 March 2013 and 2012, staff costs are as follows:
3M’ 2013 3M’ 2012
Salaries 15,691,392 16,244,556
Social contributions 4,879,285 4,537,276
20,570,677 20,781,832

PAGE 44 1Q2013 REPORT
The caption ‘social contributions’ includes mainly the social security contributions, the food and health subsidies, insurance costs
and dismissal compensation.
9. OTHER OPERATIONAL GAINS AND LOSSES
At 31 March 2013 and 2012, the caption ‘Other operational gains and losses’ is as follows:
3M’ 2013 3M’ 2012
Taxes (864,546) (194,822)
Impairment losses and reversals of impairment losses
- Trade debtors (1,155) 316,642
- Other impairment losses (335,838) 54,238
Supplementary income 398,850 327,011
Capital Gains / (Losses) in non-financial assets 226,081 60,531
Operating subsidies 31,505 189,563
Investments subsidies 36,837 39,384
Other operational gains / losses (295,274) 6,789,819
(803,540) 7,582,366
In the first quarter of 2012, the caption "Other operational gains / losses' included the effect of the capitalization of development
costs of wind farms in the ‘RE Developer’ segment.
10. PROVISIONS AND IMPAIRMENT LOSSES
The provisions and impairment losses during the first t quarter of 2013 and 2012 were as follows:
3M’ 2013 3M’ 2012
Tangible assets impairment 621,068 -
621,068 -
Provisions arising from the use of the equity method 92,837 -
Provisions for quality warranties 40,185 -
Other provisions 263,594 410,222
396,616 410,222
11. NET FINANCIAL RESULTS
The net financial results for the first quarter of 2013 and 2012 can be analysed as follows:
FINANCIAL INCOME 3M’ 2013 3M’ 2012
Loans and accounts receivable (including bank deposits)
Interest income 1,022,179 1,523,627
Financial assets available for sale
Gains on the sale of financial assets 46,792 -
Other financial income related to other financial assets
Foreign exchange gains 2,377,199 4,944,951
Other financial income 221,808 24,369
3,667,979 6,492,947

1Q2013 REPORT PAGE 45
FINANCIAL EXPENSES 3M’ 2013 3M’ 2012
Loans and accounts payable
Interest expenses in bank loans and in finance leases 5,945,456 6,313,779
Of which included in the acquisition cost of assets in progress (483,411) (13,460)
Financial assets available for sale
Losses on the sale of financial assets 391,369 -
Other financial income related to other financial liabilities
Foreign exchange losses 2,203,846 5,425,032
Other financial expenses 3,037,552 2,564,301
11,094,812 14,289,652
The 'Interest expenses included in the acquisition cost of assets in progress' relates to the capitalization of financial expenses of
loans for the construction of assets that qualify. The main figures refer to charges capitalized in the construction of solar projects in
the United States.
The captions 'Foreign exchange gains / (losses)' are related to the occurrence of currency fluctuations, particularly in affiliated
companies located in Poland, Brazil and Angola.
12. GAINS/ (LOSSES) IN ASSOCIATE COMPANIES AND JOINT
ARRANGEMENTS
At 31 March 2013 and 2012, the gains and losses on associate companies and joint-ventures are as follows:
3M’ 2013 3M’ 2012
Group Prio Energy 639,270 807,131
Group Nutre (4,730,480) (782,825)
Martifer Amal (26,908) -
SPEE 2 – Parque Eólico de Vila Franca de Xira, S.A. 252,588 101,945
Liskin Green Park (72,024) -
SPEE 3 – Parque Eólico do Baião, S.A. 183,903 61,918
Parque Solar Seseña I, S.L. (2,767) (73,348)
Promoquatro – Investimentos Imobiliários, Lda. (9,386) (399,978)
MS – Participações Societárias, S.A. - (71,276)
Other 4,534 (53,857)
(3,761,270) (410,291)
13. INCOME TAXES
The reconciliation between current tax and income tax is summarized as follows:
3M’ 2013 3M’ 2012
Current tax 439,930 2,203,661
Deferred tax - generated by temporary differences 107,223 (517,097)
Deferred tax - reversal of temporary differences 1,488,235 457,377
Effect of changes in the income tax rate (6,643) (10,355)
Deferred tax - tax losses recognition (1,972,039) (433,109)
Other (78,394) -
Deferred tax (461,619) (503,185)
Income tax (21,689) 1,700,476

PAGE 46 1Q2013 REPORT
14. EARNINGS PER SHARE
Martifer SGPS only issued ordinary shares, and as such, no shares have special voting or dividend rights.
Martifer has just one type of potential ordinary dilutive shares: stock options. In order to calculate diluted earnings per share it is
necessary to determine if these stock options, independently of being or not exercisable, are diluted, which happened when the
exercise price of the opting is lower than the average market price of the shares.
Once the average market price of Martifer’ s shares, in the period between 1 January 2013 and 31 March 2013, was Euro 0.68,
lower than the exercise price of the stock options (Euro 3.84), these stock options are non-diluted because, if the options were
exercised, the number of shares outstanding would be reduced.
Therefore, at 31 March 2013 there were no differences between the basic earnings per share and the diluted earnings per share calculation.
The share capital of Martifer SGPS is represented by 100,000,000 ordinary shares, fully paid, representing a share capital of Euro
50,000,000.
The weighted average number of shares outstanding is deducted of 2,215,910 treasury stocks acquired by Martifer SGPS.
At 31 March 2013 and 2012, the basic and diluted earnings per share can be summarised as follows:
3M’ 2013 3M’ 2012
Profit for the year (I) (14,155,169) (4,698,549)
Weighted average number of shares outstanding (II) 97,784,090 98,067,865
Basic and diluted earnings per share (I) / (II) (0.1448) (0.0479)
from continuing operations (0.1464) (0.0479)
from Assets as held for sale 0.0016 -
15. GOODWILL
At 31 March 2013 and 31 December 2012, the movement occurred in the caption ‘Goodwill’ is as follows:
31 MARCH 2013 31 DECEMBER 2012
Cost
Opening balance 19,043,523 18,926,458
Acquisition of subsidiaries - 734,900
Sale of subsidiaries (14,379) -
Effect of foreign currency exchange differences 354,243 172,355
Write-off of goodwill fully impaired - (790,190)
Closing balance 19,383,387 19,043,523
Accumulated impairment losses
Opening balance 95,555 790,190
Impairment losses recognized in the year - 95,555
Write-off of goodwill fully impaired - (790,190)
Closing balance 95,555 95,555
Carrying amount at the beginning of the period 18,947,967 18,136,269
Carrying amount at the end of the period 19,287,831 18,947,967

1Q2013 REPORT PAGE 47
At 31 March 2013 and 31 December 2012, the breakdown of ‘Goodwill’ is as follow:
31 MARCH 2013 31 DECEMBER
2012
COST IMPAIRMENT
LOSSES CARRYING
AMOUNT CARRYING
AMOUNT
Martifer Construções 5,448,792 - 5,448,792 5,448,792
Sassall Aluminium 5,694,485 - 5,694,485 5,356,394
Martifer Metallic Constructions 3,898,809 - 3,898,809 3,898,809
Navalria 1,618,675 - 1,618,675 1,618,675
Martifer Solar 1,493,776 - 1,493,776 1,493,776
Martifer Solar USA 404,348 - 404,348 388,195
Martifer Solar Hellas 72,205 - 72,205 72,205
LRCC-La Rad Campo Charro - Energias Renováveis, Lda 70,843 - 70,843 70,843
Porthold - - - 14,379
MGI 8,373 - 8,373 8,373
Martifer GmbH 6,026 - 6,026 6,026
M Prime Gmbh 3,000 - 3,000 3,000
MTS4 464,665 - 464,665 464,665
MTS3 103,836 - 103,836 103,836
19,287,831 - 19,287,831 18,947,967
16. INTANGIBLE ASSETS
This caption is analysed as follows:
31 MARCH 2013 31 DECEMBER 2012
Cost
Software and other rights 20,140,269 26,145,255
Intangible assets in progress 1,446,207 24,119,844
Advances for the acquisition of intangible assets 193,657 99,623
21,780,133 50,364,722
Accumulated depreciation and impairment losses
Software and other rights 11,530,967 10,922,850
Intangible assets in progress - -
Advances for the acquisition of intangible assets - -
11,530,967 10,922,850
Carrying amount 10,249,166 39,441,872
At 31 March 2013 and 2012, the gross amount of ‘Intangible assets’ can be analysed as follows:
31 MARCH 2012 SOFTWARE AND OTHER RIGHTS
INTANGIBLE ASSETS IN
PROGRESS
ADVANCES FOR THE ACQUISITION OF
INTANGIBLE ASSETS TOTAL
Opening balance 1 January 2012 30,057,374 17,841,233 687,015 48,585,622
Additions 397,893 3,331,682 480,659 4,210,234
Sales, disposals and write-offs - - (411,512) (411,512)
Effect of foreign currency exchange differences (72,385) (351,660) (21,450) (445,495)
Changes in the consolidation perimeter 24,908 - - 24,908
Transfers and other movements (77,150) (214,575) - (291,725)
Closing balance 31 March 2012 30,330,640 20,606,680 734,712 51,672,032

PAGE 48 1Q2013 REPORT
31 MARCH 2013 SOFTWARE AND OTHER RIGHTS
INTANGIBLE ASSETS IN
PROGRESS
ADVANCES FOR THE ACQUISITION OF
INTANGIBLE ASSETS TOTAL
Opening balance 1 January 2013 26,145,255 24,119,844 99,623 50,364,722
Additions 1,241,814 213,573 91,007 1,546,394
Sales, disposals and write-offs - - - -
Effect of foreign currency exchange differences 200,521 683,466 3,026 887,013
Changes in the consolidation perimeter (535) (57,981) - (58,516)
Transfers and other movements (7,446,786) (23,512,695) - (30,959,481)
Closing balance 31 March 2013 20,140,269 1,446,207 193,656 21,780,132
The change in capital expenditure in the first quarter of 2013, compared with the same period of 2012, relates essentially with the
development of solar projects in Italy (Euro 1,2 million), in the Solar segment.
In the period under review were transferred to inventories Euro 32 million (see Note 21).
At 31 March 2013 and 2012, the accumulated amortization and impairment losses of ‘Intangible assets’ can be analysed as follows:
31 MARCH 2012 SOFTWARE AND OTHER RIGHTS
INTANGIBLE ASSETS IN
PROGRESS
ADVANCES FOR THE ACQUISITION OF
INTANGIBLE ASSETS TOTAL
Opening balance 1 January 2012 8,584,677 - - 8,584,677
Additions 574,118 - - 574,118
Effect of foreign currency exchange differences (2,708) - - (2,708)
Changes in the consolidation perimeter 5,032 - - 5,032
Transfers and other movements (1,724) - - (1,724)
Closing balance 31 March 2012 9,159,395 - - 9,159,395
31 MARCH 2013 SOFTWARE AND OTHER RIGHTS
INTANGIBLE ASSETS IN
PROGRESS
ADVANCES FOR THE ACQUISITION OF
INTANGIBLE ASSETS TOTAL
Opening balance 1 January 2013 10,922,850 - - 10,922,850
Additions 595,396 - - 595,396
Effect of foreign currency exchange differences 3,088 - - 3,088
Changes in the consolidation perimeter - - - -
Transfers and other movements 9,633 - - 9,633
Closing balance 31 March 2013 11,530,967 - - 11,530,967
Carrying Amount
31 MARCH 2012 21,171,245 20,606,680 734,712 42,512,637
31 MARCH 2013 8,609,302 1,446,207 193,656 10,249,166

1Q2013 REPORT PAGE 49
17. TANGIBLE ASSETS
This caption is analysed as follows:
31 MARCH 2013 31 DECEMBER 2012
Cost
Land and buildings 93.345.052 91.325.592
Equipments 110.871.685 105.292.662
Tangible assets in progress 79.227.692 97.542.316
Other tangible assets 70.336.886 62.614.240
353.781.315 356.774.810
Accumulated depreciation and impairment losses
Land and buildings 18.793.774 17.935.741
Equipments 55.018.042 52.821.114
Other tangible assets 13.529.654 12.650.431
87.341.470 83.407.286
Carrying amount 266.439.845 273.367.524
At 31 March 2013 and 2012, the gross amount of land and buildings, equipments, tangible assets in progress and other fixed
assets can be analysed as follows:
31 MARCH 2012 LAND AND
BUILDINGS EQUIPMENTS
TANGIBLE ASSETS IN PROGRESS
OTHER TANGIBLE
ASSETS TOTAL
Opening balance 1 January 2012 96,012,887 109,258,138 91,880,914 62,919,117 360,071,056
Reclassification for Assets held for sale (note 26) (134,760) - (1,041,904) - (1,176,664)
Additions 26,911 897,523 6,687,090 20,895 7,632,419
Sales, disposals and write-offs - (405,290) - (3,803) (409,093)
Effect of foreign currency exchange differences 588,014 (173,986) (311,018) 26,880 129,890
Transfers and other movements 6,555,555 3,017,284 (12,786,941) 1,133,989 (2,080,113)
Closing balance 31 March 2012 103,048,608 112,593,669 84,428,141 64,097,078 364,167,495
31 MARCH 2013 LAND AND
BUILDINGS EQUIPMENTS
TANGIBLE ASSETS IN PROGRESS
OTHER TANGIBLE
ASSETS TOTAL
Opening balance 1 January 2013 91,325,592 105,292,661 97,542,317 62,614,240 356,774,810
Additions 711,330 602,124 1,656,534 160,354 3,130,342
Sales, disposals and write-offs (3,007) (554,505) (110,348) (115,883) (783,743)
Effect of foreign currency exchange differences 1,285,162 1,315,269 827,768 110,839 3,539,035
Impairment losses - - (621,068) - (621,068)
Transfers and other movements 25,974 4,216,139 (20,067,510) 7,567,334 (8,258,063)
Closing balance 31 March 2013 93,345,052 110,871,686 79,227,692 70,336,884 353,781,315
The investment recorded in the first quarter of 2013 in tangible assets is justified by several maintenance investment (Euro 2
million), in the ‘Metallic Construction’ segment.
In the period under review were transferred to inventories Euro 9 million (see Note 21).

PAGE 50 1Q2013 REPORT
At 31 March 2013 and 2012, the accumulated depreciation and impairment losses of land and buildings, equipments, tangible
assets in progress and other fixed assets can be analysed as follows:
31 MARCH 2012 LAND AND
BUILDINGS EQUIPMENTS
TANGIBLE ASSETS IN
PROGRESS
OTHER TANGIBLE
ASSETS TOTAL
Opening balance 1 January 2012 15,826,402 49,806,980 - 9,352,706 74,986,088
Additions 885,672 2,281,500 - 788,347 3,955,519
Sales, disposals and write-offs - (277,331) - (3,803) (281,134)
Effect of foreign currency exchange differences 95,201 156,499 - 6,141 257,841
Changes in the consolidation perimeter (241,409) (227,803) - (594) (469,806)
Transfers and other movements 15,455 (21,733) - 7,531 1,253
Closing balance 31 March 2012 16,581,321 51,718,112 - 10,150,328 78,449,761
31 MARCH 2013 LAND AND
BUILDINGS EQUIPMENTS
TANGIBLE ASSETS IN
PROGRESS
OTHER TANGIBLE
ASSETS TOTAL
Opening balance 1 January2013 17,935,741 52,821,114 - 12,650,431 83,407,286
Additions 782,564 2,215,440 - 869,777 3,867,781
Sales, disposals and write-offs - (259,745) - - (259,745)
Effect of foreign currency exchange differences 64,306 276,060 - 8,284 348,650
Changes in the consolidation perimeter (19,701) (3,114) - (136) (22,951)
Transfers and other movements 30,864 (31,713) - 1,298 449
Closing balance 31 March 2013 18,793,774 55,018,042 - 13,529,654 87,341,470
Carrying amount
31 MARCH 2012 86,467,287 60,875,557 84,428,141 53,946,750 285,717,735
31 MARCH 2013 74,551,278 55,853,644 79,227,692 56,807,230 266,439,845
18. INVESTMENT PROPERTIES
The caption ‘Investment property’ relates to the following investment properties held by Martifer Group: Benavente Shopping
Centre, Warehouses in Albergaria-a-Velha (Portugal), the plant in Vagos and Aricesti land (Romania), held by the Martifer Group to
earn rental income.
These assets are carried at their fair market value, according to an independent appraisal made by specialized entities, according
to international practices (RICS Red Book). Martifer Group will perform regular revaluations of these properties, and gains and
losses arising from changes in the fair value will be charged to profit or loss in the period in which they arise.
At 31 March 2013 and 31 December 2012, the movement occurred in the caption ‘Investment properties’ is as follows:
31 MARCH 2013 31 DECEMBER 2012
Opening balance 16,206,768 17,274,847
Transfers - 3,448,525
Changes in fair value - 86,391
Effect of foreign currency exchange differences 10,490 363,302
Reclassification for Assets held for sale (note 26) - (4,966,297)
16,217,257 16,206,768

1Q2013 REPORT PAGE 51
19. FINANCIAL ASSETS UNDER THE EQUITY METHOD
At 31 March 2013 and 31 December 2012, financial assets under the equity method are as follows:
31 MARCH 2013 31 DECEMBER 2012
Prio Energy 11,893,144 11,187,119
SPEE 3 - Parque eólico de Baião, SA 679,935 496,032
SPEE 2 - Parque eólico de Vila Franca de Xira, SA 1,335,327 1,082,739
Macquarie 269 2,043,840
Promoquatro - Investimentos Imobiliários, Lda 176,850 186,236
Martifer Amal, S.A. 405,165 445,944
Canaverosa 123,397 119,044
Parque Sesena 1 113,850 115,380
Other 2,265 3,678
14,730,200 15,680,011
At 31 March 2013 and 31 December 2012, the movement occurred in this caption is as follows:
31 MARCH 2013 31 DECEMBER 2012
Opening balance 15,680,011 14,867,827
Application of the equity method 1,093,936 2,425,428
Acquisition - 445,944
Decrease in share capital (2,010,351) -
Sales - (1,445,591)
Changes resulting from the loss of control in subsidiaries - -
MS Participações Societárias - (718,373)
Impairment losses - -
Effect of foreign currency exchange differences - -
Other changes (33,396) 104,777
Closing balance 14,730,200 15,680,011
20. AVAILABLE FOR SALE INVESTMENTS
At 31 March 2013 and 31 December 2012, available for sale investments are as follows:
31 MARCH 2013 31 DECEMBER 2012
Non-current financial investment 1,677,171 1,663,963
Others 958,588 646,304
2,635,759 2,310,267
At 31 March 2013 and 31 December 2012, the movement occurred in the caption ‘Available for sale investments’ is as follows:
31 MARCH 2013 31 DECEMBER 2012
Opening balance 2,310,267 2,179,021
Additions 311,248 138,993
Reductions - (16,478)
Other changes 14,244 8,731
2,635,759 2,310,267

PAGE 52 1Q2013 REPORT
21. INVENTORIES
At 31 March 2013 and 31 December 2012, inventories are as follows:
31 MARCH 2013 31 DECEMBER 2012
Raw-materials, subsidiaries and other consumables 12,264,322 10,701,150
Work in progress 39,929,072 5,299,576
Merchandise 13,806,517 6,557,447
Finished goods 2,072,500 1,833,889
68,072,411 24,392,062
Part of the Group's activity is related to the development of solar projects, which can be developed for sale or to use. During the first
quarter of 2013 ongoing projects were reviewed and, as a consequence, intangible assets and tangible fixed assets amounting Euro
41 million were transferred to Inventories as these projects and licenses are being developed for sale and not for its use by Martifer.
22. OTHER FINANCIAL ASSETS
The detail of the caption ‘trade and other receivables’, for the periods ended at 31 March 2013 and 31 December 2012 is as follows:
NON CURRENT CURRENT
31 MARCH 2013 31 DECEMBER 2012 31 MARCH 2013 31 DECEMBER 2012
Cost:
Trade receivables:
Trade receivables 31,890,076 31,505,073 153,737,183 146,320,356
Notes receivables - - 3,155,736 3,930,470
Doubtful trade receivables - - 18,146,476 18,468,425
Total ‘trade receivables’ 31,890,076 31,505,073 175,039,395 168,719,251
Other receivables:
Related companies 96,752,896 100,321,045 15,604,025 15,764,687
Advances to suppliers 3,335 4,847 14,598,383 11,284,325
Others 10,512,973 8,465,440 37,693,235 43,002,651
Total ‘other receivables’ 107,269,204 108,791,332 67,895,644 70,051,663
TOTAL 139,159,280 140,296,405 242,935,038 238,770,914
The caption of non-current ‘Trade receivables’ refers mainly to an amount to receive from an associate company, in the ‘Solar’
segment, which will be regularized as soon as this company obtains revenues from the sale of energy. This receivable amount
bears interests at the market rate.
At 31 March 2013 and 31 December 2012, impairment losses in accounts receivables are as follows:
NON- CURRENT CURRENT
31 MARCH 2013 31 DECEMBER 2012 31 MARCH 2013 31 DECEMBER 2012
Accumulated impairment losses:
Doubtful trade receivables - - 18,089,664 18,362,123
Other receivables 118,411 121,503 7,747,676 7,779,142
118,411 121,503 25,837,340 26,141,265
Carrying amount – trade receivables 31,890,076 31,505,073 156,949,731 150,357,128
Carrying amount - other receivables 107,150,793 108,669,829 60,147,968 62,272,521
TOTAL 139,040,869 140,174,902 217,097,698 212,629,650

1Q2013 REPORT PAGE 53
23. INCOME TAX AND CURRENT TAX ASSETS
At 31 March 2013 and 31 December 2012, current tax assets are as follows:
31 MARCH 2013 31 DECEMBER
2012
Income tax 2,425,926 2,692,473
Value added tax 17,187,343 15,379,705
Tax in other countries 2,812,911 1,464,331
Other taxes 1,400,571 1,493,203
Current tax assets 21,400,825 18,337,239
24. OTHER CURRENT ASSETS
At 31 March 2013 and 31 December 2012, the breakdown of the caption ‘Other current assets’ is as follows:
31 MARCH 2013 31 DECEMBER 2012
Accrued income
Construction contracts
Cost 133,238,965 123,070,681
Impairment losses (5,705,334) (5,477,871)
Carrying amount 127,533,631 117,592,810
Interest to be received 411,641 46,391
Other accrued income 3,246,939 3,427,374
131,192,211 121,066,575
Prepayments
Insurances 1,911,899 1,505,437
Financial expenses 706,551 727,703
Rents 714,509 892,716
Other prepayments 2,138,287 905,635
5,471,247 4,031,492
Other (current) financial assets 1,478,765 620,583
138,142,223 125,718,650
25. CASH AND CASH EQUIVALENTS
The ‘Cash and cash equivalents’ caption can be analysed as follows:
31 MARCH 2013 31 DECEMBER 2012
Cash and cash equivalents
Bank deposits 32,852,472 37,585,387
Cash 165,396 439,182
33,017,868 38,024,569
This caption includes cash on hand and in banks, maturing in no less than 3 months, which are subject to insignificant risk of
change in value. At 31 March 2013 and 31 December 2012, no restrictions exist to the usage of the amounts recorded in the
caption ‘Cash and cash equivalents’.

PAGE 54 1Q2013 REPORT
26. ASSETS HELD FOR SALE
In 2011, Martifer Renewables, SGPS, S.A. agreed, with IKEA Retail Sp. Zo.o., the sale of the shares of Energia Wiatrowa, Sp.
Zo.o. conditional to compliance with some terms and conditions set out in the agreement, namely the conclusion of the Rymanow
Project, a wind farm with 13 turbines, in the region of Podkarpackie, that is being developed by Energia Wiatrowa.
In December 2012, after the decision of closing the facility of Poland, an active plan for selling of lands and building of Martifer
Polska, Sp. Zo.o, in ‘Metallic Construction’ segment, has started. Additionally, there are negotiations under way for the sale of real
estate project of Szczecin (Poland), previously classified as investment property, for which the sale is highly probable. As such, all
the conditions defined by IFRS 5 are met, so the assets of Poland were classified as ‘Assets held for sale’, at 31 December 2012.
In accordance with IFRS 5, the assets and liabilities related to Energia Wiatrowa, as well as the assets and liabilities of Poland,
were classified as ‘Assets held for sale’ and ‘Liabilities associated with Assets held for sale’, respectively, and the net earnings
disclosed in the caption ‘Earnings of Assets held for sale’.
The breakdown of assets and liabilities of the business unit held for sale at 31 March 2013 and 31 December 2012 is as follows:
During the first quarter of 2013, the net result of Assets held for sale was of Euro 158,086.
The change in assets and liabilities associated with assets held for sale during this period relate mainly to the completion of the
project Rymanow.
27. SHARE CAPITAL, TREASURY SHARES AND NON-CONTROLLING
INTERESTS
Share capital
Martifer SGPS, SA share capital, fully subscribed and paid at 31 March 2013, amounts to Euro 50,000,000 and it is represented by
100,000,000 bearer shares with a nominal value of 50 cents each. All shares have the same rights, including one vote per share.
During the first quarter of 2013 and 2012, no movements occurred in the number of shares of the Group.
During the first quarter of 2013, Martifer SGPS, S.A. did not acquire any shares (2012: 402,819 treasury shares were acquired).
After these acquisitions, the Group held 2,215,910 treasury shares, corresponding to 2.22% of its capital.
At 31 March 2013, the share capital of Martifer SGPS, S.A. was held in 42.7% by I’M SGPS, S.A., in 37.5% by Mota-Engil SGPS,
S.A and 2.22% are treasury shares. The remaining 17.58% represents free-float listed in Euronext Lisbon.
31 MARCH 2013 31 DECEMBER 2012
Tangible Assets 33,084,453 22,167,446
Investment properties 4,842,551 4,966,297
Current assets 4,036,179 7,973,766
41,963,183 35,107,509
Current liabilities 18,204,856 9,524,921
Liabilities related to Assets held for sale 18,204,856 9,524,921
Assets net of liabilities related to Assets held for sale 23,758,327 25,582,589
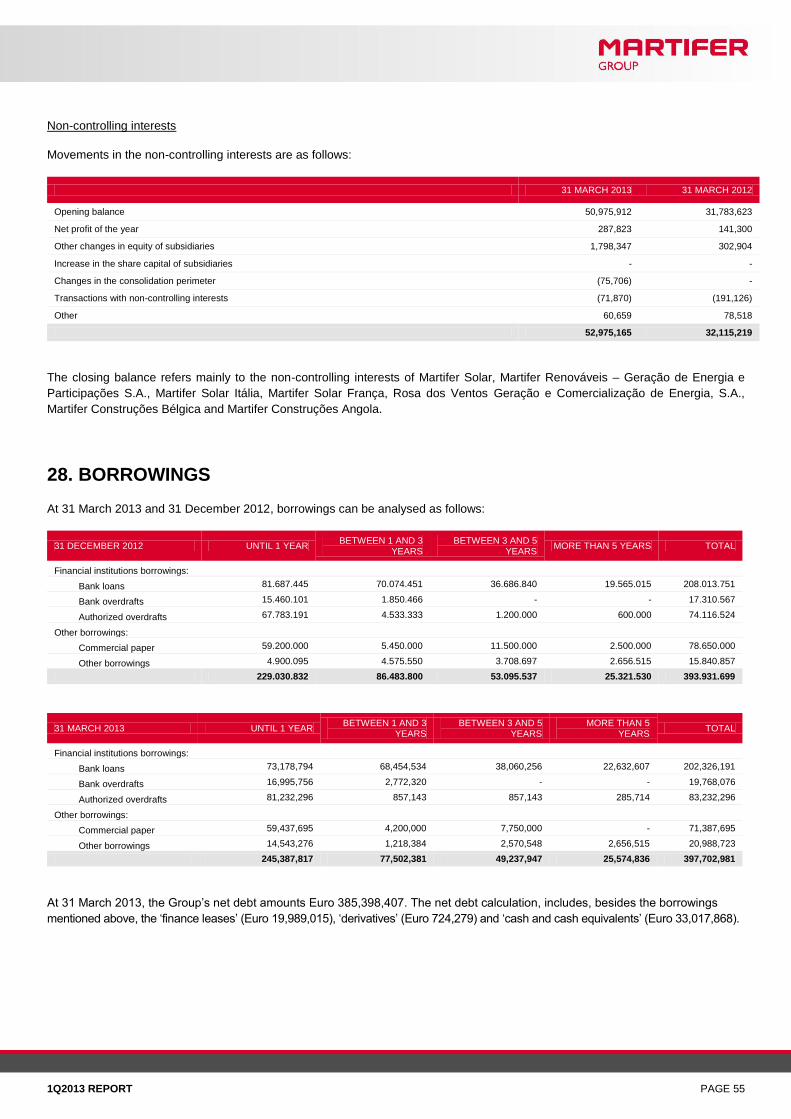
1Q2013 REPORT PAGE 55
Non-controlling interests
Movements in the non-controlling interests are as follows:
31 MARCH 2013 31 MARCH 2012
Opening balance 50,975,912 31,783,623
Net profit of the year 287,823 141,300
Other changes in equity of subsidiaries 1,798,347 302,904
Increase in the share capital of subsidiaries - -
Changes in the consolidation perimeter (75,706) -
Transactions with non-controlling interests (71,870) (191,126)
Other 60,659 78,518
52,975,165 32,115,219
The closing balance refers mainly to the non-controlling interests of Martifer Solar, Martifer Renováveis – Geração de Energia e
Participações S.A., Martifer Solar Itália, Martifer Solar França, Rosa dos Ventos Geração e Comercialização de Energia, S.A.,
Martifer Construções Bélgica and Martifer Construções Angola.
28. BORROWINGS
At 31 March 2013 and 31 December 2012, borrowings can be analysed as follows:
31 DECEMBER 2012 UNTIL 1 YEAR BETWEEN 1 AND 3
YEARS BETWEEN 3 AND 5
YEARS MORE THAN 5 YEARS TOTAL
Financial institutions borrowings:
Bank loans 81.687.445 70.074.451 36.686.840 19.565.015 208.013.751
Bank overdrafts 15.460.101 1.850.466 - - 17.310.567
Authorized overdrafts 67.783.191 4.533.333 1.200.000 600.000 74.116.524
Other borrowings:
Commercial paper 59.200.000 5.450.000 11.500.000 2.500.000 78.650.000
Other borrowings 4.900.095 4.575.550 3.708.697 2.656.515 15.840.857
229.030.832 86.483.800 53.095.537 25.321.530 393.931.699
31 MARCH 2013 UNTIL 1 YEAR BETWEEN 1 AND 3
YEARS BETWEEN 3 AND 5
YEARS MORE THAN 5
YEARS TOTAL
Financial institutions borrowings:
Bank loans 73,178,794 68,454,534 38,060,256 22,632,607 202,326,191
Bank overdrafts 16,995,756 2,772,320 - - 19,768,076
Authorized overdrafts 81,232,296 857,143 857,143 285,714 83,232,296
Other borrowings:
Commercial paper 59,437,695 4,200,000 7,750,000 - 71,387,695
Other borrowings 14,543,276 1,218,384 2,570,548 2,656,515 20,988,723
245,387,817 77,502,381 49,237,947 25,574,836 397,702,981
At 31 March 2013, the Group’s net debt amounts Euro 385,398,407. The net debt calculation, includes, besides the borrowings
mentioned above, the ‘finance leases’ (Euro 19,989,015), ‘derivatives’ (Euro 724,279) and ‘cash and cash equivalents’ (Euro 33,017,868).

PAGE 56 1Q2013 REPORT
29. TRADE PAYABLES AND OTHER PAYABLES
At 31 March 2013 and 31 December 2012, trade payables and other payables can be analysed as follows:
NON-CURRENT CURRENT
31 MARCH 2013 31 DECEMBER 2012 31 MARCH 2013 31 DECEMBER 2012
Trade payables 11,939,840 12,239,542 164,244,406 165,013,219
Other payables:
Fixed assets suppliers - - 1,290,153 840,425
Related companies and other shareholders 9,134,313 9,046,499 1,857,021 2,378,317
Advanced payments received from customers - 387,403 25,189,925 11,316,045
Other creditors 1,980,151 395,101 29,709,785 35,966,130
Other payables 11,114,464 9,829,003 58,046,885 50,500,917
23,054,305 22,068,545 222,291,291 215,514,136
The balance of non-current ‘Trade payables’ is related, mainly, with retentions in works performed by external parties, which will be
released after the period of guarantee.
At 31 March 2013 and 31 December 2012, the non-current balances due to related companies and other shareholders refer to loans
obtained from companies consolidated by the proportionate method, which bear interest at Euribor 3M increased by a 6.75% spread.
30. PROVISIONS
The information related with ‘Provisions’ as of 31 March 2013 and 31 December 2012 can be detailed as follows:
31 MARCH 2013 31 DECEMBER 2012
Quality guarantees 3,198,430 3,176,336
Legal claims in progress 611,053 604,844
Provisions arising from the use of the equity method 4,803,824 4,498,385
Others 4,526,009 4,241,128
13,139,316 12,520,693
The change in the Provisions, compared with 31 December 2012, is as follows:
OPENING BALANCE
ADDITIONS NOTE 11
DEDUCTIONS NOTE 11
APPLICATIONS
CHANGE OF CONSOLIDATION
PERIMETER, EXCHANGE RATE
DIFFERENCES, TRANSFERS
CLOSING BALANCE
Quality guarantees 3,176,336 42,592 (2,407) - (18,091) 3,198,430
Legal claims in progress 604,844 - - - 6,209 611,053
Provisions arising from the use of the equity method
4,498,385 92,837 - - 212,602 4,803,824
Others 4,241,128 263,594 - (528) 21,815 4,526,009
12,520,693 399,023 (2,407) (528) 222,535 13,139,316

1Q2013 REPORT PAGE 57
31. INCOME TAX AND CURRENT TAX LIABILITIES
At 31 March 2013 and 31 December 2012, ‘Income Tax’ and ‘Current tax liabilities’ are made up as follows:
31 MARCH 2013 31 DECEMBER 2012
Income Tax 4,534,272 3,623,443
Value added tax 10,838,547 12,421,569
Social security contributions 2,281,660 1,619,163
Personnel income tax withheld 472,078 643,672
Other taxes 917,592 1,912,194
Current tax liabilities 14,509,877 16,596,598
32. OTHER CURRENT LIABILITIES
At 31 March 2013 and 31 December 2012, other current liabilities are made up as follows:
31 MARCH 2013 31 DECEMBER 2012
Accrued expenses
Holiday pay and bonuses 7,219,449 6,223,844
Interest borne but not yet overdue 4,284,023 3,622,926
Production performed by third parties not yet invoiced 2,705,388 3,613,297
Other accrued expenses 22,777,310 6,166,867
36,986,170 19,626,934
Deferred income
Production invoiced and not yet performed (related to construction contracts) 28,899,402 26,791,860
Subsidies / Government grants 2,014,505 1,502,984
Other deferred income 2,954,986 2,567,911
33,868,893 30,862,755
70,855,063 50,489,688
The caption "Other accrued expenses" includes supplies and services rendered up to March 31, 2013 whose invoices were
received after this date.
.
33. CONTINGENT LIABILITIES
There are no significant changes to the disclosed in the notes to the financial statements for the period ended December 31, 2012.
34. COMMITMENTS
The nature of the Group's commitments did not change in comparison with 31 December 2012.
35. RELATED PARTIES
Group companies have commercial relationships between them that qualify as related parties transactions. All of these transactions
are performed on an arm’s length basis.
Therefore, all of these transactions have been eliminated, since the consolidated financial statements disclose information
regarding the holding company and its subsidiaries as a unique company.
PAGE 58 1Q2013 REPORT
The balances resulting from transactions performed with associate and jointly controlled companies, accounted through the equity
method, are not eliminated. The amount of the balances not eliminated is approximately Euro 112,000,000, with special regard to
the accounts receivable from Nutre and Prio Energy Groups which amount to Euro 61,800,000.
Besides current transactions, some relating to civil construction done with the Mota-Engil Group and others associated with real estate
management projects under way done by Estia Group, there are not any other significant balances and transactions performed with
related parties during the period ended 31 March 2013, that had affected significantly the financial position or performance of the Group.
36. SUBSEQUENT EVENTS
There are no subsequent events to disclose.
37. APPROVAL OF THE FINANCIAL STATEMENTS
The accompanying consolidated financial statements were approved by the Board of Directors on 23rd
May 2013.
38. EXPLANATION ADDED FOR TRANSLATION OF THE FINANCIAL
STATEMENTS
These financial statements are a translation of the consolidated financial statements originally issued in Portuguese in accordance with the
International Financial Reporting Standards as adopted by European Union. In the event of discrepancies, the Portuguese version prevails.
Oliveira de Frades, 23rd
May 2013
The Chief Accountant The Board of Directors
__________________________________ __________________________________
Isabel Cristina Loureiro Silva Carlos Manuel Marques Martins
__________________________________
Jorge Alberto Marques Martins
__________________________________
Arnaldo José Nunes da Costa Figueiredo
__________________________________
Luís Filipe Cardoso da Silva
__________________________________
Luís Valadares Tavares
__________________________________
Jorge Bento Ribeiro Barbosa Farinha