apresentação do powerpoint - aes brasil
TRANSCRIPT
Corporate Presentation2017
Corporate Presentation2017

1
AES CorporationA Global Company
1 – Includes hydro, wind, solar, energy storage, and biomass; 2 – PV – Photovoltaic; 3 – Operating and under construction.
AES Corp is present in 17 countries and 4 continents
Natural gas and coal fired thermal plants25 GW of installed capacity
Over 8 GW ofRenewable sources¹
Distributed energy+104 MW of solar PV² projects in operation
World leader in Energy StorageTotal of 476 MW³
35 GWinstalled capacity
19thousand
employees
Providing services to over
9 million customers

2
• Solid participation in distribution and generation businesses
History in Brazil
1 – AES Sul was sold to CPFL Energia in June/2016.
1998
Privatization of AES
Eletropauloby a
consortium comprised by AES Corp and
other local and
international companies
1999
Privatization of AES Tietê
2000
AES Uruguaianabeginning of
operation
20012002
AES Corp increases its
interest in AES Eletropaulo
and AES Tietê
2003
Incorporation of CompanhiaBrasiliana de Energia and execution of shareholders agreement with BNDES
AES Corp acquired AES Sul through privatization
process
19971
Beginning of AES
Uruguaiana’sconstruction
1995
2016
AES Tietêmerged into
Cia Brasiliana and was renamedAES Tietê
Energia S.A.AES Brasil
+20 years ofpresence in
Brazil

3
AES Brasil Mission, Vision and Values
VisionTo be recognized by our customers and shareholders as the preferred partner for safe, innovative, reliable and affordable energy solutions
Values– Put safety first– Act with integrity– Honor commitments– Strive for excellence– Have fun through work
MissionTo promote the well being and development by providing secure, sustainable and reliable energy solutions

4
• Reservoirs repopulation
• Reforesting, borders and archeologicalmanagement programs
• Water quality monitoring
• Recycling and waste disposal programs
• Programs aiming to reduce CO2 emissions
• Risk Management and identification of opportunities related to climate change
AES Brasil Environmental Responsibility

5
AES Brasil Social Responsibility
• Access to reliable energy through social development
• Recycling incentive program as a means to pay the electricity bill - mitigation of delinquency
• Education for efficient and safe use of electricity
• Sustainable partnership – commitment with sustainable development at AES Brasil’s value chain
• AES Brasil Institute – Created in 2016 to promote social innovation and income generation initiatives impacting communities and people’s life based on four pillars: (i) shaping citizens, (ii) innovation for social development, (iii) entrepreneurship and (iv) volunteering.
6
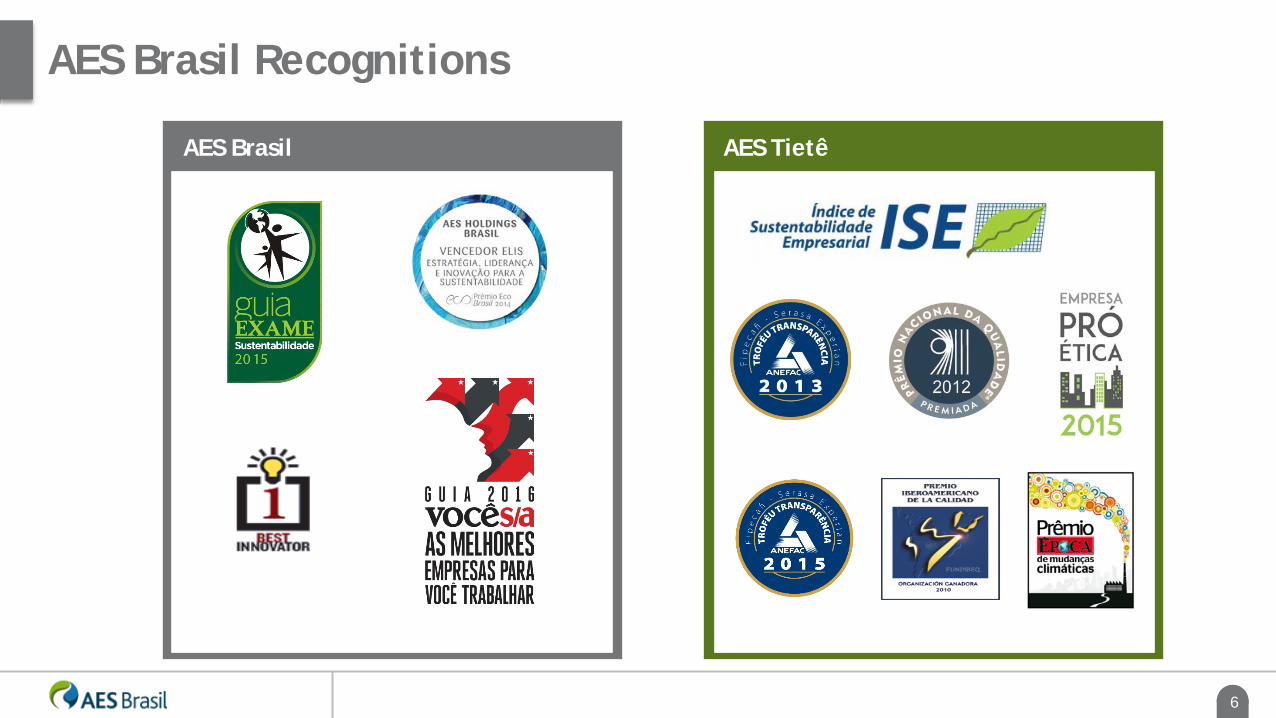
AES Brasil Recognitions
AES Brasil AES Tietê

7
National Interconnected System
GENERATION
ThermalPlant
Hydroelectric and Solar Plant
Substation Transformer
TRANSMISSION
Substation Transformer
Distribution Substation
DISTRIBUTION
RESIDENTIAL CUSTOMERS
COMMERCIAL AND INDUSTRIAL CUSTOMERS
Renewable Energy

8
Energy Sector in Brazil: Business Segments
Sources: EPE, ANEEL, ONS, ABRADEE and Instituto Ascende Brasil.1 – Refers to May/2017 data; 2 – Refers to 2016 data; 3 – Includes HPP (hydro power plants) and SHP (small hydro plants).
• 4,660 power plants
• 160 GW of installed capacity
• System based on hydro plants (12643)
• Contracting environment: free and
regulated markets
Distribution²
• 63 distribution companies
• 327 TWh distributed energy
• 81 million consumer units
• Annual tariff adjustment
• Tariff reset every four or five years
• Regulated contracting environment
• 77 agents
• High voltage transmission (>230 kV)
• +100,000 km of lines (National
Integrated System)
• Regulated tariff (annually adjusted by
inflation)
Transmission²Generation¹

9
Ownership Structure
24.3% 28.3% 47.4% US$ 1.6 bi
Others1 Market Cap2
C = Common ShareP = Preferred ShareT = Total
C 50.00% + 1 shareP 0.00%T 46.15%
C 50.00% - 1 shareP 100.00%T 53.85%
C 100.00%T 100.00%
C 100.00%T 100.00%
AES Holdings Brasil
BrasilianaParticipações
AES Uruguaiana
C 99.42%T 99.42%
AES Elpa
C 50.52%P 0.00%T 16.84%
C 14.38%P 37.40%T 28.33%
C 61.57%P 0.04%T 24.28%
AES Tietê Energia
BNDESPar
AES Eletropaulo
C 22.56%P 16.82%T 18.73%
AES Ergos
1 – Includes 7.9% of Eletrobras shares; 2 – Base Date: 06/22/2017 (FX rate 3.3362 BRL/1 USD).

10
Corporate GovernanceKey for Investment Decisions
Operational and Investment Management Committee: robust capital allocation process
Corporate policy of Integrated Risk Management assessed monthly by the Companies’ Executive Officers and quarterly by the Fiscal Council and Board of Directors
Listed in B3:- TIET11 (units): Level II of Corporate Governance
ISE: Corporate Sustainability Index- Tag along rights
High level of commitment with monthly Board of Directors meetings
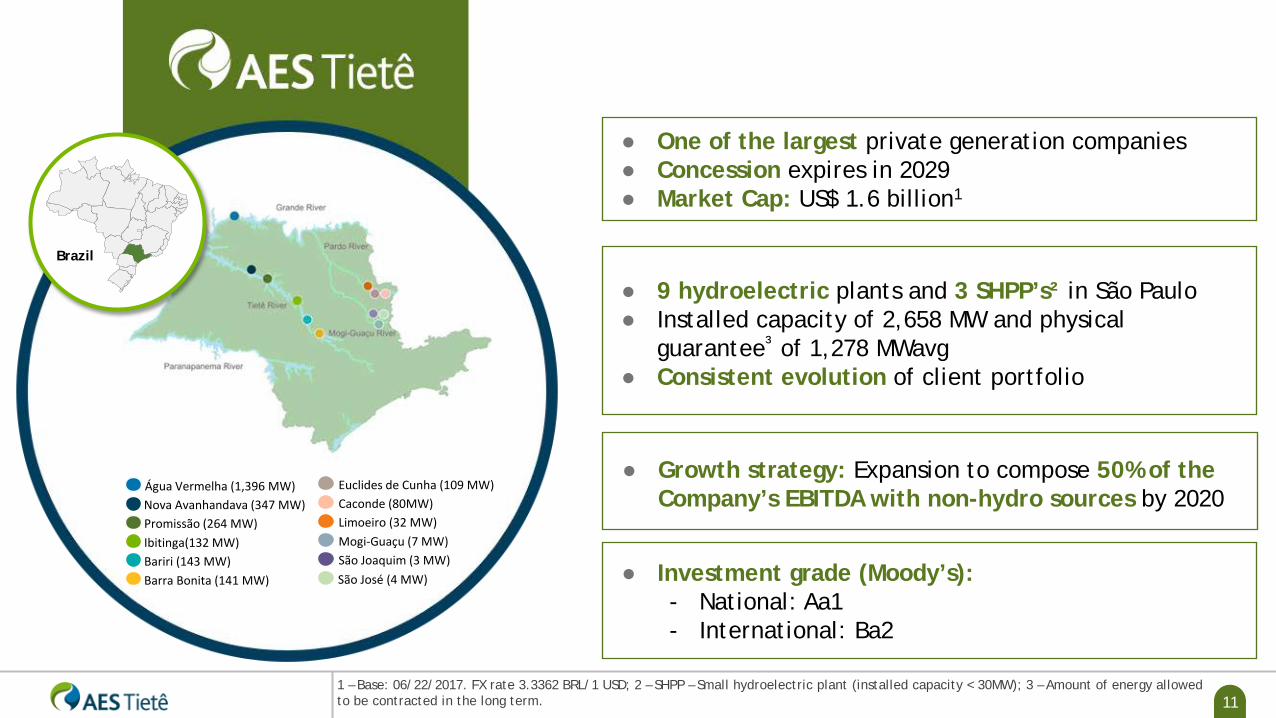
111 – Base: 06/22/2017. FX rate 3.3362 BRL/1 USD; 2 – SHPP – Small hydroelectric plant (installed capacity < 30MW); 3 – Amount of energy allowed to be contracted in the long term.
● One of the largest private generation companies● Concession expires in 2029● Market Cap: US$ 1.6 billion1
● 9 hydroelectric plants and 3 SHPP’s² in São Paulo● Installed capacity of 2,658 MW and physical
guarantee³ of 1,278 MWavg● Consistent evolution of client portfolio
● Investment grade (Moody’s):- National: Aa1- International: Ba2
Brazil
Água Vermelha (1,396 MW)Nova Avanhandava (347 MW)Promissão (264 MW)
Bariri (143 MW)Barra Bonita (141 MW)
Ibitinga(132 MW)
Euclides de Cunha (109 MW)Caconde (80MW)Limoeiro (32 MW)Mogi-Guaçu (7 MW)São Joaquim (3 MW)São José (4 MW)
● Growth strategy: Expansion to compose 50% of the Company’s EBITDA with non-hydro sources by 2020

12
Power plants modernization process, aiming for continuous improvement inoperational conditions and ensuring availability in its generation plants
Investment focused on power plants modernization
186 168
101 114
81
47
69 89
ActualExpected1
2014 2015 2018(e) 2019(e)2016 2020(e)2017(e) 2021(e)
Investment Program (in R$ million)
1 – Nominal terms.

13
Lower generated energy reflects ONS’ lower dispatch
1 – National System Operator; 2 – Generated energy divided by the amount of hours.
● Hydropower plants are dispatched by ONS1
● Dispatch is also related to hydrological conditions: − Low hydrology translates into low
generation levels
905848
1Q17
1,445
1,6751,492
1Q16
Generation - MWavgGeneration / Physical Guarantee
2014 20162015
117%
71%67%
117%
147%
Generated Energy (Mwavg²)

14
Level of reservoirs below the long term average
1 – Base date: Jan – May / 2017.
Historical Data since 2001
87%81% 89% 71%SIN’s Average
Annual Inflow:
20162014 2015 20171
2014 2015 2016 2017
0
2
4
6
8
10
12
14
16
18
0%
10%
20%
30%
40%
50%
60%
70%
80%
90%
Q1 Q22Q3 Q4 Q1 Q2 Q3 Q4 Q1 Q2 Q3 Q4 Q1 Q2 Q3 Q4 Q1 Q2 Q3 Q4 Q1 Q2 Q3 Q4 Q1
2011 2012 2013 2014 2015 2016 2017
Thermal Dispatch Reservoirs
Reservoirs (%) vs. Thermal Dispatch (GWavg)Historical Level of Brazilian Reservoirs (%)
4339 40 43 42 43 40
3429 23
20 2221 2330
35 37 3841
3632 29 28 29
4250
57 56 55 53 4944
3834 31 32
35 3839 40 42
0102030405060708090
100
Jan Feb Mar Apr May Jun Jul Aug Sep Oct Nov Dec

15
Out of order dispatch continues elevated
1 – Source: ONS (PEN 2016).
R$/MWh(Spot Price SE/MW
Thermal Dispatch out of the Order of Merit Thermal Dispatch in the Order of Merit + Inflexibility Total Thermal Dispatch Spot Price – SE/MW
411371
12116614783763836203227240
387388
805729593
807823
378216
388
GWavg¹
Increase in Thermal Dispatch out of Order of Merit
13
16 16 15
16 15 15
16 16 17 17 17 17 17 17 16 15
16 14 15
16 14
15 14 13
12 10
12 10 11 10
12 13 13 12
10 10 9 11
12 12
-
2
4
6
8
10
12
14
16
18
20
jan/14 mar/14 may/14 jul/14 sep/14 nov/14 jan/15 mar/15 may/15 jul/15 sep/15 nov/15 jan/16 mar/16 may/16 jul/16 sep/16 nov/16 jan/17 mar/17 may/17

16
Energy Reallocation Mechanism (ERM) for hydrological risk sharing
1– GE: Generated Energy; 2 – PG: Physical Guarantee; 3 – Enough to cover variable O&M costs.
Key drivers for hydrological risk● Generated Energy
(hydro) in the entire system (ERM) -influenced by hydrology
● Spot Price - marginal cost influenced by hydrology and thermal dispatch
AssuredEnergy
MREGenerated Energy
PG2
Genco A
1) Equilibrium (GE1 = PG2)
Buy at MRE3
PG2
Genco A
2A) Deficit (GE1 < PG2)
Buy at MRE3 Buy at Spot
PG2
Genco B
2B) Surplus (GE1 > PG2)
Sell at MRE3
Buy at Spot
AssuredEnergy
MREGenerated Energy
AssuredEnergy
MREGenerated Energy
- System GSF = 1.0- PPA = PG
- System GSF < 1.0- PPA = PG
- System GSF < 1.0- PPA = PG
● A physical guarantee (assured energy) is assigned to support contracts
● Energy dispatch optimized by centralized system operator (ONS) on a tight pool

17
Growth Perspectives
1 – Close to Água Vermelha HPP, an existing AES Tietê hydro power plant on the border of the states of Minas Gerais and São Paulo; 2 Business model considers the payment of the plant using the economy from the distribution consumption; 3 – According to ANEEL.
Natural Gas Power Plants & Cogen~1.5GW of dispatchable source
● 2 natural gas combined cycle power plants ready to go to energy auctions
● Cogeneration: distributed generation based on natural gas solutions
● Assessing M&A opportunities
Renewable EnergySolar and Wind
● 150 MW solar projects in São Paulo¹.
● Assessing M&A opportunities
● Distributed generation²: AES owns globally 104 MW and Brazil’s potential is 4.5 GW up to 2024³
Energy Storage
● AES Corp is the world leader in battery-based energy storage (patented system): Operations in 7 Countries (+476 MW capacity; + 10 years experience)
● Medium and large size systems: utilities and behind the meter (industrial and commercial)
18
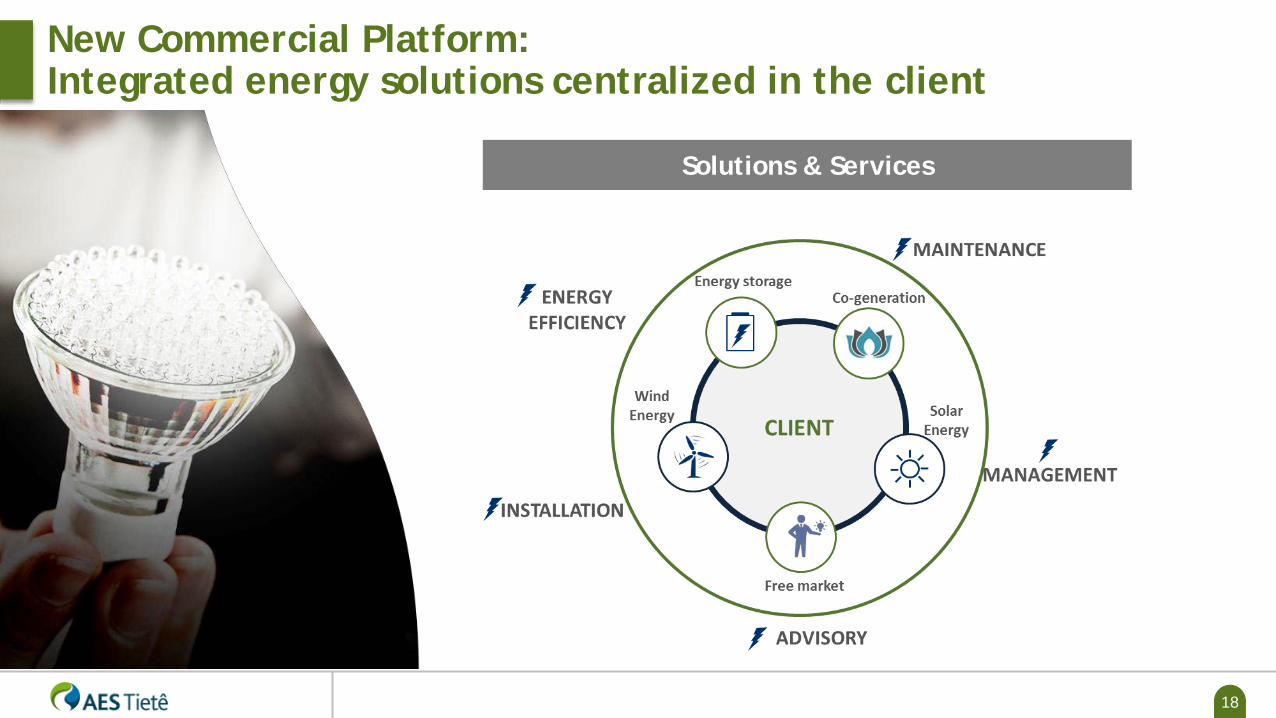
New Commercial Platform: Integrated energy solutions centralized in the client
Solutions & Services
19
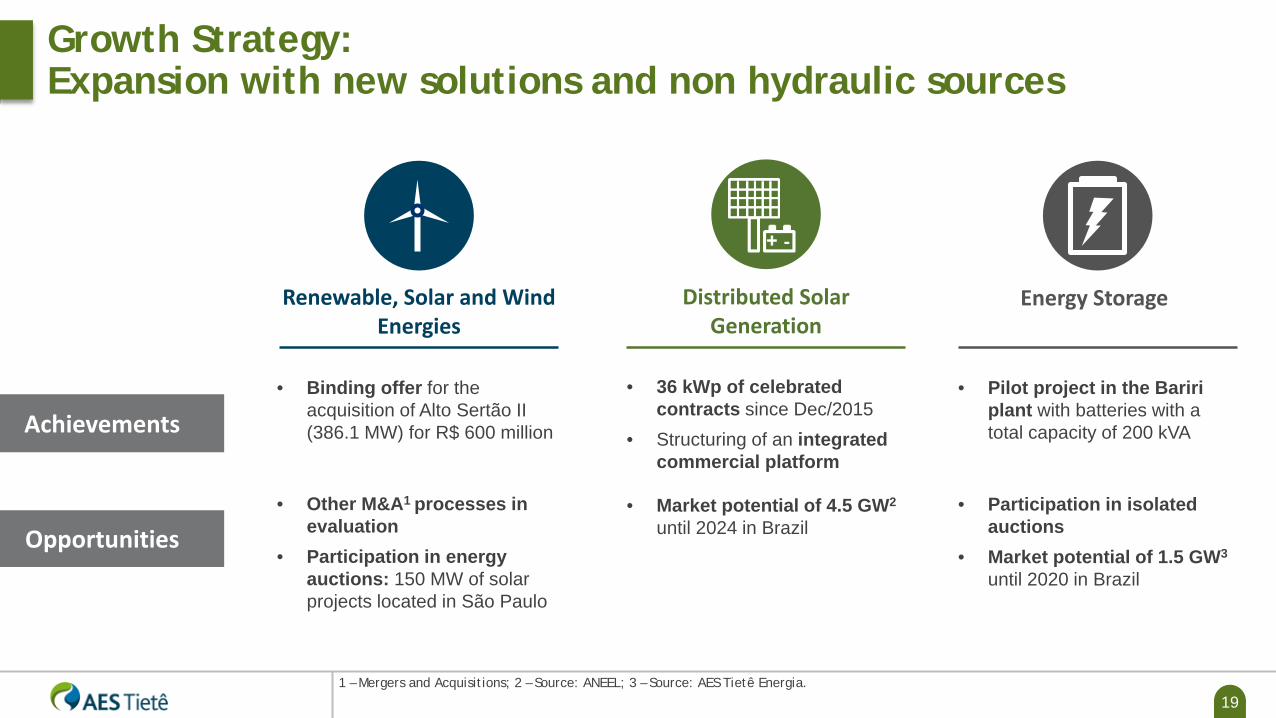
• Binding offer for the acquisition of Alto Sertão II (386.1 MW) for R$ 600 million
Distributed Solar Generation
• 36 kWp of celebrated contracts since Dec/2015
• Structuring of an integrated commercial platform
• Pilot project in the Baririplant with batteries with a total capacity of 200 kVA
Renewable, Solar and Wind Energies
Energy Storage
Achievements
Opportunities• Other M&A1 processes in
evaluation• Participation in energy
auctions: 150 MW of solar projects located in São Paulo
• Market potential of 4.5 GW2
until 2024 in Brazil• Participation in isolated
auctions• Market potential of 1.5 GW3
until 2020 in Brazil
Growth Strategy:Expansion with new solutions and non hydraulic sources
1 – Mergers and Acquisitions; 2 – Source: ANEEL; 3 – Source: AES Tietê Energia.

20
Acquisition:Purchase of Alto Sertão II Wind Park
Location: Caetité, Bahia
Installed Capacity: 386.1 MW
PPA’s: LER¹ 2010 (valid until 2033) / LEN² 2011 (valid until 2035)
Acquisition Price: R$ 600 million
Up to R$ 100 million as earn-out³
Assumption of R$ 1,150 million in debts
Pending Items: Creditor Approval
Alto Sertão II Wind Park
1 – Reserve Energy Auction; 2 – New Energy Auction; 3 – Addition of up to R$ 100 million as earn out depending on the park’s performance in comparison with a minimum reference.
21
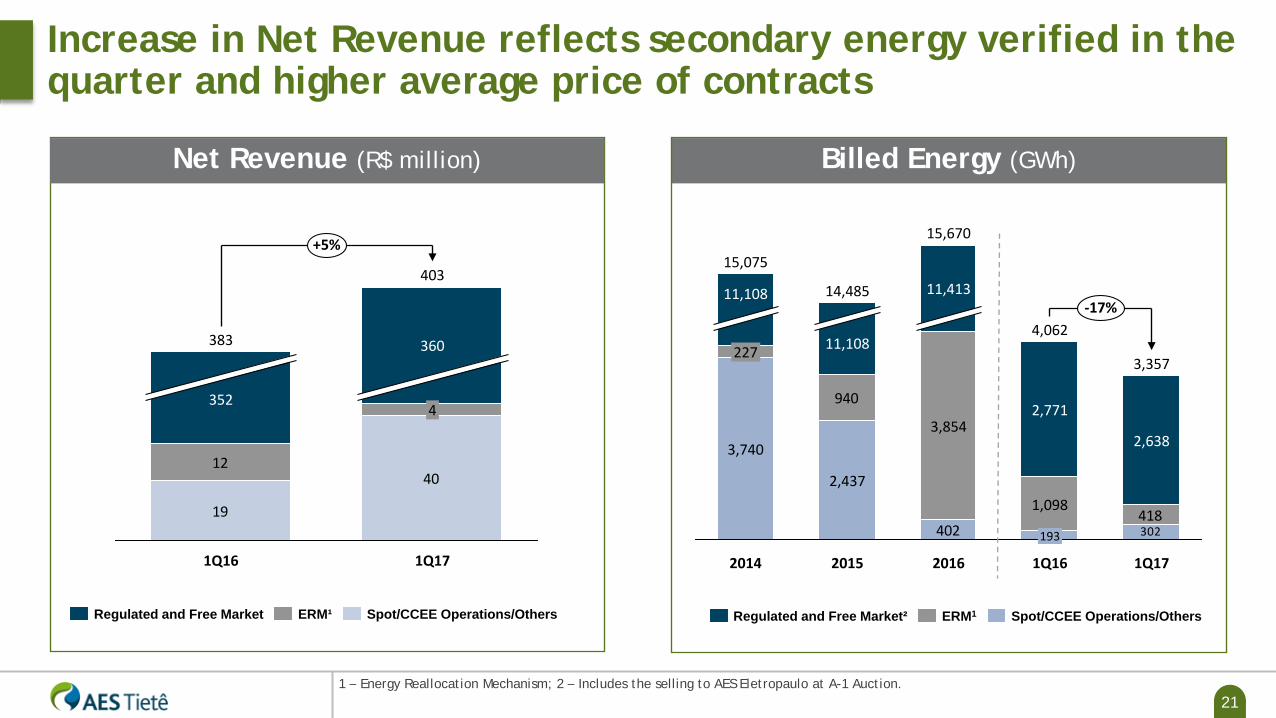
Increase in Net Revenue reflects secondary energy verified in the quarter and higher average price of contracts
1 – Energy Reallocation Mechanism; 2 – Includes the selling to AES Eletropaulo at A-1 Auction.
Spot/CCEE Operations/OthersERM¹Regulated and Free Market
19
4012
+5%
1Q17
403
4
360
1Q16
383
352
302402418
940
2014
3,740
15,075
15,670
11,108
11,413
2015
14,485
2016
2,437
3,854
227
11,108
4,062
2,771
1,098
3,357
193
1Q16
2,638
-17%
1Q17
Regulated and Free Market² ERM1 Spot/CCEE Operations/Others
Billed Energy (GWh)Net Revenue (R$ million)

22
Contracting environment and opportunities
1 – Free Consumers (Conventional free consumer - demand above 3MW and connected to a line of 69kV – and incentivized/ special free consumer - demand above 0.5MW).
2016and
beyond
Regulated Market Free Market Spot Market
Existing Energy Auctions
Distribution companies
Via auctions organized by federal government
Via bilateral agreements
Bilateral contracts
Free Consumers¹
Non contracted energy
CCEE Settlement
Exposed to Spot Market price

23
Free MarketDynamic and competitive market
Long Term Marginal Expansion CostRegulated Market price
Medium Term Supply and demand
Short term Spot price (hydrology and reservoirs)
Price Formation Methodology

24
Termination of electric energy agreement in 2017 and 2018 in order to mitigate the hydrological risk
1 – Conventional energy only excluding losses and internal consumption; including energy purchase agreements to mitigate the hydrological risks; energy sale agreements firmed on Mar/17; excludes the physical guarantee of the Limoeiro power plant (incentivized energy);2 – Actual values as of March 2017.
157 161 160 151 145Average price2
(R$/MWh)
911598
443
219287
600755
164
1,034
20212020201920182017
1,056
2016
1,178
66
Energy available for sale Own energy already sold
95% 83% 76% 50% 37%Contracting Level
129
14%
Client Portfolio¹ (MWavg)
25
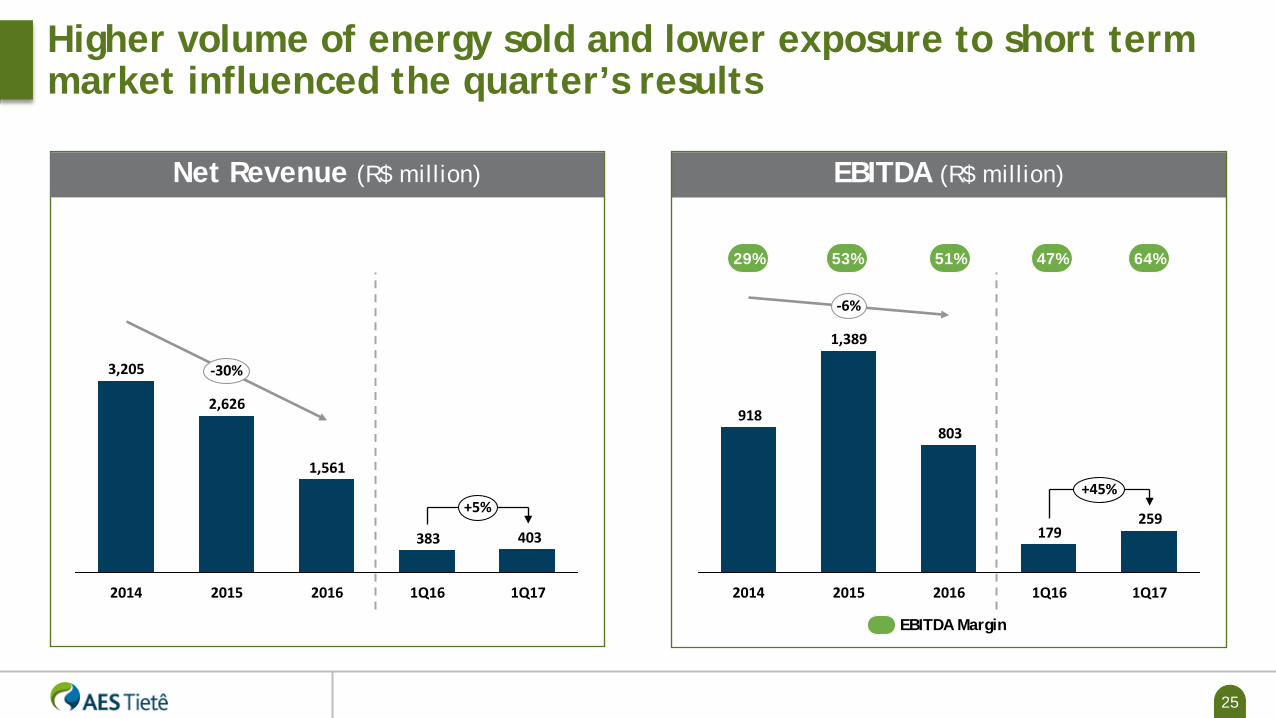
Higher volume of energy sold and lower exposure to short term market influenced the quarter’s results
EBITDA Margin
29% 53% 51%
403383
-30%
+5%
1Q171Q162016
1,561
2015
2,626
2014
3,205
259179
803918
1,389
2015 1Q16
+45%
-6%
1Q1720162014
47% 64%
EBITDA (R$ million)Net Revenue (R$ million)

26
And returns…
Minimum of 25% dividend payout of annual net income
according to bylaws
Distribution practice: quarterly basis
Average payout from 2008 to 2017¹: 108%
Average dividends since 2008: R$ 753 million/year
Management proposed the payment of R$ 133.3 million
in dividends for 1Q17
- Dividend yield of 2.3% and payout of 105.8%
12674
359
739
449
-11%
1Q172015 20162014 1Q16
+69%
Net Income (R$ million) & Dividend Distribution¹
1 – Does not consider Interest on Shareholders’ Equity; 2 – Until 1Q17.

27
Low leverage level…
1 – Adjusted to debt service; 2 – Flow comprised of principal amortization, accrued interests and balance of deferred amounts, as per "Explanatory Note 13" of the Company's Quarterly Financial Information. For 2018 considers debt classified as current liabilities.
Debt Amortization Schedule2Net Debt (R$ million)
743688
1Q17
0.8
1Q16
0.6
Net DebtNet Debt / Adjusted EBITDA¹
179
422
261
334
278
2021-20232019 202020182017
Amortization (R$ million)
Covenants• Net Debt / Adjusted EBITDA < 3.50x• Adjusted EBITDA / Financial Expenses > 1.75x
Debt Cost 1Q16 1Q17• Average cost (% CDI) 107% 114%• Average term (years) 2.7 2.5• Effective rate 14.9% 12.0%
28
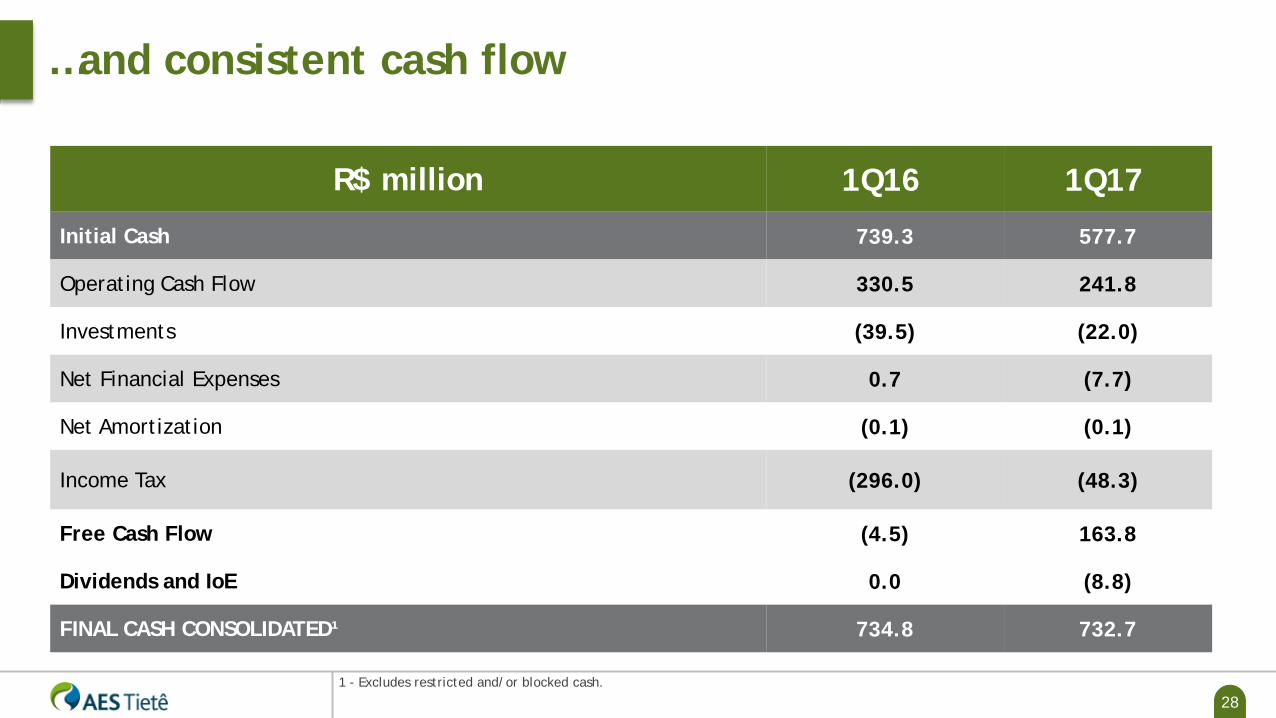
…and consistent cash flow
1 - Excludes restricted and/or blocked cash.
R$ million 1Q16 1Q17
Initial Cash 739.3 577.7
Operating Cash Flow 330.5 241.8
Investments (39.5) (22.0)
Net Financial Expenses 0.7 (7.7)
Net Amortization (0.1) (0.1)
Income Tax (296.0) (48.3)
Free Cash Flow (4.5) 163.8
Dividends and IoE 0.0 (8.8)
FINAL CASH CONSOLIDATED¹ 734.8 732.7

29
40
60
80
100
120
140
Feb-13 May-13 Aug-13 Nov-13 Feb-14 May-14 Aug-14 Nov-14 Feb-15 May-15 Aug-15 Nov-15 Feb-16 May-16 Aug-16 Nov-16 Feb-17 May-17
GETI4 GETI3 IEE IBOV TSR - GETI4 TIET11 TSR - TIET11
Capital Markets
1 – Base 100: from 01/01/2012 to 06/22/2017; 2 – Total Shareholders’ Return; 3 – Base date: 06/22/2017. FX rate 3.3362 BRL; 4 – Government program to reduce energy tariffs.
I
Market cap³: US$ 1.6 billion / R$ 5.4 billion
B3: TIET3 (common shares), TIET4 (preferred shares) and TIET11 (units)
Restricted ADR program (Reg “S” and 144-A)
Feb/2013: High thermoelectric dispatch to conserve water in the reservoirs increase spot pricesAug/2013: 2Q13 results above consensus due to higher-than-expected spot prices
Nov/2013: weak 3Q13 results affected by seasonality strategy
Feb/2014: 4Q13 results slightly below consensus but market show high expectations on 2014 commercialization strategy
May/2014: 1Q14 EBITDA above expectation benefited from seasonality strategy
A
B
C
D
E
Jan/2015: Hydrology for rainy season worse than expected
F
Dec/2015: Corporate Restructuring concluded
AES Tietê Energia x IEE x Ibovespa¹
G
H May/2016: AES Tietê’s stock returned to the MSCI Index
FE G HA CB I
I Aug/2016: Capital Increase
Oct/2016: Conclusion of Capital IncreaseJ
D J
Jan/2017: Company announced the offer to acquire Alto Sertão II Wind Park
K
K
May/2017: Political Event in BrazilL
L

30
● Asset Management - ISO 55001 certification, 1st Generation company in America
● AES Tietê Energia has been included in the Corporate Sustainability Index (ISE) since 2007
● Attractive returns to investors. Strong cash generation; Maximization of payout
● Cost efficiency and optimized capital allocation
● Established risk management capability
We have strong capabilities and corporate governance

31
AES BrasilInvestor Relations
Website:ri.aestiete.com.br
Phone: + 55 11 2195-7048Fax: + 55 11 2195-1004
Ave. Dr. Marcos Penteado de Ulhôa Rodrigues, 939 - 7th floorBarueri - SP – BrazilZIP code: 06460-040