approximately a thousand_ultra_difuse_galaxies_in_the_coma_cluster
TRANSCRIPT
Accepted for publication in ApJ LettersPreprint typeset using LATEX style emulateapj v. 5/2/11
APPROXIMATELY A THOUSAND ULTRA DIFFUSE GALAXIES IN THE COMA CLUSTER
Jin Koda1, Masafumi Yagi2,3, Hitomi Yamanoi2, Yutaka Komiyama2,4
Accepted for publication in ApJ Letters
ABSTRACT
We report the discovery of 854 ultra diffuse galaxies (UDGs) in the Coma cluster using deep R bandimages, with partial B, i, and Hα band coverage, obtained with the Subaru telescope. Many of them(332) are Milky Way-sized with very large effective radii of re > 1.5 kpc. This study was motivated bythe recent discovery of 47 UDGs by van Dokkum et al. (2015a); our discovery suggests > 1, 000 UDGsafter accounting for the smaller Subaru field (4.1 degree2; about 1/2 of Dragonfly). The new SubaruUDGs show a distribution concentrated around the cluster center, strongly suggesting that the greatmajority are (likely longtime) cluster members. They are a passively evolving population, lying alongthe red sequence in the color-magnitude diagram with no signature of Hα emission. Star formationwas, therefore, quenched in the past. They have exponential light profiles, effective radii re ∼ 800 pc-5 kpc, effective surface brightnesses µe(R) =25-28 mag arcsec−2, and stellar masses ∼ 1 × 10⁷M -5 × 10⁸M. There is also a population of nucleated UDGs. Some MW-sized UDGs appear closer tothe cluster center than previously reported; their survival in the strong tidal field, despite their largesizes, possibly indicates a large dark matter fraction protecting the diffuse stellar component. Theindicated baryon fraction . 1% is less than the cosmic average, and thus the gas must have beenremoved (from the possibly massive dark halo). The UDG population is elevated in the Coma clustercompared to the field, indicating that the gas removal mechanism is related primarily to the clusterenvironment.Subject headings: galaxies: clusters: individual (Coma) – galaxies: evolution – galaxies: structure
1. INTRODUCTION
This study is motivated by the discovery of 47 ul-tra diffuse galaxies (UDGs) in the Coma cluster by vanDokkum et al. (2015a) using the Dragonfly Telescope Ar-ray (Abraham & van Dokkum 2014, hereafter Dragon-fly). This unexpected discovery revealed a new popu-latoin of low surface brightness (SB) galaxies. Indeed,their central SBs are very low 24-26 mag arcsec−2 in g-band and their median stellar mass is only ∼ 6×10⁷M,despite their effective radii re = 1.5-4.6 kpc being as largeas those of L∗ galaxies (e.g., ∼ 3.6 kpc for the Milky Way(MW), calculated from Rix & Bovy 2013). van Dokkumet al. (2015a) speculated that the UDGs probably havevery high dark matter fractions as they have survived inthe strong tidal field of the cluster.
Dragonfly is optimized to efficiently discover faintstructures over a large field of view, but has relativelypoor spatial resolution with seeing and pixel scales of∼ 6′′ and 2.8′′, respectively. The above properties ofthe Dragonfly UDGs were derived after their discoveryfrom archival Canada France Hawaii Telescope imaging.Follow-up studies are needed to understand their natureand origin, as well as their relationship to the cluster en-vironment (Boselli & Gavazzi 2014, for review) and toother more studied galaxy populations, such as dwarfs
[email protected] Department of Physics and Astronomy, Stony Brook Univer-
sity, Stony Brook, NY 11794-38002 Optical and Infrared Astronomy Division, National Astro-
nomical Observatory of Japan, 2-21-1 Osawa, Mitaka, Tokyo,181-8588, Japan
3 Department of Advanced Sciences, Hosei University, 3-7-2,Kajinocho, Koganei, Tokyo, 184-8584 Japan
4 SOKENDAI (The Graduate University for Advanced Stud-ies), Mitaka, Tokyo, 181-8588, Japan
and low SBs, in clusters (e.g., Binggeli & Cameron 1991;Bothun et al. 1991; Ulmer et al. 1996, 2011; Adami et al.2006b, 2009; Lieder et al. 2012; Ferrarese et al. 2012).
Optical telescopes of larger aperture are advantageousfor a resolved study of this population. Yamanoi et al.(2012) used the Subaru Prime Focus Camera (Suprime-Cam; Miyazaki et al. 2002) on the Subaru telescope andderived a galaxy luminosity function down to MR ∼ −10in Coma. Their three 34′ × 27′ fields include nine Drag-onfly UDGs. All of the nine were easily found in theircatalog, being resolved spatially in the images. There-fore, Subaru imaging can identify this new galaxy pop-ulation efficiently and permits an investigation of theirinternal properties. Several archival Subaru images areavailable for the Coma cluster (Yagi et al. 2007; Yoshidaet al. 2008; Yagi et al. 2010; Okabe et al. 2010, 2014). Inthis Letter, we use the archival Subaru data and reportthe discovery of 854 UDGs, implying ∼ 1000 UDGs afterscaling for the Dragonfly field-of-view.
We adopted m −M = 35.05 (Kavelaars et al. 2000)as the distance modulus of the Coma cluster, which cor-responds to an angular diameter distance of 97.5 Mpc(1′′ = 0.47 kpc) 5. The full catalog of the Subaru UDGswill be published in Yagi et al. (in preparation). We usethe AB-magnitude system in this work.
2. DATA
The raw R band images from the Suprime-Cam wereobtained from the Subaru data archive (Baba et al.2002). Suprime-Cam has a mosaic of ten 2048 × 4096CCDs and covers a wide field of 34′×27′ with a pixel scaleof 0.202′′. An eighteen-pointing mosaic with Suprime-
5 We adopted the Cosmological parameters of (h0,ΩM ,Ωλ)=(0.71, 0.27,0.73) from Larson et al. (2011).
arX
iv:1
506.
0171
2v1
[as
tro-
ph.G
A]
4 J
un 2
015

2 Jin Koda
04:00.0 02:00.0 13:00:00.0 58:00.0 56:00.0 12:54:00.029
:00:
00.0
30:0
0.0
28:0
0:00
.030
:00.
027
:00:
00.0
Right ascension
Dec
linat
ion
500 kpc
04:00.0 02:00.0 13:00:00.0 58:00.0 56:00.0 12:54:00.0
29:0
0:00
.030
:00.
028
:00:
00.0
30:0
0.0
27:0
0:00
.0
Right ascension
Dec
linat
ion
500 kpc
(a) (b)
Fig. 1.— The 2.86 deg×2.90 deg (∼ 4.87 × 4.94 Mpc2) area centered on the Coma cluster, the same area as in Figure 1 of van Dokkumet al. (2015a). (a) Image from the Digitized Sky Survey. The white borders show the 18 fields covered in the Subaru R band (Okabe et al.2014), which have the total area of 4.1 degree2, about 1/2 of the Dragonfly coverage. Red indicates the area analyzed by Yamanoi et al.(2012). Yellow outlines the area analyzed by Yagi et al. (2010) using the Subaru B, R, Hα, i bands. Cyan indicates the area in Figure 2.The center of the cluster (αJ2000,δJ2000)=(12:59:42.8,+27:58:14) is marked with a green cross (White et al. 1993). (b) The same area as in(a), showing the distribution of the 854 Subaru UDGs (circles). The MW-sized UDGs, with large effective radii (> 1.5 kpc), are shown inblue. The Subaru field coverage in R is enclosed with the solid line. The 47 Dragonfly UDGs are indicated with red crosses.
Cam was taken by Okabe et al. (2014) and covered about4.1 deg2 (Figure 1). The seeing was 0.6-0.8′′, typically0.7′′. Integration times for the 18 fields were not thesame, resulting in variations in background noise, i.e.,28.3-28.7 mag arcsec−2 (1σ) in a 2′′ aperture (equivalentto 30.0-30.4 mag arcsec−2 in a 10′′ aperture, ∼ 1 magdeeper than van Dokkum et al. 2015a). The very cen-tral field has a higher variation of 27.8 mag arcsec−2 sincethe field is contaminated by the outer envelope of brightgalaxies.
The data were reduced in a standard way (Yagi et al.2002, 2010). We used self-sky flat images, subtracted skybackground locally in each small grid (256 × 256 pixel2;51.7′′ × 51.7′′), used the WCSTools (Mink 2002) for as-trometry, and applied a photometric calibration (Yagiet al. 2013) using the Sloan Digital Sky Survey (SDSS)-III DR9 catalog (Ahn et al. 2012). The grid size for thebackground subtraction was larger than the expected sizeof UDGs (< 30′′ ∼ 15 kpc). The Galactic extinction inR band varies from 0.016 to 0.031 mag across the 18-field mosaic (Schlafly & Finkbeiner 2011). We adoptedthe Galactic extinction value at the center of each fieldand neglected variation within each field. The final pho-tometric error is . 0.1 mag. More details of the datareduction procedure will be presented in Yagi et al. (inpreparation). In addition, we used the Suprime-Cam B,i, and Hα reduced images (see Figure 1) by Yagi et al.(2010) and Yamanoi et al. (2012).
We also analyzed a control field for comparison. TheR band data of one Suprime-Cam pointing, 1/18 of theComa field, were taken from the Subaru Deep Field
(SDF) project (Kashikawa et al. 2004). We used onlya part of the raw SDF exposures taken in June 2008 tomake the background noise comparable to that in theComa fields. The 1σ background noise in a 2′′ apertureis 28.6 mag arcsec−2. For consistency we started from theraw data and matched data reduction parameters.
3. IDENTIFICATION
Our goal is to find UDGs in the Subaru images. Fortyof the 47 UDGs discovered by Dragonfly are within theSubaru R band coverage based on their coordinates (vanDokkum et al. 2015a). All were detected significantly(with the faintest one, DF27, off by 12.5′′ from the pub-lished coordinate) and their structures were resolved inthe Subaru images. The detection threshold was approx-imately 27.3 mag arcsec−2 in the R band. We describeour selection procedure for the final catalog of 854 UDGsin the Coma cluster. We found no counterparts in thecontrol field.
We ran SExtractor (version 2.19.5; Bertin & Arnouts1996) on individual mosaic frames with a fixed de-tection threshold of 27.3 mag arcsec−2 in R. We re-moved a first set of spurious detections using SExtrac-tor’s ”FLAGS < 4” and ”PETRO RADIUS > 0”. Thisinitial catalog had 2,627,495 objects, including dupli-cates in the overlap regions of adjacent mosaic frames(∼ 30 %). We used the Dragonfly UDGs as the fidu-cial set in adjusting parameters for selection of UDGcandidates, but could not use exactly the same selec-tion criteria as van Dokkum et al. (2015a) due to thedifference in image quality. We applied constraints onR magnitude and size, ”18 < MAG AUTO < 26” and
Ultra Diffuse Galaxies in Coma Cluster 3
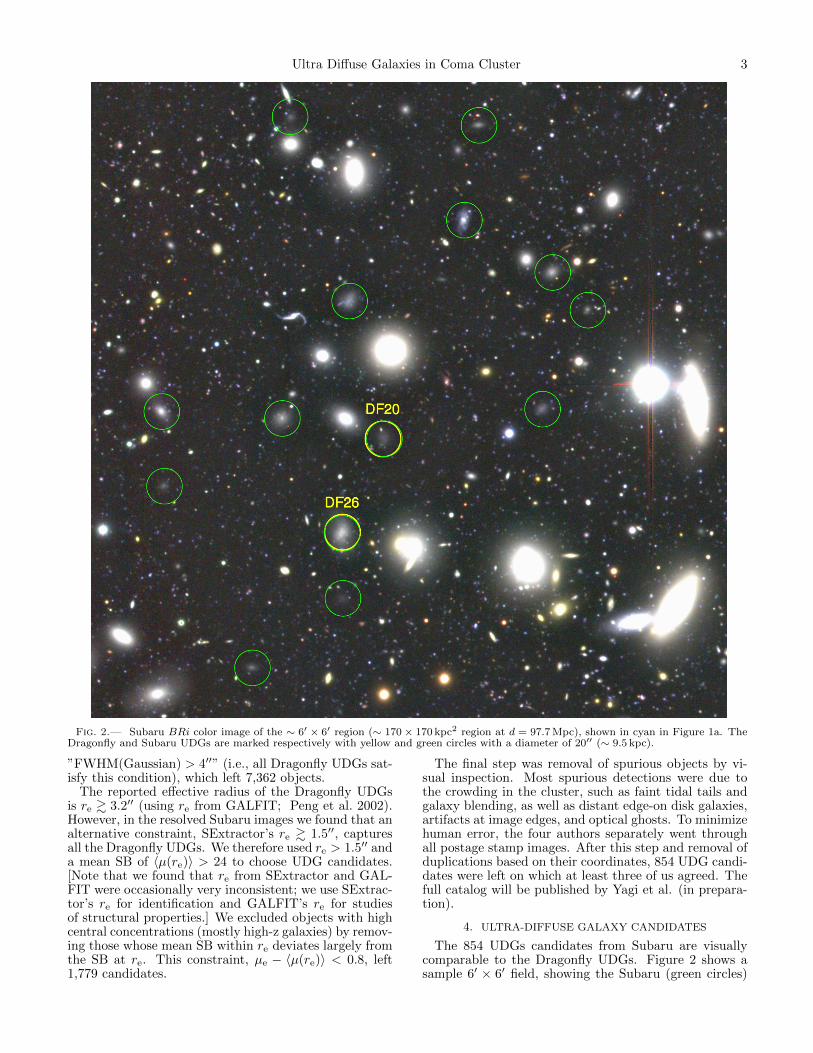
Fig. 2.— Subaru BRi color image of the ∼ 6′ × 6′ region (∼ 170 × 170 kpc2 region at d = 97.7 Mpc), shown in cyan in Figure 1a. TheDragonfly and Subaru UDGs are marked respectively with yellow and green circles with a diameter of 20′′ (∼ 9.5 kpc).
”FWHM(Gaussian) > 4′′” (i.e., all Dragonfly UDGs sat-isfy this condition), which left 7,362 objects.
The reported effective radius of the Dragonfly UDGsis re & 3.2′′ (using re from GALFIT; Peng et al. 2002).However, in the resolved Subaru images we found that analternative constraint, SExtractor’s re & 1.5′′, capturesall the Dragonfly UDGs. We therefore used re > 1.5′′ anda mean SB of 〈µ(re)〉 > 24 to choose UDG candidates.[Note that we found that re from SExtractor and GAL-FIT were occasionally very inconsistent; we use SExtrac-tor’s re for identification and GALFIT’s re for studiesof structural properties.] We excluded objects with highcentral concentrations (mostly high-z galaxies) by remov-ing those whose mean SB within re deviates largely fromthe SB at re. This constraint, µe − 〈µ(re)〉 < 0.8, left1,779 candidates.
The final step was removal of spurious objects by vi-sual inspection. Most spurious detections were due tothe crowding in the cluster, such as faint tidal tails andgalaxy blending, as well as distant edge-on disk galaxies,artifacts at image edges, and optical ghosts. To minimizehuman error, the four authors separately went throughall postage stamp images. After this step and removal ofduplications based on their coordinates, 854 UDG candi-dates were left on which at least three of us agreed. Thefull catalog will be published by Yagi et al. (in prepara-tion).
4. ULTRA-DIFFUSE GALAXY CANDIDATES
The 854 UDGs candidates from Subaru are visuallycomparable to the Dragonfly UDGs. Figure 2 shows asample 6′ × 6′ field, showing the Subaru (green circles)

4 Jin Koda
and Dragonfly UDGs (yellow). Their low SBs are evidentcompared to the surrounding galaxies, including ma-jor galaxies in the cluster and distant background ones.Their large sizes are also clear when compared to the20′′ diameter of the circles (∼ 9.5 kpc at d = 97.5 Mpc).The greater number of detections, compared to Dragon-fly, may be due to the superior seeing (less blending) andhigher signal-to-noise ratio.
The majority of the 854 candidates are most likelyUDGs in the Coma cluster. One of them has beenspectroscopically confirmed as a cluster member (vanDokkum et al. 2015b). The control SDF field has vir-tually no counterparts – only thirteen were left after theSExtractor-based selection, twelve of which were obvi-ous image artifacts or tails of bright galaxies. The lastone appeared to be a blend of multiple objects. Hence,contamination by non-cluster members is rare and neg-ligible. Note, however, that some negligible number ofcontaminations might still exist. For example, the thirdobject from the top in Figure 2 may be a backgroundspiral galaxy. Despite this significantly increased sam-ple, the UDGs are still a minor population in the Comacluster (Yamanoi et al. 2012).
In the literature, we found that many of the SubaruUDGs had been cataloged albeit as more compact ob-jects; Adami et al. (2006a) found 248 of 309 that laywithin their coverage, and Yamanoi et al. (2012) 232 of240. Among them, only 17 were classified as low SBgalaxies (Adami et al. 2006b). Their large extents andlow SBs were revealed for the first time in this study. Wenote that eleven out of the 12 Dragonfly UDGs withintheir field were also cataloged in Adami et al. (2006a),but none were classified as low SB (Adami et al. 2006b).
5. STRUCTURAL PARAMETERS
The GALFIT package was used to measure the struc-tural parameters of the Subaru UDGs. The fits weremade with a single Sersic profile (Sersic 1968) with skybackground fixed. We used SExtractor’s segmentationimages to mask surrounding objects. Seventy-nine ofthe 854 required additional manual masks to exclude abright compact object(s) within their boundaries – inter-estingly, sixty-seven of these appear to have compact nu-clei at their centers. We judged the fits acceptable basedon the goodness-of-fit (χ2
ν < 1; 75 objects were thus ex-cluded) and consistency between GALFIT and SExtrac-tor measurements (re from GALFIT and SExtractor con-sistent within a factor of 3; 11 removed). In this section,we use the sample of 768 objects with good GALFIT re-sults, out of which 332 have GALFIT’s re > 1.5 kpc (i.e.,MW-sized UDGs as defined in van Dokkum et al. 2015a).We refer to the former full set of galaxies as UDGs, andthe latter as MW-sized UDGs. Figure 3 shows some ex-amples of GALFIT results for the UDGs of lowest SB, oflargest-size, and with a compact nucleus.
Figure 4(a), (b), and (c) show histograms of Sersic in-dex (n), axis ratio (b/a), and central SB (µ0(R)). Forboth UDGs and MW-sized UDGs, their average Ser-sic indices 〈n〉 = 0.9-1.0 indicate an exponential pro-file. The distributions of axis ratio, as well as its av-erage 〈b/a〉 = 0.7-0.8, are skewed toward a large value;therefore, this UDG sample does not consist of randomly-oriented thin-disk galaxies in a statistical sense (whichwould skew their distribution toward a low b/a). The
µ0(R) ranges around 23-26 mag arcsec−2. These resultsare consistent with van Dokkum et al. (2015a) when thedifference in the adopted bands, SDSS g and Subaru R,is taken into account (roughly g − R ∼0.8 mag for thered-sequence in Coma).
The Subaru UDGs are likely an extension of normaland dwarf galaxy populations and are not, on their own,a distinct population. Figure 4(d) shows the propertiesof the UDGs (crosses) with respect to normal galaxiesin Coma (circles; from Komiyama et al. 2002). Theapparent R magnitude of the UDGs is 18 to 24 mag, in-dicating an absolute magnitude of about -12 to -16 magat the Coma distance. The smallest and faintest UDGs(e.g., re < 1 kpc and MR < −12 in Figure 4c) over-lap with the largest and brightest dwarf galaxies andshare some properties in common with them (e.g., theexponential profile, nucleated population; see Tolstoyet al. 2009; McConnachie 2012; Boselli & Gavazzi 2014).Dotted lines represent constant SBs (µes) from 23 to 29mag arcsec−2 with a 1 mag arcsec−2 interval, assumingan exponential profile. The average SB of the SubaruUDGs is distributed from about 25 mag arcsec−2 (i.e.,a cut-off due to the selection) to 28 mag arcsec−2 (dueto the detection limit; this lower boundary is lower thanthe pix-to-pix detection limit, because the UDGs are ex-tended).
The absolute magnitudes correspond to stellar massesof 1×10⁷M-5×10⁸M if we adopt a mass-to-light ratioof M/LR ∼ 3. Note the M/LR varies by a factor of ∼ 2for ages of 4-12 Gyr and metallicities between 0.2-1.0solar based on calculations using Starburst99 (Leithereret al. 1999), a single starburst, and a Kroupa initial massfunction.
6. A PASSIVELY-EVOLVING POPULATION
The UDGs are distributed widely over the entire areaof the cluster with a concentration toward its center (Fig-ure 1b). This spatial correlation also supports the as-sumption that the great majority are cluster members.Figure 1 nearly covers the virial radius of the cluster(∼ 2.8 Mpc; ∼ 1.7 deg; Kubo et al. 2007), and revealstheir relatively symmetric distribution around the cen-ter with a potential elongation toward the south west(roughly toward NGC 4839). This symmetric, wide-spread distribution may indicate their long history withinthe cluster.
The UDGs closely follow the red-sequence of apassively-evolving galaxy population on the color-magnitude diagram. 232 UDGs are in the catalog of Ya-manoi et al. (2012) with both B and R photometry. Fig-ure 5 shows their distribution (green). The comparisondata (red and blue) show other cluster member galaxies,as well as background galaxies, and are also from Ya-manoi et al. (2012). The red-sequence is evident, andthe solid line is a fit by Yamanoi et al. (2012). Clearly,the UDGs lie along this red-sequence, and their B-Rcolors are around 0.8-1.0 mag. This is similar to thetrends found among dwarfs and low SB galaxies in clus-ters (Adami et al. 2009; Ulmer et al. 2011; Lieder et al.2012).
No significant Hα excess was found in UDGs. 217UDGs are within the Subaru Hα coverage (yellow inFigure 1a), which was designed to detect faint Hα emis-sion around Coma member galaxies (Yagi et al. 2010).

Ultra Diffuse Galaxies in Coma Cluster 5
R-band
GALFIT
Residual
Largest Size Lowest Surface Brightness Nucleated
Fig. 3.— Examples of GALFIT results drawn from the groups of largest-size UDGs, lowest surface-brightness UDGs, and nucleatedUDGs.
AllMedian : 0.74Average: 0.72Std.dev: 0.16
re>1.5kpc
Median : 0.71Average: 0.69Std.dev: 0.16
AllMedian : 0.83Average: 0.88Std.dev: 0.30
re>1.5kpcMedian : 0.91Average: 0.99Std.dev: 0.34
(a)
(b)
25 mag arcsec-2
29 mag arcsec-2
FWHM 1.5”
FWHM 0.7”
01-51-02--1
-0.5
0
0.5
1
1.5 kpc
(c) All
Median : 24.5Average: 24.6
Std.dev: 0.9
re>1.5kpcMedian : 24.3Average: 24.3
Std.dev: 0.9
(d)
Fig. 4.— Structural properties of UDGs. (a) Histograms of Sersic index n, (b) axis ratio b/a, and (c) central SB µ0(R) with theirmedians, averages, and standard deviations. Black lines are for all 854 UDGs, while blue are for 332 MW-sized UDGs alone. (d) Effectiveradius vs. R magnitude. The parameters of the UDGs (crosses; red for the Dragonfly UDGs) are derived with GALFIT. Normal galaxies(circles) –spestroscopically-confirmed Coma members (Mobasher et al. 2001) – are also plotted for comparison (from Komiyama et al.2002, with the conversion R(AB)-R(Vega)=0.21). Dotted, diagonal lines show constant SBs (µes) from 23 to 29 mag arcsec−2 with a 1mag arcsec−2 interval for the case of an exponential profile (note µ0 = µe − 1.82 for n = 1). The gap between the normal galaxies andUDGs is due to selection effects. Horizontal lines show re of PSF with a FWHM of 1.5 arcsec (Komiyama et al. 2002) and a FWHM of0.7 arcsec (this study).

6 Jin Koda
Therefore, the UDGs are not forming stars at the cur-rent epoch, as expected for passively-evolving galaxies.
7. DISCUSSIONS
We report the discovery of ∼ 1000 UDGs in the Comacluster, about 40% of which are MW-sized. The newUDG sample is by no means complete, but alreadycontains 10-20 times more than previously known (vanDokkum et al. 2015a). None of the UDGs show a sig-nature of tidal distortions; this is our selection criteria,but indicates that this sample of UDGs are not likelyrecently-disrupted tidal debris.
The UDG population, compared to brighter galaxies,is elevated in the Coma cluster, although a small num-ber of large, low-SB galaxies are known in the field (Dal-canton et al. 1997; Impey et al. 2001; Burkholder et al.2001). f the UDG-to-brighter galaxy number ratio inComa were common in the field, the expected UDG pop-ulation would be implausibly large, & 105 within 100Mpc of the MW. To obtain this rough estimate, we used,as a reference, galaxies in the SDSS (Ahn et al. 2012)within 16 < r < 17 mag (−19 < Mr < −18 in ab-solute magnitude) at the cluster’s redshift of 0.013-0.033(Mobasher et al. 2001). The number of reference galaxiesin the field was estimated from the luminosity functionof Blanton et al. (2001). The estimated number in thefield, & 105, is crude, but seems too large compared tothe small number discovered so far. The cluster environ-ment must play a role in their formation and evolution.
van Dokkum et al. (2015a) speculated that the MW-sized UDGs might be a dark-matter (DM) dominatedpopulation in order for them to survive in the strongtidal field around the cluster core. In fact, the DragonflyUDGs spatially avoided the central r ∼300 pc region asif the ones there had been tidally disrupted; this appar-ent disruption was used to constrain the DM fraction (aslarge as & 98%; van Dokkum et al. 2015a). Surprisingly,we found UDGs even closer to the core (Figure 1b), andthe closest one is MW-sized only about 3′ (∼ 85 kpc)
away on the sky. Eleven UDGs were found within a ra-dius of 5′ (∼ 141 kpc). These detections were, of course,not complete due to the high background emission there,and their apparent proximity may result from a chancecoincidence along a line of sight. If any of them arewithin ∼ 100-150 kpc from the core, an even larger DMmass than the estimate by van Dokkum et al. (2015a) isnecessary, and the baryon fraction within a tidal radiusshould be . 1%. This is below the cosmic average, andtherefore, the baryons must have been removed from thepossibly very deep DM potential.
The possible removal of the gas, and quenching ofstar formation (SF), are consistent with their red colorand clustering in Coma (indicating their longevity withinthe cluster). The red-sequence can be produced by ametallicity-sequence if galaxies have been evolving pas-sively since SF was quenched (Kodama & Arimoto 1997).Physical processes often suggested for the quench in-clude (see Boselli & Gavazzi 2014, for review): (a)blow out of gas due to galactic winds from supernovaeor AGN activities (Dekel & Silk 1986; Arimoto & Yoshii1987), (b) ram-pressure stripping (Gunn & Gott 1972),(c) tidal-interaction and harassment (Moore et al. 1996),and (d) starvation due to the cessation of gas infall (Lar-son et al. 1980). The elevated population in the clusterindicates that environmentally-driven mechanisms, suchas (a), (b), and (c) are the most likely solutions [(a) mayoccur if SF is induced by (b) or (c).].
We thank Alessandro Boselli, Samuel Boissier, JimBarrett, and an anonymous referee for helpful comments.This research utilized facilities and resources providedby the National Astronomical Observatory of Japan(NAOJ), including the Subaru Telescope, the SMOKAdata archive system, and computers at the AstronomyData Center. JK acknowledges support from NASAgrant NNX14AF74G and NSF grant AST-1211680.
REFERENCES
Abraham, R. G., & van Dokkum, P. G. 2014, PASP, 126, 55Adami, C., Pello, R., Ulmer, M. P., et al. 2009, A&A, 495, 407Adami, C., Scheidegger, R., Ulmer, M., et al. 2006a, A&A, 459,
679Adami, C., Picat, J. P., Savine, C., et al. 2006b, A&A, 451, 1159Ahn, C. P., Alexandroff, R., Allende Prieto, C., et al. 2012, ApJS,
203, 21Arimoto, N., & Yoshii, Y. 1987, A&A, 173, 23Baba, H., Yasuda, N., Ichikawa, S.-I., et al. 2002, Report of the
National Astronomical Observatory of Japan, 6, 23Bertin, E., & Arnouts, S. 1996, A&AS, 117, 393Binggeli, B., & Cameron, L. M. 1991, A&A, 252, 27Blanton, M. R., Dalcanton, J., Eisenstein, D., et al. 2001, AJ,
121, 2358Boselli, A., & Gavazzi, G. 2014, A&A Rev., 22, 74Bothun, G. D., Impey, C. D., & Malin, D. F. 1991, ApJ, 376, 404Burkholder, V., Impey, C., & Sprayberry, D. 2001, AJ, 122, 2318Dalcanton, J. J., Spergel, D. N., Gunn, J. E., Schmidt, M., &
Schneider, D. P. 1997, AJ, 114, 635Dekel, A., & Silk, J. 1986, ApJ, 303, 39Ferrarese, L., Cote, P., Cuillandre, J.-C., et al. 2012, ApJS, 200, 4Gunn, J. E., & Gott, III, J. R. 1972, ApJ, 176, 1Impey, C., Burkholder, V., & Sprayberry, D. 2001, AJ, 122, 2341Kashikawa, N., Shimasaku, K., Yasuda, N., et al. 2004, PASJ, 56,
1011Kavelaars, J. J., Harris, W. E., Hanes, D. A., Hesser, J. E., &
Pritchet, C. J. 2000, ApJ, 533, 125
Kodama, T., & Arimoto, N. 1997, A&A, 320, 41Komiyama, Y., Sekiguchi, M., Kashikawa, N., et al. 2002, ApJS,
138, 265Kubo, J. M., Stebbins, A., Annis, J., et al. 2007, ApJ, 671, 1466Larson, D., Dunkley, J., Hinshaw, G., et al. 2011, ApJS, 192, 16Larson, R. B., Tinsley, B. M., & Caldwell, C. N. 1980, ApJ, 237,
692Leitherer, C., Schaerer, D., Goldader, J. D., et al. 1999, ApJS,
123, 3Lieder, S., Lisker, T., Hilker, M., Misgeld, I., & Durrell, P. 2012,
A&A, 538, A69McConnachie, A. W. 2012, AJ, 144, 4Mink, D. J. 2002, in Astronomical Society of the Pacific
Conference Series, Vol. 281, Astronomical Data AnalysisSoftware and Systems XI, ed. D. A. Bohlender, D. Durand, &T. H. Handley, 169
Miyazaki, S., Komiyama, Y., Sekiguchi, M., et al. 2002, PASJ, 54,833
Mobasher, B., Bridges, T. J., Carter, D., et al. 2001, ApJS, 137,279
Moore, B., Katz, N., Lake, G., Dressler, A., & Oemler, A. 1996,Nature, 379, 613
Okabe, N., Futamase, T., Kajisawa, M., & Kuroshima, R. 2014,ApJ, 784, 90
Okabe, N., Okura, Y., & Futamase, T. 2010, ApJ, 713, 291Peng, C. Y., Ho, L. C., Impey, C. D., & Rix, H.-W. 2002, AJ,
124, 266

Ultra Diffuse Galaxies in Coma Cluster 7
Fig. 5.— Color-magnitude diagram using B and R band photometry. The green points are 232 UDGs observed both in B and R withSubaru (the Dragonfly UDGs are circled), and the red and blue are red and blue galaxies taken from the Coma1 field of Yamanoi et al.(2012) which includes cluster members as well as background galaxies. Due to saturation, most giant galaxies are not included, but thered-sequence is evident. The UDGs clearly follow the red-sequence population of the Coma cluster.
Rix, H.-W., & Bovy, J. 2013, A&A Rev., 21, 61Schlafly, E. F., & Finkbeiner, D. P. 2011, ApJ, 737, 103Sersic, J. L. 1968, Atlas de galaxias australesTolstoy, E., Hill, V., & Tosi, M. 2009, ARA&A, 47, 371Ulmer, M. P., Adami, C., Durret, F., Ilbert, O., & Guennou, L.
2011, A&A, 528, A36Ulmer, M. P., Bernstein, G. M., Martin, D. R., et al. 1996, AJ,
112, 2517van Dokkum, P., Romanowsky, A., Abraham, R., et al. 2015a,
ArXiv e-prints
van Dokkum, P. G., Abraham, R., Merritt, A., et al. 2015b, ApJ,798, L45
White, S. D. M., Briel, U. G., & Henry, J. P. 1993, MNRAS, 261,L8
Yagi, M., Kashikawa, N., Sekiguchi, M., et al. 2002, AJ, 123, 66Yagi, M., Komiyama, Y., Yoshida, M., et al. 2007, ApJ, 660, 1209Yagi, M., Suzuki, N., Yamanoi, H., et al. 2013, PASJ, 65, 22Yagi, M., Yoshida, M., Komiyama, Y., et al. 2010, AJ, 140, 1814Yamanoi, H., Komiyama, Y., Yagi, M., et al. 2012, AJ, 144, 40Yoshida, M., Yagi, M., Komiyama, Y., et al. 2008, ApJ, 688, 918