(approved by aicte, new delhi. & affiliated to sri
TRANSCRIPT

AKSHARA INSTITUTE OF MANAGEMENT & TECHNOLOGY.
(Approved by AICTE, New Delhi. & Affiliated to Sri Venkateswara University, Tirupati.)
Prepared by: Dr. M.A.Dhandapani., M.Com., MBA., M.Phil., Ph.D I-CET CODE :AMTT Page 1
UNIT – I
INVESTMENT MANAGEMENT
Who is investor: The investor who is having extra cash could invest it in securities or in any
other assets like gold or real estate or could simply deposit in his bank account. The person who
invest his savings in to company investment.
Objective of Investor:
To minimize the risk involved in investment and maximise the return
Investment:
In General Sense,
“Investment as the process of sacrificing something now for the prospect of gaining something later”
The above definition we can infer that it contains three dimensions to an investment.
Time
Today’s sacrifice and
Prospect of gain.
Investment:
Investment is the employment of funds on assets with the aim of earning income or capital
appreciation.
To the Economist,
Investment is the net addition made to the nation’s capital stock that consists of goods
and services that are used in the production process. example:- new constructions of
plants and machines, inventories and etc .
Financial Investment
It is the allocation of money to assets that are expected to yield some gain over a period of
time. It is an exchange of financial claims such as stocks and bonds for money. They are expected to
yield returns and experience capital growth over the years.
Financial and Economic Meaning of Investment
In the financial sense investment is the commitment of a person’s fund to derive future income
in the form of income. dividend premium , pension benefit , or appreciation , in the value of their
capital example :- purchasing of shares , debentures , post office saving certificates , insurance
policies are all investments in the financial sense such investment generates financial assets.
Classification of Investment:
A Major classification is physical and financial investment.

AKSHARA INSTITUTE OF MANAGEMENT & TECHNOLOGY.
(Approved by AICTE, New Delhi. & Affiliated to Sri Venkateswara University, Tirupati.)
Prepared by: Dr. M.A.Dhandapani., M.Com., MBA., M.Phil., Ph.D I-CET CODE :AMTT Page 2
Physical Investment:
If saving are used to acquired Physical assets, useful for consumption or production. It cannot
be marketability. Physical investment are fixed and movable assets. Such as house, Land, building,
flats, gold, silver and other consumer durables.
Financial Investment:
It is nothing but different types of investments. It consist of marketable and non – marketable
securities. It can be easily transferable.
Marketable Securities: can be easily converted to cash such as government bonds, common stock or
certificates of deposits etc.
Non – Marketable Securities: cannot be easily converted to cash like Bank deposits, Provident Fund
and pension Funds etc.
Characteristics of Investment:
The Characteristics of investment are:
Risk
Return
Safety
Liquidity
Marketability
Risk: at the time of investment. The investor gathering information regarding how much risk
involved in the investment.
Return: The difference between purchasing price and selling price is called capital appreciation or
income or Return.
Safety: the safety of capital is the certainty of return on capital, without loss of money or time
involved.
Liquidity: Investment can be easily realizable, saleable or marketable. Then it said to be liquidity.
Marketability: this refers to transferability or saleability of an assets.
SPECULATION
Speculation means taking up the business risk in the hope of getting short term gain.
Speculation essentially involves buying and selling activities with the expectation of getting profit
from the price. This can be explained with an example. If a spouse buys a stock for its dividend, she
Investment
Physical Investment Financial Investment

AKSHARA INSTITUTE OF MANAGEMENT & TECHNOLOGY.
(Approved by AICTE, New Delhi. & Affiliated to Sri Venkateswara University, Tirupati.)
Prepared by: Dr. M.A.Dhandapani., M.Com., MBA., M.Phil., Ph.D I-CET CODE :AMTT Page 3
may be termed as an investor. If she buys with the anticipation of price rise in the near future and the
hope of selling it at a gain price she would be termed as a speculator. The dividing line between
speculation and investment is very thin because people buy stocks for dividends and capital
appreciation.
Difference between the Investor and the Speculator
Investment Speculation
Time Horizon Plans for a longer time horizon. His holding
period may be from one year to few years.
Plans for a very short period. Holding Period
varies from few days to months
Risk Assumes moderate Risk Willing to undertake high Risk
Return Likes to have moderate rate of return
associated with limited risk
like to have high returns ofr assuming high risk
Decision
Considers fundamental factors and
evaluates the performance of the company regularly.
Considers inside information, here says and market behaviour
Funds Uses his own funds and avoids borrowed
funds.
Uses borrowed funds to supplement his
personal resources.
Objectives of Investment:
The main investment objectives are increasing the rate of return and reducing the risk. Other
objectives like Liquidity, Safety and Hedge against inflation.
Return: investors always expect a good rate of return from their investment. Rate of return could be
defined as the total income the investor receives during the holding period stated as a percentage of
the purchasing price at the beginning of the holding period.
Return =
Risk: Related with the probability of actual return. Investment risk is as important as measuring its
expected rate of return.
Liquidity: Marketability of the investment provides the liquidity to the investment. The liquidity
depends on the marketing and trading facility.
Hedge against Inflation: Since there is inflation in almost all the economy. The rate of return should
ensure a cover against the inflation. The return rate should be higher than the rate of inflation.
Safety: The selected Investment avenues should be under the legal and regulatory framework.
Approval of law itself adds a flavour of safety.

AKSHARA INSTITUTE OF MANAGEMENT & TECHNOLOGY.
(Approved by AICTE, New Delhi. & Affiliated to Sri Venkateswara University, Tirupati.)
Prepared by: Dr. M.A.Dhandapani., M.Com., MBA., M.Phil., Ph.D I-CET CODE :AMTT Page 4
Real and Financial Assets:
Financial Assets:
Cash
Bank Deposits
Provident Fund
LIC Schemes
Post Office
Certificate &
Deposits
Saver
Investor
Real Assets:
House, Land,
Buildings and Flats.
Gold, Silver and
other Metals
Consumer Durables Marketable Assets:
Shares, Bonds & Govt. Securities etc.,
Mutual Funds Schemes, UTI Units etc.,
Stock & Capital Market
Primary Market – New Issue Shares
Secondary Market – Secondary sale of
securities.

AKSHARA INSTITUTE OF MANAGEMENT & TECHNOLOGY.
(Approved by AICTE, New Delhi. & Affiliated to Sri Venkateswara University, Tirupati.)
Prepared by: Dr. M.A.Dhandapani., M.Com., MBA., M.Phil., Ph.D I-CET CODE :AMTT Page 5
Characteristics of Real and Financial Assets:
Currency: Financial assets are exchange documents with an attached value. Their values are
dominated in currency with determined by the Govt. Of an economy. A note or a coin
representing cash or money is a financial asset with an attached face value and is represented
in terms of the currency unit of a country.
Convertibility: financial assets are convertible into any other type of assets.
Divisibility: Financial instruments are divisible into smaller units. The total value is
represented in terms of divisions that can be handled in a trade.
Reversibility: This implies that a financial instrument can be exchanged for any other assets
and logically the so formed asset may be transferred back into the original financial
instrument.
Liquidity: This is the immediate need value of the financial instrument.
Cash Flow: The holding of the financial instrument results in a stream of cash flows that are
the benefits. Accruing to the holder of the financial instrument. Example: 1) A deposit with a
bank gives an inflow of interest to the deposit holder. 2) Shares give the holder dividend or
bonus.
Financial Markets:
A financial market is a market in which people trade financial securities, commodities, and
value at low transaction costs and at prices that reflect supply and demand. Securities include stocks
and bonds, and commodities include precious metals or agricultural products.
Financial market can be refers to those centres and arrangements which facilitate to buying
and selling of financial assets, claims and services.
Financial Markets
Capital Market:
Capital Market is market for financial assets which have a long or indefinite maturity.
Generally, it deals with long term securities which have a maturity period of above one year. Capital
market may be further divided into three namely:
Industrial Securities Market:
As the very name implies, it is a market for industrial securities namely – Equity shares or
Capital Market Money Market
Industrial
Securities market
Govt. Securities
Market
Long Term
Loan Market
Call Money
Market
Short- Term
Market
Commercial
Bill Market
Treasury
Bill Market Primary Market Secondary Market

AKSHARA INSTITUTE OF MANAGEMENT & TECHNOLOGY.
(Approved by AICTE, New Delhi. & Affiliated to Sri Venkateswara University, Tirupati.)
Prepared by: Dr. M.A.Dhandapani., M.Com., MBA., M.Phil., Ph.D I-CET CODE :AMTT Page 6
Ordinary shares, Preference shares and Debentures or bonds. It is a market where industrial concerns
raise their capital or debt by issuing appropriate instruments. It can be further subdivided into two.
They are: 1. Primary Market or New Issue Market.
2. Secondary Market or Stock exchange.
Government Securities Market:
Government Securities Market are traded in govt. In india many kinds of securities like Short
term and long term securities are traded in this market and short term securities are traded in money
market. The govt. Securities are issued by Central Government, State Government and semi
Government like city corporation authorised by government.
Stock Certificates
Promissory Note
Bearer Bonds etc..
Long – Term Loan Market:
Development banks and commercial banks play a significant role in this market by supplying
long term loans to corporate customers. Long – term loans market may further be classified into:
Term loans Market
Mortgages Market
Financial Guarantees Market
Money Market:
Money Market is a market for dealing with financial assets and securities which have a
maturity period of up to one year. In other words it is a market for purely short term funds. The
Money Market may sub divided in to four. They are:
Call Money Market
Commercial Bills Market
Treasury Bills Market
Short Term Loan Market
Call Money Market:
Call Money Market is a market for extremely short period loans. So one day to fourteen days.
So it is highly liquidity.
Commercial Bills Market:
It is market for bills of exchange arising out of genuine trade transactions. In case credit sales
seller draw a bill of exchange on the buyer. Time period are – 3 Months or 6 Months.
Treasury Bills Market:
It is market for treasury bill which have short term maturity. A Treasury bill is a promissory
Bill or financial bill issued by Government.
Short Term Loan Market:

AKSHARA INSTITUTE OF MANAGEMENT & TECHNOLOGY.
(Approved by AICTE, New Delhi. & Affiliated to Sri Venkateswara University, Tirupati.)
Prepared by: Dr. M.A.Dhandapani., M.Com., MBA., M.Phil., Ph.D I-CET CODE :AMTT Page 7
It is market where short term loan are given to corporate customer for meeting their working
capital requirements.
Taxation of Income from Investments:
The taxation of your investment income depends on several factors, including the type of investment
income you have (e.g., tax exempt, ordinary, capital gain, or tax deferred).
While investing in a tax-saving instrument or for that matter any investment, it's important to keep an
eye on the taxability of its income. If the income earned is taxable, the scope to build wealth over
long term gets constrained as taxes will eat into the returns.
In the tax saving instruments such as National Savings Certificate (NSC), Senior Citizen Savings
Scheme (SCSS), 5-year time deposits in bank and post office, the interest amount gets added to one's
income and hence is liable to be entirely taxable. so, even though they help you save tax for the
current year, the interest income becomes a tax liability in each year till the tenure ends. Anil Rego,
CEO & Founder of Right Horizons, says, "One must note that (taxable tax savers) instruments will
help in saving the tax to an eligible limit both on investments and on maturity. Since they provide the
tax benefits, the returns on them are likely to be below the market returns."
The post-tax return in them, therefore, comes down after factoring in the tax. For example, for
someone who pays 30.9 percent tax, the post-tax return on a 5-year bank FD of 7 per cent is 4.8 per
cent per annum!
They can still be tax-exempt income if even after adding the interest income, the individual's total
income remains within the exemption limit as provided by income tax rules. Illustratively, a taxpayer
between ages 60-80 earns only interest income from such taxable investments of about Rs 3 lakh a
year. Since the income for such individuals is exempted till Rs 3 lakh, even the interest earned from
investment in taxable products does not translate into tax liability for them.
But, for most others especially those earning a salary or having income from business or profession,
choosing tax savers that come with E-E-E status helps. The investment in these get EEE benefit i.e.
exempt- exempt- exempt status on the income earned. The principal invested qualifies for deduction
under Section 80C of the Income Tax Act, 1961 and the income in all of them is tax exempt under
Section 10.
Here are few such tax savers that not only help you save tax but also help you save tax but also help
you earn tax-free income. But, not all are the same in terms of features and asset-class, so making the
right choice is essential.
TRADING ON STOCK EXCHANGES:
STOCK EXCHANGE
Definition of Stock Exchange: The securities regulation act of 1956 defined stock exchange
as “an association , organization , or a individual which is established for the purpose of assisting ,
regulating , and controlling business in buying ,selling and dealing in securities.”
Meaning: This comes under treasury sector, which provides service to stock brokers & traders to
trade stocks, bonds and securities. A stock exchange helps the companies to raise their fund.
Therefore the companies needs to list themselves in the Stock Exchange and the shares will be
issued which is known as equity or a ordinary share and these shareholders are the real owners of the
company the Board of Directors of the Company are elected out of these Equity Shareholders only.

AKSHARA INSTITUTE OF MANAGEMENT & TECHNOLOGY.
(Approved by AICTE, New Delhi. & Affiliated to Sri Venkateswara University, Tirupati.)
Prepared by: Dr. M.A.Dhandapani., M.Com., MBA., M.Phil., Ph.D I-CET CODE :AMTT Page 8
FEATURES OF STOCK EXCHANGE
It is an organized market
It is a securities market
It is an important constituent of capital market i.e., market for long- term finance
It is a voluntary association of persons desirous of dealing in securities
Stock exchange is a voluntary association, its membership is not open to everybody
In a stock exchange, only the members can deal in i.e., buy & sell securities
The members of a stock exchange can buy and sell securities either as brokers for & on behalf
of their clients
The dealings in a stock exchange are under certain accepted code of conduct i.e., rules
and regulations
IMPORTANT FUNCTION OF STOCK EXCHANGE
Provide central and convenient meeting places for sellers and buyer of securities
Increase the marketability and liquidity of securities
Contribute to stability of prices of securities
Equalization of price of securities
Smoothen price movement
Help the investors to know the worth of their holdings
Promote the habit of saving and investment
Help capital formation
Help companies and government to raise funds from the investors
Provide forecasting service
History of Stock Exchange
th The stock exchange was established by “East India company” in 18 century . In India it
was established in 1850 with 22 stock brokers opposite to town hall Bombay .This stock exchange is
known as oldest stock exchange of Asia.
Broker and Jobber:
BROKER:He is one acts as a intermediary on behalf of others. A broker in a stock exchange is a
commission agent who transacts business in securities on behalf of non members.
JOBBER:He is not allowed to deal with the public directly .He deals with brokers who are engaged
with the investors. Thus, the securities are bought by the jobber from members and sells to members
who are operating on the stock exchange as broker.
Jobber Broker
1
A jobber is an independent dealer in securities,
purchasing or selling securities on his own
account
A broker deals with the jobber on behalf of his clients.
in other words, a broker is a middleman between a
jobber and clients
2
A jobber deals only with the brokers, does not deal with the general public
A broker is merely an agent, buying or selling securities on behalf of his clients.

AKSHARA INSTITUTE OF MANAGEMENT & TECHNOLOGY.
(Approved by AICTE, New Delhi. & Affiliated to Sri Venkateswara University, Tirupati.)
Prepared by: Dr. M.A.Dhandapani., M.Com., MBA., M.Phil., Ph.D I-CET CODE :AMTT Page 9
3
A jobber earns profit from his operations i.e.,
buying and selling activities
A broker gets only commission for his dealings
4 Each jobber specializes in certain group of
securities
The broker deals in all types of securities
Speculation and Speculator:
SPECULATION:It is the transaction of members to buy or sell securities on stock exchange
with a view to make profits to anticipated raise or fall in price of securities.
SPECULATOR: The dealer in stock exchange who indulge in speculation are called
speculator. They do not take delivery of securities purchased or sold by them , but only pay or
rescue the difference between the purchase price and sale price . The different types of
speculators are
o BULL
o BEAR
o STAG
o LAME DUCK
Bull:
He is speculator who expects the future raise in price of securities he buys the securities to
sell them at future date at the higher price.
He is called as bull because his activities resembles as a bull , as the bull tends to throw its
victims up in the air through its horns. In simple the bull speculator tries to raise the price of securities
by placing a big purchase orders.
Bear:
He is speculator who expects future fall in prices, he does an agreement to sell securities at
future date at the present market rate. He is called as bear because his altitude resembles with bear , as
the bear tends to stamp its victims down to earth through its paws . In simple the bear speculator forces
of prices of securities to fall through his activities.
Stag:
He operates in new issue of market. He is just like a bull speculator . He applies large number
of shares in the issue market only by paying, application money and allotment money. He is not a
genuine investor because, he sells the allotted securities at the premium and makes profit. In simple
he is cautious in his dealings. He creates an artificial rise in prices of new shares and makes profits.
Lame Duck:
He is speculator when the bear operator finds it difficult to deliver the securities to the
consumer on a particular day as agreed upon , he struggles as a lame duck in fulfilling his
commitment . This happens when the prices do not fall as expected by the bear and the other party is
not willing to postpone the settlement to the next period.
Largest stock exchanges:
IN THE WORLD:
London Stock Exchange
New York Stock Exchange

AKSHARA INSTITUTE OF MANAGEMENT & TECHNOLOGY.
(Approved by AICTE, New Delhi. & Affiliated to Sri Venkateswara University, Tirupati.)
Prepared by: Dr. M.A.Dhandapani., M.Com., MBA., M.Phil., Ph.D I-CET CODE :AMTT Page 10
Shanhai Stock Exchange
Australia Stock Exchange
Tokyo Stock Exchange
Hong Kong Stock Exchange
Toronto Stock Exchange
Deutsche Borse
Bm&F Bovespa
Nasdaq Omx Stock Exchange
London Stock Exchange
IN INDIA
National Stock Exchange
Bombay Stock Exchange
Calcutta Stock Exchange
Cochin Stock Exchange
Multi Commodity Exchange
Derivatives Exchange
Otc Exchange
Pune Stock Exchange
Interconnects Exchange
London Stock Exchange:
It was the first stock exchange established by east India company in 18th century in London.
The top gainer of LONDON STOCK EXCHANGE is “Blue chip shares.
Bombay Stock Exchange:
It is oldest and first stock exchange of India established in the year 1875. First it was started
under baniyan tree opposite to town hall of Bombay over 22 stock brokers. The top gainer in BSE is
100 companies in that GMR infra is first
National Stock Exchange of India (NSE Or NSEI):
The NSE of India is the leading stock exchange of India, covering 370 cities and towns in the
country. It was established in1994 as a TAX company. It was established by 21 leading financial
institutions and banks like the IDBI, ICICI, IFCI, LIC, SBI, etc...
Features of NSEI:
Nationwide coverage i.e., investors from all over country
Ring less i.e., it has no ring or trading floor
Screen-based trading i.e., trading in this stock exchange is done electronically.
Transparency, i.e., the use of computer screen for trading makes the dealings in securities
transparent.
Professionalization in trading, i.e., it brings professionalism in its functions
Securities and Exchange Board of India(SEBI):
The SEBI was constituted on 12th April, 1988 under a resolution of the Government of India.

AKSHARA INSTITUTE OF MANAGEMENT & TECHNOLOGY.
(Approved by AICTE, New Delhi. & Affiliated to Sri Venkateswara University, Tirupati.)
Prepared by: Dr. M.A.Dhandapani., M.Com., MBA., M.Phil., Ph.D I-CET CODE :AMTT Page 11
On 31st january,1992, it was made a statutory body by the Securities and Exchange board of India
Act,1992.
The Companies (Amendment) Act, 2000 has given certain powers to SEBI as regards the
issues and transfer of securities and non-payment of dividend.
Function of SEBI:
Regulating the business in stock exchange and any other securities markets.
Promoting and regulating self-regulatory organization.
Registering and regulating the work of collective investment scheme, incluing mutual funds.
Prohibiting fraudulent and unfair trade practices relating to securities market.
Promoting education, and training of intermediaries of securities market
Power of SEBI:
Power to approve the bye-laws of stock exchange
Power to inspect the books of accounts
Power to grant license to any person for the purpose of dealing in certain areas.
Power to delegate powers exercisable by it.
Power to try directly the foliation of certain provision of the company Act
How To Deal and Invest In Stock Exchange:
In order to deal with a securities one as to have an account called Demat a/c or Trading a/c. It
is just like a bank account. Same procedure of opening the bank account is followed to open the a/c.
But all the banks does not give this facility of opening the account, only few banks provide this
facility. After demat a/c or Trading a/s is opened then the securities is bought and sold. The banks
which gives facility of demat a/c in India is
ICICI Bank,
Citi Bank, and
Bank of Baroda etc..
Market Prices:
Market Price (Market Value) = The price at which buyers and sellers trade the item in an open
market place.
Definition: Unique price at which buyers and sellers agree to trade in an open market at a particular
time. In formal markets (such stock exchanges):
The offer Price (selling price) which is higher and
Bid Price (buying price) that is lower.
The difference between these two price is called margin.
The price established in the market where buyers and sellers meet to buy and sell similar products a
In economics, market price is the economic price for which a good or service is offered in
the marketplace. It is of interest mainly in the study of micro economics. Market value and market
price are equal only under conditions of market efficiency, equilibrium, and rational expectations.

AKSHARA INSTITUTE OF MANAGEMENT & TECHNOLOGY.
(Approved by AICTE, New Delhi. & Affiliated to Sri Venkateswara University, Tirupati.)
Prepared by: Dr. M.A.Dhandapani., M.Com., MBA., M.Phil., Ph.D I-CET CODE :AMTT Page 12
price determined by factors of supply and demand rather than by decisions made by management.
Market Price per Share and calculate:
The market price per share of stock or the price per share of stocks is a current measure of price not
an accounting or historical measure of the value of stock like the book value per share. Which is
based on the information from a company’s balance sheet.
The market price per share is a financial metric that inventors use to determine whether or not to
purchase a stock.
Calculation of Market Price per share:
There are several steps you must take in order to calculate the market price per share.
The First Step: is to determine the date on which you want to calculate the market price per share.
The Second Step: is to find the price on that particular date. You can look at the company’s
monthly, Quarterly or annual report to get the stock price on that particular date.
The Third Step: you must consider the preferred stock if any, that this company owns, if the
company owns and has paid dividends on its preferred stock subtract those dividends from the stock
price you have found form the financial report.
The Fourth Step: Determine the number of shares of stock. Outstanding by looking at the
Company’s quarterly or annual report.
Market Price Per Share =
the adjusted closing price is often used when examining historical returns or a stock’s price is
typically affected by supply and demand of market participants.
The difference between the cash dividends and stock dividend: examining historical return or
performing.
DIVIDEND:
The dividend paid to the shares holders are out of the firm’s profits. Dividends in a firm are
paid according to the policies and decisions of the management. Regarding the retained earnins of the
firm.
The directors of a firm to retain some part of the income and to give the other part of the income and
to give the other part as dividends to the owners of the firm called shareholders.
Which can be classified as:
Cash Dividend
Stock Dividend
Scrip Dividend
Property Dividend
Bond Dividend
Special Dividend
Optional Dividend

AKSHARA INSTITUTE OF MANAGEMENT & TECHNOLOGY.
(Approved by AICTE, New Delhi. & Affiliated to Sri Venkateswara University, Tirupati.)
Prepared by: Dr. M.A.Dhandapani., M.Com., MBA., M.Phil., Ph.D I-CET CODE :AMTT Page 13
Depreciation Dividend
Dividends from capital surplus
Dividend from Appreciation
Liquidation Dividend
If the company does not find sufficient amount to pay cash dividend. Effective technique of raising
capital. It also helps in raising future dividends of existing shareholders.
Stock Splits:
When the company pays a stock dividend it may also offer the stock split up. Effective stock
split up is only an increase in the number of shares that are outstanding. The change does not affect
the stated value of a stock or its surplus.
Reduction of the market Price
Future Growth
Reverse split
Re – Purchase of stock
Right Issue:
Right issue is an offer to the existing shareholders to subscribe for more shares, in proportion to their
existing shareholding usually at a relatively chep price.
In these rights offerings companies grant shareholders a chance to buy new shares at a discount to the
current trading price.
A rights issue is an invitation to existing shareholders to purchase additional new shares in the
company.
Ex: Mr. A have 100 shares of X company @ rs. 400 = 40, 000 1:1 subscription right issue at offring
price of Rs 200 offer price is 100 shares @ Rs. 100 = 20, 000 Average price cost of acquisition for
the 200 shares to Rs. 300 shares.
=40, 000 + 20,000/200 = 300.
Ad of right issue: it gives existing shareholders securities called “Rights” which give the shareholders
the right to purchase new shares at a discount to the market price.
Bonus Issue:
The term bonus in relation to share capital refers to an extra dividend to the shareholders from
surplus profits. When a company has accumulated profits which are in excess of its need then the
excess amount can be distributed by way of bonus share among existing shareholders.
What is an 'Adjusted Closing Price'
An adjusted closing price is a stock's closing price on any given day of trading that has been amended
to include any distributions and corporate actions that occurred at any time prior to the next day's
open. The adjusted closing price is often used when examining historical returns or performing a
detailed analysis on historical returns.
A stock's price is typically affected by supply and demand of market participants. However, there are
some corporate actions that affect a stock's price, which needs to be adjusted in the event of these

AKSHARA INSTITUTE OF MANAGEMENT & TECHNOLOGY.
(Approved by AICTE, New Delhi. & Affiliated to Sri Venkateswara University, Tirupati.)
Prepared by: Dr. M.A.Dhandapani., M.Com., MBA., M.Phil., Ph.D I-CET CODE :AMTT Page 14
actions. The adjusted closing price is a useful tool when examining historical returns because it gives
analysts an accurate representation of the firm's equity value beyond the simple market price. It
accounts for all corporate actions such as stock splits, dividends/distributions and rights offerings.
Investors should understand how corporate actions are accounted for in a stock's adjusted closing
price.
Adjusting Prices for Stock Splits
A stock split is a corporate action that is usually done by companies to make their share prices more
marketable. A stock split does not affect a company's total market capitalization, but it does affect the
company's stock price. Consequently, a company undergoing a stock split must adjust its closing
price to depict the effect of the corporate action.
For example, a company's board of directors may decide to split the company's stock three-for-one.
Therefore, the company's shares outstanding increase by a multiple of three, while its share price is
divided by three. If a stock closed at $300 the day prior to its stock split, the closing price is adjusted
to $100, or $300 divided by 3, per share to show the effect of the corporate action.
Adjusting for Dividends
Common distributions that affect a stock's price include cash dividends and stock dividends. The
difference between cash dividends and stock dividends is shareholders are entitled to a predetermined
price per share and additional shares, respectively. For example, assume a company declared a $1
cash dividend and is trading at $51 per share on the ex-dividend date. On the ex-dividend date, the
stock price is reduced by $1 and the adjusted closing price is $50.
Adjusting for Rights Offerings
A stock's adjusted closing price also reflects rights offerings that may occur. A rights offering is an
issue of rights given to existing shareholders, which entitles the shareholders to subscribe to the
rights issue in proportion to their shares. For example assume a company declares a rights offering, in
which existing shareholders are entitled to one additional share for every two shares owned. Assume
the stock is trading at $50 and existing shareholders are able to purchase additional shares at a
subscription price of $45. On the ex-date, the adjusted closing price is calculated based on the
adjusting factor and the closing price.

AKSHARA INSTITUTE OF MANAGEMENT & TECHNOLOGY.
(Approved by AICTE, New Delhi. & Affiliated to Sri Venkateswara University, Tirupati.)
Prepared by: Dr. M.A.Dhandapani., M.Com., MBA., M.Phil., Ph.D I-CET CODE :AMTT Page 15
UNIT – II
FIXED INCOME SECURITES
A fixed income security is an investment that provides a return in the form of fixed periodic
payments and the eventual return of principal at maturity. Unlike a variable-income security, where
payments change based on some underlying measure such as short-term interest rates, the payments
of a fixed-income security are known in advance.
Security is an evidence of property right. Like equity shares, preference shares, debentures, bonds
and other marketable instruments are called as securities.
Classification of Securities are:
Fixed Income Securities – Earn interest / dividend at fixed rate.
Variable Income Securities – Earn dividend at variable rate.
Fixed Income Securities:
FI Securities are investment where the cash flows are according to a pre determined amount
of interest, paid on a fixed schedule. Unlike a variable-income security, where payments
change based on some underlying measure such as short term interest rates, the payments of
a fixed-income security are known in advance. Popularly known as Debt instrument
Types of Fixed income securities:
The different types of fixed income securities include government securities, corporate bonds,
Treasury Bills, Commercial Paper, Strips etc.
Bank Deposits
Company Deposits
Small Saving Schemes
Debentures / Bonds
Bank Deposits: - Fixed deposit in the bank
Safest
Highly liquid as they can be encashed premature at 1% less on interest rate.
Neither tradable and nor transferable
Nomination facility.
Company Deposits:
Her, instead of deposits with bank, we deposit with NBFC’s and Manufacturing companies
Offer max interest rate than bank.
Neither secured nor guaranteed by RBI
Neither tradable nor transferable
No Nomination facilities is available
Small Saving Schemes:
Initial investment get double in 5 – 6 years
Neither tradable
Accepted as collateral

AKSHARA INSTITUTE OF MANAGEMENT & TECHNOLOGY.
(Approved by AICTE, New Delhi. & Affiliated to Sri Venkateswara University, Tirupati.)
Prepared by: Dr. M.A.Dhandapani., M.Com., MBA., M.Phil., Ph.D I-CET CODE :AMTT Page 16
Debentures or Bonds:
Long term debt instruments
Higher rate of interest
Safer or unsafe (credit rating agency loss to decide)
Liquidity is very light
Tradable and transferable
Advantages of Fixed income securities:
Max return (revenue gain), Capital gain
Less risk
Tax advantages
Disadvantages of fixed income securities:
Return is fixed. Cannot earn more
Due to inflation, fixed return become very less in real value
Difficult to sell at attractive price
Real and Rates of Return:
A real rate of return is the annual percentage return realized on an investment, which is
adjusted for changes in prices due to inflation or other external effects. This method expresses
the nominal rate of return in real terms, which keeps the purchasing power of a given level of capital
constant over time. Adjusting the nominal return to compensate for factors such as inflation allows
you to determine how much of your nominal return is actually real return.
Nominal Interest Rate:
Nominal interest rate refers to the interest rate before taking inflation into account. Nominal can also
refer to the advertised or stated interest rate on a loan, without taking into account any fees or
compounding of interest. Finally, the federal funds rate, the interest rate set by the Federal Reserve,
can also be referred to as a nominal rate.
Difference between Nominal and Real Interest Rates
Unlike the nominal rate, the real interest rate takes the inflation rate into account. The equation that
links nominal and real interest rates can be approximated as:
Nominal rate = Real interest rate + Inflation rate,
or
Nominal rate - Inflation rate = Real rate.
Nominal & Real Rates of Return:
Investors are more concerned with the real rate of return – the return adjusted for the effects
of inflation. Inflation affects the value of money by reducing spending power. Thus:

AKSHARA INSTITUTE OF MANAGEMENT & TECHNOLOGY.
(Approved by AICTE, New Delhi. & Affiliated to Sri Venkateswara University, Tirupati.)
Prepared by: Dr. M.A.Dhandapani., M.Com., MBA., M.Phil., Ph.D I-CET CODE :AMTT Page 17
Real Return = Nominal Rate – Annual calculated Rate of Return
Example: Assume the return is 100% taxable, an investor with a return of 10%, having a tax rate of
30%, would have an after tax return of 7%, calculated as 10% X (100% – 30%).
Taking inflation into account (at 2%), the investor’s approximate real return would be 5% (7% –
2%).
Computation of Risk and Return:
Risk:
Risk is a measure of future uncertainties in achieving program performance goals and objectives within
defined cost, schedule and performance constraints. Risk can be associated with all aspects of a program
(e.g., threat, technology maturity, supplier capability, design maturation, performance against plan,) as
these aspects relate across the Work Breakdown Structure (WBS) and Integrated Master Schedule (IMS).
Risk addresses the potential variation in the planned approach and its expected outcome. While such
variation could include positive as well as negative effects, this guide will only address negative future
effects since programs have typically experienced difficulty in this area during the acquisition process.
Risk is the possibility of loss or injury
Investor thinks minimize the risk and maximise the Return
Risk is inter changeable used with uncertainty
Components of Risk Risks have three components:
A future root cause (yet to happen), which, if eliminated or corrected, would prevent a
potential consequence from occurring,
A probability (or likelihood) assessed at the present time of that future root cause occurring,
and
The consequence (or effect) of that future occurrence.
A future root cause is the most basic reason for the presence of a risk. Accordingly, risks should be tied to future root causes and their effects.
Risk mainly consists of two components:
RISK
Systematic Risk:
The systematic risk affects the entire market. Often we read in the newspaper that the stock
market is in the bear hug or in the bull grip. This indicates that the entire market is moving in a
particular direction either upward and downward.
The economic conditions, political situations and Sociological changes affect the security
market.
Systematic Risk Unsystematic Risk
Market Risk Business Risk Financial Risk
Intangible Events Tangible Events
Purchasing Power Risk Interest Rate Risk

AKSHARA INSTITUTE OF MANAGEMENT & TECHNOLOGY.
(Approved by AICTE, New Delhi. & Affiliated to Sri Venkateswara University, Tirupati.)
Prepared by: Dr. M.A.Dhandapani., M.Com., MBA., M.Phil., Ph.D I-CET CODE :AMTT Page 18
1988 recession experienced by developed and developing countries has affected the stock
market all over the world.
The systematic risk is further sub – divided into:
Market Risk
Interest Rate Risk
Purchasing Power Risk
Market Risk:
Jack Clark Francis defied market risk is portion of total variability of return caused by the
alternating forces of Bull and Bear Markets.
When the security index moves upward haltingly for a significant period of time, it is known
as Bull Market.
When the security index moves downward, it is known as Bear Market. Bear market is just a
reverse to the bull market.
Market risk can be sub divided into:
Tangible Events – it is Real events like Earthquakes, war, political uncertainty and fall in the
value of currency as the Recession time.
Intangible Events – Market Psychology – 1994 LPG due to market psychology is positive
and 1988 it is a recession at the time Market psychology is negative.
1998 recession at this time market is falls down – Rush to sell the share in the market in this the price
of the scrip’s fall below their intrinsic values.
Interest Rate Risk:
The variation in the single period rate of returns caused by the fluctuation in the market
interest Rates.
The most commonly interest rate risk affects the price of bonds, debentures and stocks.
The fluctuations in the interest rate are caused by the changes in Govt. Monetary Policy.
Change interest rates of Treasury bills and govt. bounds etc..
Purchasing Power Risk:
The Variation in the returns an caused also by the loss of purchasing power of currency.
Inflation is the reason behind the loss of purchasing power.
Purchasing power risk is the probable loss in the purchasing power of the returns to be
received.
The inflation may be Demand pull or cost push inflation.
Unsystematic Risk:
It is the factors are specific, unique and related to the particular industry or company.
Unsystematic risk stems from managerial inefficiency, technological change in the production
process, availability of raw material, changes in the consumer preference and labour problem.
Unsystematic risk can be classified into:
Business Risk
Financial Risk
Business Risk:
Business risk is that portion of the unsystematic risk caused by the operating environment of
the business. Variation that occurs in the operating environment is reflected on the operating income
and expected dividends.
Business risk can be sub – divided into:
Internal Business Risk
External Business Risk
Internal Business risk:

AKSHARA INSTITUTE OF MANAGEMENT & TECHNOLOGY.
(Approved by AICTE, New Delhi. & Affiliated to Sri Venkateswara University, Tirupati.)
Prepared by: Dr. M.A.Dhandapani., M.Com., MBA., M.Phil., Ph.D I-CET CODE :AMTT Page 19
Fluctuations in the sales
Research and Development
Personnel Management
Fixed cost
Single product
External Business Risk:
Social and regulatory factors
Political risk
Business Cycle
Financial Risk:
It refers to the variability of the income to the equity capital due to the debt capital. Financial
risk in a company is associated with the capital Structure of the company.
Capital Structure of the company consists of Equity funds and borrowed funds.
The presence of debt and preference capital results in a commitment of paying interest or pre
fixed rate of dividend.
Return:
Return is the primary motivating force that drives investment. It represents the reward for
undertaking investment. Since the game of investing is about returns (after allowing for risk),
measurement of realised (historical) returns is necessary to assess how well the investment manager
has done. In addition, historical returns are often used as an important input in estimating future
(prospective) returns.
It is a Reward for the undertaking investment.
Measurement of realised return
The return of an investment consists of two components:
Current Return
Capital Return
Current Return:
The first component that often comes to mind when one is thinking about return is the
periodic cash flow (income or interest), such as dividend or interest, generated by the investment.
Current return is measured as the periodic income in relation to the beginning price of the investment.
Capital Return:
The second component of return is reflected in the price change called the capital return. It is
simply the price appreciation or depreciation divided the beginning price of the asset. For assets like
equity stocks, the capital return predominates.
The total return for any security is defined as:
Total return = Current return + Capital return
The current return can be zero or positive, whereas the capital return can be negative.
Measuring Historical Return:
The total return on an investment for a given period is:
Total Return =

AKSHARA INSTITUTE OF MANAGEMENT & TECHNOLOGY.
(Approved by AICTE, New Delhi. & Affiliated to Sri Venkateswara University, Tirupati.)
Prepared by: Dr. M.A.Dhandapani., M.Com., MBA., M.Phil., Ph.D I-CET CODE :AMTT Page 20
Where:
C= Cash inflow PE
= Ending price
PB = Beginning Price
BOND:
A Bond is a contract that requires the borrower to pay the interest income to the lender. It
resembles the promissory note and issued by the government and corporate. The par value of the
bond indicates the face value of the bond. i.e. the value stated on the bond paper.
Most of the bonds make fixed interest payment till the maturity period. This specific rate of interest is
known as coupon rate paid quarterly, semi – annually and annually. At the end of the maturity period
the value is repaid.
A long-term debt instrument (a legal contract) in which a borrower agrees to make payments
of principal and interest, on specific dates, to the holders of the bond.
It is a Debt instrument issued by Govt. and Public Sector companies.
Features of Bonds:
The features of bonds are:
1. Face Value:
a. Value printed on the bond
b. Basis for payment of interest
c. We may or not issue at face value or par, premium and Discount value.
2. Redemption Value:
a. Value of buying back of the bonds
b. Max the face value – premium, less than face value – discount and equal to face value
– Re demand at par
3. Coupon rate:
a. Rate of interest to be paid
4. Maturity Period:
a. Period for which bond is issued
b. Pay interest only to maturity period
c. After that no interest is paid
5. Collateral:
a. Security against which the bonds an issued to the bond holder. If interest is not paid
then “bond trustee” dispose this collateral to pay interest.
6. Bond Indent:
a. Agreement among – bond holders, company and bond trustee.
Contains terms and conditions on the above said features and rights of the each party.
TYPES OF BONDS:
Bonds are classified as:
1. Convertible Bonds: - bond for some time than it become convertible to shares. Ex: after 5

AKSHARA INSTITUTE OF MANAGEMENT & TECHNOLOGY.
(Approved by AICTE, New Delhi. & Affiliated to Sri Venkateswara University, Tirupati.)
Prepared by: Dr. M.A.Dhandapani., M.Com., MBA., M.Phil., Ph.D I-CET CODE :AMTT Page 21
years the bond can be convertible bond Rs. 100. With coupon rate 10% which will be
converted into 2 equity shares of Rs, 50. Each.
2. Non – Convertible Bonds: - Continue as bond through the maturity period.
3. Redeemable Bonds: - Specified about the redemption period then it will buy back at
Premium or discount
4. Irredeemable bonds: - No Specification about maturity to bond holders get interest till the
company buys it back.
5. Secured Bond:- company mortgagers some of it assets. Ex: building, land etc. With the
trustee if co. fails to pay interest, trustee will sell these assets to make payment.
6. Unsecured Bond:- No such a mortgages
7. Callable Bonds: - company has the right redeem before maturity period. When market
interest rate < coupon.
8. Put able Bonds: - Bond holders have the right to redeem before maturity period. When
market interest rate >Coupon rate
9. Junk Bonds:- high coupon rate and not secured by an asset. More risk of default, speculators
prefer than bonds.
10. Zero Bonds:- no coupon rate but compulsory converted into equity share. Within the 3 years
of issue.
11. Deep Discount bonds: - it is a zero coupon bond without compulsion to convert, issue at
discount.
BOND CHARACTERISTICS:
A bond obligates the issuer to make specified payments (interest and principal) to the
bondholder. There are: -
Par value,
Coupon Rate and
Maturity Data.
Par Value: the par value is the value stated on the face of bond. It represents the amount the issuer
promises to pay at the time of the maturity.
Coupon Rate: the coupon rate is the interest rate payable to the bond holder.
Maturity Date: the maturity date is the date when the principal amount is payable to the bond
holder.
BOND YIELD:
Bond yield is the return on a bond made up of 3 components.
Coupon Rate
Capital Gain
Interest on Maturity
Generally classified in to 2 components
Capital Gain
Revenue Gain
Factors affecting bond yield or Bond Risk:
Generally stocks are considered to be risky but bonds are not. This is not fully correct. Bonds
do have risk but the nature and types of risks may be different. The risks are interest rate, default,
marketability and call ability risk.
Interest rate risk:
o Variability in the return from the debt instruments to investors is caused by the changes in the market interest rate.
o This is known as interest rate risk. changes that occur in interest rate affect the bonds more directly then the equity.

AKSHARA INSTITUTE OF MANAGEMENT & TECHNOLOGY.
(Approved by AICTE, New Delhi. & Affiliated to Sri Venkateswara University, Tirupati.)
Prepared by: Dr. M.A.Dhandapani., M.Com., MBA., M.Phil., Ph.D I-CET CODE :AMTT Page 22
o There is a relationship between the coupon rate and market interest rate.
o If the market interest rate move up, the price of the bond declines and vice versa. Inflation rate risk:
o The uncertainty over the future value of our investment o Suppose bond is of Rs. 100 and offers 12% P.A and have a maturity of 1 year then be
gets rs.112 after one year.
Default Risk:
o If the company which has issued bond and fails to pay interest or pay redemption value.
o Due to micro and macro environmental factors. Call Risk:
o If the bond is callable bond, then the company has the option to call the bonds before maturity period.
o We lose the opportunity to earn
o This happen when interest rate in the market > coupon rate. Liquidity Risk:
o Few bonds are not preferred by the investor to buy or when we want to sell. So it is difficult to exit from their debt investment.
Reinvestment Risk:
o When a bond pays periodic interest there is a risk that the interest payments may have to be reinvested at a lower interest rate. Called reinvestment risk.
Foreign Exchange Risk:
o If a bond has payments that are denominated in a foreign currency its repee cash flows are uncertain.
Methods or Measures of Bond Yield:
The methods of Bond Yield are:
Current Yield
Holding Period Yield
Yield to Maturity
Approximate Yield to Maturity
Yield to Call
Current Yield:
it is the current return on the investments
Holding Period Yield:
Holding period return an investor buy a bond and sells it after holding for a period. The rate of return
in that holding period is:

AKSHARA INSTITUTE OF MANAGEMENT & TECHNOLOGY.
(Approved by AICTE, New Delhi. & Affiliated to Sri Venkateswara University, Tirupati.)
Prepared by: Dr. M.A.Dhandapani., M.Com., MBA., M.Phil., Ph.D I-CET CODE :AMTT Page 23
Where:
I = Interest/ income/ coupon
amount P0= Current Market Price
Pn= Redemption Value or par Value
Yield to Maturity (YTM):
It is the rate at which NPV (net present value) of the bond = 0 or it is the discount rate at
which present value of cash inflow (PVCI) of bond in feature = PV Of cash outflow of bond PVCO.
Approximate Yield to Maturity:
It is a lengthy process to find the YTM by using IRR Method. Hence an approximation is
made to it in the form of a formula. It is called AYTM.
Where:
I = Interest or income or coupon
amount. P0= Current market price
Pn= Redemption value / Par value
N = Maturity Period
Where:
RL = Lower Rate
RH = High Rate
VL = Value at lower rate VH
= Value at Higher rate O = Out flow
Yield to Call (YTC):
If the bond is callable then the issuer has the right to redeem before maturity period.
YTC formula is some as AYTM but n = call period ≠ Maturity period.

AKSHARA INSTITUTE OF MANAGEMENT & TECHNOLOGY.
(Approved by AICTE, New Delhi. & Affiliated to Sri Venkateswara University, Tirupati.)
Prepared by: Dr. M.A.Dhandapani., M.Com., MBA., M.Phil., Ph.D I-CET CODE :AMTT Page 24
I = Interest or income or coupon
amount. P0= Current market price
Pn= Redemption value / Par value N = Callable Period
BOND PRICE:
The value of bond or any asset, real or financial is equal to the present value of the cash flows
expected from Bond.
The value of a bond requires:
An estimate of expected cash flows
As estimate of the required returns
Bond Valuation:
It refers to the process of determining the value or price of a bond.
As the cash flows are spread over a period of years in the future. All the future cash flow have
to be converted into present to determine the value of the bond.
Where:
T= time period when the payment is
received P = Value of the bond at present.
C = Coupon rate or annual interest
payment M = Maturity value
N = no – of years
R = Discount rate or interest rate in the market.
Where:
P=value of bond

AKSHARA INSTITUTE OF MANAGEMENT & TECHNOLOGY.
(Approved by AICTE, New Delhi. & Affiliated to Sri Venkateswara University, Tirupati.)
Prepared by: Dr. M.A.Dhandapani., M.Com., MBA., M.Phil., Ph.D I-CET CODE :AMTT Page 25
C/2=semi annual interest
payment r/2=the discount rate of
year
m= maturity value
2n= maturity
period
T=time period when the payment is received
YIELD CURVE:
The bond portfolio manager is often concerned with two aspects of interest rates: the level of
interest rate and the term structure of interest rate. The relationship between the yield and time or
years to maturity is called term structure.
The term structure is also known as yield curve. In analysing the effect of maturity on yield all other
influences are held constant. Usually pure discount instruments are selected to eliminate the effect of
coupon payments.
The bonds chosen do not have early redemption features. The maturity date are different but the
risks, tax liabilities and redemption possibilities are similar.
Its shows YTM is related to term to maturity for bonds that are similar in all aspects excepting
maturity.
The following data for government securities:
Face
Value
Interest
rate
Maturity
years
Current
Price YTM
100000 0 1 88.968 12.40
100000 12.75 2 99.367 13.13
100000 13.50 3 100.352 13.35
100000 13.50 4 99.706 13.60
100000 13.75 5 99.484 13.90
BOND DURATION:
Duration of a bond is generally mean that maturity period. But it is a wrong measure because
Zero coupon bond and 10% coupon bond of same maturity and have some duration but 10% coupon

AKSHARA INSTITUTE OF MANAGEMENT & TECHNOLOGY.
(Approved by AICTE, New Delhi. & Affiliated to Sri Venkateswara University, Tirupati.)
Prepared by: Dr. M.A.Dhandapani., M.Com., MBA., M.Phil., Ph.D I-CET CODE :AMTT Page 26
bond recover “Purchase Price” Exactly the Zero Coupon.
There four measure of life of a bond must consider not only timing of cash flows but also size
of cash inflow.
Fredrick R Maculay: in 1983 has given such a measure for life of a bond and it is popularly known
as Maculay’s Duration of a bond.
Definition:
Maculay’s Duration is the weighted average maturity of a bonds cash flows on a present value basis.
MD’s is number of years needed to fully recover purchase price of a bond taking present values of its
cash inflows.
Procedure to Calculate Maculay’s Duration:
1. List out the years in which cash inflows are realized.
2. List out cash flows realized in respective years.
3. List out present value factor’s for each years cash flow taking discount rate (YTM).
4. Multiply (PVF) and (CF) to get present value of each cash flow
5. Then add all PVCI i.e. ∑ PVCI (present value cash inflow) = P0
6. Find the weight of patch cash flow in ∑ PVCI. Wt =
7. Multiply weight and years of cash inflow 8. Add all the above (weight X years) to get maculay’s Duration.
Maculay’s Duration (MD) = ∑Wt (t) Where:
Wt = Weight of cash flow T
= time period in years
Years CI PVAF PVCI PVCI /
P0 = Wt
Wt X t
P0 MD = ?
IMMUNISATION:
Immunisation is a technique that makes the bond portfolio holder to be relatively certain
about the promised stream of cash flows. The bond interest rate risk raises form the changes in the
market interest rate.
The market rate affects the coupon rate and the price of the bond. In the immunisation
process, the coupon rate risk and the price of the bonds fall.
At the same time the newly issued bonds offer higher interest rate.
The coupon can be reinvested in the bonds offering higher interest rate and losses that occur
due to the fall in the price of bond can be offset and the portfolio is said to be immunized.
The process the bond portfolio manager or investor has to calculate the duration of the promised
outflow of the funds and invest in a portfolio of bonds which has an identical duration.
The bond portfolio duration is the weighted average of the durations of the individual bonds
in the portfolio.
For Example: if an investor has invested equal amount of money in three bonds namely A,B
and C with a duration of 2, 3 and 4 years respectively, then the bond portfolio duration is

AKSHARA INSTITUTE OF MANAGEMENT & TECHNOLOGY.
(Approved by AICTE, New Delhi. & Affiliated to Sri Venkateswara University, Tirupati.)
Prepared by: Dr. M.A.Dhandapani., M.Com., MBA., M.Phil., Ph.D I-CET CODE :AMTT Page 27
D = 1/3 x 2 + 1/3 x3 + 1/3 x 4
= 0.66 + 1+1.33
D = 2.99 or 3 years.
By matching the outflow duration with cash inflow duration from bond investment the bond manager
can offset the interest rate risk and price risk. the portfolio of money to be invested between the
different types of bonds also can be found. The equation is:
Investment outflow = (X1 x Duration of bond1) + (X2 x Duration of bond2)
X1, X2 is the proportion of the investment on bond 1 and 2.
(X1 x D1) + (X2 x D2) = 2
Where:
X1 = the proportion of the investment on bond A X2 = the proportion of the investment on bond B D1 = Duration of bond A
D2 = Duration of Bond B
Duration (MD) = ∑Wt (t) Where:
Wt = Weight of cash flow T = time period in years
Years CI PVAF PVCI PVCI / P0 = Wt Wt X t
P0 MD = ?

AKSHARA INSTITUTE OF MANAGEMENT & TECHNOLOGY.
(Approved by AICTE, New Delhi. & Affiliated to Sri Venkateswara University, Tirupati.)
Prepared by: Dr. M.A.Dhandapani., M.Com., MBA., M.Phil., Ph.D I-CET CODE :AMTT Page 28
Index Means:
UNIT – III
INDEX MODELS

pared By: | M.Subramanyiam Reddy., MBA., P h.D., Assistant Professor, RITS Pre 30
Alphabetically arranged list of items (such as names or terms) given at the end of a printed
text with page numbers on which the item can be found.
Indexes (indices) also measure up and down movement of industrial production, and of the
market prices of bonds, commodities, shares, etc. See also indexation.
An index is a statistical measure of the changes in a portfolio of stocks representing the
overall market.
What is Index:
An Index is a statistical aggregate that measures change. It is and indicator. Sensex and Nifty are
large capital index in India.
Uses of Index:
Indicator of market movement/returns
It reflects highly up-to-date information
Lead indicator of the economy
Stock Market:
A stock market is a physical place, where brokers gather to buy and sell stocks and other
securities. It enables the trading of stocks. Stock market indexes are meant to capture the overall
behaviour of equity markets
Types of Stock Index:
There are mainly three types of stock index
Market capitalization weighted index
Free-float market capitalization weighted index
Price weighted index
Index Futures: Index futures is one of the most successful financial innovation of financial market.
In 1982, the stock index futures is the futures contract made on the major stock market index. The
stock index futures has the following characteristics.
It is an obligation and not an option
Settlement value depends
o On the value of stock index and the price at which the original contract is struck and o On the specified time the difference between the index value at the last closing day of
the contract and the original price of the contract
Basis of the stock index futures is the specified stock market index. No physical delivery of
stock is made.
Importance of Index
Easy location
Save times and efforts
Efficiency Cross reference
Reduce cost
An index is a statistical measure of the changes in a portfolio of stocks representing the overall
market.
Risk Premium:

pared By: | M.Subramanyiam Reddy., MBA., P h.D., Assistant Professor, RITS Pre 31
A risk premium is the return in excess of the risk-free rate of return an investment is expected
to yield; an asset's risk premium is a form of compensation for investors who tolerate the extra risk,
compared to that of a risk-free asset, in a given investment. For example, high-quality corporate
bonds issued by established corporations earning large profits have very little risk of default.
Therefore, such bonds pay a lower interest rate, or yield, than bonds issued by less-established
companies with uncertain profitability and relatively higher default risk
Investors expect to be properly compensated for the amount of risk they undertake in the form
of a risk premium, or additional returns above the rate of return on a risk-free investment such as U.S.
government-issued securities. In other words, investors risk losing their money because of the
uncertainty of a potential investment failure on the part of the borrower in exchange for receiving
extra returns as a reward if the investment turns out to be profitable. Therefore, the prospect of
earning a risk premium does not mean investors can actually get it because it is possible the borrower
may default absent a successful investment outcome.
Portfolio Risk:
Portfolio Management is management of large investible funds with a view to maximizing
return and minimizing risk.
Though return of portfolio is the weighted average return of individual assets in the portfolio.
But risk of a portfolio is not a weighted average risk of individual assets. Because overall risk is
reduced by combining assets into one portfolio.
When two or more securities or assets are combined in portfolio, their covariance or interactive risk
is to be considered. Thus if the returns on two assets more together their co-variance is positive and
the risk is more on such portfolio. If on the other hand the returns more independently or in opposite
directions the co – variance is negative and the risk in total will be lower.
Where:
Cov xy = Covariance
Rx= Return on Security x1
Ry = Return on Security y1
Rx = Expected Return x Ry
= Expected Return y
N = No – of – Observations.
The co – efficient of correlation is another measure designed to indicated the similarity or
dissimilarity in the behaviour of two variables.
Correlation co – efficient of x and y as:

pared By: | M.Subramanyiam Reddy., MBA., P h.D., Assistant Professor, RITS Pre 32
Where:
The correlation of co – efficient indicates the similarity or dissimilarity in the behaviour of x
and y stocks. In correlation, co – variance is not taken as an absolute value but relative to the standard
deviation of individual securities. It shows, how much x and y vary together as a proportion of their
combined individual variations measured by Standard Deviation of x and standard deviation of y. In
our example the correlation co – efficient is -1.0 which indicates that there is a perfect negative
correlation and the returns move in the opposite direction. If the correlation is 1, means perfect
positive correlation exists between the securities and they tend to move in the same direction. If the
correlation co-efficient is Zero, the securities returns are independent. Thus, the correlation between
two securities depends upon the covariance between the two securities and the standard deviation of
each security.
Now, let us proceed to calculate the portfolio risk. Combination of two securities reduces the risk
factor if less degree of positive correlation exists between them.
Expected Return on Portfolio:
Where:
Rp = Return on the Portfolio
X1 = Proportion of total portfolio invested in security 1
R1 = Expected return of Security 1
Where:
MARKOWITZ PORTFOLIO SELECTION:

pared By: | M.Subramanyiam Reddy., MBA., P h.D., Assistant Professor, RITS Pre 33
Portfolio means:
A portfolio is a grouping of financial assets such as stocks, bonds, cash equivalents as well as
their mutual, exchange –traded and closed-fund counterparts. His choice depends upon the risk-return
characteristics of individual securities.
Phases of Portfolio Management
Building a Portfolio:
Step-1 : Use the Markowitz portfolio selection model to identify optimal combinations.
Step-2 : consider borrowing and lending possibilities.
Step-3 : choose the final portfolio based on your preferences for return relative to risk.
PORTFOLIO SELECTION:
• Goal: finding the optimal portfolio
• OPTIMAL PORTFOLIO: Portfolio that provides the highest return and lowest risk.
• Method of portfolio selection: Markowitz model
The proper goal of portfolio construction would be to generate a portfolio that provides the
highest return and the lowest risk is called optimal portfolio. The process of finding the optimal
portfolio is described as Portfolio selection.
Efficient Set of Portfolio:
The concept of efficient portfolio - let us consider various combinations of securities and
designated them as portfolio 1 to n.
The risk of these portfolios may be estimated by measuring the standard deviation of portfolio
returns.
Feasible set of portfolio:
Also known as portfolio opportunity set.
With a limited no of securities an investor can create a very large no. of portfolios by
combining these’s securities in different proportions.
EFFICIENT PORTFOLIO
Portfolio
No
Expected
Return
Standard
Deviation
Portfolio Management
Security
Analysis
Portfolio
Analysis
Portfolio
Selection
Portfolio
Revision
Portfolio
Evaluatio
1. Fundamental Analysis
2. Technical Analysis
3. Market Hypothesis
Diversification 1. Markowitz Model
2. Sharpe’s Single
Index Model
3. CAPM
4. APT
1. Formula
Plans
2. Rupee Cost
Averaging
1. Sharpe’s Index
2. Treynor’s Measure
3. Jenson’s Measure
4. M2 Measure

pared By: | M.Subramanyiam Reddy., MBA., P h.D., Assistant Professor, RITS Pre 34
1 5.6 4.5
2 7.8 5.8
3 9.2 7.6
4 10.5 8.1
5 11.7 8.1
6 12.4 9.3
7 13.5 9.5
8 13.5 11.3
9 15.7 12.7
10 16.8 12.09
Compare 4 & 5 which have same standard deviation:
Portfolio
No
Expected
Return
Standard
Deviation
1 5.6 4.5 Higher return?? Pf no.5 gives higher
expected return which is more efficient
portfolio then Pf no. 4.
2 7.8 5.8
3 9.2 7.6
4 10.5 8.1
5 11.7 8.1
6 12.4 9.3
Compare 7 & 8 which have same Expected Return:
Portfolio
No
Expected
Return
Standard
Deviation
1 5.6 4.5
2 7.8 5.8
3 9.2 7.6
Lower standard deviation?? Pf no.7
which is more efficient portfolio then Pf
no. 8.
4 10.5 8.1
5 11.7 8.1
6 12.4 9.3
7 13.5 9.5
8 13.5 11.3 9 15.7 12.7
10 16.8 12.09
CRITERIA: EFFICIENT PROTFOLIO
Given 2 portfolio with the same expected return, the investor would prefer the one with the
lower risk.
Given 2 portfolio with the same risk, the investor would prefer the one with the higher
expected return.

Prepared By: | M.Subramanyiam Reddy., MBA., Ph.D., Assistant Professor, RITS 35
Grouping of financial stocks :
Stock
1
Stock
2
Compare Result
E F Same return but E has Less risk then F E has preferred C has minimum
risk and B has
maximum risk C E Same risk but E offer more return E has preferred Based on these
we drawing
efficient frontier
C A Same return but C less risk C has preferred
A B Same level of risk but B has higher
return.
B has preferred
Harry Max Markowitz Model:
Harry Max Markowitz (born August 24, 1927) is an American economist. He is best known for his
pioneering work in Modern Portfolio Theory. Harry Markowitz put forward this model in 1952.
Studied the effects of asset risk, return, correlation and diversification on probable investment
portfolio returns.
Essence of Markowitz Model “Do not put all your eggs in one basket”
An investor has a certain amount of capital he wants to invest over a single time horizon.
He can choose between different investment instruments, like stocks, bonds, options,
currency, or portfolio. The investment decision depends on the future risk and return.
The decision also depends on if he or she wants to either maximize the yield or Minimize the
risk.
Markowitz model assists in the selection of the most efficient by analysing various possible

Prepared By: | M.Subramanyiam Reddy., MBA., Ph.D., Assistant Professor, RITS 36
portfolios of the given securities.
By choosing securities that do not 'move' exactly together, the HM model shows investors
how to reduce their risk.
The HM model is also called Mean-Variance Model due to the fact that it is based on
expected returns (mean) and the standard deviation (variance) of the various portfolios.
Diversification and Portfolio Risk:
Diversification is a technique of reducing the risk involved in investment and in portfolio
management. This is a process of conscious selection of assets, instruments and scrips of
companies/government securities, in a manner that the total risks are brought down. This process
helps in the reduction of risk, under category of what is known as unsystematic risk and promotes the
optimisation of returns for a given level of risks in portfolio management.
Market risk versus Unique risk:
The portfolio risk does not fall below a certain level, irrespective of how wide the
diversification is why?. The answer lies in the following relationship which represents a basic insight
of modern portfolio theory.
Total Risk = Unique risk + Market Risk
The unique risk of a security represents that portion of its total risk which stems from firm – specific
factors like the development of a new product, a labour strike, or the emergence of a new competitor.
Events of this nature primarily affect the specific firm and not all firms in general. Hence the unique
risk of a stock can be washed away by combining it with other stocks. In a diversified portfolio,
unique risks of different stocks tend to cancel each other – a favourable development in one firm may
offset an adverse happening in another and vice versa. Hence, unique risk is also referred to as
diversifiable risk or unsystematic risk.
The Market Risk of a stock represents that portion of its risk which is attributable to economy – wide
factors like the growth rate of GNP, the level of government spending, money supply, interest rate
structure, and inflation rate. Since these factors affect all firms to a greater or lesser degree, investors
cannot avoid the risk arising from them, however diversified their portfolios may be. Hence, it is also
referred to as systematic risk or non – diversifiable risk.
Markowitz Model Assumptions:
An investor has a certain amount of capital he wants to invest over a single time horizon.
He can choose between different investment instruments, like stocks, bonds, options,
currency, or portfolio.
The investment decision depends on the future risk and return. The decision also depends on
if he or she wants to either maximize the yield or minimize the risk.
The investor is only willing to accept a higher risk if he or she gets a higher expected return.

Prepared By: | M.Subramanyiam Reddy., MBA., Ph.D., Assistant Professor, RITS 37
Tools of Selection of Portfolio – Markowitz Model:
1. Expected return (Mean):
Mean and average to refer to the sum of all values divided by the total number of values.
The mean is the usual average, so:
(13 + 18 + 13 + 14 + 13 + 16 + 14 + 21 + 13) ÷ 9 = 15
Expected Return on Portfolio:
(OR)
Where:
ER = The expected return on Portfolio
E(Ri) = The estimated return in scenario i
Wi = Weight of security i occurring in the port folio.
Rp = Return on the Portfolio
X1 = Proportion of total portfolio invested in security 1
R1 = Expected return of Security 1
(OR)
Where:
Rp = The expected return on Portfolio
R1= The estimated return in Security 1
R2= The estimated return in Security 1
W1= Proportion of security 1 occurring in the port folio
W2 = Proportion of security 1 occurring in the port folio
2. Variance & Co-variance
The variance is a measure of how far a set of numbers is spread out. It is one of several descriptors of
a probability distribution, describing how far the numbers lie from the mean (expected value).
Co-variance
Covariance reflects the degree to which the returns of the two securities vary or change
together.
A positive covariance means that the returns of the two securities move in the same direction.
A negative covariance implies that the returns of the two securities move in opposite
direction

Prepared By: | M.Subramanyiam Reddy., MBA., Ph.D., Assistant Professor, RITS 38
Where:
Cov xy = Co - variance Rx=
Return on Security x1 Ry =
Return on Security y1 Rx =
Expected Return x Ry =
Expected Return y
N = No – of – Observations.
The co – efficient of correlation is another measure designed to indicated the similarity or
dissimilarity in the behaviour of two variables
Correlation co – efficient of x and y as:
Where:
Portfolio Risk:
The riskiness of a portfolio that is made of different risky assets is a function of three different factors:
the riskiness of the individual assets that make up the portfolio
the relative weights of the assets in the portfolio
the degree of variation of returns of the assets making up the portfolio
The standard deviation of a two-asset portfolio may be measured using the Markowitz Model:
(OR)
Where:
Optimal Portfolio:

Prepared By: | M.Subramanyiam Reddy., MBA., Ph.D., Assistant Professor, RITS 39
The optimal portfolio concept falls under the modern portfolio theory. The theory assumes that
investors fanatically try to minimize risk while striving for the highest return possible.
Single Index Model
The single index model (SIM) is a simple asset pricing model to measure both the risk and the
return of a stock. The model has been developed by William Sharpe in 1963 and is commonly used in
the finance industry. rmt is the return to the market portfolio in period t.
The investor always likes to purchase combination of stocks the highest return and as lowest
risk. - The Markowitz model
Sharpe has developed a simplified model to analyse the portfolio. He assumed that the return
of a security is linearly related to single index like the Market index.
The market index should consist of all the securities trading on the exchange. Ex: BSE-
sensex, BSE – 100 and NSE – 50.
Single index model casual observation of the stock process over a period of time reveals that
most of the stock prices move with the market index. When “the sensex increases, stock prices also
tend to increase and vice – versa”. This indicates that some underlying factors affect the market index
as well as the stock prices. Stock prices are related to the market index and this relationship could be
used to estimate the return on stock.
The following equation can be used:
Where:
Ri= Expected return on security i

Prepared By: | M.Subramanyiam Reddy., MBA., Ph.D., Assistant Professor, RITS 40
i
m
According to the equation, the return of a stock can be divided into two components,
the return due to the market and
the return independent of the market.
Beta i indicates the sensitiveness of the stock return to the changes in the market return.
For example beta i of 1.5 means that the stock return is expected to increase by 1.5% when the
market index return increase by 1% and vice - versa. Likewise beat i of 0.5 expresses that the
individual stock return would change by 0.5 % when there is a change of 1 % in the market return.
Beta i of 1 indicates that the market return and the security return are moving in tandem. The
estimates of beta i and alpha i are obtained from regression analysis.
the single index model is based on the assumption that stocks vary together because of the common
movement in the stock market and there are no effects beyond the market (i.e. any fundamental factor
effects) that account the stocks co-movement. The expected return, standard deviation and co –
variance of the single index model represent the joint movement of securities. The mean return is
The variance of security’s return, σ2 = β2i σ
2m + σei
2
The covariance of returns between securities i and j
σij= βi β j σ2
The variance of the security has two components namely, systematic risk or market risk and
unsystematic risk or unique risk. The variance explained by the index is referred to systematic risk.
The unexplained variance is called residual variance or unsystematic risk.
Systematic risk = β2i x variance of market index
= β2i σ2
m
Unsystematic risk = Total variance – systematic risk
ei2 = σ 2 – systematic risk
thus the total risk = Systematic risk + Unsystematic risk
= β2i σ
2 + ei2
The Portfolio Variance:
Where:
Xi = The portion of stock i in the portfolio
Likewise expected return on the portfolio also can be estimated. For each security αi and βi Should be
estimated.
m

Prepared By: | M.Subramanyiam Reddy., MBA., Ph.D., Assistant Professor, RITS 41
Portfolio return is the weighted average of the estimated return for each security in the portfolio. The
weights are the respective stocks proportion in the portfolio.
A portfolio’s alpha value is a weighted average of the alpha values for its component securities using
the proportion of the investment in a security as weight.
Similarly, a portfolio’s beta value is the weighted average of the beta values of its component stocks
using relative share of them in the portfolio as weight.
Where:
CAPITAL ASSET PRICING MODEL:
Investors are interested in knowing the systematic risk when they search for efficient
portfolios. They would like to have assets with low beta co – efficient i.e. systematic risk. investors
would opt for high bet co –efficient only if they provide high rates of return. The risk verse nature of
the investors is the underlying factor for this behaviour. The capital asset pricing theory helps the
investors to understand the risk and return relationship of the securities. The assets should be priced
in capital market.
No matter how much we diversify our investments, it's impossible to get rid of all the risk.
As investors, we deserve a rate of return that compensates us for taking on risk. The capital asset
pricing model (CAPM) helps us to calculate investment risk and what return on investment we
should expect.
Markowitz, William sharpe, John Lintner and jam Mossin Provided the basic structure for the
CAPM theory, the required rate return of an asset is having a linear relationship with asset’s beta
value i.e. undiversifiable or systematic risk.
CAPM Assumptions:
1. An individual seller or buyer cannot affect the price of a stock. This assumption is the basic
assumption of the perfectly competitive market.
2. Investors make their decisions only on the basis of the expected returns, standard deviations
and covariance of all pairs of securities.
3. Investors are assumed to have homogenous expectations during the decision – making period.

Prepared By: | M.Subramanyiam Reddy., MBA., Ph.D., Assistant Professor, RITS 42
4. The investor can lend or borrow any amount of funds at the riskless rate of interest. The
riskless rate of interest is the rate of interest offered for the treasury bills or government
securities.
5. Assets are infinitely divisible. According to this assumption, investor could buy any quantity
of share i.e. they can even buy ten rupees worth of reliance industry shares.
6. There is no transaction cost i.e. no cost involved in buying and selling of stocks.
7. There is no personal income tax. Hence , the investor is indifferent to the form of return either
capital gain or dividend.
8. Unlimited quantum of short sales, is allowed. Any amount of shares an individual can sell
short.
The concept, CAPM according to all investors hold only the market portfolio and riskless securities.
The market portfolio is a portfolio comprised of all stocks in the market. Each asset is held in
proportion to its market value to the total value of all risky assets. For example, if reliance industry
share represents 20% of all risky assets, then the market portfolio of the individual investor contains
20% of reliance industry shares. At this stage, the investor has the ability to borrow or lend any
amount of money at the riskless rate of interest. The efficient frontier of the investor is given in
below
CAPM is model that describes the relationship between systematic risk and expected return for assets
particularly stock.
It is concerned with 2 key:
What is the relationship between risk and return for an efficient portfolio.
What is the relationship between risk and return for an individual securities.
CAPM is a model of linear general equilibrium return. The CAPM is an equilibrium model that
specifies the relationship between risk and required rate of return. For assets held in well –
diversified portfolios.
CAPM describes the relationship between risk and expected return. And it serves as a model for the
pricing of risky securities. CAPM says that expected return of a security or a portfolio equals the rate
on a risk free security + a risk premium.
The above efficient frontier of the investor. The investor prefers any point between B and C because,
The efficient frontier is the set of optimal portfolios that offers the highest expected return for a
defined level of risk or the lowest risk for a given level of expected return. Portfolios that lie below
the efficient frontier are sub-optimal, because they do not provide enough return for the level of
risk. Portfolios that cluster to the right of the efficient frontier are also sub-optimal, because they
have a higher level of risk for the defined rate of return.

Prepared By: | M.Subramanyiam Reddy., MBA., Ph.D., Assistant Professor, RITS 43
with the same level of risky face on line BA, they are able to get superior profits. The ABC line
shows the investor’s portfolio of risky assets. The investors can combine riskless asset either by
lending or borrowing.
Capital Market Line:
In the 1950’s Harry Markowitz wrote his doctoral dissertation entitled “Portfolio Selection.” In it he
identified the efficient frontier which is the hypothetical set of all possible efficient portfolios. An
efficient portfolio is any portfolio with an expected return that is greater than any other portfolio with
the same risk level, and less risk (i.e., σ) than any other portfolio with the same return. However,
Markowitz’s study looked at the (massive) empirical record of investment returns but only
considered risky assets – it did not include risk-free assets (the risk-free asset is usually considered to
be the 90-day T-bill). Also, Markowitz’s study did not consider the use of leverage. The efficient
frontier and the CML use standard deviation (σ) to measure risk.
All efficient portfolios lie on the efficient frontier. But when an efficient portfolio consisting
of only risky assets is combined with a risk-free asset, the efficient portfolios no longer lie on the
curved efficient frontier. Instead, by combining a risk-free asset with the risky-asset portfolio, an
enhanced linear efficient frontier is realized: it is called the capital market line (CML). Theoretically,
there is only one CML.
The CML then extends linearly to a point where the CML is tangent to the efficient frontier.
This point is referred to as the market portfolio. The market portfolio includes all risky assets (and
only risky assets). The market portfolio contains only systematic risk; all non-systematic risk has
been diversified away. The risky assets are included in proportion to their market value, however
only risky assets with a positive market value are included (i.e., those assets for which there is a
demand). There are no risk-free assets in the market portfolio.
Every investor (presumably) wants to invest in the market portfolio and either lend money at
the risk-free rate (i.e., purchase T-bills) or borrow money at the risk-free rate (i.e., use leverage) to
purchase additional risky-assets. If the blended portfolio lies on the CML somewhere between the Rf
intercept (i.e., the risk-free rate) and point of tangency (i.e., the market portfolio), the investor’s
portfolio consists of a blend of T-bills and some proportion of risky assets. If the investor’s portfolio
lies on the CML beginning at the market portfolio or beyond, the investor’s portfolio consists only
risky at assets. Leverage is not utilized at the point of tangency (i.e., the market portfolio). But as the
investor moves beyond the market portfolio on the CML, leverage is utilized. An investor’s risk
preference will determine the investor’s portfolio position on the CML.
There is a direct correspondence between the proportion of risk-free assets and risky assets in
the investor’s portfolio and the portfolio’s risk (σ). For example, if an investor’s portfolio consists of

Prepared By: | M.Subramanyiam Reddy., MBA., Ph.D., Assistant Professor, RITS 44
50% risk-free assets and 50% risky assets, the investor’s portfolio risk is 50% of the market
portfolio’s standard deviation (σ); if the investor’s portfolio consists of 20% risk-free assets and 80%
risky assets, the investor’s portfolio risk is 80% of the market portfolio’s standard deviation (σ), etc.
The CML Equation is:
]
CML = Rf + Risk Premium
E(Rp) = Rf + ]
Where:
E(Rp) = Portfolio’s expected rate of return
Rm = expected return on market portfolio
σm = standard deviation of market portfolio
Rf = Risk free Return
For a portfolio on the capital market line. The expected rate of return in excess of the risk free rate is
in proportion to the standard deviation of the market portfolio. The process of the risk is given by the
slope of the line. The slope equals the risk premium for the market portfolio Rm – Rf divided by the
risk or standard deviation of the market portfolio. Thus the expected return of an efficient portfolio is
Expected return = price of time + (price of risk x amount of risk)
Price of time is the risk free rate of return. Price of risk is the premium amount higher and above the
risk free return.
The clear conclusion of the CML equation is higher returns require additional risk.
Return of the portfolio is = Risk free return + Market risk premium. (Rm – Rf)
If SD of the market is grater then the risk premium will be large in creating the return of the portfolio.
The CML slope indicates the additional incremental returns expected by the market place. Only
efficient Portfolio are on the CML.
Inefficient portfolio (or) individual securities will not plot on the CML. It will be SML must be used.
Security Market Line:
The risk – return relationship of an efficient portfolio is measured by the capital market line.
But, it does not show the risk-return trade off for other portfolio and individual securities.
Inefficient portfolios lie below the capital market line and the risk – return relationship connot be
established with the help of the capital market line . Standard deviation includes the systematic and
unsystematic risk. unsystematic risk can be diversified and it is not related to the market.
If the unsystematic risk is eliminated then the matter of concern is systematic risk alone. This
systematic risk could be measured by beta. The beta analysis is useful for individual securities and
portfolios whether efficient or inefficient.
When an additional security is added to the market portfolio, an additional risk is also added
to it. The variance of a portfolio is equal to the weighted sum of the co – variance of the individual
securities in the portfolio. If we add an additional security to the market portfolio, its marginal

Prepared By: | M.Subramanyiam Reddy., MBA., Ph.D., Assistant Professor, RITS 45
contribution to the variance of the market is the covariance between the security’s return and market
portfolio’s return.
If the security i is included, the covariance between the security and the market measures the
risk. covariance can be standardised by dividing it by standard deviation of market portfolio Cov
im/σ. This shows the systematic risk of the security. Then, the expected return of the security i is
given by the equation.
Ri – Rf = Cov im / σm
This equation can be rewritten as follows:
Ri – Rf = Rm - Rf
The first term of the equation is nothing but beta coefficient of the stock. The beta coefficient
of the equation of SML is same as the beta of the market (single index) model. In equilibrium, all
efficient and inefficient portfolios lie along the security market line. The SML line helps to determine
the expected return for a given security beta. In other words, when betas are given, we can generate
expected returns for the given securities.
E(Ri) = Rf + βi [E(Rm) – Rf]
SML is gives the risk and return relationship for individual stock.
If Beta = 1 stock is average risk
Beta > 1 stock is riskier than average
Beta < 1 Stock is less risky than average
The most stock have β in the range of 0.5 to 1.5.
Beta is individual securities are not good estimator of future risk. beta s of portfolio of 10 or
randomly selected stocks are reasonably stable. SML is not produce a correct estimation of Pi.
CAPM = Rf + β (Rm +Rf)
Where:
Rf = Risk free return

Prepared By: | M.Subramanyiam Reddy., MBA., Ph.D., Assistant Professor, RITS 46
β = Market risk or standard deviation
portfolio. Rm = Expected return on market
portfolio.
ARBITRAGE PRICING THEORY:
Arbitrage pricing theory is one of the tools used by the investors and portfolio managers. The
capital asset pricing theory explains the returns of the securities on the basis of their respective betas.
According to the previous models, the investor chooses the investment on the basis of expected
return and variance.
The alternative model developed in asset pricing by Stephen Ross is know as Arbitrage Pricing
Theory (APT) – 1976. APT is explains the nature of equilibrium in the asset pricing a less
complicated manner with fewer assumptions compared to CAPM.
Arbitrage is a process of earning profit by taking advantage of differential pricing for the
same asset.
The process generates riskless profit.
It is of selling security at a high price and the simultaneous purchase of the same security
lower price.
The profit earned through arbitrage is riskless.
Buying and selling activities of the arbitrageur reduces and eliminates the profit margin,
bringing the market price to the equilibrium level.
APT Assumptions:
The investors have homogenous expectations.
The investors are risk averse and utility maximises.
Perfect competition prevails in the market and there is no transaction cost.
The APT theory does not assume:
Single period investment horizon
Not taxes
Investors can borrow and lend at risk free rate of interest
The selection of the portfolio is based on the mean and variance analysis
This assumption are present in the CAPN theory.
Arbitrage Portfolio:
According to the APT theory an investor tries to find out the possibility to increase returns
from his portfolio without increasing the funds in the portfolio.
The investor holds A, B and C securities and he wants to change the proportion of the
securities without any additional financial commitment. Now the change in proportion of
securities can be denoted by XA, Xb and XC.
The increase in the investment in security A could be carried out only if he reduces the
proportion of investment either in B and C because it has already stated that the investor tries
to earn more income without increasing his financial commitment.
Thus the changes in different securities will add up to Zero. This is the basic requirement of an
arbitrage portfolio.
If X indicates the change in proportion

Prepared By: | M.Subramanyiam Reddy., MBA., Ph.D., Assistant Professor, RITS 47
Arbitrage pricing equation:
In a single factor model, the linear relationship between the return Ri and sensitivity bi can be given in
the following form.
Where:
Ri = Return from stock A
It indicates market price of risk and measures the risk return trade off in the security markets.
FUNDAMENTAL ANALYSIS:
Fundamental Analysis is to evaluate the lot information about the past performance and the
expected future performance of companies, industries and the economy as a whole before taking the
investment decision. Such evaluation or analysis is called fundamental analysis.
Fundamental analysis is really a logical and systematic approach to estimating the future dividends
and share price.
Fundamental analysis is performed on historical and present data, but with the goal of making
financial forecasts.
There are several possible objectives:
o To conduct a company stock valuation and predict its probable price evolution.
o To make a projection on its business performance.
o To evaluate its management and make internal business decisions,
o To calculate its risk.
Fundamental Analysis includes:
Economic analysis
Industry analysis
Company analysis

Prepared By: | M.Subramanyiam Reddy., MBA., Ph.D., Assistant Professor, RITS 48
The Analysis of economy, industry and company constitute the main activity in the
fundamental approach to security analysis. And can be viewed as different stages in investment
decision making process.
Three tier analysis depict that company performance dependent not only on its own effort but
also on the general industry and economy factor.
Economy Analysis:
The Economy Analysis is classified to Boom Economy and Recession Economy
Boom Economy – income rise and demand for goods will increase the industries and companies in
general tend to be prosperous.
Recession Economy - income decline and demand for goods will decrease the industries and
companies in general tend to be bad performance.
Growth rates of national Income(GRNI):
GRNI is an important variable can be calculated by GDP, NNP, and GDP to analysis the growth rate
of economy.
Four stages of economy or economic cycle i.e
1. Depression
2. Recovery
3. Boom and
4. Recession
also impact on security performance.
Depression: At this stage demand is low and declining inflation often high and so are interest
rate, companies usually reduce activities and securities performance is poor.
Recovery: Economy begin to revive after depression, demand pick up leading, production
and activities increase.
Boom: High demand with high investment and production, companies earn more profit
Recession: Companies slowly begins downturn in demand, production and employment,
profits are also decline.
Economic Forecasting:
The technique of economic forecasting is to measure either short-term or longer – term
economic developments well in advance.
Forecasting Techniques
Surveys.
Economic Indicators.
Diffusion Indexes.
Economic Model Building .
Opportunistic Model Building.
Industry analysis:
Industry analysis is a type of investment research that begins by focusing on the status of an
industry or an industrial sector.

Prepared By: | M.Subramanyiam Reddy., MBA., Ph.D., Assistant Professor, RITS 49
Why is this important?
Each industry is different, and using one cookie-cutter approach to analysis is sure to create
problems. Imagine, for example, comparing the P/E ratio of a tech company to that of a
utility. Because you are, in effect, comparing apples to oranges, the analysis is next to
useless.
Industry Analysis Looks At
Michael Porter’s 5 Force Model are:
a) Past sales and earnings performance
b) Labor condition within the industry
c) Attitude of government towards industry
d) Competitive condition
e) Stock prices of firm in the industry
Threat of New Entrants.
setting up a chip fabrication factory requires billions of dollars in investment.
Semiconductor companies are forming alliances to spread out the costs of manufacturing.
Meanwhile, the appearance and success of "fabless" chip makers suggests that factory
ownership may not last as a barrier to entry.
Power of Suppliers.
For the large semiconductor companies, suppliers have little power
many smaller chip makers are becoming increasingly dependent on a handful of large
foundries.
Power of Buyers.
Most of the industry's key segments are dominated by a small number of large players. This
means that buyers have more bargaining power.
Availability of Substitutes.
depends on the segment.
Copy-cat suppliers and reverse engg.
Competitive Rivalry.
Intense rivalries between individual companies
The result is an industry that continually produces cutting-edge technology while riding
volatile business conditions.
Company Analysis:
It involves a close investigative scrutiny of the company’s financial and non financial aspects with a
view to identifying its strength, weaknesses and future business prospects.
The financial and non financial aspects are as follows:
Marketing success
Accounting Policies
Profitability
Marketing Success:
The success of the market of the firm depends on The share of the company in the industry ,
Growth of its sales and stability of sales.
Accounting Policies:
A. Inventory Pricing
Cost/market value method

Prepared By: | M.Subramanyiam Reddy., MBA., Ph.D., Assistant Professor, RITS 50
FIFO
LIFO
B. Depreciation methods
Straight line method
Sum of the years digit method
C. Non operating income
Dividend
Interest
D. Tax Carry over
Provision for taxation
Profitability:
A. (a) Gross profit Margin
(b) Net profit Margin
(c) Earning power
(d) Return on equity
(e) Earning per share
(f) Cash EPS
B. Financial Statement Analysis
• Trading, P& L A/C Analysis
• Balance Sheet Analysis
C. Ratio Analysis Liquidity Ratios
Leverage Ratios
Profitability Ratios
Activity / Efficiency Ratio
FUNDAMENTAL ANALYSIS OF A COMPANY
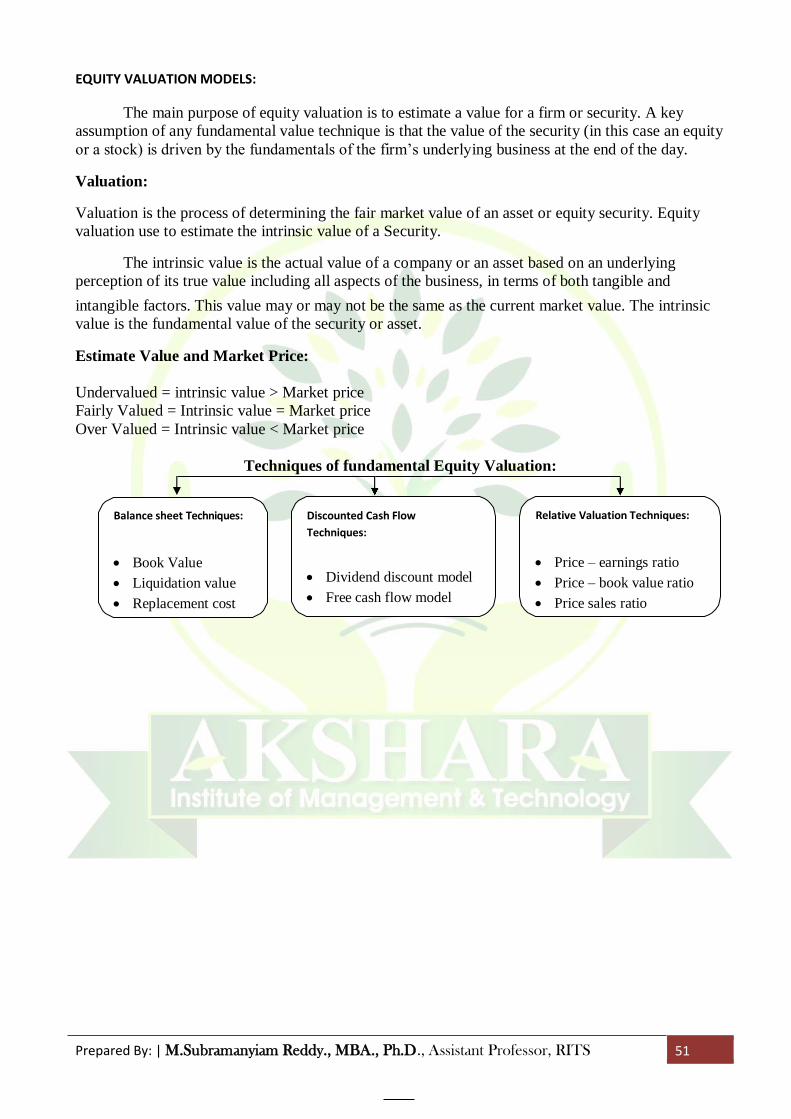
Prepared By: | M.Subramanyiam Reddy., MBA., Ph.D., Assistant Professor, RITS 51
EQUITY VALUATION MODELS:
The main purpose of equity valuation is to estimate a value for a firm or security. A key
assumption of any fundamental value technique is that the value of the security (in this case an equity
or a stock) is driven by the fundamentals of the firm’s underlying business at the end of the day.
Valuation:
Valuation is the process of determining the fair market value of an asset or equity security. Equity
valuation use to estimate the intrinsic value of a Security.
The intrinsic value is the actual value of a company or an asset based on an underlying
perception of its true value including all aspects of the business, in terms of both tangible and
intangible factors. This value may or may not be the same as the current market value. The intrinsic
value is the fundamental value of the security or asset.
Estimate Value and Market Price:
Undervalued = intrinsic value > Market price
Fairly Valued = Intrinsic value = Market price
Over Valued = Intrinsic value < Market price
Techniques of fundamental Equity Valuation:
Balance sheet Techniques:
Book Value
Liquidation value
Replacement cost
Discounted Cash Flow
Techniques:
Dividend discount model
Free cash flow model
Relative Valuation Techniques:
Price – earnings ratio
Price – book value ratio
Price sales ratio

Prepared By: | M.Subramanyiam Reddy., MBA., Ph.D., Assistant Professor, RITS 52
Balance sheet Technique:
Analysts often look at the balance sheet of the firm to get a handle on some valuation measures.
There are measures derived from balance sheet are:
Book Value:
Book value is also the net asset value of a company, The book value per share is simply the net worth
of the company divided by the number of outstanding equity shares.
Book Value =
Liquidation Value:
The liquidation value appears more realistic than the book value, there are two serious
problems in applying it. First, it is very difficult to estimate what amounts would be realized from the
liquidation of various assets. Second, the liquidation value does not reflect earning capacity.
The liquidation value per share is equal to
Liquidation Value =
Replacement Cost:
Another balance sheet measure considered by analysts in valuing a firm is the replacement
cost of assets less liabilities. The sue of this measure is based on the premise theat the market value
of a firm cannot deviate too much form its replacement cost.
Replacement Cost = Assets – Liabilities.
Dividend Discount Model:
It is used to value stock based on the net present value of the future dividend. The value of an
equity share is equal to the present value of dividend expected from ownership plus the present value
of the sale price expected when the equity share is sold.
Assumptions:
Dividends are paid annually.
The first dividend is received one year after the equity share Is brought.
Single Period Valuation Model:
Let us begin with the case where the investor expects to hold the equity share for one year. The price
of the equity share will be:
Growth:
Where:

Prepared By: | M.Subramanyiam Reddy., MBA., Ph.D., Assistant Professor, RITS 53
Po = Current price of the equity.
D1= Expected Dividend
P1 = Market Price or expected equity price. R = rate of return
G = Growth rate.
Multi – Period Valuation Model:
It is easy to calculate the present value of the stock for a year. If the holding period is more
than a year, a separate formula is applied to find out the present value of the share.
Where:
G = annual expected growth in earnings, dividend and
price Eo = Most recent earnings per share
d/e = dividend payout
ratio R = required rate of
return P/E = price earnings
ratio N = holding period in
years
FREE CASH FLOW MODEL:
The free cash flow model broadly involves determining the value of the firm as a whole (this
value is called the enterprise value) by discounting the free cash flow to investors and then
subtracting the value of preference and debt to obtain the value of equity. It involves the following
procedure.
1. Divide the future into two parts, the explicit forecast period and the balance period.
The explicit forecast period (which is usually 5 to 15 years) represents the period during
which the firm is expected to evolve and finally reach a steady state – a state in which the return on
invested capital (or return on capital employed), growth rate and cost of capital stabilize.
2. forecast the free cash flow, year by year, during the explicit forecast period. The free cash
flow is the cash flow available for distribution to capital providers (shareholders and debtholders)
after providing for the investments in fixed assets and net working capital required to support the
growth of the firm.
The FCF is equal to : NOPAT – Net investment.
NOPAT is net operating profit adjusted for taxes. It is equal to profit before interest and tax (1 – tax
rate). Net investment is simply, change in net fixed assets + change in net working capital.
3. Calculate the weighted average cost of capital: the WACC is the blended post – tax cost of
equity, Preference and debt employed by the firm.
WACC = We re + Wp rp + Wd rd (1-t)
Where We, Wp and Wd are the weights associated with equity, preference and debt and re, rp and rd are

Prepared By: | M.Subramanyiam Reddy., MBA., Ph.D., Assistant Professor, RITS 54
the costs associated with equity, preference, and debt Note that the cost of debt, rd is adjusted for
taxes because the interest on debt is a tax –deductible payment.
4. Establish the horizon value of the firm: The horizon value (VH) is the value placed on the firm at the end of the explicit forecast period (H years). Since the FCF is expected to grow at a constant rate
of g beyond H, the horizon value is equal to
5. Estimate the enterprise value: The enterprise value (EV) or the firm value is the present value of
the FCF during the explicit forecast period plus the present value of the horizon value.
Present value of the FCF during the explicit present value of
horizon forecast period value
6. Derive the equity value the equity value is:
Enterprise value – Preference value – Debt value
7. Compute the value per share the value per share is simply the equity value divided by the
number of outstanding equity shares.
TECHNICAL ANALYSIS:
Technical analysis is the attempt to forecast stock prices on the basis of market-derived data.
Technicians (also known as quantitative analysts or chartists) usually look at price, volume and
psychological indicators over time. They are looking for trends and patterns in the data that indicate
future price movements.
The Potential Rewards:
This chart, from Norman Fosbeck, shows how market timing can benefit your returns. The
only problem is that you have to be very good at it.
Alternative Market Strategies (1964 to 1984)
Strategy Avg. Annual Gain $10,000 Grows To
Buy and Hold 11.46% $ 87,500
Avoid Bear Markets 21.48% $ 4,89,700
Long and Short Major Swings 27.99% $ 13,91,200
Long and Short Every 5% Swing 93.18% $ 5,24,00,00,000
This chart, from Barron’s, shows the benefit of being smart enough to miss the worst 5 days
of the year between Feb 1966 and Oct 2001.

Prepared By: | M.Subramanyiam Reddy., MBA., Ph.D., Assistant Professor, RITS 55
Charting the Market:
Chartists use bar charts, candlestick, or point and figure charts to look for patterns which may
indicate future price movements.
They also analyze volume and other psychological indicators (breadth, % of bulls vs % of
bears, put/call ratio, etc.).
Strict chartists don’t care about fundamentals at all.
Drawing Bar (OHLC) Charts:
Each bar is composed of 4 elements:
Open
High
Low
Close
Note that the candlestick body is empty (white) on up days, and filled (some color) on down
days
Note: You should print the example charts (next two slides) to see them more clearly
Open
High
Low
Close
Open
High
Low
Close
Standard Bar Chart
Types of Charts: Bar Charts
Japanese Candlestick
Standard Bar Chart
Japanese Candlestick
This is a bar (open, high, low, close or OHLC) chart of AMAT from early July to mid
October 2001.
Types of Charts: Japanese Candlesticks
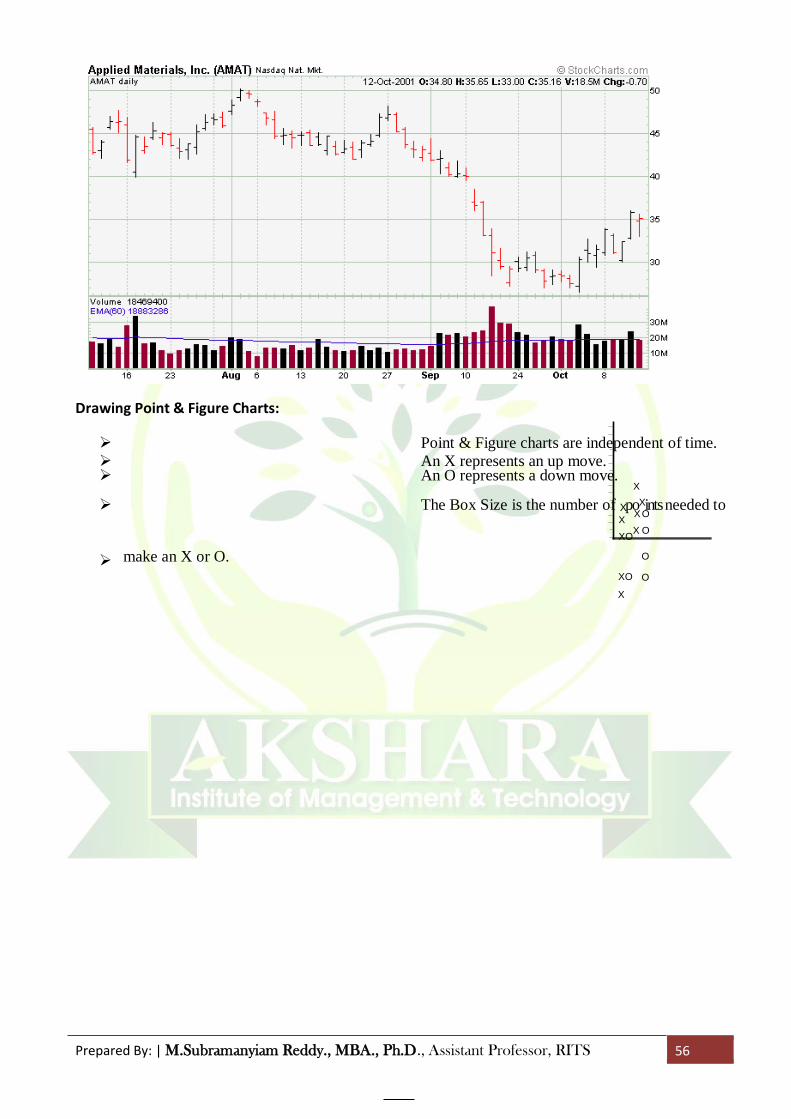
Prepared By: | M.Subramanyiam Reddy., MBA., Ph.D., Assistant Professor, RITS 56
Drawing Point & Figure Charts:
Point & Figure charts are independent of time.
An X represents an up move. An O represents a down move.
X
The Box Size is the number of XpoXints needed to X
X O
XOX O
make an X or O. O
XO O
X

Prepared By: | M.Subramanyiam Reddy., MBA., Ph.D., Assistant Professor, RITS 57
The Reversal is the price change needed to recognize a change in direction.
Typically, P&F charts use a 1-point box and a
3-point reversal.
Chart Types: Point & Figure Charts
This is a Point & Figure chart of AMAT from
early July to mid October 2001.
Basic Technical Tools:
The Basic Technical Tools are:
Trend Lines
Moving Averages
Price Patterns
Indicators
Cycles
Trend Lines:
There are three basic kinds of trends:
An Up trend where prices are generally increasing.
A Down trend where prices are generally decreasing.
A Trading Range.
Support & Resistance:
Support and resistance lines indicate likely ends of trends.
Resistance results from the inability to surpass prior highs.
Support results from the inability to break below to prior lows.
What was support becomes resistance, and vice-versa.

Prepared By: | M.Subramanyiam Reddy., MBA., Ph.D., Assistant Professor, RITS 58
Simple Moving
A moving average is simply the average price
(usually the closing price) over the last N periods.
They are used to smooth out fluctuations of
less than N periods.
This chart shows MSFT with a 10-day moving
average. Note how the moving average shows much less volatility than the daily stock price.
MSFT Daily Prices with 10-day MA
9/23/93 to 9/21/94
60
55
50
45
40
35
Price Patterns:
30
1 21 41 61 81 101 121 141 161 181 201 221 241
Date
Technicians look for many patterns in the historical time series of prices. These patterns are reputed to provide information regarding the size and timing of subsequent
price moves.
But don’t forget that the EMH says these patterns are illusions, and have no real meaning. In
fact, they can be seen in a randomly generated price series.
Pri
ce

Prepared By: | M.Subramanyiam Reddy., MBA., Ph.D., Assistant Professor, RITS 59
Neckline
Head & Shoulders Example: Left Shoulder
Right Shoulder
Head
Head and Shoulders:
This formation is characterized by two small peaks on either side of a larger peak.
This is a reversal pattern, meaning that it signifies a change in the trend.
H&S Top
Head
H&S Bottom
Double Tops and Bottoms:
These formationsDaorueblseimToiplar to the H&S formations,
but there is no head.
These are reversal patterns with the same
measuring
implications as the H&S. Target
Target
Left Shoulder Right Shoulder
Neckline

Prepared By: | M.Subramanyiam Reddy., MBA., Ph.D., Assistant Professor, RITS 60
Double Bottom Example:
Double Bottom
Ascending
Triangles:
Triangles are continuation formations.
Three flavors:
Ascending
Descending
Symmetrical
Typically, triangles should break out about half to three-quarters of the way through the
formation.
Rounded Tops & Bottoms:
Rounding formations are characterized by a slow reversal of trend.
Rounded Bottom Chart Example:
Rounding
Bottom
Rounding Top
Broadening Formations:
These formations are like reverse triangles.
These formations usually signal a reversal of the trend.
DJIA Oct 2000 to Oct 2001
Example:
Broadening Bottoms
Descending
Symmetrical
Symmetrical

Prepared By: | M.Subramanyiam Reddy., MBA., Ph.D., Assistant Professor, RITS 61
Broadening Tops

Prepared By: | M.Subramanyiam Reddy., MBA., Ph.D., Assistant Professor, RITS 62
Technical Indicators:
There are, literally, hundreds of technical indicators used to generate buy and sell signals.
We will look at just a few that I use:
Moving Average Convergence/Divergence (MACD)
Relative Strength Index (RSI)
On Balance Volume
Bollinger Bands
For information on other indicators see my Investments Class Links page under the heading
“Technical Analysis Links.” (http://clem.mscd.edu/~mayest/FIN3600/FIN3600_Links.htm)
MACD:
MACD was developed by Gerald Appel as a way to keep track of a moving average crossover
system.
Appel defined MACD as the difference between a 12-day and 26-day moving average. A 9-
day moving average of this difference is used to generate signals.
When this signal line goes from negative to positive, a buy signal is generated.
When the signal line goes from positive to negative, a sell signal is generated.
MACD is best used in choppy (trendless) markets, and is subject to whipsaws (in and out
rapidly with little or no profit).

Prepared By: | M.Subramanyiam Reddy., MBA., Ph.D., Assistant Professor, RITS 63
Relative Strength Index (RSI):
RSI was developed by Welles Wilder as an oscillator to gauge overbought/oversold levels.
RSI is a rescaled measure of the ratio of average price changes on up days to average price
changes on down days.
The most important thing to understand about RSI is that a level above 70 indicates a stock is
overbought, and a level below 30 indicates that it is oversold (it can range from 0 to 100).
Also, realize that stocks can remain overbought or oversold for long periods of time, so RSI
alone isn’t always a great timing tool.
A technical analysis tool that is banded between two extreme values and built with the
results from a trend indicator for discovering short term overbought and over sold conditions. As
the value of the oscillator approach the upper extreme value the asset is seem to be over brought
and as it is approaches to be lower extreme as it seems to be over sold.
RSI Example Chart:
On Balance Volume:
On Balance Volume was developed by Joseph Granville, one of the most famous technicians
of the 1960’s and 1970’s.
OBV is calculated by adding volume on up days, and subtracting volume on down days. A
running total is kept.
Granville believed that “volume leads price.”
To use OBV, you generally look for OBV to show a change in trend (a divergence from the
price trend).
If the stock is in an uptrend, but OBV turns down, that is a signal that the price trend may
soon reverse.
OBV Example Chart:

Prepared By: | M.Subramanyiam Reddy., MBA., Ph.D., Assistant Professor, RITS 64
Bollinger Bands:
Bollinger bands were created by John Bollinger (former FNN technical analyst, and regular
guest on CNBC).
Bollinger Bands are based on a moving average of the closing price.
They are two standard deviations above and below the moving average.
A buy signal is given when the stock price closes below the lower band, and a sell signal is
given when the stock price closes above the upper band.
When the bands contract, that is a signal that a big move is coming, but it is impossible to say
if it will be up or down.
In my experience, the buy signals are far more reliable than the sell signals.
Bollinger Bands Example Chart:
Dow Theory:
This theory was first stated by Charles Dow in a series of columns in the WSJ between 1900
and 1902.
Dow (and later Hamilton and Rhea) believed that market trends forecast trends in the
economy.
A change in the trend of the DJIA must be confirmed by a trend change in the DJTA in order
to generate a valid signal.
Dow Theory Trends:
Primary Trend
Called “the tide” by Dow, this is the trend that defines the long-term direction (up to
several years). Others have called this a “secular” bull or bear market.
Secondary Trend
Called “the waves” by Dow, this is shorter-term departures from the primary trend
(weeks to months)
Day to day fluctuations
Not significant in Dow Theory
Does Dow Theory Work?
According to Martin Pring, if you had invested $44 in 1897 and followed all buy and sell
signals, by 1981 you would have accumulated about $18,000.
If you had simply invested $44 and held that portfolio, by 1981 you would have accumulated
about $960.
Elliot Wave Principle:
R.N. Elliot formulated this idea in a series of articles in Financial World in 1939.

Prepared By: | M.Subramanyiam Reddy., MBA., Ph.D., Assistant Professor, RITS 65
B
A
3 C
4 1
2
Elliot believed that the market has a rhythmic regularity that can be used to predict future
prices.
The Elliot Wave Principle is based on a repeating 8-wave cycle, and each cycle is made up of
similar shorter-term cycles (“Big fleas have little fleas upon their backs to bite 'em - little
fleas have smaller fleas and so on ad infinitem”).
Elliot Wave adherents also make extensive use of the Fibonacci series.
5
Fibonacci Numbers:
Fibonacci numbers are a series where each succeeding number is the sum of the two
preceding numbers.
The first two Fibonacci numbers are defined to be 1, and then the series continues as follows:
1, 1, 2, 3, 5, 8, 13, 21…
As the numbers get larger, the ratio of adjacent numbers approaches the Golden Mean:
1.618:1.
This ratio is found extensively in nature, and has been used in architecture since the ancient
Greeks (who believed that a rectangle whose sides had the ratio of 1.618:1 was the most
aesthetically pleasing).
Technical analysts use this ratio and its inverse, 0.618, extensively to provide projections of
price moves.
Does Elliot Wave Work?
Who knows? One of the biggest problems with Elliot Wave is that no two practitioners seem
to agree on the wave count, and therefore on the prediction of what’s to come.
Robert Prechter (the most famous EW practitioner) made several astoundingly correct
predictions in the 1980’s, but hasn’t been so prescient since (he no longer gets much press
attention).
For example, in 1985 he predicted that the market would peak in 1987 (correct), but he
thought it would peak at 3686 (± 100 points).
The DJIA actually peaked on 25 August 1987 at 2722.42, more than 960 points lower.
Too Many Others To List:
As noted, there are literally hundreds of indicators and thousands of trading systems.
A whole semester could easily be spent on just a handful of these.
To close, just note that there is nothing so crazy that somebody doesn’t use it to trade.
For example, many people use astrology, geometry (Gann angles), neural networks, chaos
theory, etc.
There’s no doubt that each of these (and others) would have made you lots of money at one
time or another. The real question is can they do it consistently?
As the carneys used to say, “You pays your money, and you takes your chances.”

Prepared By: | M.Subramanyiam Reddy., MBA., Ph.D., Assistant Professor, RITS 66
UNIT – IV
EVALUATION OF PORTFOLIOS
The portfolio performance evaluation primarily refers to the determination of how a particular
investment portfolio has performed relative to some comparison benchmark. The evaluation can
indicate the extent to which the portfolio has outperformed or under-performed, or whether it has
performed at par with the benchmark.
The evaluation of portfolio performance is important for several reasons.
First, the investor, whose funds have been invested in the portfolio, needs to know the
relative performance of the portfolio. The performance review must generate and provide information
that will help the investor to assess any need for rebalancing of his investments.
Second, the management of the portfolio needs this information to evaluate the performance
of the manager of the portfolio and to determine the manager’s compensation, if that is tied to the
portfolio performance. The performance evaluation methods generally fall into two categories,
namely conventional and risk-adjusted methods.
Conventional Methods
Conventional methods can be classified as two types:
Benchmark Comparison
Style Comparison
Benchmark Comparison:
The most straightforward conventional method involves comparison of the performance of an
investment portfolio against a broader market index. The most widely used market index in the
United States is the S&P 500 index, which measures the price movements of 500 U.S. stocks
compiled by the Standard & Poor’s Corporation.
If the return on the portfolio exceeds that of the benchmark index, measured during identical
time periods, then the portfolio is said to have beaten the benchmark index. While this type of
comparison with a passive index is very common in the investment world, it creates a particular
problem. The level of risk of the investment portfolio may not be the same as that of the benchmark
index portfolio.
Higher risk should lead to commensurately higher returns in the long term. This means if the
investment portfolio has performed better than the benchmark portfolio, it may be due to the
investment portfolio being more risky than the benchmark portfolio. Therefore, a simple comparison
of the return on an investment portfolio with that of a benchmark portfolio may not produce valid
results.
Style Comparison
A second conventional method of performance evaluation called ”style-comparison”
involves comparison of return of a portfolio with that having a similar investment style. While there
are many investment styles, one commonly used approach classifies investment styles as value
versus growth.

Prepared By: | M.Subramanyiam Reddy., MBA., Ph.D., Assistant Professor, RITS 67
The “value style” portfolios invest in companies that are considered undervalued on the basis
of yardsticks such as price-to-earnings and price-to-topic value multiples. The “growth style”
portfolios invest in companies whose revenue and earnings are expected to grow faster than those of
the average company.
In order to evaluate the performance of a value-oriented portfolio, one would compare the
return on such a portfolio with that of a benchmark portfolio that has value-style. Similarly, a growth-
style portfolio is compared with a growth-style benchmark index. This method also suffers from the
fact that while the style of the two portfolios that are compared may look similar, the risks of the two
portfolios may be different. Also, the benchmarks chosen may not be truly comparable in terms of
the style since there can be many important ways in which two similar style-oriented funds vary.
Reilly and Norton (2003) provide an excellent disposition of the use of benchmark portfolios and
portfolios style and the issues associated with their selection. Sharpe (1992), and Christopherson
(1995) have developed methods for determining this style.
Risk-adjusted Methods
The risk-adjusted methods make adjustments to returns in order to take account of the
differences in risk levels between the managed portfolio and the benchmark portfolio. While there are
many such methods, the most notables are:
Sharpe Measure (S),
Treynor Measure (Tn),
Modigliani and Modigliani (M2).
These measures, along with their applications, are discussed below.
SHARPE MEASURE (SHARPE, 1966):
Sharpe’s performance index gives a single value to be used for the performance ranking of
various funds or portfolios. Sharpe’s Measures the risk premium of the investment portfolio per unit
of total risk of the portfolio. The risk premium, also known as excess return, is the return of the
portfolio less the risk-free rate of interest as measured by the yield of a Treasury security. The total
risk is the standard deviation of returns of the portfolio. The numerator captures the reward for
investing in a risky portfolio of assets in excess of the risk-free rate of interest while the denominator
is the variability of returns of the portfolio. In this sense, the Sharpe measure is also called the
“reward-to-variability” ratio. The index assigns the highest values to assets that have best risk –
adjusted average rate of return.
Where:
S = The Sharpe Measure,
Rp = Portfolio average return
Rf = The risk-free rate of interest,
= The standard deviation of returns of the portfolio.

Prepared By: | M.Subramanyiam Reddy., MBA., Ph.D., Assistant Professor, RITS 68
TREYNOR’S MEASURE:
The Treynor ratio (Treynor, 1965) computes the risk premium per unit of systematic risk. The
risk premium is defined as in the Sharpe measure. The difference in this method is in that it uses the
systematic risk of the portfolio as the risk parameter. The systematic risk is that part of the total risk
of an asset which cannot be eliminated through diversification. It is measured by the parameter
known as ‘beta’ that represents the slope of the regression of the returns of the managed portfolio on
the returns to the market portfolio. The Treynor’s Measure is given by the following equation:
Where:
Tn = Treynor’s Measure
Rp = The return of the portfolio,
Rf = The risk-free rate of Interest
= The beta Co – efficient of portfolio.
MODIGLIANI AND MODIGLIANI MEASURE (M2):
Modigliani risk-adjusted performance (also known as M2, M2, Modigliani–Modigliani
measure or RAP) is a measure of the risk-adjusted returns of some investment portfolio. It measures
the returns of the portfolio, adjusted for the risk of the portfolio relative to that of some benchmark
(e.g., the market). It is derived from the widely used Sharpe ratio, but it has the significant advantage
of being in units of percent return (as opposed to the Sharpe ratio – an abstract, dimensionless ratio of
limited utility to most investors), which makes it dramatically more intuitive to interpret.
In 1997, Nobel-prize winner Franco Modigliani and his granddaughter, Leah Modigliani,
developed what is now called the Modigliani risk-adjusted performance measure. They originally
called it "RAP" (risk-adjusted performance). They also defined a related statistic, "RAPA"
(presumably, an abbreviation of "risk-adjusted performance alpha"), which was defined as RAP
minus the risk-free rate (i.e., it only involved the risk-adjusted return above the risk-free rate). Thus,
RAPA was effectively the risk-adjusted excess return.
The Sharpe ratio is not easy to interpret. In the example, the Sharpe ratio for the managed
portfolio is 0.50, while that for the market is 0.45. We concluded that the managed portfolio
outperformed the market. The difficulty, however, is that the differential performance of 0.05 is not
an excess return. Modigliani and Modigliani (1997) measure, which is referred to as M2, provides a
risk-adjusted measure of performance that has an economically meaningful interpretation. The M2 is
given by:
Where:
M2 = The Modigliani-Modigliani Measure,
Rp= The return on the adjusted portfolio.
Rm = The return on the market portfolio.

Prepared By: | M.Subramanyiam Reddy., MBA., Ph.D., Assistant Professor, RITS 69
The adjusted portfolio is the managed portfolio adjusted in such a way that it has the same
total risk as the market portfolio. The adjusted portfolio is constructed as a combination of the
managed portfolio and risk-free asset.
Where weights are specified as in Equations are:
Where:
Wrp = Represents the weight given to the managed portfolio
= The standard deviation of the market portfolio.
= The standard deviation of the managed portfolio.
Wrf = The weight on the risk-free asset.
MORNINGSTAR’S RATINGS:
The Morningstar risk rating is a ranking given to publicly traded mutual funds and exchange-
traded funds (ETF)s by the investment research firm Morningstar. The ratings range from one to five
stars, with one being the poorest rank and five being the best. Morningstar's risk ratings, also called
star ratings, are designed to help investors quickly identify funds to consider for their portfolios.
Debuted in 1985, Morningstar risk ratings are based on the fund's past performance, the fund
manager's skill, risk- and cost-adjusted returns, and performance consistency. Morningstar assigns a
one-star rating to 10% of the funds it evaluates, a two-star rating to 22.5% of funds, a three-star rating
to 35% of funds, a four-star rating to 22.5% of funds. and a five-star rating to 10% of funds. The
Morningstar ratings are intended to be a starting point for further research and are not buy or sell
recommendations.
While Morningstar ratings are considered essential in guiding investors toward quality
investment decisions, they are not immune to criticism. Some financial analysts have criticized these
ratings because they only compare funds to other funds, in isolation from the greater marketplace. As
a result, a fund's rating may reflect its suitability for the particular market more than its overall
viability and potential.
For example, as prices are rising in a bull market, funds with historically safe stocks from
companies such as AT&T tend to perform well. Conversely, when prices are falling in a bear market,
funds featuring speculative stocks from companies such as Tesla Motors and Charles Schwab tend to
do better. As a result, some investors prefer ratings that keep the market conditions in mind, such as
the ratings generated by Forbes.
You’re probably familiar with Morningstar and their one- to five-star mutual fund ratings. Many
investors rely on Morningstar for stock and mutual fund research, and mutual fund
companies love using Morningstar ratings in their marketing materials. But is there any value in a
five-star Morningstar rating? (Disclosure: I use Morningstar software sold to investment advisors
almost every day.)

Prepared By: | M.Subramanyiam Reddy., MBA., Ph.D., Assistant Professor, RITS 70
The Morningstar ratings for one of the funds J.D. owns.
Fortunately for us, researchers recently looked into these ratings and published their results.
They compared Morningstar ratings to fund expense ratios as a predictor of future performance.
The expense ratio is the annual fee for investing in a fund. This fee is charged by the mutual
fund manager, and it’s one of my favourite metrics. If you assume that mutual fund managers have
no value — which I find to be a very good approximation — you would expect lower costs to predict
better performance. And the report found just that:
Expense ratios are strong predictors of performance. In every asset class over every time period, the
cheapest quintile produced higher total returns than the most expensive quintile.
What about Morningstar ratings? Five-star ratings predicted better performance than one-star
ratings in 13 of 20 observations — a success rate of just 65%. That sounds pretty good on its own,
but it’s still worse than a metric that anyone can look up in seconds.
Since Morningstar uses prior performance (after fees) to calculate its ratings, the ratings already
include information about expense ratios indirectly. So what is Morningstar adding with its fancy
algorithm? Let’s use a little high-school algebra to find out. (Geek Alert!)
Morningstar Rating = Expense Ratio + Morningstar’s Additional Analytics
And we just found out that:
Expense Ratio > Morningstar Rating
Finally, using my graduate degree in math, I get this:
Morningstar’s Additional Analytics < 0
Yes, Morningstar’s algorithm is horrible. And that’s not all.
Morningstar reserves its five- and one-star ratings for the top and bottom 10% of funds.
However, the researchers conducting this study divided expense ratios into quintiles — or, as normal
people would say, 20% buckets. The expense ratios were handicapped by using 20% buckets instead
of 10%, and still beat Morningstar ratings. Ouch!
Well, there’s one thing I forgot to tell you. People have performed this evaluation many times
with similar results, so it isn’t news to serious students of investing.
The interesting part of the report I quoted is the publisher: Morningstar. If you read its report,
it sounds like a politician answering a tough question — uncomfortable. Independent thinkers can go
directly to the results here.
STYLE ANALYSIS:
To investigate Sharpe's (1988, 1992) investment style model of managed portfolios in terms
of asset allocation (style), using the Solver function. Style analysis (or asset allocation) models are a

Prepared By: | M.Subramanyiam Reddy., MBA., Ph.D., Assistant Professor, RITS 71
valuable tool for investors, plan sponsors, and consultants. Investors want to know the investment
style so they can create an effective mix of assets that fits their tastes. Plan sponsors and consultants
are interested in how well the portfolio manager meets the investment objectives.
Sharpe (1992) defines the asset allocation of a mutual fund as the way in which the fund manager
allocates his assets across a number of major asset classes.
Consider the following equation:
Ri = bi1F1 + bi2F2 + ….+ bin Fn+ ei
Where:
Ri = the mutual fund return,
Fn = the value of the nth
factor, bin = the factor
sensitivities, and ei = the
unsystematic residual.
It could be helpful for investors to know how the style changes over time so that they can
rebalance or reallocate their portfolios of mutual funds.
MUTUAL FUND:
A Mutual Fund is a trust that pools together the savings of a number of investors who share a
common financial goal. The money thus collected is then invested in capital market instruments such
as shares, debentures and other securities.
History of the Indian Mutual Fund Industry
The mutual fund industry in India started in 1963 with the formation of Unit Trust of India, at
the initiative of the Government of India and Reserve Bank.
The history of mutual funds in India can be broadly divided into four distinct phases:
First Phase – 1964-87:
Unit Trust of India (UTI) was established on 1963 by an Act of Parliament. It was set up by
the Reserve Bank of India and functioned under the Regulatory and administrative control of the
Reserve Bank of India.
The first scheme launched by UTI was Unit Scheme 1964. At the end of 1988 UTI had
Rs.6,700 crores of assets under management.
Second Phase – 1987-1993 (Entry of Public Sector Funds):
1987 marked the entry of non- UTI, public sector mutual funds set up by public sector banks
and Life Insurance Corporation of India (LIC) and General Insurance Corporation of India (GIC).
SBI Mutual Fund was the first non- UTI Mutual Fund established in June 1987.
Third Phase – 1993-2003 (Entry of Private Sector Funds):
With the entry of private sector funds in 1993, a new era started in the Indian mutual fund
industry, giving the Indian investors a wider choice of fund families.
In 1993 was the year in which the first Mutual Fund Regulations came into being, under

Prepared By: | M.Subramanyiam Reddy., MBA., Ph.D., Assistant Professor, RITS 72
which all mutual funds, except UTI were to be registered and governed.
Fourth Phase – since February 2003:
In February 2003, following the repeal of the Unit Trust of India Act 1963 UTI was divided into two
separate entities.
One is the Specified Undertaking of the Unit Trust of India with assets under management of
Rs.29,835 crores as at the end of January 2003.
The second is the UTI Mutual Fund Ltd, sponsored by SBI, PNB, BOB and LIC. It is registered with
SEBI and functions under the Mutual Fund Regulations.
The flow chart below describes the working of a Mutual Fund:
TYPES OF MUTUAL FUNDs:
Maturity Period:
A mutual fund scheme can be classified into open-ended scheme or close-ended scheme

Prepared By: | M.Subramanyiam Reddy., MBA., Ph.D., Assistant Professor, RITS 73
depending on its maturity period.
Open-ended Fund: An open-ended Mutual fund is one that is available for subscription and
repurchase on a continuous basis. These Funds do not have a fixed maturity period.
Close-ended Fund: A close-ended Mutual fund has a stipulated maturity period e.g. 5-7 years. The
fund is open for subscription only during a specified period at the time of launch of the scheme.
Investment Objective:
A scheme can also be classified as growth fund, income fund, or balanced fund considering
its investment objective.
Growth / Equity Oriented Scheme: The aim of growth funds is to provide capital appreciation over
the medium to long- term. Such funds have comparatively high risks. These schemes provide
different options to the investors like dividend option, capital appreciation, etc.
Income / Debt Oriented Scheme: The aim of income funds is to provide regular and steady income
to investors. Such schemes generally invest in fixed income securities such as bonds, corporate
debentures, Government securities and money market instruments. Such funds are less risky
compared to equity schemes.
Balanced Fund: The aim of balanced funds is to provide both growth and regular income as such
schemes invest both in equities and fixed income securities in the proportion indicated in their offer
documents. These are appropriate for investors looking for moderate growth.
Money Market: These funds are also income funds and their aim is to provide easy liquidity,
preservation of capital and moderate income. These schemes invest exclusively in safer short-term
instruments such as treasury bills, commercial paper and government securities, etc. These funds are
appropriate for corporate and individual investors as a means to park their surplus funds for short
periods.
Gilt Funds: These funds invest exclusively in government securities. Government securities have no
default risk.
Index Funds: This schemes invest in the securities in the same weightage comprising of an index.
This schemes would rise or fall in accordance with the rise or fall in the index.
Advantages of Mutual Funds:
Professional Management
Minimization of risk
Return Potential
Low Costs Liquidity
Choice of schemes
Tax benefits
Various Mutual Funds in India
State Bank of India mutual fund
ICICI prudential mutual fund
TATA mutual fund
HDFC mutual fund
Birla sun life mutual fund
Reliance mutual fund
Kotak Mahindra mutual fund etc..
FUND OF FUNDS: A fund of funds (FOF) - also referred to as a multi-manager investment - is an investment

Prepared By: | M.Subramanyiam Reddy., MBA., Ph.D., Assistant Professor, RITS 74
strategy in which a Fund invests in other types of funds. This strategy invests in a portfolio that
contains different underlying assets instead of investing directly in bonds, stocks and other types of
securities.
A "fund of funds" (FOF) is an investment strategy of holding a portfolio of other investment
funds rather than investing directly in stocks, bonds or other securities. This type of investing is often
referred to as multi-manager investment. A fund of funds may be "fettered", meaning that it invests
only in funds managed by the same investment company, or "unfettered", meaning that it can invest
in external funds run by other managers.
The fund of funds (FOF) strategy aims to achieve broad diversification and appropriate asset
allocation with investments in a variety of fund categories that are all wrapped into one fund. These
are fund of funds characteristics that attract small investors who want to get better exposure with
fewer risks compared to directly investing in securities. However, if the fund of funds carries
an operating expense, investors are essentially paying double for an expense that is already included
in the expense figures of the underlying funds. Historically, a fund of funds showed an expense
figure that didn't always include the fees of the underlying funds. As of January 2007, the SEC began
requiring that these fees be disclosed in a line called "Acquired Fund Fees and Expenses" (AFFE).
They would keep a close eye on where you are invested, sell funds that were failing and buy
new ones that are about to soar.
It sounds ideal — and it is possible. Increasing numbers of investors are turning to a ‘fund of funds’,
a type of investment where one fund manager picks a whole range of funds for you based on how
much risk you are willing to take.
Typically, the money is invested in between 10 and 30 other investment funds — these in turn
invest in 20 to 30 other companies. These types of funds help you take less risk because your cash is
spread across a greater number of funds and companies.
So if one fund’s performance starts to fall off a cliff, you should, in theory at least, be able to
rely on some of the others to prop it up.
Of course, the fund manager isn’t actually working just for you — but you and a host of other
like-minded investors.
‘For many investors, a fund of funds take away the headache of deciding on which funds to
buy and which to sell,’ says investor, head of investment at wealth manager. ‘Instead you hand those
decisions over to a full-time fund manager.’
Fund of Funds Advantages

Prepared By: | M.Subramanyiam Reddy., MBA., Ph.D., Assistant Professor, RITS 75
Investing in a FOF gives the investor professional financial management services.
This experience allows the investor to test investing in professionally managed funds before
they take on the challenge of going for individual fund investing.
Most FOFs require a formal due-diligence procedure for their fund managers. Applying
managers' backgrounds are checked, which ensures the portfolio handler's background and
credentials in the securities industry.
Investing in an FOF also allows investors with limited capital to tap into diversified portfolios
with different underlying assets, which are hard to access through individual investment.
EXCHANGE TRADED FUND (ETF):
ETF stands for exchange-traded fund. To keep things simple, you can think of it like mutual
fund that can be traded like stock. It is made up of a basket of securities and experiences changes in
price throughout the day as it is bought and sold.
In general, an ETF will trade at the same level or very close to the net asset value of an
underlying asset. But because you can trade it like stock, its own net asset value is not calculated
every day, opposite of how it applies to mutual fund.
ETFs in India:
An exchange-traded fund that is based on a basket of securities listed on various exchanges in
India. India ETFs aim to capture the major sectors of the Indian economy by owning a diversified
mix of major companies that represent the majority of the total market capitalization of the Indian
economy.
Types of ETFs:
Index ETFs
Commodity ETFs or ETCs
Bonds ETFs
Currency ETFs
Actively managed ETFs
Exchange Trade Grantor Trusts
Leveraged ETFs
Features of ETFs:
Buying and Selling ETFs can be good for the small investor
Treatment of Dividends
Transparency
Tax Efficiency
Fees and Commissions
Options
ETF offers the advantages of both mutual fund and stock, which can be understood from the
following figure:
Mutual Funds Stock
Simplicity
Transparency
Risk Control
Diversification
No tenure or size
limitation (open ended
fund)
+
On exchange intraday trading
Trading flexibility
Trading Strategies (Hedging,
diversified exposure to
market, buying and holding,
investing)
=
ETF

Prepared By: | M.Subramanyiam Reddy., MBA., Ph.D., Assistant Professor, RITS 76
How ETFs Differ with Mutual Fund:
Forecast ETFs Mutual Funds
Trading Time Trade during trading day Trade at closing NAV
Cost Low operating expenses Operating expenses vary
investment amount No investment minimums Most have investment minimums
Tax efficiency Tax-efficient Less tax-efficient
Sales Load No sales loads May have sales Load
Advantages of ETFs:
Buy and sell just like a share
Buy and sell at real time prices
Like an index fund, they are very transparent
Cost Advantage : The only costs for an investor are brokerage commissions, management
fees and taxes
Minimum trading lot just one unit
Provides Diversification
Returns on par with Market/Index
No STT on some ETFs(Gold, Oil)
Arbitrage in Future and Cash Market
Disadvantages of ETFs:
Investors need to have a de-mat and a trading account
They have to pay a brokerage (usually around 0.50%). This is considered high for a new short
term Investor
Advantages in Local ETF disappear in Foreign ETFs
Have to place a fresh order every month
ETFs are conveniently tradable, people tend to trade more in ETFs as compared to
conventional funds which pushes up the costs.
You can't automatically re-invest your dividends.
Inverse Funds:
An inverse exchange-traded fund is an exchange-traded fund (ETF), traded on a public stock
market, which is designed to perform as the inverse of whatever index or benchmark it is designed to
track. These funds work by using short selling, trading derivatives such as futures contracts, and
other leveraged investment techniques.
An inverse ETF is an exchange-traded fund (ETF) constructed by using various derivatives
for the purpose of profiting from a decline in the value of an underlying benchmark. Investing in
inversion ETFs is similar to holding various short positions, or using a combination of advanced
investment strategies to profit from falling prices. Also known as a "Short ETF," or "Bear ETF."
Inverse ETFs vs. Short Selling
One advantage of inverse ETFs is that they do not require the investor to hold a margin
account as would be the case for investors looking to enter into short positions. There are several
inverse ETFs that can be used to profit from declines in broad market indexes, such as the Russell
2000 or the Nasdaq 100. In addition, it is possible to buy inverse ETFs that focus on a specific sector,
such as financials, energy or consumer staples. Most investors look to purchase inverse ETFs so they
can hedge their portfolios against falling prices.
In addition to a margin account, short selling requires a stock loan fee paid to a broker for
borrowing the shares necessary to sell short. Stocks with high short interest may result in difficulty

Prepared By: | M.Subramanyiam Reddy., MBA., Ph.D., Assistant Professor, RITS 77
finding shares to short, which drives up the cost of short selling. in many cases, the cost of borrowing
shares to short could be 3% or more of the amount that is borrowed. Inverse ETFs often have expense
ratios of less than 2%, and can be purchased by anyone with a brokerage account.
Double and Triple Inverse Funds
While there are many ETFs available that are designed to profit from the decline in a sector or
market, several add leverage to their objectives. Fund providers such as Direxion and ProShares are
popular for their leveraged ETFs. These funds, such as the Direxion Daily S&P 500 Bear 3x Shares
ETF, use derivatives to provide double and triple the daily return of a given index.
Like others derivatives-based ETFs, these funds are used primarily by speculators and
momentum players that frequently hold on to these positions for no more than a few days.
Investment in foreign countries:
Foreign investment involves capital flows from one country to another, granting extensive
ownership stakes in domestic companies and assets. Foreign investment denotes that foreigners have
an active role in management as a part of their investment.
Types of Foreign Investment:
Meaning of FDI:
1. FDI stands for Foreign Direct Investment, a component of a country's national financial
accounts.
2. Foreign direct investment is investment of foreign assets into domestic structures, equipment,
and organizations.
3. It does not include foreign investment into the stock markets.
4. FDI is thought to be more useful to a country than investments in the equity of its companies
because equity investments are potentially "hot money" which can leave at the first sign of
trouble, whereas FDI is durable and generally useful whether things go well or badly.
5. FDI‘ Means Investment By Non-resident Entity/Person Resident Outside India In The Capital
Of An Indian Company Under Schedule 1 Of Foreign Exchange Management (Transfer Or
Issue Of Security By A Person Resident Outside India)
Meaning of FII: (Foreign Institutional Investment)

Prepared By: | M.Subramanyiam Reddy., MBA., Ph.D., Assistant Professor, RITS 78
FII denotes all those investors or investment companies that are not located within the
territory of the country in which they are investing.
“SEBI’s definition of FIIs presently includes foreign pension funds, mutual funds,
charitable/endowment/university funds etc. as well as asset management companies and other
money managers operating on their behalf.”
Foreign Institutional Investor‘(FII) means an entity established or incorporated outside India
which proposes to make investment in India and which is registered as a FII in accordance
with the SEBI (FII) Regulations 1995.
Significances of Foreign Investment:
Expansion In Employment
Consumer Benefit
Technological Improvement
Cultural Improvement
Import Export
Growth In Economy
Government Benefits
Competition
Managerial Revolution
Global Exposer
Global Relationship
What are Foreign Investors looking for?
Good projects
Demand Potential
Revenue Potential
Stable Policy Environment/ Political Commitment
Optimal Risk Allocation Framework
Impact of Global Diversification:
Global diversification is a type of geographical diversification that consists of adding foreign
asset classes, such as stocks and bonds, to a domestic portfolio. The goal of global diversification
can be to increase the expected return, decrease the risk, or both, although whether such goals will
be achieved cannot be known in advance.
Impact of currency exposure:
Global diversification brings foreign currency exposure into the mix. Canadians generally are
well aware of the range of fluctuation of the Canadian dollar versus the US dollar, particularly in the
short term. Over the longer term, currency fluctuations tend to average themselves out and therefore
reduce the impact of currency exposure.
Global diversification in equities:
Each investor has to evaluate the pros and cons of global diversification for equities, taking
into account his/her personal situation, but the arguments in favour of at least some global
diversification for equities seem convincing. Nevertheless, Financial Wisdom Forum members have
indicated allocations to Canada ranging from 0% to 100% within the equity part of their portfolios,
showing that different approaches can work for different people.
Diversification as expected to reduces the risk and also the covariance between the asset and

Prepared By: | M.Subramanyiam Reddy., MBA., Ph.D., Assistant Professor, RITS 79
the market portfolio of all assets in the economy.
Arguments for global diversification:
The Canadian stock market is highly concentrated in three sectors (energy, materials,
financials) which are quite cyclical, and has significant under-representations in information
technology, health care, consumer staples and consumer discretionary, relative to the rest of
the world. See diversification.
Issuer concentration. The Canadian market has 36% of its capitalisation in the top-ten stocks,
compared to 17% for the US market.
Global equity diversification can reduce the volatility of returns because the correlations
coefficients between Canada and global stocks are less than one (rolling 36-month correlation
coefficients have varied between 0.37 and 0.87 over the period 1972-2014).
Arguments against global diversification:
The dividend tax credit applies to Canadian stocks but not foreign ones (relevant for
unregistered accounts only)
Apart from the US and parts of Europe, there may be corporate governance issues for
overseas companies
(Historically) high costs to access foreign securities
Multinational companies provide international diversification (this is truer for US and
European investors)
Implementation:
Global equities are typically divided into US equities, international equities and emerging
markets; these articles suggest ways to access these asset classes using exchange-traded
funds (ETFs), index funds, and perhaps individual stocks. One-ETF-solutions for global equities (i.e.,
equity funds covering the whole world except Canada) are mentioned in Simple index portfolios:
three ETFs.
For a "balanced" portfolio, an easy approach is to split the equities into three thirds: Canadian
equities, US equities and international equities; this is what the model portfolios at Canadian Couch
Potato do. Investors preferring a stronger home bias may instead divide the equities into half
Canadian and half global, for example: this is what the FPX indices do.
Global diversification in fixed income:
For fixed income investments, it appears that avoiding global diversification (i.e., keeping it
all domestic) is largely justified for most Canadian investors: the "cons" largely outweigh the "pros".
One exception may be for large bond-heavy portfolios, as explained in foreign bonds.
Arguments for global diversification:
Adding some foreign bonds to a bond-heavy portfolio would theoretically lower its volatility.
Lowers the "country risk" related to investing most of one’s assets in a single country, even a
developed and stable one like Canada.
Arguments against global diversification:
Keeping all fixed income domestic is more simple, and avoids higher management expense
ratios (MERs)
Better investor knowledge of domestic markets
Foreign bonds imply exposure to foreign currencies, which would add greatly to the volatility
of fixed income investments; hedging the currency exposure is possible, but adds to costs
The domestic (Canadian) fixed income market is well diversified by issuer type (federal

Prepared By: | M.Subramanyiam Reddy., MBA., Ph.D., Assistant Professor, RITS 80
government and agencies, provinces, municipalities, corporate), term (short, medium, long),
and credit rating (see Canadian vs. global bonds), so there is no need to venture elsewhere
The domestic market has historically provided returns and volatilities comparable to
developed markets as a whole
Advantages of Diversification:
Increase the scope of diversification
Higher returns compare to domestic market
Larger investment owners
Favorable economic trends and business cycle
Disadvantages of Diversification:
Political risk
Liquidity risk in the market
Currency effects
Factors affecting the Indian investor:
Framework of investment in India
Inflation
Taxation
Stock market Conditions
Manipulation of share price
DEPOSITORY RECEIPTS
DR’s are traded on stock exchanges in the US, Singapore, Luxembourg, London etc.
Depository Receipts listed and traded in US Markets are known as American Depository Receipts
(ADRs) and those listed and traded elsewhere are known as Global Depository Receipts (GDRs) and
Indian Depository Receipts in Indian context, DRs are treated as FD.
Depository receipts are instruments issued by international depositories (ODB), and they
represent an interest in the underlying shares held by them in the issuer company (Indian Company).
The shares are usually held by a domestic custodian on behalf of the depositories in turn issue the
depository receipts, which entitle the holder of the receipts to get the underlying shares on demand.
Global Depository Receipts (GDRs)

Prepared By: | M.Subramanyiam Reddy., MBA., Ph.D., Assistant Professor, RITS 81
A bank certificate issued in more than one country for shares in a foreign company. The
shares are held by a foreign branch of an international bank. The shares trade as domestic shares, but
are offered for sale globally through the various bank branches.
A financial instrument used by private markets to raise capital denominated in either U.S.
dollars or Euros.
The voting rights of the shares are exercised by the Depository as per the understanding
between the issuing company and the GDR holders.
Types of GDR
Rule 144A GDRs
Rule 144A GDRs are privately placed depositary receipts which are issued and traded in
accordance with Rule 144A. This rule was introduced by the SEC in April 1990 in part to
stimulate capital raising in the US by non-US issuers.
Non-US companies now have ready access to the US equity private placement market and
may thus raise capital through the issue of Rule 144A GDRs without complying with the
stringent SEC registration and reporting requirements.
Regulation S
With the global integration of the major securities markets, it is now commonplace to have
fungible securities listed and cleared in more than one market.
Just as ADRs allow non-US issuers to access the important US market, GDRs allow issuers to
tap the European markets.
AMERICAN DEPOSITORY RECEIPTS
ADR is a dollar-denominated negotiable certificate. It represents a non-US company’s
publicly traded equity. It was devised in the late 1920s to help Americans invest in overseas
securities and to assist non-US companies wishing to have their stock traded in the American
Markets.
ADR were introduced as a result of the complexities involved in buying shares in foreign
countries and the difficulties associated with trading at different prices and currency values.
Types of ADR: SPONSORED ADR UNSPONSORED ADR
Issued with cooperation of the company whose stock will underlie the ADR.
Issued by – broker/dealer or depository bank
without the involvement of company whose stock underlies the ADR
Comply with regulatory reporting. No regulatory reporting
Listing on international Stock Exchanges allowed. Trade on OTC market
Levels of ADRs:
Level 1 ADRs:
Level 1 ADRs are the lowest level of sponsored ADRs and also the simplest method for
companies to access the US capital markets.
Level 1 ADRs are traded in the over-the –counter (OTC) market.
The issuing company does not have to comply with US generally accepted accounting
principles (GAAP) or provide US Securities and Exchange Commission (SEC) disclosure.

Prepared By: | M.Subramanyiam Reddy., MBA., Ph.D., Assistant Professor, RITS 82
Level 1 ADRs essentially enable a company to obtain the benefits of a US publicly traded
security without altering their current reporting process.
Companies that have level 1 ADRs may upgrade to level II or level III ADR program.
They require minimal SEC registration.
Level II ADRs:
Level II ADRs enable companies to list their ADRs on Nasdaq, the American Stock
Exchange, the New York Stock Exchange and the OTC bulletin board, thereby offering
higher visibility in the US market, more active trading and greater liquidity.
Level II ADRs require full registration with the Securities and Exchange Commission.
Companies must also meet the requirements of the appropriate stock exchange.
Level II ADRs require a form 20-F and form F-6 to be filled with the SEC, as well as meeting
the listing requirements and filing a listing application with the designated stock exchange.
Upon F-6 effectiveness and approval of the listing application, the ADRs begin trading.
Level III ADRs:
Level III ADRs enable companies to list their ADRs on NASDAQ, the Amex, the NYSE or
the OTC Bulletin Board and make a simultaneous public offering of ADRs in the united
states.
The benefits of level III ADRs are substantial; it allows the issuer to raise capital and leads to
much greater visibility in the U.S market.
Level III ADR programs must comply with various SEC rules, including the full registration
and reporting requirements of the SEC's Exchange Act.
Difference between ADR & GDR
ADR GDR
American depository receipt (ADR) is Global depository receipt (GDR) is
compulsory for non –us companies to trade
in stock market of USA.
compulsory for foreign company to access in
any other country’s share market for dealing
in stock.
ADRs can get from level 1 to level III. GDRs are already equal to high preference
receipt of level II and level III.
ADRs up to level –I need to accept only
general condition of SEC of USA.
GDRs can only be issued under rule 144 A
after accepting strict rules of SEC of USA .
ADR is only negotiable in USA . GDR is negotiable instrument all over the
world
Investors of USA can buy ADRs from New
York stock exchange (NYSE) or NASDAQ. Investors of UK can buy GDRs from London
stock exchange and luxemberg stock
exchange and invest in Indian companies
without any extra responsibilities.

Prepared By: | M.Subramanyiam Reddy., MBA., Ph.D., Assistant Professor, RITS 83
Process to Issue ADR/GDR:
Advantages of ADR/GDR:
Can be listed on any of the overseas stock exchanges /OTC/Book entry transfer system.
Freely transferable by non-resident.
They can be redeemed by ODB.
The ODB should request DCB to get the corresponding underlying shares released in favor of
non resident of investors. (Shareholders of issuing companies).
INDIAN DEPOSITORY RECEIPTS
These are financial instrument that allows foreign companies to mobilize funds from Indian
capital market.
IDRs are the depository receipts dominated by Indian issued by the domestic ₹ depository
receipt.
Represents interest in the share of non-Indian company’s equity.
Like equity shares, these are unsecured instruments & negotiable from one to another
investors.
It provides chance to Indian investors to hold equity shares of foreign company’s.
Who can Invest?
Any person who is resident in India as defined under FEMA.
NRIs.
SEBI registered foreign institutional investor including their sub accounts.
Eligibility Criteria:
As per the companies IDR rules
Criteria Requirements
Capital Pre issue paid up capital and free reserve are at least US$50 Million
Market Capitalization Minimum average market capitalization (during the last 3 years) in
its parent country of at least US$ 100 million
Operation History Continuous trading record or history on a stock exchange in its
parent country at least 3 immediately preceding years.
Track Record of
distributable profits Track record of distributable profits in terms of section 205 of the
companies act. 1956 for at least 3 out of immediately preceding 5
years.
Other Requirements Fulfil such other eligibility criteria as may be laid down by SEBI
from time to time in this behalf.
Issuing Company
(RIL)
Domestic Custodian
Bank (SBI)
Foreign Depository
(Morgan Stanley)
GDR / ADR Holders
(Bank of America)
Clearing Agency
(Euro Clear)
Foreign Stock
Exchange (NYSE)

Prepared By: | M.Subramanyiam Reddy., MBA., Ph.D., Assistant Professor, RITS 84
Introduction: UNIT - V MARKET EFFICIENCY
An efficient capital market is a market that is efficient in processing information. In other
words, the market quickly and correctly adjusts to new information. In an information of efficient
market, the prices of securities observed at any time are based on “correct” evaluation of all
information available at that time. Therefore, in an efficient market, prices immediately and fully
reflect available information.
Efficient market: Market in which prices correctly reflect all relevant information.
Definition:
"In an efficient market, competition among the many intelligent participants leads to a
situation where, at any point in time, actual prices of individual securities already reflect the effects
of information based both on events that have already occurred and on events which, as of now, the
market expects to take place in the future. In other words, in an efficient market at any point in time
the actual price of a security will be a good estimate of its intrinsic value."
- Professor Eugene Fama,
States that all relevant information is fully and immediately reflected in a security's market
price, thereby assuming that an investor will obtain an equilibrium rate of return. In other words, an
investor should not expect to earn an abnormal return (above the market return) through
either technical analysis or fundamental analysis. Three forms of efficient market hypothesis
exist: weak form (stock prices reflect all past information in prices), semi - strong form (stock prices
reflect all past and current publicly available information), and strong form (stock prices reflect all
relevant information, including information not yet disclosed to the general public, such
as insider information).
Efficient Market Hypothesis
A market theory that evolved from a 1960's Ph.D. dissertation by Eugene Fama, the efficient
market hypothesis states that at any given time and in a liquid market, security prices fully reflect all
available information. The EMH exists in various degrees: weak, semi-strong and strong, which
addresses the inclusion of non-public information in market prices. This theory contends that since
markets are efficient and current prices reflect all information, attempts to outperform the market are
essentially a game of chance rather than one of skill.
The weak form of EMH assumes that current stock prices fully reflect all currently available security
market information. It contends that past price and volume data have no relationship with the future
direction of security prices. It concludes that excess returns cannot be achieved using technical
analysis.
The semi-strong form of EMH assumes that current stock prices adjust rapidly to the release of all
new public information. It contends that security prices have factored in available market and non-
market public information. It concludes that excess returns cannot be achieved using fundamental
analysis.
The strong form of EMH assumes that current stock prices fully reflect all public and private
information. It contends that market, non-market and inside information is all factored into security
prices and that no one has monopolistic access to relevant information. It assumes a perfect market
and concludes that excess returns are impossible to achieve consistently.
Why Efficient Market Hypothesis?

Prepared By: | M.Subramanyiam Reddy., MBA., Ph.D., Assistant Professor, RITS 85
To test the form of market – extent of efficiency.
To make sure that one can accurately forecast the market, discover the market trend and help
investors to make critical decisions .
What is Efficient Market:
A market where there are large numbers of rational profit maximizers actively competing,
with each trying to predict future market values of individual securities, and where important
current information is almost freely available to all participants.
Securities prices always fully reflect all available, relevant information about the security.
Note the key words of the definition “always” “Fully” and “information”.
WHAT IS AN EFFICIENT MARKET
• An Efficient Market is one in which the Market Price of a Security is an Unbiased Estimate
of its Intrinsic Value.
• Market Efficiency is Defined in Relation to Information that is Reflected In Security Prices.
Eugene Fama “the father of the efficient-market hypothesis”. Distinguishes Three Levels Of Market
Efficiency.
INTRINISIC VALUE:
• Weak-form efficiency
• Semi-strong form efficiency
• Strong-form efficiency
The actual value of a company or an asset based on an underlying perception of its true value
including all aspects of the business, in terms of both tangible and intangible factors. This value may
or may not be the same as the current market value. Value investors use a variety of analytical
techniques in order to estimate the intrinsic value of securities in hopes of finding investments where
the true value of the investment exceeds its current market value.
Strong Form
Sem – Strong
All Information, Public and Private
All Public Information
All Historical Price and Returns

AKSHARA INSTITUTE OF MANAGEMENT & TECHNOLOGY.
(Approved by AICTE, New Delhi. & Affiliated to Sri Venkateswara University, Tirupati.)
Prepared by: M. Subramanyiam Reddy., MBA., (PhD)., | I – CET CODE: AMTT 86
Weak Form
EMH.. Implies… Market Has Perfect Forecasting.
As Prices Tend to Fluctuate They Cannot Reflect Fair Value.
Inability of Institutional Portfolio Managers to Achieve Superior
Investment Performance Implies that they Lack Competence.
The Random Movement of Stock Prices Suggests That The Stock Market Is
Irrational.
Efficient Market Index:
In finance, the efficient-market hypothesis (EMH) assets that financial markets are
"informationally efficient". That is, one cannot consistently achieve returns in excess
of average market returns on a risk-adjusted basis, given the information available at
the time the investment is made.
There are three major versions of the hypothesis: "weak", "semi-strong", and
"strong". Weak EMH claims that prices on traded assets (e.g:- stocks, bonds, or
property) already reflect all past publicly available information.
Semi-strong EMH claims both that prices reflect all publicly available information
and that prices instantly change to reflect new public information.
Strong EMH additionally claims that prices instantly reflect even hidden or "insider"
information. There is evidence for and against the weak and semi-strong EMHs,
while there is powerful evidence against strong EMH.
Weak - Form Efficiency:
In weak-form efficiency, future prices cannot be predicted by analyzing
prices from the past. Excess returns cannot be earned in the long run by using
investment strategies based on historical share prices or other historical data.
Technical analysis techniques will not be able to consistently produce excess
returns, though some forms of fundamental analysis may still provide excess
returns.
Share prices exhibit no serial dependencies, meaning that there are no
"patterns" to asset prices.
This implies that future price movements are determined entirely by
information not contained in the price series. Hence, prices must
follow a random walk.
This 'soft' EMH does not require that prices remain at or near
equilibrium, but only that market participants not be able to
systematically profit from market 'inefficiencies'..
However, while EMH predicts that all price movement (in the absence of
change in fundamental information) is random (i.e., non-trending), many

AKSHARA INSTITUTE OF MANAGEMENT & TECHNOLOGY.
(Approved by AICTE, New Delhi. & Affiliated to Sri Venkateswara University, Tirupati.)
Prepared by: M. Subramanyiam Reddy., MBA., (PhD)., | I – CET CODE: AMTT 87
studies have shown a marked tendency for the stock markets to trend over
time periods of weeks or longer and that, moreover,
there is a positive correlation between degree of trending and length of time
period studied (but note that over long time periods).
Semi -Strong-Form Efficiency :
• In semi-strong-form efficiency, it is implied that share prices adjust to
publicly available new information very rapidly and in an unbiased fashion,
such that no excess returns can be earned by trading on that information.
• Semi-strong-form efficiency implies that neither fundamental analysis nor
technical analysis techniques will be able to reliably produce excess returns.
• To test for semi-strong-form efficiency, the adjustments to previously unknown
news must be of a reasonable size and must be instantaneous.
• To test for this, consistent upward or downward adjustments after the initial
change must be looked for. If there are any such adjustments it would suggest
that investors had interpreted the information in a biased fashion and hence in
an inefficient manner.
Strong - Form Efficiency:
• In strong-form efficiency, share prices reflect all information, public and
private, and no one can earn excess returns.
• If there are legal barriers to private information becoming public, as with
insider trading laws, strong-form efficiency is impossible, except in the case
where the laws are universally ignored.
• To test for strong-form efficiency, a market needs to exist where investors
cannot consistently earn excess returns over a long period of time. .
IMPLICATIONS FOR INVESTMENTS
Substantial evidence in favour of randomness suggests that technical analysis is of
dubious value. Routine and conventional fundamental analysis is not of much help in
identifying profitable courses of action. The key levers for earning superior rates of
returns are:
Early action on any new development.
Sensitivity to market imperfections and anomalies.
Use of original, unconventional, and innovative modes of analysis.
Access to inside information and its sensible interpretation
An independent judgment that is not affected by
market psychology. SUMMING UP

AKSHARA INSTITUTE OF MANAGEMENT & TECHNOLOGY.
(Approved by AICTE, New Delhi. & Affiliated to Sri Venkateswara University, Tirupati.)
Prepared by: M. Subramanyiam Reddy., MBA., (PhD)., | I – CET CODE: AMTT 88
Stock prices appear to follow a random walk. The randomness of stock prices is
the result of an efficient market.
It is useful to distinguish three levels of market efficiency :
Weak form efficiency, semi-strong form efficiency, and strong form
efficiency. The weak form efficient market hypothesis says that the current
price of a stock reflects all information found in the record of past prices and
volumes.
The semi-strong form efficient market hypothesis holds that stock prices
adjust rapidly to all available public information.
The strong form efficient market hypothesis holds that all available
information, public and private is reflected in stock prices.
Empirical evidence seems to provide strong support for weak-form efficiency,
mixed support for semi-strong form efficiency, and weak support for strong-
form efficiency.
The efficient market hypothesis is an imperfect and limited description of
the stock market. however, at least for the present, there does not seem to be
a better alternative.
The key implications of the efficient market hypothesis are that
technical analysis is of dubious value and routine fundamental analysis
is not of much help.
RANDOM WALK
Maurice Kendall found that stock prices followed a random walk, implying
that successive price changes are independent of one another. A number of researchers
have employed ingenious methods to test the randomness of stock price behaviour.
Academic researchers concluded that the randomness of stock prices was the result of
an efficient market. The theory that stock price changes have the same distribution and
are independent of each other, so the past movement or trend of a stock price or
market cannot be used to predict its future movement.