appropriating the returns from industrial research … the returns from industrial research ......
TRANSCRIPT
RICHARD C. LEVIN Yale University
ALVIN K. KLEVORICK Yale University
RICHARD R. NELSON Columbia University
SIDNEY G. WINTER Yale University
Appropriating the Returns
from Industrial Research
and Development
To HAVE the incentive to undertake research and development, a firm must be able to appropriate returns sufficient to make the investment worthwhile. The benefits consumers derive from an innovation, how- ever, are increased if competitors can imitate and improve on the innovation to ensure its availability on favorable terms. Patent law seeks to resolve this tension between incentives for innovation and widespread diffusion of benefits. A patent confers, in theory, perfect appropriability (monopoly of the invention) for a limited time in return for a public
We are grateful for the support of the National Science Foundation and especially to Rolf Piekarz of the NSF's Division of Policy Research and Analysis.
We also wish to thank the 650 respondents to our survey and the R&D executives who helped us pretest it-especially Ralph Gomory, Bruce Hannay, and Lowell Steele. Donald DeLuca, Wendy Horowitz, and other members of the Roper Center for Survey Research helped manage the survey. Robert W. Wilson, and Margaret Blair, Marc Chupka, Emily Lawrance, Constance Helfat, Andrew Joskow, Kathleen Rodenrys, Somi Seong, Andrea Shepard, and Hal Van Gieson also provided valuable assistance.
783

784 Brookings Paper-s on Economic Activity, 3:1987
disclosure that ensures, again in theory, widespread diffusion of benefits when the patent expires.
Previous investigations of the system suggest that patents do not always work in practice as they do in theory.' On the one hand, appropriability is not perfect. Many patents can be circumvented; others provide little protection because of stringent legal requirements for proof that they are valid or that they are being infringed. On the other hand, public disclosure does not always ensure ultimate diffusion of an inven- tion on competitive terms. For example, investments to establish the brand name of a patented product may outlive the patent itself.2 And patents may not always be necessary. Studies of the aircraft and semiconductor industries have shown that gaining lead time and exploit- ing learning curve advantages are the primary methods of appropriating returns. Other studies have emphasized the importance of complemen- tary investments in marketing and customer service.3
Evidence on the nature and strength of conditions for appropriability and on the working of the patent system is, however, scattered and unsystematic. Because imperfect appropriability may lead to underin- vestment in new technology, and because technological progress is a primary source of economic growth, it would be useful to have a more comprehensive empirical understanding of appropriability, in particular, to identify those industries and technologies in which patents are effective in preventing competitive imitation of a new process or product. It would also be desirable to know where patents can be profitably licensed. Where patents are not effective, it would be useful to under- stand why they are not and whether other mechanisms are.
1. F. M. Scherer and others, Patents and the Coiporation: A Report on Industrial Technology under Changing Public Policy, 2d ed. (privately published, 1959); and C. T. Taylor and Z. A. Silberston, The Economic Impact of the Patent System: A Stludy of the British Exper-ience (Cambridge University Press, 1973).
2. See, for example, Meir Statman, "The Effect of Patent Expiration on the Market Position of Drugs," in Robert B. Helms, ed., Drulgs and Health: Economic Issues anid Policy Objectives (Washington, D.C.: American Enterprise Institute, 1981), pp. 140-51.
3. The importance of lead time and learning curve advantages is documented in Almarin Phillips, Technology and Market Structure: A Study of the Aircraft Indiustry (Lexington Books, 1971); and John E. Tilton, International Diffuision of Technology: The Case of Semicondiuctors (Brookings, 197 1). For the importance of marketing and customer service, see Marie-Therese Flaherty, "Field Research on the Link between Technological Innovation and Growth: Evidence from the International Semiconductor Industry," working paper 84-83 (Harvard University, Graduate School of Business Administration, no date).

R. C. Levin, A. K. Klevorick, R. R. Nelson, and S. G. Winter 785
This paper describes the results of an inquiry into appropriability conditions in more than one hundred manufacturing industries. We discuss how this information has been and might be used to cast light on important issues in the economics of innovation and public policy. Our data, derived from a survey of high-level R&D executives, are informed opinions about an industry's technological and economic environment rather than quantitative measures of inputs and outputs.
Although our use of semantic scales to assess, for example, the effectiveness of alternative means of appropriation introduces consid- erable measurement error, more readily quantifiable proxies would probably not serve as well. Remarkable progress has been made toward developing a methodology to estimate the economic value of patents.4 But suitable data are as yet unavailable in the United States, and European data lack sufficiently reliable detail to support inferences about interindustry differences in the value of patents. Ourjudgment was that asking knowledgeable respondents about the effectiveness of patents and alternative means of appropriation was at least as likely to produce useful answers as asking for quantitative estimates of the economic value of a typical patent.
We have taken considerable care to establish the robustness of our findings in the presence of possibly substantial measurement error, but ultimately the value of the data will depend on their contribution to better empirical understanding of technological change and more dis- criminating discussion of public policy. To view the empirical contribu- tion of the data from the simplest perspective, consider their potential for improving the quality of research that uses patent counts to measure innovative activity.5 This line of inquiry has shown, among other results, that industries vary significantly in the average number of patents generated by each dollar of R&D investment.6 Our findings on industry
4. See, especially, Ariel Pakes, "Patents as Options: Some Estimates of the Value of Holding European Patent Stocks," Econometrica, vol. 54 (July 1986), pp. 755-84.
5. For a summary of the best of this work, see Zvi Griliches, Ariel Pakes, and Bronwyn H. Hall, "The Value of Patents as Indicators of Inventive Activity," working paper 2083 (Cambridge, Mass.: National Bureau of Economic Research, November 1986). For other perspectives on the usefulness of patent data, see the special issue of Research Policy, vol. 16 (August 1987).
6. F. M. Scherer, "The Propensity to Patent," International Journal of Industrial Organization, vol. 1 (March 1983), pp. 107-28; and John Bound and others, "Who Does R&D and Who Patents?" in Zvi Griliches, ed., R&D, Patents andPProductivity (University of Chicago Press for National Bureau of Economic Research, 1984), pp. 21-54.
786 Brookings Papers on Economic Activity, 3:1987
differences in patent effectiveness may help explain this variation in the apparent productivity of R&D.
More fundamentally, large and persistent interindustry differences in R&D investment and innovative performance have resisted satisfactory explanation, in part for lack of data that adequately represent the theoretically important concepts of appropriability and technological opportunity. Promising but ultimately unsatisfactory results have been obtained in exploratory work that used crude proxy variables and econometric ingenuity to capture the influence of appropriability and opportunity conditions.7 Our desire to provide a stronger basis for this line of inquiry was a prominent motive for our survey research and helped to shape its design.
Finally, gathering better information on the nature and strength of appropriability is particularly timely in view of the prominence of current debates on the adequacy of laws and institutions to protect intellectual property. One impetus for change has been the need to clarify and perhaps strengthen the system of property rights at various new frontiers of technology. Thus, for example, recent legislation has adapted copy- right law to protect the rights of the creator of new computer software, a new legal framework has been constructed to protect intellectual property embodied in semiconductor chip designs, and important court decisions and administrative actions have shaped the development of a property rights system in biotechnology.8
Another spur to change has been the need to resolve conflicts between the aims of social regulation and the exercise of intellectual property rights. For example, the Drug Price Competition and Patent Term Restoration Act of 1984 extended patent lives of pharmaceuticals to compensate for regulatory requirements that delay the introduction of new drugs.
7. Richard C. Levin, "Toward an Empirical Model of Schumpeterian Competition," working paper 43 (Yale University, School of Organization and Management, 1981); Richard C. Levin and Peter C. Reiss, "Tests of a Schumpeterian Model of R&D and Market Structure," in Griliches, ed., R&D, Patents and Productivity, pp. 175-204; and Ariel Pakes and Mark Schankerman, "An Exploration into the Determinants of Research Intensity," in Griliches, ed., R&D, Patents and Productivity, pp. 209-32.
8. See Computer Software Act of 1980; Semiconductor Chip Protection Act of 1984; Diamond v. Chakrabarty, 447 U.S. 305 (1980), holding that plant and animal life is patentable under U.S. patent law; and D. J. Quigg, memorandum of April 7, 1987, explaining the policies of the U.S. Patent and Trademark Office concerning applications to patent life forms.

R. C. Levin, A. K. Klevorick, R. R. Nelson, and S. G. Winter 787
Intellectual property rights also figure prominently among policy issues milling under the banner of competitiveness. Recent annual reports of the U.S. trade representative have focused on the difficulties U.S. manufacturers encounter in protecting intellectual property rights in foreign markets. The trade bill passed in 1987 by the House of Representatives contains several provisions that increase the scope of protection and the opportunities for relief available to U.S. manufactur- ers confronted with imports that infringe these rights.9 Proposed antitrust legislation, motivated by a concern that courts have kept inventors from reaping rewards that patent laws are intended to provide, stipulates that patent license agreements and similar contracts relating to use of intellectual property "shall not be deemed illegal per se under any of the antitrust laws." 10
To the extent that all this activity attempts to rectify obvious inade- quacies in existing institutions, the case for reform appears strong and straightforward. It is easy to deplore the blatant copying of innovative integrated circuit designs, the importation of "knock off" copies of trademarked or patented U.S. products, and the piracy of copyrighted written matter and audio and video cassettes. But reforms may yield unintended consequences. In its simplest form, this concern translates into wariness about Trojan horses: provisions brought into the law by the rhetorical tug of "competitiveness" and "intellectual property" may harbor instruments of protectionism and price fixing. Other potential consequences are subtler but no less important. For example, seemingly uniform adjustments of intellectual property, antitrust, or trade law may affect some industries quite differently than others.
And it should not be taken for granted that more appropriability is better, that better protection necessarily leads to more innovation, which yields better economic performance-higher standards of living, better competitiveness, and so on. Better protection may yield more innovation at the cost of incrementally increasing resources devoted to producing the innovation: the larger prize may merely encourage duplicative private effort to capture it."I Alternatively, better protection may induce inno-
9. See H.R. 3, the Omnibus Trade and Competitiveness Reform Act of 1987, which is currently under consideration by a House-Senate conference committee.
10. H.R. 557 and S. 438, 100 Cong., 1 sess. 11. This is the "free access" externality, first emphasized in the context of innovation
in Yoram Barzel, "Optimal Timing of Innovations," Review of Economics and Statistics, vol. 50 (1968), pp. 348-55. For a survey of the literature on patent races, see Jennifer

788 Brookings Paper-s on Economic Activity, 3:1987
vation of the wrong kind, or it may buy the innovation by further delaying access to it on competitive terms.'2
The premise that stronger protection will always improve the incen- tives to innovate is also open to challenge. Unimpeded diffusion of existing technology is immediately beneficial not only for consumers but also for those who would improve that technology. Because technolog- ical advance is often an interactive, cumulative process, strong protec- tion of individual achievements may slow the general advance. This would not occur in a hypothetical world without transaction costs, in which efficient contracts to share information would be made. In reality, however, markets for rights to information are subject to major trans- actional hazards, and strong protection of a key innovation may preclude competitors from making socially beneficial innovations. The semicon- ductor industry of the 1950s and 1960s provides an excellent example of rapid progress in a cumulative technology that might have been impos- sible under a regime that strongly protected intellectual property. 13
The remainder of this paper discusses our survey instrument, the construction of the sample, and the interpretation of the data, then turns to our findings concerning the effectiveness of patents and other means of appropriating the returns from R&D. The results of related work that employs the survey data to reexamine central questions in the empirical literature on R&D are summarized, and we discuss how our findings might contribute to a more discriminating discussion of patent law, antitrust law, and trade policy.
Questionnaire Design and Survey Methods
The content of our questionnaire was shaped with guidance from the conceptual literature on technological change, empirical literature on
Reinganum, "The Timing of Innovation: Research, Development and Diffusion," in Richard Schmalensee and Robert Willig, ed., Handbook ofIndustrial Organization (North- Holland, 1988).
12. Richard R. Nelson, "Assessing Private Enterprise: An Exegesis of Tangled Doctrine," Bell Journal of Economics, vol. 12 (Spring 1981), pp. 93-111; and William D. Nordhaus, Invention, Growth, and Welfare: A Theoretical Treatment of Technological Change (MIT Press, 1969).
13. Richard C. Levin, "The Semiconductor Industry," in Richard R. Nelson, ed., Government and Technical Progress: A Cross-Industty Analysis (Pergamon Press, 1982), pp. 9-100.

R. C. Levin, A. K. Klevorick, R. R. Nelson, and S. G. Winiter 789
the economic impact of the patent system, the work of Mansfield and his associates on imitation costs, and numerous case studies.14 The questionnaire was aimed at high-level R&D managers with knowledge of both the relevant technology and market conditions. To check the interpretability of the questions and the likely validity and reliability of the responses, we pretested the questionnaire with twelve managers representing diverse businesses.'5
To understand how appropriability differs across industries, we asked each respondent to report typical experiences or central tendencies within a particular industry. Respondents were thus treated as informed observers of a line of business rather than as representatives of a single firm, an approach that encouraged cooperation (they were not placed in the position of possibly divulging practices or policies of their own firms), but led inevitably to heterogeneity in the responses within a given industry.
The questionnaire contained four parts. Parts 1 and 2 concerned appropriability; parts 3 and 4 concerned technological opportunity and technological advance. Questions in part 1 asked about the effectiveness of alternative means of protecting the competitive advantages of R&D, limits on the effectiveness of patents, and ways of acquiring knowledge of a competitors' technology. Part 2 asked about the cost and time required to imitate innovations of rivals; we distinguished process from
14. Among the sources of ideas for the questions are Paul Allan David, Techniical Choice, Innovation and Economic Growith: Essays on Americatn and British Experience in the Nineteenth Centuty (Cambridge University Press, 1975); Richard R. Nelson and Sidney G. Winter, "In Search of Useful Theory of Innovation," Research Policy, vol. 6 (Winter 1977), pp. 36-76; Nathan Rosenberg, "Science, Invention and Economic Growth," Econiomic Jolurnal, vol. 84 (March 1974), pp. 90-108; and Devandra Sahal, Patterns of Technological Innovation (Addison-Wesley, 1981). For empirical literature on the eco- nomic effects of the patent system, see Scherer and others, Patents and the Coi-por ation; and Taylor and Silberston, The Economic Impact of the Patent System. For imitation costs, see Edwin Mansfield, Mark Schwartz, and Samuel Wagner, "Imitation Costs and Patents: An Empirical Study," Economic Journal, vol. 91 (December 1981), pp. 907-18.
15. These managers had experience in communications equipment, industrial inorganic chemicals, metal cutting machine tools, shoe machinery, household electrical appliances, processed foods, computing equipment, semiconductors, copper smelting and refining, radio and TV sets, and industrial organic chemicals. They were asked to complete the questionnaire for a specific line of business, but to keep in mind the suitability of the questions for other lines of business with which they were familiar. After completing the questionnaire, they were interviewed face-to-face or by telephone. Interviews typically lasted one-half hour or more, and each question was discussed to eliminate sources of ambiguity.

790 Brookings Papers on Economic Activity, 3:1987
product innovations, major from typical, and patented from unpa- tented. 16 Part 3 explored the links between an industry's technology and other sources of technological contribution. We asked about the impor- tance of scientific research in general and university-based research in particular. We also asked about the extent to which interindustry spillovers are an important source of technological opportunity. Part 4 asked some broad questions about the pace and character of techno- logical advance.17 This paper analyzes responses to the questions in parts 1 and 2.18
SAMPLE CONSTRUCTION
As a sampling frame, we used the lines of business defined by the Federal Trade Commission. In the manufacturing sector, these chiefly correspond to four-digit SIC industries, although some are defined as groups of four-digit or even three-digit industries. The FTC lines provide the most disaggregated level at which data on R&D expenditures are available. An additional consideration was that F. M. Scherer's tech- nology flow matrix, which classifies patents by industry of origin and industry of use, was also constructed at this level of aggregation. 19
Ultimately, we received responses from 650 individuals representing 130 lines of business, with ten or more responses from eighteen industries and five to nine from twenty-seven industries. The sample was reason-
16. The questions were similar to those in Mansfield, Schwartz, and Wagner, "Imita- tion Costs and Patents," but covered typical rather than specific innovations. Our industry sample was also broader.
17. One objective was to examine "natural trajectories" of the sort described in Nelson and Winter, "In Search of Useful Theory," p. 56.
18. Data from responses to questions in parts 3 and 4 have been used in Richard C. Levin, Wesley M. Cohen, and David C. Mowery, "R&D Appropriability, Opportunity, and Market Structure: New Evidence on Some Schumpeterian Hypotheses," American Economic Review, vol. 75 (May 1985, Papers and Proceedings, 1984), pp. 20-24; Cohen, Levin, and Mowery, "Firm Size and R&D Intensity: A Re-examination," Journal of Industrial Economics, vol. 35 (June 1987), pp. 543-65; and Richard C. Levin and Peter C. Reiss, "Cost-Reducing and Demand-Creating R&D with Spillovers"(Stanford University, Graduate School of Business, 1986). See Richard R. Nelson, "Institutions Supporting Technical Advance in Industry," American Economic Review, vol. 76 (May 1986, Papers and Proceedings, 1985), pp. 186-89, for findings on the importance of external sources of technological knowledge.
19. F. M. Scherer, "Inter-industry Technology Flows in the United States," Researcl Policy, vol. 11 (August 1982), pp. 227-45.
R. C. Levin, A. K. Klevorick, R. R. Nelson, and S. G. Winter 791
ably representative of firms performing R&D, though the exclusion of those without publicly traded securities undoubtedly means that small start-up ventures, important sources of innovation, were underrepre- sented. The number of respondents in a line of business was positively correlated with the line's R&D spending, sales volume, and R&D intensity. The number of respondents did not increase in strict proportion to the level of industry R&D or sales, but the rate of response within a line of business was not significantly correlated with industry R&D spending, sales, or R&D intensity. The Appendix presents further details of sample construction.
METHODOLOGICAL ISSUES
Given our interest in identifying differences in the appropriability of R&D, it is reassuring that analysis of variance confirmed the presence of significant interindustry variation in the responses to most question- naire items.20 There was, however, also substantial intraindustry varia- tion in the responses.
There are several potential sources of intraindustry heterogeneity in the responses to any given question. First, the lines of business as defined by the FTC may be objectively heterogeneous in their products and technologies. For example, if two firms classified as manufacturers of industrial inorganic chemicals produce different products using different technologies, they might differ markedly in their perception of the effectiveness of patents or the time required for imitation in their "industry. " To eliminate this source of heterogeneity, we asked respon- dents to identify two major innovations-a process and a product- within their industries during the past ten to fifteen years. For most industries with ten or more respondents, more than half the respondents agreed on at least one such innovation. We thus believe it unlikely that overly aggregated industry definition was a major source of intraindustry heterogeneity.21
20. Interindustry differences are significant at the 0.05 level for approximately 60 percent of the questions in parts 1 and 2 of the questionnaire. If a higher level of aggregation is used to measure industry effects, such as the level at which the National Science Foundation reports R&D spending (a hybrid of two- and three-digit level industries), interindustry differences are significant at the 0.05 level for 70 percent of the questions.
21. Heterogeneity, as anthropologists have long insisted, is, however, in the eye of the

792 Brookings Papers oni Economic Activity, 3:1987
A respondent's perception of the central tendencies within an industry may also be affected by his firm's policies or strategies. Respondents in the same line of business may thus have different perceptions of the common technological environment that they were asked to character- ize. A two-way analysis of variance of the responses on the effectiveness of patents, for example, revealed that both firm and industry effects are statistically significant. A representative multi-industry firm, however, tends to be involved in technologically related industries, and thus what appear to be effects attributable to the firm in the data may simply reflect the correlation in responses from related industries.
The third, and probably most important, source of intraindustry heterogeneity is the inherently subjective nature of the semantic scales used in the survey. Most answers were reported on a seven-point Likert scale. The effectiveness of patents in preventing duplication was, for instance, evaluated on a scale ranging from "not at all effective" to ''very effective." There is no natural or objective anchor for such evaluative ratings. Individuals may perceive the same environment but simply use the scale differently. Some might systematically favor high scores; others might concentrate responses in the center of the scale; still others might frequently use extreme values.
The numerous techniques available to control for differences among respondents in means and variances generally require abandoning one or more dimensions along which the data might be informative. For example, we were interested in interindustry comparisons of answers to a single question; controlling for fixed effects among respondents would vitiate such comparisons, since we expected a respondent's mean score over all questions to depend on his industry. Standardizing the variance of each respondent's answers raised similar problems: the distribution of "correct" responses was unknown and it almost certainly differed systematically among industries. Rather than impose an arbitrary stan- dardization, therefore, we examined the results for each group of questions using a variety of techniques and perspectives to assess the
beholder. One R&D manager, asked to inform us about the air and gas compressor industry, inquired whether we were interested in large, medium, or small compressors. In his view the technologies were fundamentally different. We asked him to note on his questionnaire where the answers to our questions differed across these size categories. The booklet he returned contained no such notation.

R. C. Levin, A. K. Klevorick, R. R. Nelson, and S. G. Winter 793
robustness of our principal conclusions. There was undeniably much noise in the data, but several important signals were robust to alternative weightings of the observations, alternative partitions of the sample, and the use of alternative summary statistics.22
We sidestepped one methodological difficulty by treating ratings along a seven-point semantic continuum as if they were interval data. The data were, of course, more properly to be regarded as ordinal. It would have been straightforward to treat them as ordinal if we had been interested only in interindustry comparisons of responses to a single question. We also sought, however, to make comparisons among questions (for example, are patents more or less effective than secrecy in protecting process innovations from duplication?), and we therefore treated the data as if they were interval.23
One additional methodological concern was whether our level of industry aggregation was appropriate for the problems being studied. The FTC line-of-business level was chosen to facilitate merging the data with disaggregated R&D data and Scherer's classification of patents by industries of origin and use. Our analysis indicated, however, that most of the interesting interindustry distinctions among the 130 lines defined at the FTC level were robust to an aggregation of the data into the 25 industry groups used by the National Science Foundation in its annual survey of R&D spending and employment patterns.
Patents and Other Means of Appropriation
Table 1 shows the pattern of responses, based on a seven-point scale, to questions on the effectiveness of alternative means of capturing and protecting the competitive advantages of new or improved processes and products. The first two columns report the mean response for the
22. One notable consequence arising from the measurement error in the data was that industry mean responses from lines of business with only one or two respondents tended to be disproportionately located near the extremes of the distribution of mean responses to any given question. Most conclusions based on the full sample of 130 lines, and virtually all those emphasized in this paper, were replicated in the smaller sample of 75 lines that had more than two respondents.
23. We designed the questionnaire to ensure that cross-question comparisons would arise naturally in the minds of the respondents. The items were arranged in blocks, with each item in a block rated on the same semantic scale.

794 Brookings Papers on Economic Activity, 3:1987
Table 1. Effectiveness of Alternative Means of Protecting the Competitive Advantages of New or Improved Processes and Productsa
Distribution of Overall sample means industmy meansb
Method of appropriation Processes Products Processes Products
Patents to prevent duplication 3.52 4.33 2.6-4.Oc 3.0-5.Oc (0.06) (0.07)
Patents to secure royalty income 3.31 3.75 2.3-4.0c 2.7-4.8c (0.06) (0.07)
Secrecy 4.31 3.57 3.3-5.0 2.7-4.1 (0.07) (0.06)
Lead time 5.11 5.41 4.3-5.9c 4.8-6.0c (0.05) (0.05)
Moving quickly down the 5.02 5.09 4.5-5.7 4.4-5.8 learning curve (0.05) (0.05)
Sales or service efforts 4.55 5.59 3.7-5.5 5.0-6.1 (0.07) (0.05)
Source: Authors' calculations. a. Range: I = not at all effective; 7 = very effective. Standard errors in parentheses. b. From the upper bound of the lowest quintile of industries to the lower bound of the highest quintile. c. Differences in means significant at the .01 level.
entire sample of 650 respondents to each question, as well as the standard error of each estimated mean. These statistics, of course, give equal weight to each respondent and consequently weight each industry in proportion to its number of respondents. The overall pattern across questions, however, is robust to the use of alternative summary statistics, such as the mean of industry means or the median of industry means. This is apparent in columns 3 and 4, which summarize the distribution of industry mean responses to each question. Each pair of numbers represents the range of industry means from the upper bound of the lowest quintile to the lower bound of the highest quintile of industries: 20 percent of the 130 industries had mean responses at or below the bottom of the range indicated for each question, and 20 percent had mean responses at or above the top of the range. Mean responses for the remaining 60 percent (or 78 industries) fell within the reported range.
The picture is striking. For new processes (columns 1 and 3), patents were generally rated the least effective of the mechanisms of appropri- ation: only 20 percent of the lines of business surveyed rated process patent effectiveness in excess of 4.0. Eighty percent scored the effec- tiveness of lead time and learning curve advantages on new processes in
R. C. Levin, A. K. Klevorick, R. R. Nelson, and S. G. Winter 795
excess of 4.3. Secrecy, though not considered as effective as lead time and learning advantages, was still considered more effective than patents in protecting processes.
Patents for products were typically considered more effective than those for processes, and secrecy was considered less effective in protecting products than processes. Generally, lead time, learning curves, and sales or service efforts were regarded as substantially more effective than patents in protecting products. Eighty percent of the sample businesses rated the effectiveness of sales and service efforts above 5.0, but only 20 percent considered product patents this effective.24
The tendency to regard secrecy as more effective than process patents but less effective than product patents probably reflects the greater ease and desirability of maintaining secrecy about process technology. Firms may sometimes refrain from patenting processes to avoid disclosing either the fact or the details of an innovation.25 But firms have every incentive to advertise the advantages of new or improved products and to get them into the hands of customers, thereby facilitating direct observation of the product and the technology it embodies. Maintaining secrecy about product innovations is thus likely to be both difficult and undesirable.
Respondents also tended to regard patents to prevent duplication as more effective than patents to secure royalty income. This finding was consistent with the view that licensing arrangements are beset with transactional difficulties.
Only 3 of 130 lines of business rated process patents higher than five on a seven-point scale of effectiveness in preventing duplication. Two of these were concrete and primary copper; the other had only a single respondent.26 Only 5 of 130 industries rated product patents to prevent
24. This view of the efficacy of sales and service efforts is consistent with the emphasis given to investment in "cospecialized assets" as a means of appropriation in David J. Teece, "Profiting from Technological Innovation: Implications for Integration, Collabo- ration, Licensing and Public Policy," Research Policy, vol. 15 (December 1986), pp. 285- 305.
25. See Ignatius Horstmann, Glenn M. MacDonald, and Alan Slivinski, "Patents as Information Transfer Mechanisms: To Patent or (Maybe) Not to Patent," Journal of Political Economy, vol. 93 (October 1985), pp. 837-58, for a theoretical treatment of the issue.
26. To preserve confidentiality, we do not identify any industry in which there was only one response. Hereafter, we refer to such cases as singletons.
796 Brookings Papers on Economic Activity, 3:1987
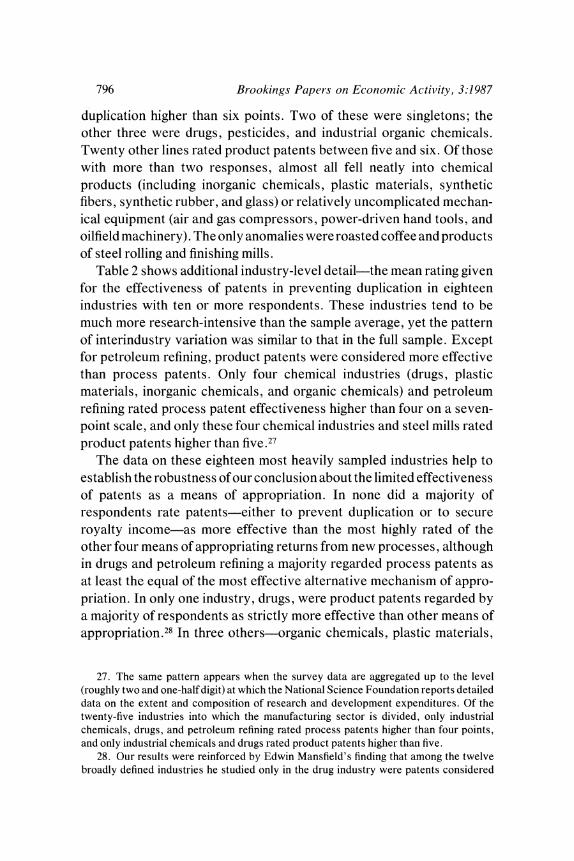
duplication higher than six points. Two of these were singletons; the other three were drugs, pesticides, and industrial organic chemicals. Twenty other lines rated product patents between five and six. Of those with more than two responses, almost all fell neatly into chemical products (including inorganic chemicals, plastic materials, synthetic fibers, synthetic rubber, and glass) or relatively uncomplicated mechan- ical equipment (air and gas compressors, power-driven hand tools, and oilfield machinery). The only anomalies were roasted coffee and products of steel rolling and finishing mills.
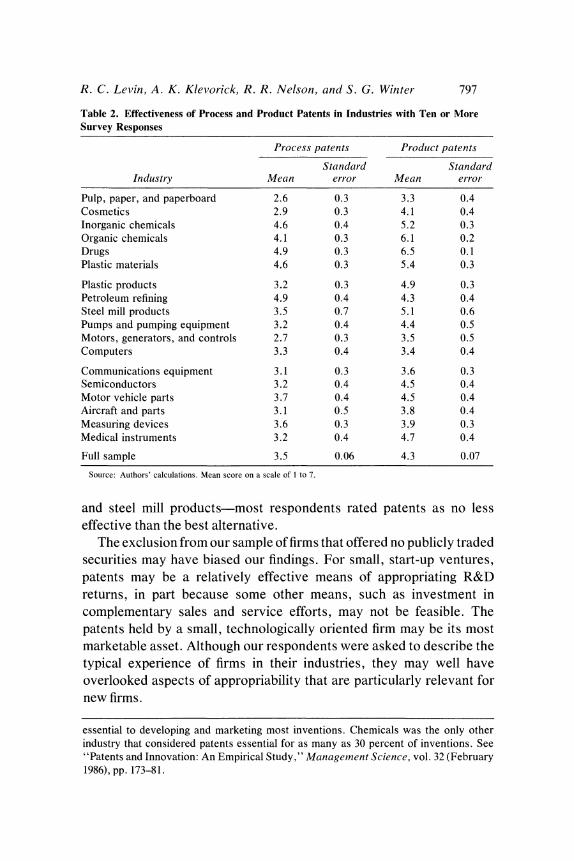
Table 2 shows additional industry-level detail-the mean rating given for the effectiveness of patents in preventing duplication in eighteen industries with ten or more respondents. These industries tend to be much more research-intensive than the sample average, yet the pattern of interindustry variation was similar to that in the full sample. Except for petroleum refining, product patents were considered more effective than process patents. Only four chemical industries (drugs, plastic materials, inorganic chemicals, and organic chemicals) and petroleum refining rated process patent effectiveness higher than four on a seven- point scale, and only these four chemical industries and steel mills rated product patents higher than five.27
The data on these eighteen most heavily sampled industries help to establish the robustness of our conclusion about the limited effectiveness of patents as a means of appropriation. In none did a majority of respondents rate patents-either to prevent duplication or to secure royalty income-as more effective than the most highly rated of the other four means of appropriating returns from new processes, although in drugs and petroleum refining a majority regarded process patents as at least the equal of the most effective alternative mechanism of appro- priation. In only one industry, drugs, were product patents regarded by a majority of respondents as strictly more effective than other means of appropriation.28 In three others-organic chemicals, plastic materials,
27. The same pattern appears when the survey data are aggregated up to the level (roughly two and one-half digit) at which the National Science Foundation reports detailed data on the extent and composition of research and development expenditures. Of the twenty-five industries into which the manufacturing sector is divided, only industrial chemicals, drugs, and petroleum refining rated process patents higher than four points, and only industrial chemicals and drugs rated product patents higher than five.
28. Our results were reinforced by Edwin Mansfield's finding that among the twelve broadly defined industries he studied only in the drug industry were patents considered
R. C. Levin, A. K. Klevorick, R. R. Nelson, and S. G. Winter 797
Table 2. Effectiveness of Process and Product Patents in Industries with Ten or More Survey Responses
Process patents Prodluct patents
Standard Standard Industry Mean error Mean error
Pulp, paper, and paperboard 2.6 0.3 3.3 0.4 Cosmetics 2.9 0.3 4.1 0.4 Inorganic chemicals 4.6 0.4 5.2 0.3 Organic chemicals 4.1 0.3 6.1 0.2 Drugs 4.9 0.3 6.5 0.1 Plastic materials 4.6 0.3 5.4 0.3
Plastic products 3.2 0.3 4.9 0.3 Petroleum refining 4.9 0.4 4.3 0.4 Steel mill products 3.5 0.7 5.1 0.6 Pumps and pumping equipment 3.2 0.4 4.4 0.5 Motors, generators, and controls 2.7 0.3 3.5 0.5 Computers 3.3 0.4 3.4 0.4
Communications equipment 3.1 0.3 3.6 0.3 Semiconductors 3.2 0.4 4.5 0.4 Motor vehicle parts 3.7 0.4 4.5 0.4 Aircraft and parts 3.1 0.5 3.8 0.4 Measuring devices 3.6 0.3 3.9 0.3 Medical instruments 3.2 0.4 4.7 0.4
Full sample 3.5 0.06 4.3 0.07
Source: Authors' calculations. Mean score on a scale of I to 7.
and steel mill products-most respondents rated patents as no less effective than the best alternative.
The exclusion from our sample of firms that offered no publicly traded securities may have biased our findings. For small, start-up ventures, patents may be a relatively effective means of appropriating R&D returns, in part because some other means, such as investment in complementary sales and service efforts, may not be feasible. The patents held by a small, technologically oriented firm may be its most marketable asset. Although our respondents were asked to describe the typical experience of firms in their industries, they may well have overlooked aspects of appropriability that are particularly relevant for new firms.
essential to developing and marketing most inventions. Chemicals was the only other industry that considered patents essential for as many as 30 percent of inventions. See "Patents and Innovation: An Empirical Study," Management Science, vol. 32 (February 1986), pp. 173-81.

798 Brookings Papers on Economic Activity, 3:1987
The most probable explanation for the robust finding that patents are particularly effective in chemical industries is that comparatively clear standards can be applied to assess a chemical patent's validity and to defend against infringement. The uniqueness of a specific molecule is more easily demonstrated than the novelty of, for example, a new component of a complex electrical or mechanical system. Similarly, it is easy to determine whether an allegedly infringing molecule is physically identical to a patented molecule; it is more difficult to determine whether comparable components of two complex systems "do the same work in substantially the same way." To the extent that very simple mechanical inventions approximate molecules in their discreteness and easy differ- entiability, it is understandable that industries producing such machinery rank just after chemical industries in the perceived effectiveness of patent protection.
The perceived ineffectiveness of patents in most industries raises the question of why firms use them. Further work is needed here, but we offer some speculations informed by the comments of ourpretest subjects and by several survey respondents at a conference we held to report preliminary findings. These executives identified two motives for pat- enting that have little connection with appropriating returns from in- vestment. One is to measure the performance of R&D employees, which is a significant problem because these workers are typically engaged in team production. Legal standards for identifying inventors on a patent application are, however, reasonably rigorous. The second motive is to gain access to certain foreign markets. Some developing countries require, as a condition of entry, that U.S. firms license technology to a host-country firm, and some patents are filed primarily to permit such licensing.29
29. Yet another motive discussed in the literature is to gain strategic advantage in negotiation. In the semiconductor industry, for instance, the cumulative nature of the technology makes it difficult to participate legally without access to the patents of numerous firms. In consequence, there is widespread cross-licensing. Established firms, however, rarely license a new entrant until it has established a significant position in the market. As a defense against infringement suits, a prudent new entrant will establish a patent portfolio of its own, thus compelling established firms to negotiate cross-license agreements. See Eric von Hippel, "Appropriability of Innovation Benefit as a Predictor of the Source of Innovation," Research Policy, vol. 11 (January 1982), pp. 95-115; and Levin, "Semicon- ductor Industry," pp. 80-81.
R. C. Levin, A. K. Klevorick, R. R. Nelson, and S. G. Winter 799
Conditions Affecting Appropriability
Thus far we have focused on the overall strength of various mecha- nisms of appropriation and on interindustry variations in the effective- ness of patents. The patterns of covariation in the responses, however, suggested that interindustry differences in conditions affecting appro- priability might be summarized by a limited number of factors. Moreover, the clear indications that patents are effective in only a few industries suggested that it might be fruitful to classify industries into clusters distinguishable by a primary means of appropriation and perhaps by the overall ease of appropriating returns. Such clusters could prove useful in examining links between appropriability conditions and measures of R&D, innovation, and productivity growth.
Correlations among responses to questions on the effectiveness of alternative means of appropriation revealed some interesting patterns.30 When patents effectively prevent competitors from duplicating pro- cesses and products, they tend also to be effective in securing royalty income. But neither form of effectiveness was strongly correlated with the effectiveness of other means of appropriation. For processes, there was a strong connection among three other mechanisms: lead time, learning curve advantages, and secrecy. For products, superior sales and service efforts were strongly linked to lead time and learning advantages, though not to secrecy.
The correlations suggested that the mechanisms of appropriation may be reduced to two dimensions: one associated with the use of patents, the other related to secrecy, lead time, and learning curve advantages. For product innovations, sales and service efforts may be involved in the second of these dimensions. We investigated this possibility by reducing the data to principal components and employing a variety of factor-analytic techniques. Principal factor analysis and several methods
30. Simple correlation coefficients were calculated using the individual respondent and industry mean responses as the units of observation. Correlations among industry means for the entire sample of 130 lines of business were qualitatively similar to those obtained when the sample was restricted to those with more than two responses. These and other correlation matrices discussed in this paper are available from the authors upon request.

800 Brookings Papers on Economic Activity, 3:1987
Table 3. Principal Components Analysis of Methods of Appropriation
Processes and produicts Processes and products separately together
Coefficients Coefficients Coefficients Coefficients of 1st of 2d of 1st of 2d
principal principal principal principal Method of appropriation component component component component
New Processes Patents to prevent duplication .04 .86 .01 .73 Patents to secure royalties .12 .86 .08 .78 Secrecy .59 - .12 .54 .04 Lead time .84 -.09 .79 -.04 Moving down the learning curve .84 - .05 .80 - .04 Sales and service efforts .51 .11 .45 -.06 Cumulative variance explained .34 .59 n.a. n.a.
New Products Patents to prevent duplication .06 .87 .06 .73 Patents to secure royalties .06 .87 .07 .80 Secrecy .51 .01 .51 .06 Lead time .84 .00 .79 -.03 Moving down the learning curve .84 - .07 .82 - .04 Sales and service efforts .69 -.09 .62 -.11 Cumulative variance explained .36 .61 .31 .50
Source: Authors' calculations.
of rotation did little to alter the picture presented by the principal components, which are shown in table 3.31
The first two columns of the table show the weights associated with the first two principal components when the six questions relating to process appropriability are analyzed separately from the six questions relating to product appropriability. The next two columns report the results of a principal components analysis on the entire set of twelve questions. With both approaches, the first principal component gives near-zero weight to the two patent-related methods of appropriation and heavy weight to the other mechanisms. The weighting is reversed for the second principal component. Thus the first two principal components (and, in the factor analysis, the first two factors) are readily interpreted, respectively, as nonpatent- and patent-related dimensions of appropri- ability. Despite this clear interpretation, the data do not reduce very
31. The results reported in table 3 are based on a principal components analysis undertaken at the level of individual responses. An analysis at the level of industry mean responses produced similar results.

R. C. Levin, A. K. Klevorick, R. R. Nelson, and S. G. Winter 801
Table 4. Cluster Analysis of Mechanisms of Appropriation
Cluster
Method of appropriation 1 2 3
New Processes Number of industries 38 67 25 Mean score
Patents to prevent duplication 3.1 3.0 4.7 Patents to secure royalties 2.9 2.9 4.8 Secrecy 2.8 4.6 4.7 Lead time 4.2 5.4 5.6 Learning curves 4.3 5.3 5.1 Superior sales or service 4.7 4.5 4.9
New Products Number of industries 20 68 42 Mean score
Patents to prevent duplication 3.1 3.8 5.3 Patents to secure royalties 3.2 3.1 5.0 Secrecy 2.6 3.5 4.0 Lead time 4.0 5.6 5.7 Learning curves 4.2 5.3 5.2 Superior sales or service 5.2 5.7 5.6
Source: Authors' calculations.
satisfactorily to just two dimensions. As table 3 indicates, when the process and product questions are analyzed separately, the first two components explain only 60 percent of the variance in the responses to six questions, and when the two sets of questions are combined, two components explain only 50 percent of the variance.
Our interpretation that the means of appropriation can be grouped into patent and nonpatent mechanisms was nonetheless reinforced by a cluster analysis that classified industries according to mean responses to the relevant questions. The best clustering results were achieved by dividing the industries into three groups, as shown in table 4. Industries assigned to cluster 1 tended to have relatively low scores for all mechanisms of appropriation. Sales and service effort was the most highly rated mechanism and was, in fact, regarded as reasonably effective in capturing returns from new products. Industries in cluster 2 rated lead time and learning curves as relatively effective, but not patents. Secrecy was important in appropriating process returns, and sales and service efforts complemented lead time and learning advantages for products. Only for cluster 3 were product and process patents deemed effective,

802 Brookings Papers on Economic Activity, 3:1987
but still the effectiveness of lead time and learning was no lower than for the industries in cluster 2. Those few industries in which patents were rated as more effective than other mechanisms were all in the third cluster.
The cluster analysis suggested that there was a group of industries in which no appropriation mechanism was particularly effective. As an alternative approach to identifying settings with low appropriability, we considered the maximum score an industry assigned to any of the six mechanisms on the questionnaire. Only 11 of the 130 failed to rate at least one means of appropriating returns from product innovation higher than five on the seven-point scale. The industries in this group with more than two responses were all drawn from the food products and metal- working sectors: milk, meat products, iron and steel foundries, boiler shops, and screw machine products (nuts, bolts, and screws). Many more industries (34 of 130) rated no means of appropriating process returns higher than five. This group contained all the industries (except milk) that ranked low on product appropriability but was otherwise a diverse lot. The heaviest concentration was in fabricated metals and machinery. But several chemical industries were also represented, including the three industries in which product patents were viewed as most effective-organic chemicals, pesticides, and drugs.
The urge to find patterns in the data should not be carried too far. The associations among mechanisms of appropriation revealed by the cor- relation, principal components, and cluster analyses are suggestive, but there is substantial heterogeneity in the underlying data. As noted, the first two principal components, though readily interpretable, explained an unsatisfactory fraction of the overall variance. A similar lack of good fit characterized the cluster analyses of process and product appropria- bility. Despite the fairly clear interpretation that could be given to each cluster, the variance within the clusters was almost twice that between clusters.
Limitations on Effectiveness of Patents
To understand why patent protection might be weak in some indus- tries, we asked respondents to rate the importance of possible limitations on patent effectiveness. Table 5 summarizes the responses. The ability

R. C. Levin, A. K. Klevorick, R. R. Nelson, and S. G. Winter 803
Table 5. Limitations on Effectiveness of Patents for New or Improved Processes and Productsa
Distribution of Overall sample means industry meansb
Limitation Processes Products Processes Products
New processes or products 4.32 3.75 3.6-5.4c 2.8-4.8 patentable (0.07) (0.07)
Patents unlikely to be valid if 4.18 3.92 3.5_5.Oc 3.05. 0c challenged (0.06) (0.07)
Firms do not enforce patents 4.29 3.84 3.5_5.0c 3.0-4.8c (0.06) (0.07)
Competitors legally "invent 5.49 5.09 4.9-6.0 4.4-5.9d around" patents (0.05) (0.06)
Technology moving so fast that 3.40 3.34 2.0-4.3d 2.0-4.0d patents are irrelevant (0.07) (0.07)
Patent documents disclose too 4.19 3.65 3.2-5.0 2.8-4.5c much information (0.07) (0.07)
Licensing required by court 2.96 2.79 2.0-3.8 2.0-3.3 decisions (0.06) (0.06)
Firms participate in cross-licensing 3.08 2.93 2.2-3.9d 2.1-3.9d agreements with competitors (0.06) (0.06)
Source: Authors' calculations. a. Range: 1 = not an important limitation; 7 very important limitation. Standard errors in parentheses. b. From the upper bound of the lowest quintile of industries to the lower bound of the highest quintile. c. Interindustry differences significant at the .10 level. d. Interindustry differences significant at the .01 level.
of competitors to "invent around" both process and product patents was rated higher than five on a seven-point scale of importance by 60 percent of the responding industries. Only one other constraint-the lack of ready patentability for new processes-was rated this important by more than 20 percent. Limitations on patents were generally consid- ered more severe for processes than for products, which was consistent with our finding that product patents tend to be more effective than process patents. In particular, the lack of patentability was more serious for processes than for products, and so was the disclosure of information through patent documents.32
32. Additional evidence of the internal consistency of the survey results was provided by the pattern of negative correlation between responses concerning limitations on patent effectiveness and responses concerning the effectiveness of patents. Using either individual respondents or industry means as the unit of observation, all such correlation coefficients were negative except in the case of compulsory licensing. Most correlations were significant at the .01 level.

804 Brookings Papers on Economic Activity, 3.1987
The responses concerning limits on patent effectiveness may illumi- nate and focus policy discussion. In recent years there has been consid- erable interest in making patent protection more effective. One initiative has been to make the legal requirements for a valid patent claim less stringent.33 Another has been to vacate court decrees that compel licensing. Our data identified industries in which stringent requirements for patent validity or compulsory licensing were perceived as important limitations on the usefulness of patents in appropriating returns.
Respondents from twenty-two lines of business, mostly in the food processing and fabricated metals sectors, considered the likely inability to withstand challenges to validity as significantly limiting the effective- ness of process patents (scoring the importance higher than five on a seven-point scale); for fourteen of these industries the mean response was six or higher on the scale. This group and the nineteen industries citing invalidity as a constraint on the effectiveness of product patents (again assigning a score higher than five) overlapped considerably. Further investigation would be required to determinejust why these two sectors appear to have difficulty establishing valid claims. Perhaps because they are mature industries, opportunities may be limited or novelty may be difficult to achieve or simply difficult to prove.
Compulsory licensing was rarely judged a significant limit on the effectiveness of patents. Only one industry with one respondent rated this constraint higher than five on the scale for products, and only six cited compulsory licensing of process patents as of comparable impor- tance. Two of these industries were not singletons-metal containers and electron tubes. Compulsory licensing decrees were thus perceived as important in only a small subset of the industries that F. M. Scherer indicated were subject to such decrees.34 The overall lack of impact from compulsory licensing requirements was consistent with Scherer' s finding that they did not discourage R&D spending.
33. For example, P.L. 98-622, passed in 1984, modified the previous requirement that each coinventor listed in a patent application also had to be a coinventor on every claim of the patent. The new law allows inventors to apply jointly, even though they may not have physically worked together, made the same level of contribution, or contributed individ- ually to the subject matter of each claim. For a thorough discussion, see Patrick Kelley, "Recent Changes in the Patent Law Which Affect Inventorship and the Ownership of Patents," unpublished manuscript (1985).
34. F. M. Scherer, The Economic Effects of Coinpllsoty Patent Licensing (New York University, Graduate School of Business Administration, 1977).

R. C. Levin, A. K. Klevorick, R. R. Nelson, and S. G. Winter 805
The choice between obtaining a patent and maintaining secrecy may be influenced by the extent to which the disclosures made in the patent document facilitate inventing around the patent. Our data provided some support for this theory. The effectiveness of secrecy was positively correlated with the extent to which disclosures limited the effectiveness of patents. The link was stronger for product patents than for process patents. But patent disclosures represented a substantial limitation on the effectiveness of product patents for only 4 of the 130 industries (scoring as high as six on the scale), and only 16 regarded process disclosures as comparably important. In only one line of business of those with five or more respondents-metal cutting machine tools-did disclosures constrain so substantially the effectiveness of both process and product patents.
Channels of Information Spillover
To the extent that a rival can learn easily about an innovator's technology, the incentive to invest in R&D is attenuated. But to the extent that learning is easy, wasteful duplication or near duplication of R&D effort by rival firms may be avoided. Also, knowledge of an innovator's new technology may complement rival R&D effort by enhancing its productivity. Richard Nelson and Sidney Winter, Michael Spence, and Richard Levin and Peter C. Reiss have developed models that begin to disentangle these offsetting effects, called by Spence the incentive and efficiency effects of interfirm spillovers.35 A sharper characterization of interindustry differences in the nature and strength of the mechanisms by which firms learn about their competitors' tech- nology should advance these modeling efforts.
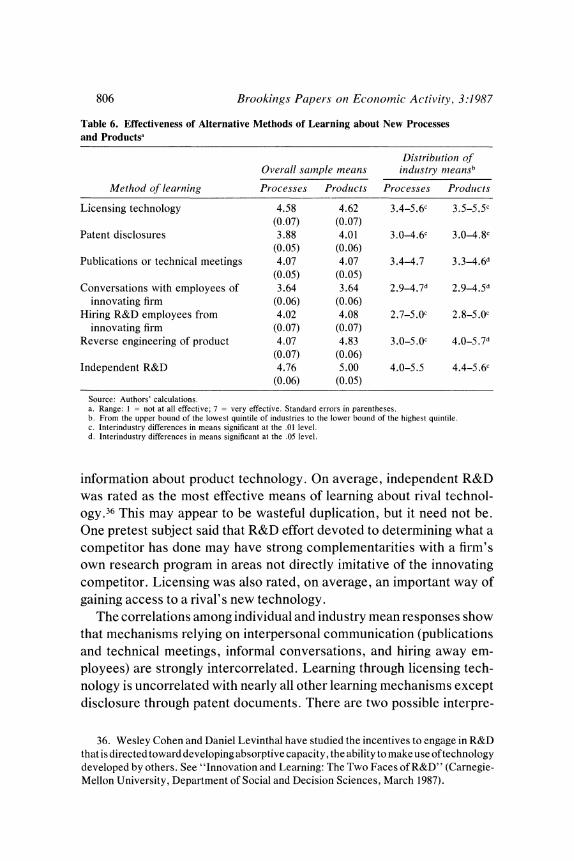
Table 6 summarizes the responses to questions about the effectiveness of alternative ways of learning. There is little difference between the pattern of responses for processes and for products, except that, as one would expect, reverse engineering is markedly more effective in yielding
35. Richard R. Nelson and Sidney G. Winter, "The Schumpeterian Tradeoff Revis- ited," American Economic Review, vol. 72 (March 1982), pp. 114-32; Michael Spence, "Cost Reduction, Competition, and Industry Performance," Econometrica, vol. 52 (January 1984), pp. 101-21; and Levin and Reiss, "Tests of a Schumpeterian Model," and "Demand-Creating and Cost-Reducing R&D."
806 Brookings Paper s on Economic Activity, 3:1987
Table 6. Effectiveness of Alternative Methods of Learning about New Processes and Productsa
Distribution of Overall sample means industry rneansb
Method of learning Processes Products Processes Produicts
Licensing technology 4.58 4.62 3.4_5.6c 3.5_5.5c (0.07) (0.07)
Patent disclosures 3.88 4.01 3.0-4.6c 3.0-4.8c (0.05) (0.06)
Publications or technical meetings 4.07 4.07 3.4-4.7 3.3_4.6d (0.05) (0.05)
Conversations with employees of 3.64 3.64 2.9-4.7d 2.9_4.5d innovating firm (0.06) (0.06)
Hiring R&D employees from 4.02 4.08 2.7-5.0c 2.8-5.0c innovating firm (0.07) (0.07)
Reverse engineering of product 4.07 4.83 3.0-5.0c 4.0_5.7d (0.07) (0.06)
Independent R&D 4.76 5.00 4.0-5.5 4.4-5.6c (0.06) (0.05)
Source: Authors' calculations. a. Range: I = not at all effective; 7 = very effective. Standard errors in parentheses. b. From the upper bound of the lowest quintile of industries to the lower bound of the highest quintile. c. Interindustry differences in means significant at the .01 level. d. Interindustry differences in means significant at the .05 level.
information about product technology. On average, independent R&D was rated as the most effective means of learning about rival technol- ogy. 36 This may appear to be wasteful duplication, but it need not be. One pretest subject said that R&D effort devoted to determining what a competitor has done may have strong complementarities with a firm's own research program in areas not directly imitative of the innovating competitor. Licensing was also rated, on average, an important way of gaining access to a rival's new technology.
The correlations among individual and industry mean responses show that mechanisms relying on interpersonal communication (publications and technical meetings, informal conversations, and hiring away em- ployees) are strongly intercorrelated. Learning through licensing tech- nology is uncorrelated with nearly all other learning mechanisms except disclosure through patent documents. There are two possible interpre-
36. Wesley Cohen and Daniel Levinthal have studied the incentives to engage in R&D that is directed toward developing absorptive capacity, the ability to make use of technology developed by others. See "Innovation and Learning: The Two Faces of R&D" (Carnegie- Mellon University, Department of Social and Decision Sciences, March 1987).

R. C. Levin, A. K. Klevorick, R. R. Nelson, and S. G. Winter 807
tations of this last connection. Potential licensees may learn about the opportunity to license through patent documents, or the documents may prove useful in employing new technology once it is licensed. We cannot tell whether the "announcement" effect or the "complementary infor- mation" effect of disclosures predominates.7
The pattern of correlation suggested that there might be three or four clusters of industries, distinguished in turn by an emphasis on learning through licensing, interpersonal channels, and reverse engineering or independent R&D, or both. The results obtained from cluster analysis were not entirely satisfactory.38 Nonetheless, table 7 presents the results of grouping the lines of business into three clusters on the basis of responses to the questions on channels of spillover.
For both new processes and products, the largest group of industries typically relied on licensing and independent R&D to learn about competitive technology. Interpersonal channels were relatively unim- portant, and reverse engineering was important for products. For both processes and products, there was a second cluster of industries in which interpersonal channels of spillover were most important. In the case of learning about new products, only ten industries were classified in this cluster, and in the case of learning about new processes, other channels- independent R&D and reverse engineering-were nearly as valuable. For processes, a third cluster appeared to find all mechanisms of learning relatively unproductive. For products this group found all mechanisms moderately effective.
Cost and Time Required for Imitation
As part of our investigation we asked respondents to estimate typical costs and time required to duplicate several categories of innovations if
37. The correlations between the effectiveness of particular learning mechanisms and the effectiveness of alternative methods of appropriation are interesting and internally consistent. In particular, when patent protection is effective, learning tends to take place primarily through licensing and patent disclosures. The effectiveness of patents is essen- tially uncorrelated with the effectiveness of interpersonal channels of learning and of independent R&D, and it is negatively correlated with the effectiveness of reverse engineering.
38. With three clusters the ratio of variance among clusters to variance within clusters was low, but attempts to find more than three clusters were thwarted by the persistent appearance of clusters containing only one or two lines of business.

808 Brookinigs Papers on Economic Activity, 3:1987
Table 7. Cluster Analysis of Channels of Learning
Cluster
Learning mechanism 1 2 3
New Processes Number of industries 68 43 19 Mean score
Licensing technology 5.0 4.3 2.5 Patent disclosures 4.0 4.0 3.2 Publications or technical meetings 3.8 4.6 3.9 Conversations with employees of
innovating firm 3.2 4.8 3.0 Hiring R&D employees from
innovating firm 3.7 5.1 2.4 Reverse engineering of product 3.8 4.6 4.0 Independent R&D 5.0 4.6 4.3
New products Number of industries 68 10 52 Mean score
Licensing technology 4.7 2.5 4.5 Patent disclosures 3.9 2.9 4.3 Publications or technical meetings 3.7 5.1 4.3 Conversations with employees
of innovating firm 3.0 4.6 4.5 Hiring R&D employees from
innovating firm 3.2 4.4 4.9 Reverse engineering of product 4.7 3.0 5.2 Independent R&D 5.1 3.7 5.0
Source: Authors' calculations.
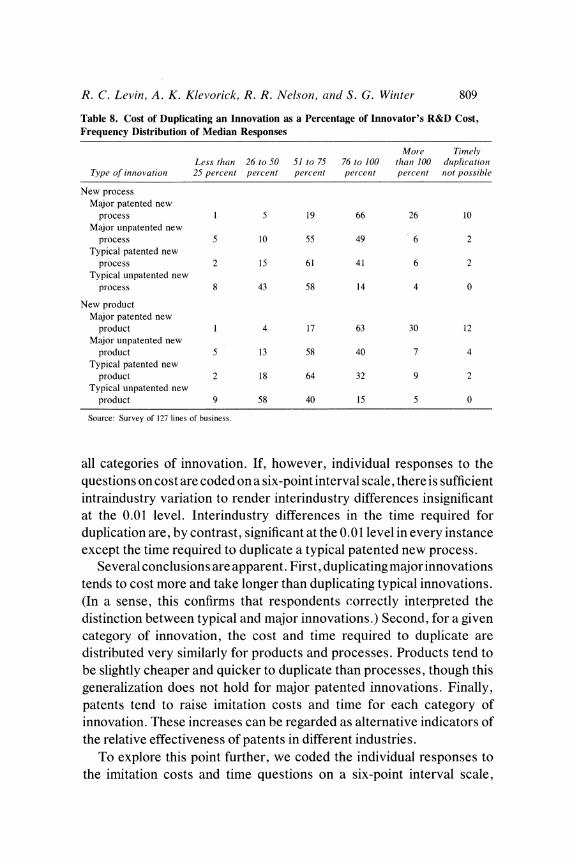
they were developed by a competitor. For each category, respondents were asked to identify (within a range) the cost of duplication as a percentage of the innovator's R&D cost. Intervals measured in months or years were used to classify the time required. In light of evidence that there is a time-cost trade-off in certain industries, we asked respondents to estimate the cost and time required "to have a significant impact on the market." 39
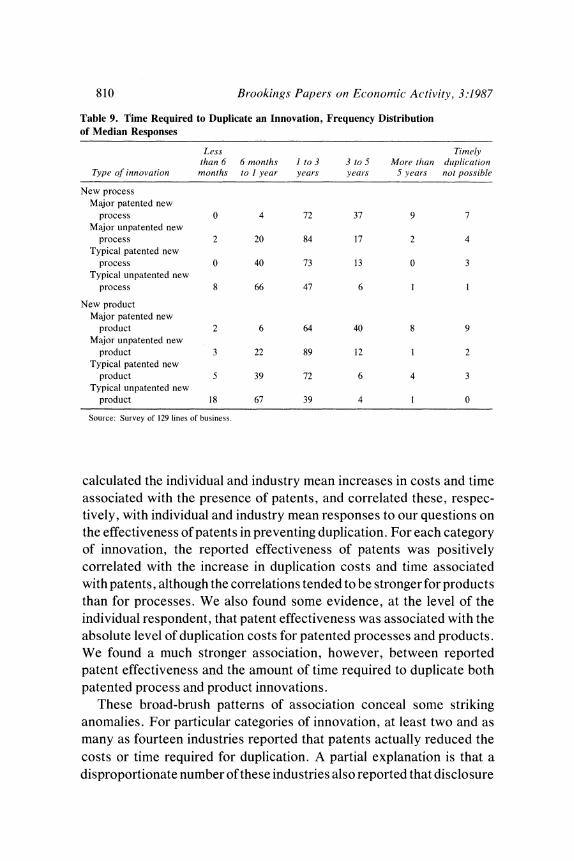
Tables 8 and 9 show frequency distributions of industry median responses.40 The dispersion of industry medians suggests substantial variations among industries in both the cost and time required to duplicate
39. See Edwin Mansfield, Industrial Research and Technological Innovation: An Econometric Analysis (Norton, 1968), for evidence on the time-cost trade-off.
40. Qualitatively identical results and interpretations are obtained from frequency distributions of individual responses and from the distribution of industry means.
R. C. Levin, A. K. Klevorick, R. R. Nelson, and S. G. Winter 809
Table 8. Cost of Duplicating an Innovation as a Percentage of Innovator's R&D Cost, Frequency Distribution of Median Responses
More Timely Less than 26 to 50 51 to 75 76 to 100 thani 100 dluplicationt
Type of inniovationt 25 percenit percent percenit percentt percent niot possible
New process Major patented new
process 1 5 19 66 26 10 Major unpatented new
process 5 10 55 49 6 2 Typical patented new
process 2 15 61 41 6 2 Typical unpatented new
process 8 43 58 14 4 0
New product Major patented new
product 1 4 17 63 30 12 Major unpatented new
product 5 13 58 40 7 4 Typical patented new
product 2 18 64 32 9 2 Typical unpatented new
product 9 58 40 15 5 0
Source: Survey of 127 lines of business.
all categories of innovation. If, however, individual responses to the questions on cost are coded on a six-point interval scale, there is sufficient intraindustry variation to render interindustry differences insignificant at the 0.01 level. Interindustry differences in the time required for duplication are, by contrast, significant at the 0.01 level in every instance except the time required to duplicate a typical patented new process.
Several conclusions are apparent. First, duplicating majorinnovations tends to cost more and take longer than duplicating typical innovations. (In a sense, this confirms that respondents correctly interpreted the distinction between typical and major innovations.) Second, for a given category of innovation, the cost and time required to duplicate are distributed very similarly for products and processes. Products tend to be slightly cheaper and quicker to duplicate than processes, though this generalization does not hold for major patented innovations. Finally, patents tend to raise imitation costs and time for each category of innovation. These increases can be regarded as alternative indicators of the relative effectiveness of patents in different industries.
To explore this point further, we coded the individual responses to the imitation costs and time questions on a six-point interval scale,
810 Brookings Papers on Economic Activity, 3:1987
Table 9. time Required to Duplicate an Innovation, Frequency Distribution of Median Responses
Less Timely than 6 6 months I to 3 3 to 5 More thzant dluplicationt
Type of innovation months to I year years years 5 years not possible
New process Major patented new
process 0 4 72 37 9 7 Major unpatented new
process 2 20 84 17 2 4 Typical patented new
process 0 40 73 13 0 3 Typical unpatented new
process 8 66 47 6 1 1
New product Major patented new
product 2 6 64 40 8 9 Major unpatented new
product 3 22 89 12 1 2 Typical patented new
product 5 39 72 6 4 3 Typical unpatented new
product 18 67 39 4 1 0
Source: Survey of 129 lines of business.
calculated the individual and industry mean increases in costs and time associated with the presence of patents, and correlated these, respec- tively, with individual and industry mean responses to our questions on the effectiveness of patents in preventing duplication. For each category of innovation, the reported effectiveness of patents was positively correlated with the increase in duplication costs and time associated with patents, although the correlations tended to be stronger for products than for processes. We also found some evidence, at the level of the individual respondent, that patent effectiveness was associated with the absolute level of duplication costs for patented processes and products. We found a much stronger association, however, between reported patent effectiveness and the amount of time required to duplicate both patented process and product innovations.
These broad-brush patterns of association conceal some striking anomalies. For particular categories of innovation, at least two and as many as fourteen industries reported that patents actually reduced the costs or time required for duplication. A partial explanation is that a disproportionate number of these industries also reported that disclosure

R. C. Levin, A. K. Klevor-ick, R. R. Nelso,i, anid S. G. Winter 811
of information through patent documents was a significant limitation on patent effectiveness.
A second anomaly is that, despite the positive correlation between patent effectiveness and the costs of imitating patented products, in several industries patents were relatively ineffective and duplication costs were nonetheless very high, whether or not the innovation was patented. Among these were guided missiles and several types of industrial machinery (food products machinery, electric welding appa- ratus, and speed changers, drives, and gears). In these instances the relative complexity of the products presumably makes reverse engi- neering inherently costly despite relatively weak patent protection.
It is interesting to compare our findings with those of Edwin Mansfield, Mark Schwartz, and Samuel Wagner, who studied the effects of patents on imitation costs in three industries.41 They concluded that patents generally raised imitation costs by 30 percentage points in drugs, 20 points in chemicals, and 7 points in electronics. To render our data comparable, we evaluated each respondent's answer at the mean of the relevant range and computed crude industry average imitation costs for each type of innovation.42 Our results were consistent with those of Mansfield, Schwartz, and Wagner. We found that patents raise imitation costs by 40 percentage points for both major and typical new drugs, by 30 points for major new chemical products, and by 25 points for typical chemical products. In electronics, our results differed somewhat for semiconductors, computers, and communications equipment, but the range was 7 to 15 percentage points for major products and 7 to 10 for typical products.43
41. Mansfield, Schwartz, and Wagner, "Imitation Costs and Patents." 42. The ranges are shown in the headings of table 8. The fifth and sixth column headings
are not readily quantified. To permit the comparison discussed in the text, we assigned these categories the values of 112.5 percent and 137.5 percent, respectively, thereby maintaining a constant spacing of 25 percentage points between each pair of categories.
43. Our results on the time required to duplicate a rival's new products or processes were also roughly consistent with recent findings of Edwin Mansfield. In all but one of the ten industries he surveyed, the median respondent indicated that six to twelve months usually elapsed before the nature and operation of a new product were known to a firm's rivals. Effective duplication, as we have defined it, should take as long or longer, and table 9 shows that it typically does. The median and modal industries require one to three years to duplicate a major innovation or a typical patented innovation. A typical unpatented innovation, however, is more often duplicated within six to twelve months. See "How Rapidly Does New Industrial Technology Leak Out?" Jolurnal of Industrial Economics, vol. 34 (December 1985), pp. 217-24.

812 Brookings Paper-s on Economic Activity, 3.1987
Although the costs and time required for duplication are related to the effectiveness of patents, they do not seem to be linked strongly to any other mechanism of appropriability. In particular, most imitation time and cost measures are uncorrelated with lead time and learning curve advantages, and where such correlations are statistically significant (at the level of the individual respondent), the correlation coefficient is invariably below .15. These results make sense. Lead time and learning advantages may permit appropriation of returns even when duplication is relatively quick and inexpensive. Effective patents, however, presum- ably require considerable time and expense to be invented around.
Finally, most of our respondents believed only a few firms were capable of duplicating new processes and products. As table 10 shows, the median and modal number of firms judged capable of duplicating a major process or product innovation was three to five. The median and modal number of firms regarded as capable of duplicating a typical process or product innovation was six to ten. The data revealed only the slightest tendency toward a smaller number of capable duplicators for processes than for products.
R&D and Innovation
In this section, we summarize how data derived from our survey have been employed to understand better the sources of interindustry differ- ences in R&D spending and the rate of technological advance. In the first such effort Richard Levin, Wesley Cohen, and David Mowery used several survey-based measures to explain variations in the published Federal Trade Commission data on industry-level R&D spending as a percentage of sales.44 They also sought to explain interindustry differ- ences in the rate at which new processes and new products were introduced during the 1970s, as reported by our survey respondents.45
44. The ratio of company-financed R&D to sales (R&D intensity) varies considerably among industries defined at the FTC line-of-business level of aggregation. In the 1976 data used by Levin, Cohen, and Mowery, R&D intensity ranged from 0.08 percent to 8.5 percent; both the mean and standard deviation were 1.7 percent. See "R&D Appropria- bility, Opportunity, and Market Structure."
45. Respondents were asked to identify, on a seven-point Likert scale ranging from "very slowly" to "very rapidly," the rate at which new processes and products had been

R. C. Levin, A. K. Klevorick, R. R. Nelson, and S. G. Winter 813
Table 10. Number of Firms Capable of Duplicating an Innovation, Frequency Distribution of Median Responses
More tliant Type of intntovation None I or 2 3 to 5 6 to 10 10
Major new or improved process 2 32 75 18 2 Typical new or improved process 1 7 41 58 22 Major new or improved product 2 25 73 25 4 Typical new or improved product 1 5 33 63 26
Source: Survey of 129 lines of business.
In a subsequent paper, Cohen, Levin, and Mowery studied the extent to which the same survey-based measures explained the powerful industry effects in the confidential FTC data on R&D intensity at the level of the business unit.46
The first paper focused on the Schumpeterian hypothesis that R&D intensity and innovation rates are significantly influenced by the level of industry concentration. One common rationale for this hypothesis is that industry concentration enhances the potential for appropriation of R&D returns. A different view is that, in the long run, concentration tends to be a consequence of industry evolution in a regime of abundant technological opportunity and a high degree of uncertainty associated with investment in R&D. Both perspectives suggest that there is no simple, causal relationship between concentration per se and R&D. Concentration may be statistically significant in simple regression spec- ifications because it reflects the influence of the unobserved appropria- bility and opportunity conditions that directly affect R&D spending and the rate of innovation.
In ordinary least squares and two-stage least squares specifications that included only the four-firm concentration ratio and its square as
introduced in their industries since 1970. Industry mean responses were highly correlated with total factor productivity growth, and the plausibility of the responses was reinforced by the identity of the highest and lowest industries in the sample. Excluding singletons, the lines of business reporting the slowest rates of product introduction were concrete, cement, boiler shops, milk, gypsum, primary copper, grain mill products, and sawmills. Those reporting the most rapid rates of product introduction were electrical equipment for internal combusion engines, radio and TV sets, computers, semiconductors, communi- cations equipment, photographic equipment and supplies, engineering and scientific instruments, and guided missiles. Levin, Cohen, and Mowery used as a dependent variable the average of each industry's reported rates of process and product introduction.
46. Cohen, Levin, and Mowery, "Firm Size and R&D Intensity."
814 Br-ookinigs Paper-s on Economic Activity, 3:1987
regressors, Levin, Cohen, and Mowery replicated with the industry- level FTC data the familiar inverted-U relationship between concentra- tion and R&D intensity, and they found a strong relationship of the same form between concentration and the rate of innovation.47 Adding two- digit industry fixed effects weakened slightly the effect of concentration on R&D, but the innovation-rate equation was unaffected.
The results changed dramatically with the addition of measures of appropriability and technological opportunity derived from the survey.48 Whether or not two-digit industry fixed effects were included, the coefficients on concentration and its square fell by an order of magnitude in the R&D equation, and the effect of concentration was no longer statistically significant at the .05 level in either the R&D intensity or the innovation-rate equation. The vector of survey-based opportunity vari- ables was significant at the .05 level in all specifications, and the opportunity and appropriability variables were jointly significant. The appropriability variables, however, were not individually significant in the R&D equation, although the rate of innovation was positively related to the effectiveness of an industry's most effective means of appro- priation.49
The paper by Cohen, Levin, and Mowery used the disaggregated FTC data at the level of the business unit to investigate the Schumpeterian hypothesis linking size and R&D intensity. The authors found that when either fixed industry effects (at the level of the line of business) or survey- based industry characteristics were taken into account, firm size had a very small and statistically insignificant effect on R&D intensity. The size of the business unit did have a significant effect on the probability
47. All coefficients in the R&D and innovation-rate equations were statistically significant at the .01 level.
48. To represent appropriability conditions, Levin, Cohen, and Mowery used two survey-based measures: the maximum of the mean scores an industry's respondents assigned to the effectiveness of the six methods of appropriation and the time required to duplicate effectively a patented major product innovation. To represent opportunity conditions, they used a measure of an industry's closeness to science as well as variables summarizing the importance of four other external sources of knowledge for an industry's technological advance: material suppliers, equipment suppliers, users of the industry's products, and government agencies and research labs.
49. It may seem anomalous that the effectiveness of appropriation was positively related to innovation but not to R&D, but the relationship was observed at the level of the industry. Better appropriability may discourage R&D directed toward imitation to an extent that more than compensates for its stimulus to innovative R&D. Such a reallocation of effort would be entirely consistent with the observed positive relationship between appropriability and the rate of innovation.
R. C. Levin, A. K. Klevorick, R. R. Nelson, acnd S. G. Winter 815
of engaging in R&D, but there was no perceptible tendency for R&D intensity to increase with size within the group of R&D performers. Size effects, however, explained only two-tenths of 1 percent of the variance in R&D intensity, while industry effects at the line-of-business level explained half this variance.
Cohen, Levin, and Mowery found that industry-level measures of appropriability, opportunity, and demand conditions were consistently significant in ordinary least squares, GLS, and Tobit regressions explain- ing business unit R&D intensity. Moreover, these industry characteris- tics explained approximately half the variance in R&D intensity ex- plained by fixed industry effects. When attention was focused on those lines for which there were at least three survey respondents, measured industry characteristics explained 56 percent of the variation in R&D intensity among industries. Within particular two-digit industries (chem- icals, machinery, and electrical equipment), measured characteristics explained 78 to 86 percent of the variance explained by fixed effects.
The results obtained in the two papers indicated that survey-based measures can contribute substantially to an explanation of interindustry differences in R&D intensity and innovative performance. Measures derived from the survey, despite their imperfections, have also been found useful for various other purposes.50
Remarks on Policy
Our findings suggested some general principles relevant to policies that affect the incentives to engage in innovative activity.
A first principle is that the patent system and related institutions to
50. Levin and Reiss have used survey-based measures of appropriability and oppor- tunity in a simultaneous equation model of R&D spending and market structure that builds on their work in "Tests of a Schumpeterian Model." Cohen and Levinthal use survey- based variables in their work on R&D as investment in absorptive capacity; see "Innova- tion and Learning." lain Cockburn and Zvi Griliches are studying the usefulness of our survey measures in estimating the value of patents from stock market data; see "Industry Effects and Appropriability Measures in the Stock Market's Valuation of R&D and Patents," American Economic Review (forthcoming, May 1988). Meryl Finkel, "Overseas Research and Development by U.S. Multinationals: Ownership Structure Decisions" (Ph.D. dissertation, Harvard University, 1986), explored the effect of our appropriability variables on the investment decisions of multinational corporations. Franco Malerba is using the survey data to explain interindustry differences in the extent and effectiveness of learning mechanisms.

816 Br-ookings Papers oni Economic Activity, 3:1987
protect intellectual property should be understood as social structures that improve the appropriability of returns from innovation. They are not the only nor necessarily the primary barriers that prevent general access to what would otherwise be pure public goods. Lead time accrues naturally to the innovator, even in the absence of any deliberate effort to enhance its protective effect. Secrecy, learning advantages, and sales and service efforts can provide additional protection, though they require the innovator's deliberate effort. The survey confirmed that these other means of appropriation are typically more important than the patent system. Hence in examining a proposed adjustment of the patent system or related institutions, it is important to recognize that the incremental effect of the policy change depends on the protection other mechanisms provide.
The survey results also confirmed substantial interindustry variation in the level of appropriability and in the mechanisms that provide it. From this follows our second major principle, which is that the incre- mental effects of policy changes should be assessed at the industry level. For example, in the aircraft industry, where other mechanisms provide considerable appropriability, lengthening the life of patents would tend to have little effect on incentives for innovation. In the drug industry the effect of a longer lifetime would matter more."5
Finally, improving the protection of intellectual property is not necessarily socially beneficial. Empirical work has so far indicated a positive cross-sectional relationship between strong appropriability, as measured by variables constructed from our survey, and innovative performance. But the social cost-benefit calculation is not straightfor- ward. Stronger appropriability will not yield more innovation in all contexts and, where it does, innovation may come at excessive cost.
To illustrate how our survey results and general perspective might inform policy discussion, consider the 1987 proposal (S. 438, H.R. 557) that patent license agreements and other contracts relating to the use of intellectual property "shall not be deemed illegal per se under any of the antitrust laws." One consequence would be to eliminate the per se illegality of tie-in arrangements (those in which purchase of one product,
51. For a calculation of the impact of the Drug Price Competition and Patent Term Restoration Act of 1984, see Henry Grabowski and John Vernon, "Longer Patents for Lower Imitation Barriers: The 1984 Drug Act, " Amer-ican Economic Review, vol. 76 (May 1986, Papers and Proceedings, 1985), pp. 195-98.
R. C. Levin, A. K. Klevorick, R. R. Nelson, and S. G. Winter 817
the "tying product, " is dependent on purchase of other products) where the tying product is covered by a patent or otherwise protected as intellectual property.52 Our findings have suggested some issues a court should consider in evaluating such a tying arrangement under the rule of reason.
When the rule of reason is applied to tying cases, a relevant consid- eration is the firm's power in the market for the tying good. Courts have often presumed that intellectual property protection is itself evidence for such power. To the other good reasons for rejecting such a presump- tion,53 we add that the mere existence of a patent or other legal protection says nothing about its efficacy in a competitive context. As the survey results showed, the effectiveness of protection varies widely among industries. Thus in deciding a case, a court should inquire into the actual competitive significance of intellectual property protection in the partic- ular market.
Suppose, for example, that a pharmaceutical company were to tie hospital sales of supplies or equipment to its sale of a patented drug. Since patent protection of drugs is generally strong and effective, and a drug is often uniquely suited for particular purposes, skepticism about the reasonableness of the tie-in would be in order. The arrangement could not plausibly be regarded as a straightforward means of appropri- ating returns to which the firm was entitled as owner of the patent. Given the typical effectiveness of drug patents, the price of the drug should suffice for that purpose. There might, of course, be benign explanations for the tie; for example, if the supplies or equipment were complementary to the use of the drug, the arrangement might be explicable as an attempt to control the quality of treatment. But if no such explanation were
52. We focus on this particular consequence of the proposed legislation and set aside two major considerations regarding its merits in its present form. First, without amendment the legislation is likely to undercut severely the per se treatment of price fixing. Second, it might be more appropriate to consider eliminating per se treatment of all tying arrangements rather than just those involving intellectual property. On this point, see the concurring opinion in Jefferson Parish v. Hyde, 466 U.S. 2 (1984).
53. See E. W. Kitch, "Patents: Monopolies or Property Rights," in John Palmer, ed., Research in Law and Economics: The Economics of Patents and Copyrights, vol. 8 (JAI Press, 1986), pp. 31-47; and the associated commentary of F. M. Scherer, p. 51. Digidyne Corp. v. Data General Corp., 743 F. 2d 1336 (9th Cir. 1984) is an example of an application of per se doctrine in a context where the intellectual property (software) does not convincingly convey market power.
818 Brookings Papers on Economic Activity, 3:1987
supported by the evidence, the tie would seem an unreasonable restraint of trade.
By contrast, consider a producer of a patented product in an industry where no mechanism of appropriability functions particularly well- plywood, for example, where patents, secrecy, lead time, and learning advantages are all rated no higher than four on a seven-point scale of effectiveness. In this instance the low level of appropriability in general and the ineffectiveness of patents in particular should weigh against any presumption that a patent confers market power. The patentee in such an industry should be entitled to some scope for ingenuity in constructing arrangements that maximize the return to the patent, provided that these arrangements are not open to antitrust objections on grounds indepen- dent of the role played by the patent.
The intellectual property provisions of the Omnibus Trade and Competitiveness Reform Act also serve to illustrate the relevance of the survey results. One provision requires the U.S. trade representative to identify countries that have been particularly insensitive, as a matter of law or de facto policy, to the need for protection of intellectual property and to initiate unfair trade practice (section 301) investigations against them.S4 This provision of the trade bill would complement the adminis- tration's diplomatic efforts to strengthen intellectual property rights throughout the world and particularly in countries that permit firms to copy patented or copyrighted products from the United States.
Since the impact of legal protection of intellectual property depends on the strength of other appropriability mechanisms and varies widely among industries, focused efforts to solve problems in specific markets would be more prudent than a broad attempt to upgrade protection. There is little point in expending diplomatic capital to compel foreign countries to pass or enforce laws that, in most industries, would have minimal impact on the competitive process. By contrast, in those specific industries such as pharmaceuticals-in which patent protection is effec- tive, other means of appropriation are poor substitutes, and foreign governments often restrict, officially or tacitly, the ability of U.S. firms to exploit patents-a more persuasive case could be made for the United States to pressure its trading partners to change their behavior.
54. The trade representative may at his discretion escape this requirement by finding that such an investigation would not be in the national interest.
R. C. Levin, A. K. Klevorick, R. R. Nelson, and S. G. Winter 819
Appendix: Details of Sample Construction
Our review of the FTC data indicated that several lines of business did not report any R&D activity, and several others were aggregated to prevent violating confidentiality rules. Anticipating difficulty in finding knowledgeable respondents in industries without formal R&D activity, and wishing to avoid industry categories that included technologically disparate products, we eliminated those lines of business from our sampling frame.
The industries eliminated on grounds of heterogeneity were either the FTC's aggregations of technologically disparate industries or those corresponding to SIC industries with four-digit codes ending with 9. Such industries are residual categories within the relevant three-digit groups; their titles usually contain the words "miscellaneous, not elsewhere classified."
Confidentiality requirements prohibited us from using the FTC data as a means of identifying the firms that conduct R&D in each line of business. Instead, we used the Business Week annual R&D survey to identify all publicly traded firms that reported R&D expenses in excess of either 1 percent of sales or $35 million. This constitutes a nearly comprehensive list of private firms performing significant R&D. There were 746 such firms in 1981, when our survey design efforts commenced.
We used the information in Dun and Bradstreet's Million Dollar Directory to assign each of the Business Week firms to its major lines of business. Dun and Bradstreet's does not provide a complete list of each firm's lines of business, but it indicates as many as six four-digit SICs for each firm, in rough order of sales. Since some firms operate in nonmanufacturing industries, in manufacturing industries absent from our sample, or in two or more industries that fall into only one FTC line of business, we had substantially fewer than 746 x 6 observations. Within our sample lines of business, we found a total of 1,928 units operated by 688 firms.
A major design problem was how to obtain responses for business units within the same firm. Of our 688 firms, 470 participated in more than one of our sample lines of business. We initially attempted to identify relevant respondents using Industrial Research Laboratories of

820 Brookings Papers on Economic Activity, 3:1987
the United States. But our pretest subjects told us that more than half the people in such a sample were inappropriate. Some had been assigned to the wrong line of business; others had been promoted or had left the relevant division or the firm.
We therefore adopted a two-stage approach in which each firm's senior R&D vice president or chief executive officer was asked to furnish the names of employees with the knowledge to complete the question- naire for specific lines of business. We sent first-round requests to 470 firms representing 1,710 business units. There was attrition of 332 business units from this sample for three reasons: the firm did not do R&D in the specified line of business, the industry definition did not fit any of its activities, or a respondent could not be located. From this adjusted sample frame of 1,378 business units in firms with multiple units, we received names of respondents for 716. We sent questionnaires to each of these potential respondents as well as to representatives of the 218 firms operating in only one line of business. At this stage, there was some further attrition in the sample. Ultimately, we received 650 completed questionnaires from an overall adjusted sample frame of 1,562-an overall response rate of 41.6 percent.
Comments and Discussion
Richard Gilbert: The authors' research program will have lasting value for people interested in R&D markets and markets for intellectual property. They are correct in focusing on appropriability as a key factor in the incentive to undertake R&D. And their findings are generally consistent with those of other studies, for example, those by Christopher T. Taylor and Z. A. Silberston and Edwin Mansfield, Mark Schwartz, and Samuel Wagner. ' While this consistency may take a bit of the drama out of what Levin and his colleagues have done, the convergence of knowledge on this subject gives us some reason to believe we might be getting to the truth.
One of the authors' main conclusions is that there are very large differences, both among industries and within them, in the effectiveness of various means of appropriating intellectual property and also in the cost of imitation. It is an important result, but one that may cause some consternation. A main function of microeconomic theory is to form testable generalizations about the way the world works. Some of the work implies-at least, in the market for R&D and intellectual property- that such generalizations are extremely risky. We might be inventing a new field of microeconomic analysis, or "picoeconomics." Picoeco- nomics would keep us busy for a long, long time. But if we go down that path, our models will soon become as complicated as the world we are trying to explain.
These particular authors do not seem to want to lead us toward
1. Christopher T. Taylor and Z. A. Silberston, The Economic Impact of the Patent System: A Study of the British Experience (Cambridge University Press, 1973); and Edwin Mansfield, Mark Schwartz, and Samuel Wagner, "Imitation Costs and Patents: An Empirical Study," Economic Journal, vol. 91 (December 1981), pp. 907-18.
821
822 Brookings Papers on Economic Activity, 3:1987
picoeconomics. It is apparent from their follow-up work that they intend to draw some general conclusions about how appropriability varies across industries. Clearly, we would like to know how market structure and capital intensity in different industries influence the degree of appropriation and affect incentives to innovate. But merely adding appropriation as another explanatory variable in these regressions does little good. We really want to know whether there are systematic relations between the degree of appropriation and other observable economic variables.
With regard to methodology, I suggest using a weighting scheme based on the amount of R&D a firm does and, perhaps, the number of patents it has produced. The purpose would be to weight responses according to the quality of the information. Some industries seem not to have performed any R&D for twenty years. Although it is important to know why these firms have not been active, their responses should be adjusted to reflect the information they possess. Also, I suggest that in their survey work the authors include a definition of R&D. That is not a trivial task because there is much variation in what is called research and development.
I would have liked the survey to address more directly some of the theoretical issues in the economics of R&D. Various models in the R&D literature have different implications for the simultaneous determination of R&D intensity and market structure. For example, models such as that of Partha Dasgupta and Joseph Stiglitz imply that the current rate of R&D spending should be indepenident of cumulative R&D expendi- tures by a firm or the rivals of the firm.2 This is a consequence of the constant-hazard rate model. Other researchers such as Drew Fudenberg and his colleagues imply that past R&D is crucial to current and future R&D expenditures.3 The dynamic implications of these models are very different. The preemption-type models also suggest that a history of successful R&D gives a firm a technological advantage that provides some protection from future R&D competition and tends to increase concentration in a market.
2. Partha Dasgupta and Joseph E. Stiglitz, "Uncertainty, Industrial Structure, and the Speed of R&D," Bell Journal of Economics, vol. 11 (Spring 1980), pp. 1-28.
3. Drew Fudenberg and others, "Preemption, Leapfrogging and Competition in Patent Races," European Economic Review, vol. 22 (June 1983), pp. 3-31.

R. C. Levin, A. K. Klevorick, R. R. Nelson, and S. G. Winter 823
I would be interested in knowing if the survey could have elicited some kind of response about the way R&D success alters the competitive environment of the firms and, conversely, how the competitive environ- ment influences R&D spending. The questions in which the investigators ask how many firms are viable competitors with a given firm and how many could replicate its R&D bear on this question. It is interesting that the number of serious rivals for each firm was small, somewhere between three and six.
There is an empirical problem with surveys of the relationship between competition and R&D. If R&D really does have an effect on entry and competition, then the sample is necessarily biased. There are potential competitors who were not represented in the sample because the firms failed. How one accounts for the failures and puts them back in the sample is a difficult empirical problem.
In terms of patent policy, the diversity and effectiveness of patent protection across industries raises an obvious and interesting question. How should patent policy deal with the large differences in the values of patents among various industries? The authors point to the example of the semiconductor industry and suggest that the industry need not be any worse off as a consequence of the limited patent protection it has received. But one might also question whether the performance of the pharmaceuticals industry might have been improved if patent protection had been circumscribed to some extent.
I have experimented with a very simple model of optimal patent life with limited appropriability. It is basically a Nordhaus-type model with entry and spillovers .4 It shows that the optimal patent life is not a function of the size of the innovation, so one does not have to worry that there are big innovations in some industries and small innovations in others. The optimal patent life does, however, depend on elasticities of R&D and its benefits and costs. It also depends on the degree of appropriability, and there is the intuitive answer that the optimal life is inversely related to the extent of private appropriation of the social value of the invention. This result suggests that we need either more protection in semiconduc- tors or less protection in the patent drug industry.
The authors' survey provides a basis for contrasting patents with
4. See William D. Nordhaus, Invention, Growth, and Welfiase:A Theor-etical Treatment of Technological Change (MIT Press, 1969).

824 Br-ookings Paper-s oni Economic Activity, 3:1987
other approaches to protect intellectual property. A patent is a peculiar policy instrument. It represents an unnatural barrier to market entry that is erected to facilitate private appropriation. The survey suggests that other factors may be more important as a means of appropriation, and that other unnatural barriers might be more effective in stimulating R&D. As an extreme example (which I am not proposing), a tax on capital could arguably make entry more difficult and therefore stimulate R&D. It would be useful to do a survey of the effectiveness of different laws governing rights for intellectual property in different countries in an industry such as pharmaceuticals, which is one of the few in which patents really do seem to matter.
The survey results suggest that patents are important as a barrier to entry in the semiconductor industry not because they protect an individ- ual innovation or invention but because they provide a hurdle for potential entrants, who have to acquire a package of marketable pro- cesses and products that they can cross-license to other firms. While this seems an inappropriate or at least unintended outcome of the patent grant, it might well be that by increasing ordinary barriers to entry in the semiconductor industry, the returns to research and development would be enhanced. This is another illustration of the Schumpeterian hypothesis and the tensions between strong enforcement of the antitrust laws and the desire to provide a stable platform for encouraging investment in R&D. If these observations with regard to the semiconductor industry generalize to other markets, they provide a starting point for further reexamination of the antitrust laws in the context of industrial R&D policy.
Thus this survey has raised some very interesting questions. Now we have to get on with their resolution. Thanks to this project, we have some of the data we need for the job.
Zvi Griliches: We should be grateful to Richard Levin and his associates for providing us with a new and detailed glimpse into a subject that is both very important and also lacking in good data. Far too little fresh economics data is collected, and we all have much to learn from the effort of this endeavor. That I am going to quarrel with some of the authors' assessments does not diminish in my eyes the basic value of this enterprise.
The authors have collected a large set of responses from many
R. C. Levin, A. K. Klevorick, R. R. Nelson, and S. G. Winter 825
individuals located in different industries. This multipurpose survey will have many uses as we learn more about the responses and how to interpret them. I will focus on how these answers can help us learn which industries find patents an effective mechanism for appropriating returns from innovative effort, which ones do not, and whether mechanisms are available instead of or in addition to patents.
"Conditions of appropriability" determine the returns from a given innovative effort and hence the incentive to engage in it. One would expect that in industries in which appropriability is easy, there would be more innovative effort, higher returns, and a faster rate of technological progress. Such conditions may not be a fixed, unchanging characteristic of an industry, however. As more inventive effort is pursued, projects may become less easily appropriable, information may be leaked, and conditions may actually equalize among industries. The problem here is the same as in most empirical research programs: What is exogeneous and what is endogenous?
There are two generic problems with using the responses from such a survey: Are the responses comparable among individuals and do they reflect real differences among industries? Given the use of a scale of one to seven, I remain unsure about whether one person's response of five is equivalent to another's of four or six. Most questions do not have an objective anchor and could, therefore, differ greatly in the meanings attached to them by different respondents. This may account for the large dispersion in responses to most questions even within the same industry. It also leads to the difficulty of deciding whether the responses reflect real differences across industries or just random fluctuations among individuals.
There is a surprising amount of variability within industries in re- sponses to the same question. Some questions, such as those on the effectiveness of patents, are reasonably objective and seem to have a variance among industries. Other questions, such as whether secrecy is effective, do not seem to be particularly industry-specific and do not discriminate well among industries. Questions about lead time, secrecy, sales effort, and service quality are really questions about different ways of succeeding, not about properties of an industry. It is well to have a long lead time or to achieve secrecy, but how is that to be accomplished? These are not characteristics over which either the firm or the policy- makers have clear control. Patents are at least a somewhat better defined

826 Brookings Papers on Economic Activity, 3:1987
Table 1. Analysis of Variance of Differences among Industries in Responses to Questions on the Effectiveness of Different Appropriability Mechanisms
Aggregated industiy Individual responsea responseb
Question Processes Products Pr ocesses Products
Patents to prevent duplication 1.9 2.8 3.4 5.5 Patents to secure royalties 1.6 1.4 2.4 2.3 Secrecy 1.2 1.2 1.3 1.3 Lead time 1.7 1.6 2.2 2.5 Quickly down the learning curve 1.0 1.0 .9 1.2 Superior sales or service 1.2 .9 .7 .9
Average of questions 1 and 2 2.1 4.8 Average of questions 3 through 6 1.1 1.6
Source: Authors' calculations. a. Covers 541 responses for 130 industries; approximate .05 significance level is 1.3. b. Covers 620 responses for 24 industries; approximate .05 significance level is 1.6.
instrument, and we have some ideas about how the patent system could be tinkered with.
Table 1 presents my analysis of variance results for some of the responses derived from the Yale survey. (I am grateful to Levin for providing me with the original survey data.) It shows that there is more variance among industries in the responses to questions on the effective- ness of patents, especially for products, and very little variance in the other questions on conditions for appropriability, especially for process innovations. Process innovations are clearly less industry-specific and so is the importance of superior sales and service efforts.
Another way of seeing this problem is to look at the authors' table 6, which shows that for many of the nonpatent mechanisms the cross- correlation among methods of appropriation is lower at the aggregated industry level than at the level of the individual response. If industrial classification mattered, one would expect higher correlations for the aggregated variables.' This point is illustrated by a very simple model. Assume that two questions effectively measure the same thing. Then a variance components model for responses to these questions would be
Yqiy = mi + a. + eq,
where mi is the "true" industry effect perceived by all individuals, aj is
1. Y. Grunfeld and Zvi Griliches, "Is Aggregation Necessarily Bad?" Review of Economics and Statistics, vol. 42 (February 1960), pp. 1-1 3.
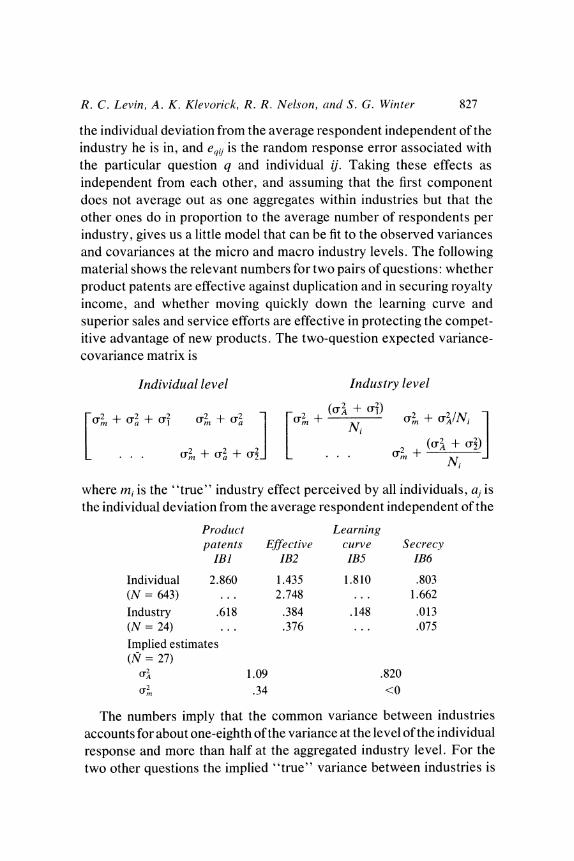
R. C. Levin, A. K. Klevorick, R. R. Nelson, and S. G. Winter 827
the individual deviation from the average respondent independent of the industry he is in, and eqij is the random response error associated with the particular question q and individual ij. Taking these effects as independent from each other, and assuming that the first component does not average out as one aggregates within industries but that the other ones do in proportion to the average number of respondents per industry, gives us a little model that can be fit to the observed variances and covariances at the micro and macro industry levels. The following material shows the relevant numbers for two pairs of questions: whether product patents are effective against duplication and in securing royalty income, and whether moving quickly down the learning curve and superior sales and service efforts are effective in protecting the compet- itive advantage of new products. The two-question expected variance- covariance matrix is
Individual level Industry level
a2 + (2 + (J2 a2 + (T2 (T2 + 1) 2 + (T2 /N
(U2 + (I2)
L ... (T2 + (T2 + (T2 J L2 (T + N A
where mi is the "true" industry effect perceived by all individuals, aj is the individual deviation from the average respondent independent of the
Product Learning patents Effective curve Secrecy
IB1 IB2 IB5 IB6
Individual 2.860 1.435 1.810 .803 (N = 643) ... 2.748 ... 1.662
Industry .618 .384 .148 .013 (N= 24) ... .376 ... .075
Implied estimates (N= 27)
(JIA 11.09 .820
921 .34 <0
The numbers imply that the common variance between industries accounts for about one-eighth of the variance at the level of the individual response and more than half at the aggregated industry level. For the two other questions the implied "true" variance between industries is

828 Brookings Papers on Economic Activity, 3:1987
negative. (For the patents question the correlation rises from .51 at the level of the individual respondent to .80 for averages at the NSF industry level, while for the two appropriability questions the numbers go from .46 to . 12, implying that such averaging attenuates ratherthan strengthens the relationship between the responses to such questions.) In short, while these questions might be interesting, they do not seem to be able to pick out significant differences among industries. Coming quickly down the learning curve and providing superior services are about equally effective.
Do the results of this survey help us explain other phenomena besides the relationship between answers to different sets of related questions within the survey? Looking at the responses to the questions evaluating patents and other appropriability mechanisms, the evidence appears to be mixed. Levin, Cohen, and Mowery did not find the appropriability variables significant in explaining differences among industries in R&D intensity, even in the absence of industry dummies.2 In a forthcoming paper lain Cockburn and Zvi Griliches use the Yale survey responses, aggregated to fifty-five industries at approximately a 3-digit SIC level, to see whether the stock market values the accumulated patents and the current R&D policy of a firm more or less in industries where the appropriability conditions are better in some sense.3 Table 2 reproduces typical results from this study. Patent effectiveness measures help in some sense. The equations seem to imply that both accumulated past patents and current R&D moves are valued more by the market when patent protection is effective. Other appropriability measures do not help. But neither set of measures does better than just an interaction with ten higher-level (2-digit) industries dummies. The greater detail available in the Yale survey appears to be counterbalanced by the (inevitably?) greater imprecision of these measures at the detailed industry level. So there is something there but not as much as might be wished. But we should be thankful for there is hope that a more detailed study of these and other responses in this survey will help us understand our world better. In particular, the information on the differential
2. Richard C. Levin, WesleyM. Cohen, and David C. Mowery, "R&D Appropriability, Opportunity, and Market Structure: New Evidence on Some Schumpeterian Hypotheses, " American Economic Review, vol. 75 (May 1985, Papers and Proceedings, 1984), p. 23.
3. lain Cockburn and Zvi Griliches, "Industry Effects and Appropriability Measures in the Stock Market's Valuation of R&D and Patents," working paper 2465 (National Bureau of Economic Research, December 1987).
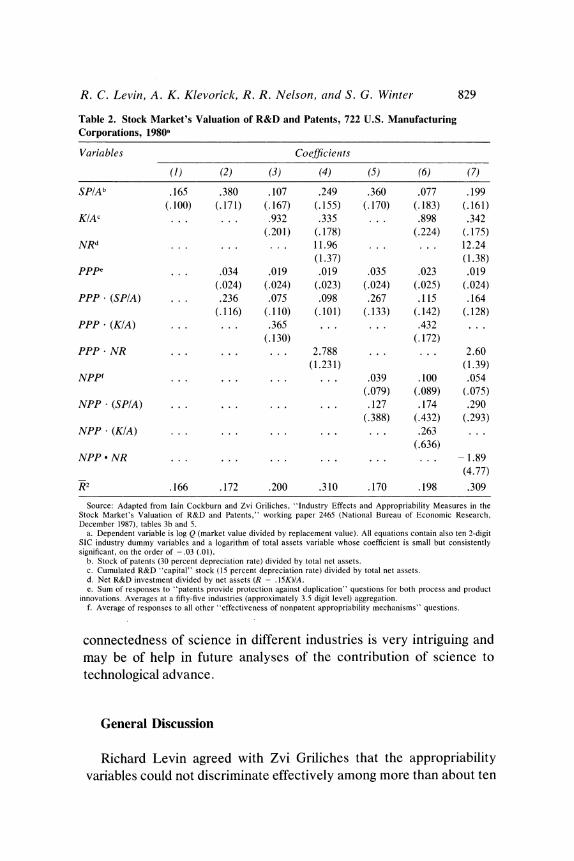
R. C. Levin, A. K. Klevorick, R. R. Nelson, and S. G. Winter 829
Table 2. Stock Market's Valuation of R&D and Patents, 722 U.S. Manufacturing Corporations, 1980a
Variables Coefficients
(1) (2) (3) (4) (5) (6) (7)
SP/Ab .165 .380 .107 .249 .360 .077 .199 (.100) (.171) (.167) (.155) (.170) (.183) (.161)
K/Ac . .. . .. .932 .335 . . . .898 .342 (.201) (.178) (.224) (.175)
NRd . . . . . . . . . 11.96 ... ... 12.24 (1.37) (1.38)
pPpe ... .034 .019 .019 .035 .023 .019 (.024) (.024) (.023) (.024) (.025) (.024)
PPP * (SP/A) ... .236 .075 .098 .267 .115 .164 (.116) (.110) (.101) (.133) (.142) (.128)
PPP- (KIA) ... ... .365 ... ... .432 ... (.130) (.172)
PPP- NR ... ... ... 2.788 ... ... 2.60 (1.231) (1.39)
NPPf ... ... ... ... .039 .100 .054 (.079) (.089) (.075)
NPP * (SP/A) ... ... ... ... .127 .174 .290 (.388) (.432) (.293)
NPP * (KIA) ... ... ... ... ... .263 ... (.636)
NPP * NR ... ... ... ... ... ... -1.89 (4.77)
R 2 .166 .172 .200 .310 .170 .198 .309
Source: Adapted from lain Cockburn and Zvi Griliches, "Industry Effects and Appropriability Measures in the Stock Market's Valuation of R&D and Patents," working paper 2465 (National Bureau of Economic Research, December 1987), tables 3b and 5.
a. Dependent variable is log Q (market value divided by replacement value). All equations contain also ten 2-digit SIC industry dummy variables and a logarithm of total assets variable whose coefficient is small but consistently significant, on the order of -.03 (.01).
b. Stock of patents (30 percent depreciation rate) divided by total net assets. c. Cumulated R&D "capital" stock (15 percent depreciation rate) divided by total net assets. d. Net R&D investment divided by net assets (R - .15K)/A. e. Sum of responses to "patents provide protection against duplication" questions for both process and product
innovations. Averages at a fifty-five industries (approximately 3.5 digit level) aggregation. f. Average of responses to all other "effectiveness of nonpatent appropriability mechanisms" questions.
connectedness of science in different industries is very intriguing and may be of help in future analyses of the contribution of science to technological advance.
General Discussion
Richard Levin agreed with Zvi Griliches that the appropriability variables could not discriminate effectively among more than about ten
830 Brookings Papers on Economic Activity, 3:1987
industry groupings, but he suggested that this may be a good thing, especially in light of Richard Gilbert's concern that studies such as this amount to "picoeconomics," from which no generalizations can be drawn. Sidney Winter noted that the results suggest there may be a relatively short list of variables to consider in an analysis of appropria- bility and incentives for R&D, and that ten industry groupings may provide all the information needed. In other dimensions, a finer division may be important. For example, Levin pointed out that, relative to questions on lead time, learning curves, and duplication costs, the questions on patent effectiveness discriminate better, as do the questions on learning and information spillover and those on duplication time.
Moreover, he added, a principal conclusion, that patents do not matter very much except in the chemical industries and in semiconductors, comes through regardless of problems with questions about other mechanisms of appropriation. In these two industries, the meaning and role of patent protection is different. Chemical products are easy to patent because the structure of the molecule of each product is unique, but patents are easy to invent around because it is often possible to create a discrete but structurally similar product with similar properties. With semiconductors, however, the innovation process is cumulative, with each invention built very distinctly on the previous one. The innovation provided by one firm makes the product invented by another firm more valuable. So the role patents play is to define the property rights (usually through the licensing process) so that the proceeds of this cumulative process can be shared and innovation can be encouraged.
Griliches also raised questions about whether the variables measured in this study are appropriately regarded as exogenous. Sales and service effort, for example, is a choice variable for the firms, and hence effectiveness should be endogenous. Likewise, lead time should be thought of as an outcome of the technology race, rather than an exogenous condition of it. Winter pointed out that even the distinction of product and process may be somewhat endogenous in the sense that firms take into consideration the importance of secrecy and the possibility of reverse engineering in designing their products. Firms often work to make their high-technology products inaccessible to reverse engineering, he noted, which tends to make these products more like processes from the standpoint of appropriability.
Several participants seemed concerned about problems of measure- ment and scaling biases in the data. Levin responded that various
R. C. Levin, A. K. Klevorick, R. R. Nelson, and S. G. Winter 831
techniques, such as weighting the responses by the inverse of the variances or standard deviations of the individual responses, were tried to correct for these biases. The principal findings were robust to efforts to stretch or squeeze the distribution of responses, he noted, but it was unclear what such "corrections" mean since no one knows what the true distribution should be.
Joseph Farrell took issue with Gilbert's argument that it is not particularly interesting or helpful to worry about the determinants of R&D in industries that do not perform R&D. In fact, he suggested, it would be very useful to know why some industries seem to do so little research while others do so much. Gilbert agreed, but argued that it was still important to assign some sort of weights to individual responses to particular questions, based on the respondent's experience with those issues. Martin Baily argued that weighting the responses by how much R&D the responding firms do would be inappropriate, however, since the amount of R&D is what the authors are trying to explain.
Richard Schmalensee suggested that some of the within-industry variance in the responses about sales and service and other mechanisms of appropriation may be due to the fact that the R&D executives who responded to the questionnaire are less knowledgeable about what hap- pens to the product after it leaves theirjurisdiction in the organization.
Responding to a question from Paul Joskow, Levin said if he were doing the survey over again, he would want to do more pretesting. For example, the authors might have picked up on the issue of intraindustry variance earlier if they had pretested multiple respondents from the same industry. Or they might have learned ways to restructure questions to discriminate more carefully between exogenous and endogenous factors.
Robert Litan noted that one implication of the study for trade policy is that issues of intellectual property rights should be dealt with industry by industry. This is, in effect, how section 301 of the Trade Act already works, he added. The section provides a procedure for pursuing complaints about unfair trade practices abroad, but these complaints must be brought product by product. Litan also suggested that mecha- nisms of appropriating returns from R&D might vary between large and small firms. Levin agreed, but noted that the sampling procedure surveyed only publicly held firms, so that start-up ventures were com- pletely excluded. Patents may be much more important for a start-up company because they provide something tangible to sell if the firm tries to sell out later.