approaching sustainability holistically: how investors and brands can make progress on key issues...
TRANSCRIPT

ApproachingSustainabilityHolistically:HowInvestorsandBrandsCanMakeProgressonKey
IssuesTogether
Paul Herman, HIP Investor Ratings + Portfolios @hipinvestorEvan Harvey, Nasdaq @NASDAQ
Jackson Robinson, Trillium Asset Management @TrilliumAM
Besuretoengageintheapp:sb16app.com
1)Checkintothesessionbyselectingsession fromtheprogramandselecting'checkin'
2)Poseand'up-vote' questions tobeposedduringQ&A:Insession description, select'submitaquestion'
2
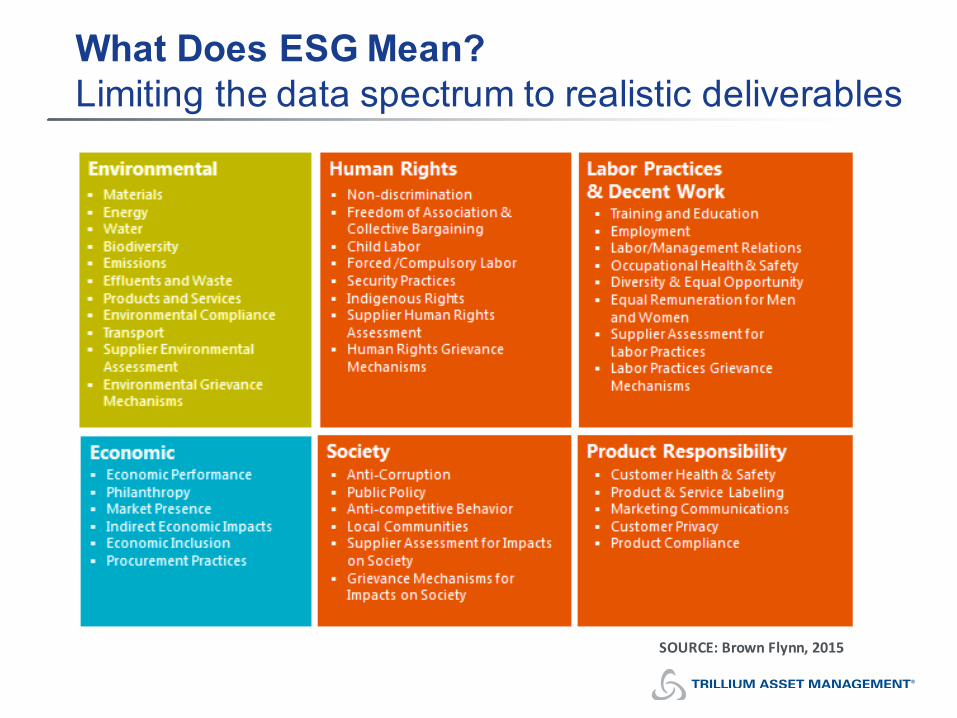
What Does ESG Mean?Limiting the data spectrum to realistic deliverables
SOURCE:BrownFlynn,2015
ESG Disclosure Guidance
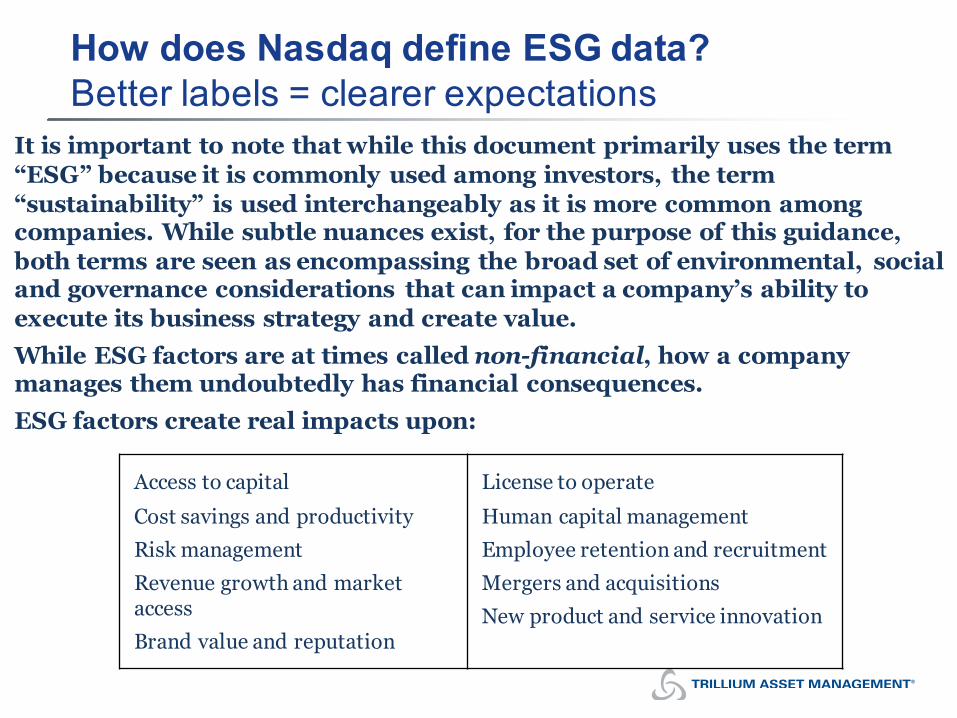
How does Nasdaq define ESG data?Better labels = clearer expectations
3
It is important to note that while this document primarily uses the term “ESG” because it is commonly used among investors, the term “sustainability” is used interchangeably as it is more common among companies. While subtle nuances exist, for the purpose of this guidance, both terms are seen as encompassing the broad set of environmental, social and governance considerations that can impact a company’s ability to execute its business strategy and create value.While ESG factors are at times called non-financial, how a company manages them undoubtedly has financial consequences. ESG factors create real impacts upon:
ESG Disclosure Guidance
Access to capitalCost savings and productivityRisk managementRevenue growth and market accessBrand value and reputation
License to operateHuman capital managementEmployee retention and recruitmentMergers and acquisitionsNew product and service innovation

Progress: Exchange-Driven ESG ReportingWhat is the current state?
4 ESG Disclosure Guidance
SSE Research, Sept 2016

A Mix of Rules, Guidance, and Commitments40 (of 82) exchanges are leading the way
5 ESG Disclosure Guidance
SSE Research, Sept 2016

Defining the LandscapeNasdaq recommends disclosure of these ESG metrics
6
This list includes 33 indicators across three broad categories. E, S, and G concerns are given equal weight. This list purposely includes all 7 of the “first generation” sustainability metrics valued by Corporate Knights and other ratings entities.ENVIRONMENTAL (E) SOCIAL(S) CORPORATEGOVERNANCE (G)
E1. Direct&IndirectGhG Emissions S1.CEOPayRatio G1. Board– SeparationofPowers
E2. Carbon Intensity S2. GenderPayRatio G2. Board– Transparent Practices
E3. Direct&IndirectEnergyConsumption S3.EmployeeTurnoverRatio G3.Incentivized Pay
E4. EnergyIntensity S4.GenderDiversity G4.FairLaborPractices
E5. PrimaryEnergySource S5.Temporary WorkerRatio G5.SupplierCodeofConduct
E6. RenewableEnergy Intensity S6.Non-DiscriminationPolicy G6.EthicsCodeofConduct
E7. WaterManagement S7.InjuryRate G7.Bribery/Anti-CorruptionCode
E8. WasteManagement S8.GlobalHealthPolicy G8.TaxTransparency
E9. EnvironmentalPolicy S9. Child&ForcedLaborPolicy G9.SustainabilityReport
E10. EnvironmentalImpacts S10.HumanRightsPolicy G10.OtherFrameworkDisclosures
S11.HumanRightsViolations G11.ExternalValidation,Assurance
S12.Board- Diversity
ESG Disclosure Guidance

Sidebar 1: UN Sustainable Development Goals
7 ESG Disclosure Guidance
Stock exchanges have been asked (by the UN and PRI) to create corporate reporting guidance and other tools that specifically address these five SDGs. Doing so would significantly increase global chances of achieving 2030 targets.

Sidebar 2: Global Regulatory Actions
8 ESG Disclosure Guidance
Virtually every market regulator is active in the sustainability debate. This has been driven by demand from investors, governments, NGOs, and citizens. Some regulators have already created ESG disclosure requirements; others are investigating the right way forward.
Note: SEC Reg S-K. Of the 227 original comment letters, 66% discussed sustainability disclosures. This is pretty remarkable, considering that only 3.2% of the Concept Release (11 of 341 pages) discussed sustainability disclosure. SASB

9
Sidebar 3: Compelling Statistics
• 95%oftheGlobal250issueseparateESGreports
• 90%ofhigh-performingESGcompanieshavelowercostsofcapital
• 88%ofhigh-performingESGcompanieshavebetteroperationalperformance
• 85%ofhigh-performingESGcompaniesoutperformaccountingstandards
• 80%ofhigh-performingESGcompanieshavebetterstockperformance
• 76%anticipateresourceshortageswillimpactcorebusinessobjectives
• 70%organizesustainabilityinstrategicoroperationalareas
• 68%haveincreasedtheircommitmenttosustainabilityinthepastyear
• 65%havededicatedsustainabilityteamsandbudgets
• 65%ofCFOshavesomedirectinvolvementinsustainability
• 53%oftheGlobal500experiencednegativewater-relatedbusinessimpacts
• 53%ofshareholderresolutionsarerelatedtoESGissues
• 40%ofequityanalystsleveragesustainabilityperformanceinvaluations
• 40%ofallcarboncutswouldultimatelygenerateaprofit
ESG Disclosure Guidance
10CONFIDENTIAL © 2006-2016 HIP Investor Inc.

11CONFIDENTIAL © 2006-2016 HIP Investor Inc.

THE 84% IS MEASURABLE
Smarter Beta: Value-Creation
Fundamentals
People As An Asset
Natural Resource Efficiency
Governance & Stakeholder Mgmt.
Transparency of Risks &
OpportunitiesCONFIDENTIAL © 2006-2016 HIP
Investor Inc. 12
Key Drivers of Value + Risk
+ Customer Satisfaction+ Employee Retention
+ Oil & water use+ Energy mix
+ Board & team diversity+ Supply chain mgmt.
- Legal exposure- Lobbying ratio
Knowable Yet Ignored
Not on Financial
Statements

EXTRACTIVEVS
INNOVATIVECONFIDENTIAL © 2006-2013 HIP
Investor Inc. 13

HEALTH
EQUALITY
WEALTH
EARTH
TRUST
P R O F I T
I M P A C T
INNOVATE
Products & Services
WITH NATURE
OperatingMetrics
BY PEOPLE
MgmtPractices
SUSTAINABLE PRODUCTS + PEOPLE+ PLANET
= HIGHER PROFIT POTENTIAL
14 CONFIDENTIAL © 2006-2016 HIP Investor Inc.

© 2006-2016 HIP Investor Inc. 15

16
NewMetric:YourGreenPRODUCTRevenue$$$
ConsumerDiscretionary
Automobiles &Components
Automobiles
AutomobileManufacturers Gasoline
Flex-fuel
Hybrid Electric
Electric
GICSIndustry
Segments
SustainableRevenueSegments

A ‘CERTIFIED GREAT WORKPLACES’ PORTFOLIO WOULD’VE HANDILY BEATEN
THE S&P 500
10-yr TSR Growth*330%292%119%102%
$-
$100,000
$200,000
$300,000
$400,000
$500,000
2005 2006 2007 2008 2009 2010 2011 2012 2013 2014 2015
GPTW MediumGPTW Large
S&P 400
Cumulative Total Shareholder Return (TSR) over 10 Years
* Total Shareholder Return includes reinvested dividends and price appreciation. From Dec 31st 2005 to Dec 31st 2015.Source: Great Place To Work ®; Thomson Reuters; HIP Investor analysis and portfolio modeling
No.Empl. FirmsGPTW Medium 100-999 22GPTW Large 1000+ 93
Category

18
GlobalLeadersLinkCEOPaytoPositivePLANETGoals
SustainabilityPayLink
Board/ExecutiveBoard CEO CFO COO Corporate
ExecutiveTeamExecutiveOfficer
GHGReduction,ExpandedUseof
NaturalRefigeration,etc.
Scope1&2GHGReduction
GHGReductionTargetperConsumer
Scope1,2,&3GHGReduction
Scope1,2,&3GHGReduction
EnergyEfficiency,EmissionstoAir(CO2,NOx,Sox),Emissionsto
Water
GHGReduction,EnergyEfficiency
GHGReduction,EnergyEfficiency
EmissionReduction,SalesofClimateProtection
Products

19
HIGHER SUSTAINABILITY àHIGHER PROFIT
HIP RATINGà RETURN ON EQUITY

20
Fast Facts: About Corporate Knights & HIP Investor(1) Use Strategic Scorecards
that Measure Sustainability….
(2)…that Link to Financial Value§ Business Case for Sustainability§ PRODUCTS: “Green Revenue”
§ PEOPLE: Calculate Human Capital Value§ PLANET: Issue “Green Bonds”
§ PROFIT: Quarterly “Sustain’y Earnings Call”
(3) Educate and Engage Employees Globally§ Impact ratings of 401(k) fund choices for employees
ATo-DoListforSustainableProfits
CONFIDENTIAL © 2006-2015 HIP Investor Inc. 21
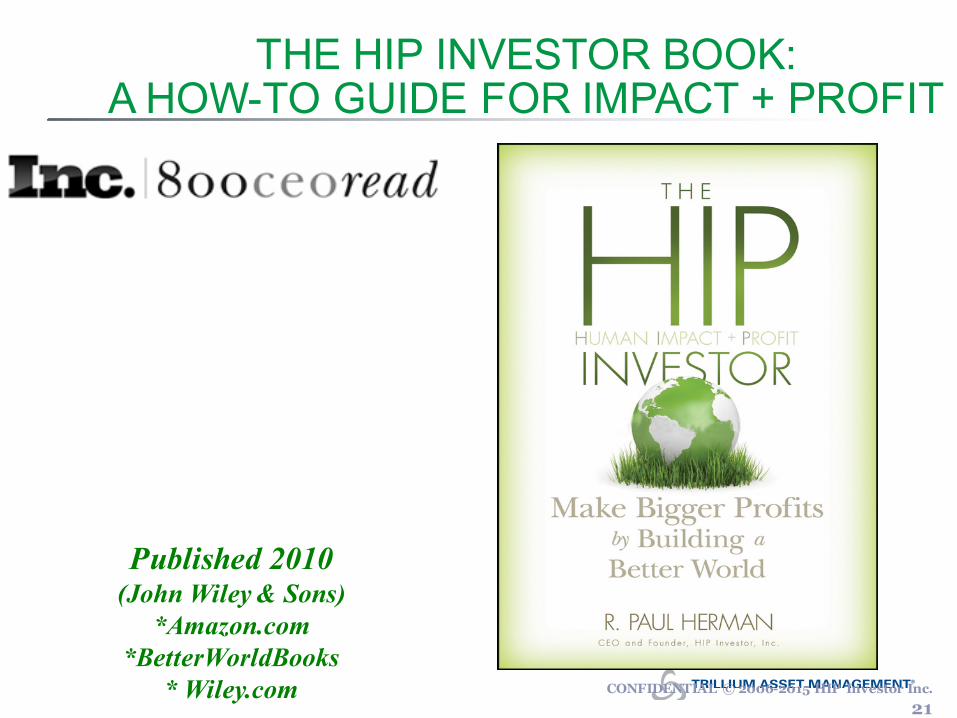
Published 2010(John Wiley & Sons)
*Amazon.com*BetterWorldBooks
* Wiley.com
Top 20 Business Book Bestseller List
26 University and MBA Curricula
75 Global Libraries on 5 Continents
THE HIP INVESTOR BOOK: A HOW-TO GUIDE FOR IMPACT + PROFIT

CONFIDENTIAL © 2006-2013 HIP
Investor Inc. 22

SHAREHOLDERS PROPOSALS TO ADDRESS
LONG-TERM FUTURE RISKS
CONFIDENTIAL © 2006-2013 HIP
Investor Inc. 23

CONFIDENTIAL © 2006-2013 HIP
Investor Inc. 24

CONFIDENTIAL © 2006-2013 HIP
Investor Inc. 25

HIP RATINGS = 100 POINT SCALE
IMPACT, FUTURE RISK + FUTURE RETURN
Worst: 0 HIP Rating Best: 100
Net Negative IMPACTHealth, Wealth, Earth, Equality, Trust Net Positive
More Volatile Future RISK More Resilient
Lesser Potential Future RETURNS Stronger Potential
HIP RATINGZero 100
26 © 2006-2016 HIP Investor Inc.

9 S
EC
TO
RS
SOVEREIGNSAGENCIES
TRANSPORTATION
WATER
ROADSSEAPORTSAIRPORTS
COMBINEDWASTEWATERWATER
AGENCIES ENTERPRISES
ENERGYHOUSING
EDUCATION
ENERGY
GOVERNMENT
HEALTHCAREHOUSING
K-12 DISTRICTS
UNIVERSITIESCOMMUNITY COLLEGES
COMBINEDHOSPITALSSTATESCOUNTIESCITIESUTILITIES
HOUSING AGENCIES
SOVEREIGNS COUNTRIES

IMPACTS VARY BY SECTOR
28CONFIDENTIAL © 2006-2015 HIP InvestorInc.
General Government Housing
Water Higher Education

8 of 10 TRUST points:
• Metering• Smart-metering
36 of 40 HEALTH points:
• Drinking water safety, including nitrate and fluoride
• Level of EPA violations
14 of 40 EARTH points:
• Treatment technique• Leakage• Per-person
water use• Use of recycled water
2 of 10 EQUALITY points:
• Gender diversity of the Board and executive management
60%
WATER UTILITIES:CITY OF SAN DIEGO WATER = 60%

30
K-12 Muni Bond Issuers: Advance High Rated K-12’s with Low Income to Continue their High Impacts

31
K-12 Muni Bond Issuers: Fund High Rated K-12’s with Low Income to Seek Better Impacts

32
CITIES: Household Income and Impact Ratings Correlate, but Impact Depends on Management

33
HOSPITAL SYSTEMS: Household Income and Impact Ratings Correlate, but Impact Depends on Mgmt.

HIP RATINGS FOR 195+ SOVEREIGN COUNTRIES
34
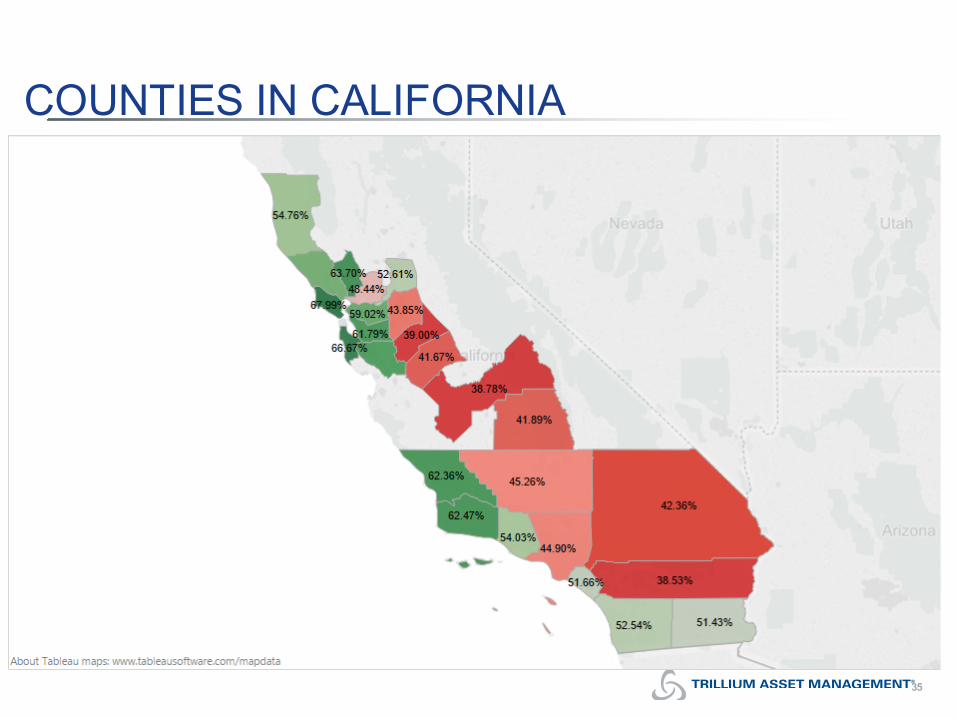
COUNTIES IN CALIFORNIA
35

CITY IMPACT CATEGORIESCity of Seattle = 70%
15 of 25 WEALTH points
•Median Income•Affordability of
Housing•Vacant Houses•Unemployment
•Poverty
21 of 25 HEALTH points:
• Obesity/Diabetes• Crime Rate
• Graduation Rate• Health Insurance
Coverage
75%15 of 25 EQUALITY
points:• Gender Diversity
& Ethnicity Reflected in
Business Ownership
WEALTH25%
EQUALITY25%EARTH
25%
HEALTH25%
70%
19 of 25 EARTH points:• Commuting
Method &Time Duration

HIP HEALTH PILLAR HIP WEALTH HIP EQUALITY
St County MetroAreaOverall
HIP Rating
Diabetes Rate
Adult Obesity
Rate
V iolent Crime Rate
Murder Rate
Grad Rate High
School
Grad Rate
College
% Living in Poverty
Occupied (not vacant)
Housing
Women Ow ned
Businesses
African American Population
African American Ow ned
BusinessesMD County of Anne Arundel Baltimore 58.3% 8% 28% 561 3.5 91% 37% 6% 93% 31% 15% 9%MD County of Baltimore Baltimore 54.1% 9% 27% 538 2.5 90% 35% 10% 92% 31% 26% 17%MD County of Carroll Baltimore 57.4% 8% 28% 207 2.4 91% 32% 6% 96% 27% 3% 2%MD County of How ard Baltimore 61.7% 8% 25% 577 - 95% 60% 4% 96% 30% 17% 15%MD County of Montgomery Baltimore 57.9% 8% 25% 193 2.1 92% 57% 7% 95% 26% 17% 3%MD County of Prince George Baltimore 53.5% 11% 34% 708 10.5 85% 30% 9% 92% 38% 63% 55%MD County of Frederick Baltimore 62.2% 8% 27% 312 1.3 92% 38% 6% 95% 31% 8% 6%MD County of Harford Baltimore 58.6% 9% 30% 347 2.5 92% 33% 7% 94% 34% 13% 9%MD City of Baltimore Baltimore 44.7% 12% 32% 1,405 34.9 80% 27% 24% 82% 37% 63% 35%US USA Average National * 8% 27% 405 4.8 86% 29% 16% 87% 29% 13% 7%
* The median of HIP Ratings calculated for Cities is 52.8%, for Counties is 53.5%, and for States is 49.5%; HIP Ratings cover more than 350 cities, counties and states.HIP Ratings are comprised of the Pillars of Health, Wealth, Earth, Equality and Trust. Selected pillars and metrics are show n above.Each column is color-coded: GREEN for leaders in ratios, YELLOW for average ratios, RED for laggards in ratios
The Wire: Impacts of City of Baltimorevs. surrounding Maryland Counties
37

SRI, ESG AND IMPACT APPLY ACROSS ALL ASSET CLASSES
Higher Impact Choices for Your Portfolio
Cash
Eco-focused banks
Economic empower-ment
credit unions
Fixed income
Social Impact Bonds
Muni BondsMicrofinance
Mezzanine Debt Funds
Income Generating
Appreciation
REITsPreferred equities
(dividends)
Equities
Impact-weighted
strategies
International and
Emerging
Global portfolios
Venture Capital and
Private Equity
Sustainability funds
Education and Human Capital
funds
Alternatives
Sustainable ForestryOrganic
AgricultureRenewable
Fuels
CONFIDENTIAL © 2006-2013 HIP Investor Inc. 38

HOW TO SERVE YOUR CLIENTS DESIRING SRI, ESG, IMPACT:
FIRST 3 STEPS
1. Investment Policy Statement: Include impact alongside risk, return, income & liquidity goals
2. Impact Allocation + Themes: Specify impact themes and goals for each asset class
3. New Investment Evaluation: Integrate impact into your planning and portfolio design
CONFIDENTIAL © 2006-2013 HIP Investor Inc. 39

1. INVESTMENT POLICY STATEMENT (CLIENT SAMPLE)
INCOME :: RETURNS :: RISK :: IMPACT :: BENCHMARKS
qGenerate after-tax INCOME of $__MM annually, through conservative to moderate investment choices (the majority from fixed income, corporate bonds, sovereign treasuries, real estate investment trusts [REITs], and dividends from preferred and common stocks).
qLower the RISK of principal loss through diversification across multiple asset types and seek protection against potential inflation (e.g. TIPS: Treasury Inflation Protected Securities; baskets of commodities, including gold and silver; real estate and REITs; investments that generate income within 18 months of committed capital; and consideration of hedging, including options).
qSeek higher positive-IMPACT investments across all asset types (e.g. cash, fixed income, public equity, private equity, real estate, etc.). Using the HIP (Human Impact + Profit) Scorecard evaluation tools, target a 100% invested for impact by 2020. Today, the portfolio’s weighted average HIP Score is __%.q All of our investments need to minimize the negative impact on all people and the planet.
qTarget competitive investment PERFORMANCE versus appropriate benchmarks, calculated on a pre-tax basis, relative to similar risk investments: q According to the Strategic Plan’s goals, the portfolio seeks a five-year average annual appreciation of 8%
nominal returns. Expected tax rate of 35%, we seek 5% after-tax annual returns.
qRationale for Impact Investor:q Liquidity, Doing well and doing good, Wealth preservation, Diversification, and Moderate capital
appreciation
CONFIDENTIAL © 2006-2013 HIP Investor Inc. 40

HIP RATINGS – OF A PORTFOLIO BY ASSET CLASSRISK, RETURN, IMPACT AND ALLOCATION
RELATIVE TO AN EFFICIENT FRONTIER
* Annualized Returns (time-weighted: TWR) over 3 years and no less than 19 months, for liquid securities as of 6/30/2013; for remainder of funds/holdings as of 3/31/2013 or 12/31/2012. Returns are Gross of Advisory and Management Fees.HIP REIT included inside Real Estate Fund assets. CONFIDENTIAL © 2006-2013 HIP Investor Inc.
RETURNS: Annualized Returns*
RISK: Standard Deviation of Returns*
ALLOCATION: size of bubbles is percent (%) Allocated to Asset Class
IMPACT: color of bubbles: Green = higher IMPACTYellow = medium IMPACTRed = lower IMPACT

CONTACT HIP
R.PaulHerman [email protected]
+1(415)902-7741
Twitter:@HIPinvestor
CONFIDENTIAL © 2006-2015 HIP Investor Inc. 42


APPROACHING SUSTAINABILITY HOLISTICALLY: HOW INVESTORS & BRANDS CAN MAKE PROGRESS ON KEY ISSUES TOGETHER
Jackson W. RobinsonVice Chair and Portfolio Manager
Trillium Asset Management

TRILLIUM OVERVIEW
• Boston based firm started in 1982
• Over $2 billion in assets under management plus $200 million in model-driven platform assets (9/30/16)
• Oldest investment advisor exclusively focused on sustainable and responsible investing (SRI)
• 55% Institutional/ 45% Individual • Employee owned, with broad distribution of shares
• 4 person dedicated shareholder advocacy team

SHAREHOLDER ADVOCACY EXAMPLES
IMPORTANTDISCLOSURE.TheviewsexpressedarethoseoftheauthorsandTrilliumAssetManagement,LLCasofthedatereferenced andaresubject tochangeatanytimebasedonmarketorother conditions. Theseviewsarenot intendedtobeaforecastoffutureeventsoraguaranteeoffutureresults.Theseviewsmaynotberelied uponasinvestmentadvice.Theinformation providedinthismaterialshouldnot beconsidered arecommendation tobuyorsellanyofthesecurities mentioned.Itshould notbeassumedthatinvestmentsinsuchsecurities havebeenorwill beprofitable. Totheextent specificsecurities arementioned, theyhavebeenselectedbytheauthorsonanobjective basistoillustrate viewsexpressedinthecommentaryanddonotrepresent allofthesecurities purchased, soldorrecommended foradvisoryclients.Theinformation contained hereinhasbeenprepared fromsourcesbelievedreliablebutisnotguaranteedbyusastoitstimelinessoraccuracy, andisnot acompletesummaryorstatement ofallavailabledata.Thispieceisforinformational purposesandshouldnotbeconstrued asaresearchreport.

2016 SHAREHOLDER RESOLUTIONS
*In addition to engaging with approved companies on our buy list , Trillium also conducts advocacy at selected companies that are
held as legacy positions in client portfolios. These are companies that may not meet our minimum social and environmental criteria,
but that we still seek to improve. See important disclosure page in appendix.