appraisal & valuation analysis - comal county, texas overview ..... 24 demographics..... 29...
TRANSCRIPT

HCP Realty Advisors Page 1
Appraisal & Valuation Analysis Summary Report Format
BBD/TCOR Office Building 396 North Seguin Avenue New Braunfels, TX 78130 RETECHS Job #: WF-SA-12-029631-01-1 HCP Project Number: VAS12205
Prepared By:
® As of September 13, 2012
Prepared For: Mr. Marc Brooks Wells Fargo Banks RETECHS 1000 Louisiana St, 4th Floor Houston, TX 77002
P R O P E R T Y S O L U T I O N S | A D V I S O R Y S E R V I C E S

HCP Realty Advisors Page 2
®
Christopher T. Harman, MAI, CCIM
Principal HCP Realty Advisors, Inc. 3811 Bee Cave Road Suite 215 Austin, Texas 78746 512.328.1515 Office 512.577.2665 Mobile [email protected]
September 13, 2012
Mr. Marc Brooks
Wells Fargo Banks RETECHS
1000 Louisiana St, 4th Floor
Houston, TX 77002
RE: Appraisal of an office property located at 396 North Seguin Avenue, New Braunfels, Comal
County, Texas 78130
Dear Mr. Brooks:
In fulfillment of our agreement as outlined in the Letter of Engagement, HCP Realty Advisors,
Inc. is pleased to transmit our appraisal developing an opinion of value in the above referenced
real property of the As Is Market Value of the Fee Simple estate as of September 5, 2012.We
have also provided an Insurable Value. The opinion of value reported below is qualified by
certain assumptions, limiting conditions, certifications, and definitions, which are set forth in the
report.
The appraisal will be used by the owner to establish market value for lending decisions. It may not be
distributed to or relied upon by other persons or entities without written permission of HCP Realty
Advisors, Inc. However, the owner may provide only complete, final copies of the appraisal report in
its entirety (but not component parts) to third parties who shall review such reports in connection with
loan underwriting or securitization efforts. The appraisers are not required to explain or testify as to
appraisal results other than to respond to the client for routine and customary questions.
Please note that our consent to allow an appraisal report prepared by HCP Realty Advisors, Inc., or
portions of such report, to become part of or be referenced in any public offering, the granting of such
consent will be at our sole discretion and, if given, will be on condition that we will be provided with an
Indemnification Agreement and/or Non-Reliance letter, in a form and content satisfactory to us, by a
party satisfactory to us. We do consent to your submission of the reports to rating agencies, loan
participants or your auditors in its entirety (but not component parts) without the need to provide us
with an Indemnification Agreement and/or Non-Reliance letter.
HCP Realty Advisors Page 3
Mr. Marc Brooks
Wells Fargo Bank RETECHS
September 13, 2012
The following appraisal sets forth the most pertinent data gathered, the techniques employed and
the reasoning leading to the opinion of value. The analysis, opinions and conclusions were
developed based on, and this report has been prepared in conformance with, our interpretation of
the guidelines and recommendations set forth in the Uniform Standards of Professional Appraisal
Practice (USPAP), the requirements of the Code of Professional Ethics and Standards of
Professional Appraisal Practice of the Appraisal Institute, The Financial Institutions Reform,
Recovery, and Enforcement Act of 1989 (FIRREA), Title XI Regulations and HCP Realty
Advisors, Inc.’s appraisal standards.
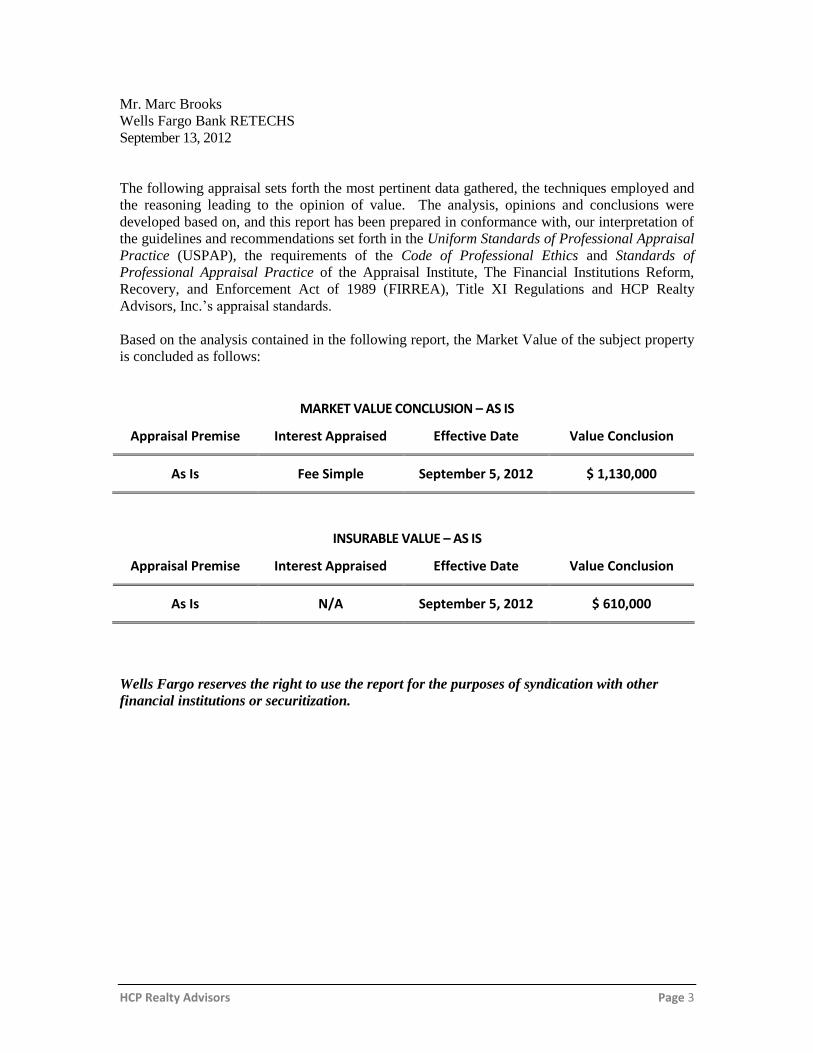
Based on the analysis contained in the following report, the Market Value of the subject property
is concluded as follows:
MARKET VALUE CONCLUSION – AS IS
Appraisal Premise Interest Appraised Effective Date Value Conclusion
As Is Fee Simple September 5, 2012 $ 1,130,000
INSURABLE VALUE – AS IS
Appraisal Premise Interest Appraised Effective Date Value Conclusion
As Is N/A September 5, 2012 $ 610,000
Wells Fargo reserves the right to use the report for the purposes of syndication with other
financial institutions or securitization.

HCP Realty Advisors Page 4
Mr. Marc Brooks
Wells Fargo Bank RETECHS
September 13, 2012
The analysis contained in this appraisal is based upon assumptions and estimates that are subject to
uncertainty and variation. These estimates are often based on data obtained in interviews with third
parties, and such data are not always completely reliable. In addition, we make assumptions as to
future behavior of consumers, and the general economy, which are highly uncertain. It is, however,
inevitable that some assumptions will not materialize and that unanticipated events may occur which
will cause actual achieved operating results to differ from the financial analyses contained in this report,
and these differences may be material. Therefore, while our analysis was conscientiously prepared on
the basis of our experience, and the data available, we make no warranty of any kind that the
conclusions presented will, in fact, be achieved. Additionally, we have not been engaged to evaluate
the effectiveness of management, and we are not responsible for future marketing efforts, and other
management actions upon which actual results may depend.
We believe, based on the assumptions employed the value conclusion represents a market price
achievable within 12 months. We take no responsibility for any events, conditions, or
circumstances affecting the market that exists subsequent to the effective date of this appraisal.
This letter is invalid as an opinion of value if detached from the report, which contains the text,
exhibits, and addenda.
It has been a pleasure to assist you in this assignment. If you have any questions concerning
the analysis or if HCP Realty Advisors, Inc. can be of further service, please contact us.
Christopher Harman, MAI, CCIM
Principal
Licensed in the State of Texas
License #TX-1325053-G
Kirk Garza
Senior Director
Licensed in the State of Texas
License #TX-1380039-G

HCP Realty Advisors Page 5
Table of Contents
Summary of Salient Facts .......................................................................................................................................... 7
Appraisal Specifics .................................................................................................................................................... 9
Purpose of the Appraisal ................................................................................................................................................... 9 Interest Appraised ............................................................................................................................................................ 9 Intended Use ..................................................................................................................................................................... 9 Intended User(s) ............................................................................................................................................................... 9 Client Identification .......................................................................................................................................................... 9 Market Value Definition(s) .............................................................................................................................................. 10 Current Ownership ......................................................................................................................................................... 11 Three -Year Sale History .................................................................................................................................................. 11 Property Overview .......................................................................................................................................................... 11
Scope of Work ........................................................................................................................................................ 12
Market Participant Interviews ........................................................................................................................................ 13 Compentency Statement ................................................................................................................................................ 13 Marketing Period ............................................................................................................................................................ 13 Exposure Time ................................................................................................................................................................ 13
Certification Statement ........................................................................................................................................... 14
Limiting Conditions and Assumptions ..................................................................................................................... 15
Regional Overview .................................................................................................................................................. 17
Real Estate Market Overview .................................................................................................................................. 20
Economic Overview ................................................................................................................................................ 24
Neighborhood Information ..................................................................................................................................... 28
Demographics ......................................................................................................................................................... 29
Subject Property Identification ............................................................................................................................... 31
Property Tax Summary ........................................................................................................................................... 34
Highest and Best Use Analysis ................................................................................................................................. 39
Valuation Procedures and Methodologies .............................................................................................................. 43
The Income Approach ............................................................................................................................................. 44
The Sales Comparison Approach ............................................................................................................................. 60
Reconciliation ......................................................................................................................................................... 74
ADDENDA ............................................................................................................................................................... 75

HCP Realty Advisors Page 6
BBD/TCOR Office Building
INSERT SUBJECT LOCATION MAP
HCP Realty Advisors Page 7
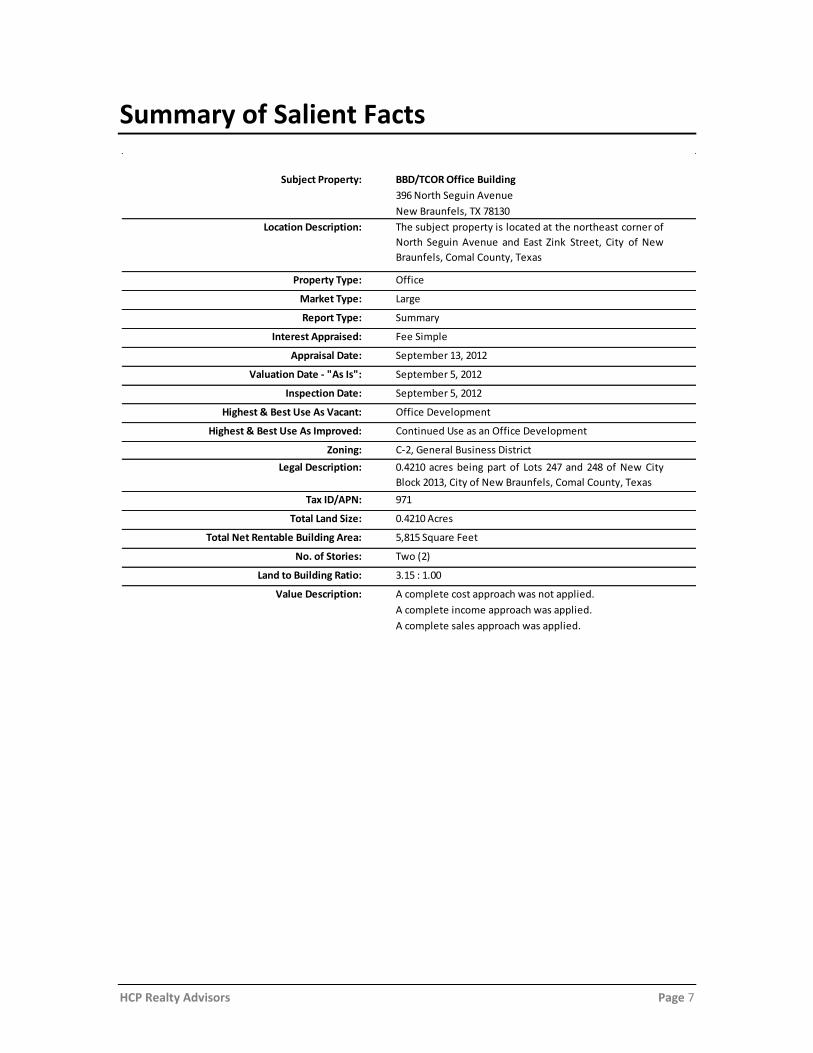
Summary of Salient Facts
A complete cost approach was not applied.
A complete income approach was applied.
A complete sales approach was applied.
Two (2)
3.15 : 1.00
Continued Use as an Office Development
C-2, General Business District
0.4210 acres being part of Lots 247 and 248 of New City
Block 2013, City of New Braunfels, Comal County, Texas
0.4210 Acres
971
Value Description:
396 North Seguin Avenue
BBD/TCOR Office Building
New Braunfels, TX 78130
The subject property is located at the northeast corner of
North Seguin Avenue and East Zink Street, City of New
Braunfels, Comal County, Texas
Office
Large
Summary
Fee Simple
September 13, 2012
September 5, 2012
September 5, 2012
Office Development
5,815 Square Feet
Total Land Size:
Subject Property:
Location Description:
Property Type:
Appraisal Date:
Market Type:
Report Type:
Interest Appraised:
Valuation Date - "As Is":
Inspection Date:
Highest & Best Use As Vacant:
Total Net Rentable Building Area:
No. of Stories:
Land to Building Ratio:
Highest & Best Use As Improved:
Zoning:
Legal Description:
Tax ID/APN:

HCP Realty Advisors Page 8
Summary of Salient Facts (Continued)
V A L U E S U M M A R Y
C O S T A P P R O A C H
N/A
I N C O M E A P P R O A C H
$ 1,130,000 – As Is
S A L E S C O M P A R I S O N A P P R O A C H
$ 1,130,000 – As Is
R E C O N C I L I A T I O N
Market Value:
$1,130,000 – As Is
Insurable Value:
$ 610,000 – As Is

HCP Realty Advisors Page 9
Appraisal Specifics
Purpose of the Appraisal The purpose of this appraisal is to determine the market value of the subject property.
Interest Appraised The property rights being appraised in this report consist of the fee simple estate for the subject.
Fee Simple Estate is defined by The Dictionary of Real Estate Appraisal, Fifth Edition, copyright
2010, page 78, by the Appraisal Institute as being:
"Absolute ownership unencumbered by any other interest or estate, subject only
to the limitations imposed by the governmental powers of taxation, eminent
domain, police power, and escheat.”
Intended Use The intended use of this appraisal is for mortgage lending decisions.
Wells Fargo reserves the right to use the report for the purposes of syndication with other
financial institutions or securitization.
Intended User(s) This appraisal is for the intended use of the Client only and any user deemed necessary by the
client.
Client Identification Our client and intended user for this assignment is Wells Fargo Bank (“Client”). The report is for
the exclusive use of our Client.

HCP Realty Advisors Page 10
Market Value Definition
“Market Value,” as used in this report, is defined as:
… the most probable price which a property should bring in a competitive and open market under
all conditions requisite to a fair sale, the buyer and seller each acting prudently and
knowledgeably, and assuming the price is not affected by undue stimulus. Implicit in this
definition is the consummation of a sale as of a specified date and the passing of title from seller
to buyer under conditions whereby:
Buyer and Seller are typically motivated;
Both parties are well informed or well advised, and acting in what they consider their best
interests;
A reasonable time is allowed for exposure in the open market;
Payment is made in terms of cash in U.S. dollars or in terms of financial arrangements
comparable thereto; and
The price represents the normal consideration for the property sold unaffected by special
or creative financing or sales concessions granted by anyone associated with the sale.
Source: “(12 C.F.R. Part 34.42(g); 55 Federal Register 34696, August 24, 1990, as amended at 57
Federal Register 12202, April 9, 1992; 59 Federal Register 29499, June 7, 1994); Appraisal Institute,
The Dictionary of Real Estate Appraisal, Fifth Edition, (Chicago, 2010) Page 123”
The appraisal considers the valuation of the subject property as of the effective date referenced
herein. In determining the valuation of the property, we will consider the market value under
conditions prevalent at that time. Establishing the effective date of the appraisal is standard
appraisal practice, and it is important to consider because value is subject to change over time.
Aside from possible physical changes to the property, the value of real estate is also subject to
changing economic conditions, under which value may remain static, increase, or decrease.
Additionally, changing policies of governing authorities may impede or encourage development
over time.
These limitations are implicit in the definition of “market value.” For further discussion on this
subject, refer to the section of this report entitled “Valuation Procedures and Methodology.” Note
that the valuation makes no reduction for commission on sale, unpaid taxes, or liens against the
property.

HCP Realty Advisors Page 11
Current Ownership
According to the Comal County Appraisal District, the property is under the ownership of BBD
Investments, LLC.
Three-Year Sale History
According to information provided to this office, the property was purchased in 2009 by BBD
Investments, LLC for $895,000 or $150.07 per square foot. The current owner then completed
approximately $272,000 in renovations by March 2010 to configure the space into an office
layout. Currently, the property is not listed for sale or under contract.
Property Overview
The subject property is a two (2) story office building located on 0.4210 acres of land. The
subject is currently 100% occupied by three (3) related party entities totaling 5,815 square feet.
Legacy Commercial Real Estate and TCOR Insurance Agency, LTD occupy the first floor and
Petram Measurements, LLC occupies the entire second floor.

HCP Realty Advisors Page 12
Scope of Work According to the Uniform Standards of Professional Appraisal Practice, it is the appraiser’s
responsibility to determine the appropriate scope of work. USPAP defines the scope of work as:
The amount and type of information researched and the analysis applied in an
assignment. Scope of work includes, but is not limited to, the following:
the degree to which the property is inspected or identified;
the extent of research into physical or economic factors that could affect
the property;
the extent of data research; and
the type and extent of analysis applied to arrive at opinions or
conclusions.
The following information defines the Scope of Work taken by the appraiser(s):
Report Type: Summary Report Format
Inspection: The inspection date was September 5, 2012
Market Analysis and Market Conditions: Stable
Highest and Best Use: As Vacant – Office Development
As Improved – Continued Use as an Office
Development
Cost Approach Analysis: A cost approach was not applied.
Income Approach Analysis: A complete income approach was applied.
Sales Comparison Approach Analysis: A complete sales approach was applied.
Notes: At the request of the Client, we have estimated the
“As Is” market value of the subject. We have also
provided an Insurable Value.

HCP Realty Advisors Page 13
Market Participant Interviews
At the request of our client, we interviewed several market participants regarding market
conditions and specifics that could affect the subject property. A list of these participants is
included below:
Representatives of Legacy Commercial Real Estate
Representatives of Sperry Van Ness
Representatives of the Planning & Zoning Department, City of New Braunfels
Representatives of the Comal County Appraisal District
Competency Statement
Prior to accepting this assignment, the appraisers concluded that they have the necessary
experience and/or knowledge to competently complete the appraisal, and during the preparation
of the appraisal, the appraisers have not discovered any areas in the assignment requiring
appraisal expertise which they were lacking.
Marketing Period
Given the existing market information from an historic perspective, as well as the anticipated
supply line of directly competing product, the appraisers believe that the subject property, at the
concluded value of this appraisal, would require a marketing time of approximately 12 months.
Exposure Time
The appraisers have examined the average length of time for similar properties were exposed to
the market, and have determined that the average time period in which these properties were
exposed to the market was 12 months. The As Is market value as referenced herein is based on a
market exposure time of 12 months.
Based on the indicated exposure periods, the value conclusion represents a market price
achievable within 12 months exposure prior to the effective date.

HCP Realty Advisors Page 14
Certification Statement We certify that, to the best of our knowledge and belief:
The statements of fact contained in this report are true and correct.
The reported analyses, opinions and conclusions are limited only by the reported assumptions and limiting conditions, and are our personal, unbiased professional analyses, opinions and conclusions.
We have no present or contemplated future interest in the property that is the subject of this report, and we have no personal interest or bias with respect to the parties involved.
I have no bias with respect to the property that is the subject of this report or to the parties involved with this assignment.
Our engagement in this assignment was not contingent upon developing or reporting predetermined results.
Our compensation is not contingent upon the reporting of a predetermined value or direction in value that favors the cause
of the client, the amount of the value estimate, the attainment of a stipulated result, or the occurrence of a subsequent event.
The reported analyses, opinions and conclusions were developed, and this report has been prepared, in conformity with the requirements of the Code of Professional Ethics & Standards of Professional Practice of the Appraisal Institute.
The reported analyses, opinions and conclusions were developed, and this report has been prepared, in conformity with the
requirements of the Uniform Standards of Professional Appraisal Practice.
The use of this report is subject to the requirements of the Appraisal Institute related to review by its duly authorized
representatives.
Kirk Garza made an inspection of the property that is the subject of this report. Christopher T. Harman did not inspect the subject property.
Kirk Garza provided significant professional assistance in the development of the conclusions contained in this report.
We have not performed a previous appraisal involving the subject property within the three years prior to this assignment.
The Appraiser has established sufficient competence to appraise this property through education and experience, in addition to the internal resources of the appraisal firm.
As of the date of this report, Christopher T. Harman, MAI, CCIM and Kirk Garza are Texas State Certified General Real Estate Appraisers under the authority of the Texas Appraiser Licensing and Certification Board and are authorized to
appraise the subject property by the State of Texas Real Estate Appraiser Board.
As of the date of this report, Christopher T. Harman, MAI, CCIM, has completed the requirements of the continuing education program of the Appraisal Institute.
As of the date of this report, Kirk Garza has completed the Standards and Ethics Education Requirement of the Appraisal Institute for Associate Members.
Our value conclusion and other opinions expressed herein are not based on a requested minimum value, a specific value or approval of a loan.
Christopher Harman, MAI, CCIM
Licensed in the State of Texas
License #TX-1325053-G
Kirk Garza
Licensed in the State of Texas
License #TX-1380039-G

HCP Realty Advisors Page 15
Limiting Conditions and Assumptions
Acceptance of and/or use of this report constitutes acceptance of the following limiting conditions and
assumptions; these can only be modified by written documents executed by both parties.
This appraisal is to be used only for the purpose stated herein. While distribution of this appraisal in its
entirety is at the discretion of the client, individual sections shall not be distributed; this report is intended
to be used in whole and not in part.
No part of this appraisal, its value estimates or the identity of the firm or the appraiser(s) may be
communicated to the public through advertising, public relations, media sales, or other media.
All files, work papers and documents developed in connection with this assignment are the property of
HCP Realty Advisors, Inc. Information, estimates and opinions are verified where possible, but cannot be
guaranteed. Plans provided are intended to assist the client in visualizing the property; no other use of
these plans is intended or permitted.
No hidden or unapparent conditions of the property, subsoil or structure, which would make the property
more or less valuable, were discovered by the appraiser(s) or made known to the appraiser(s). No
responsibility is assumed for such conditions or engineering necessary to discover them. Unless otherwise
stated, this appraisal assumes there is no existence of hazardous materials or conditions, in any form, on or
near the subject property.
Unless stated herein, the property is assumed to be outside of areas where flood hazard insurance is
mandatory. Maps used by public and private agencies to determine these areas are limited with respect to
accuracy. Due diligence has been exercised in interpreting these maps, but no responsibility is assumed for
misinterpretation.
Good title, free of liens, encumbrances and special assessments is assumed. No responsibility is assumed
for matters of a legal nature.
Necessary licenses, permits, consents, legislative or administrative authority from any local, state or
Federal government or private entity are assumed to be in place or reasonably obtainable.
It is assumed there are no zoning violations, encroachments, easements or other restrictions which would
affect the subject property, unless otherwise stated.
The appraiser(s) are not required to give testimony in Court in connection with this limited appraisal. If the
appraisers are subpoenaed pursuant to a court order, the client agrees to pay the appraiser(s) our regular per
diem rate plus expenses.
Appraisals are based on the data available at the time the assignment is completed.
Amendments/modifications to appraisals based on new information made available after the appraisal was
completed will be made, as soon as reasonably possible, for an additional fee.
If any such allocation is made, the allocation of value between land and building for the subject property
applies only under the present program of utilization, and does not apply under any other premise. The
allocations of value for land and building must not be used in conjunction with any other appraisal and are
invalid if so used.

HCP Realty Advisors Page 16
Limiting Conditions and Assumptions (continued)
We do not authorize the out-of-context quoting from or partial reprinting of this appraisal report. Further,
neither all nor any part of this appraisal report shall be disseminated to the general public by the use of
media for public communication without the prior written consent of the appraisers signing this appraisal
report, particularly as to valuation conclusions, the identity of the appraisers or firm with which they are
connected, or any reference to the Appraisal Institute.
There are no hidden or unapparent conditions or defects of the subject property, which would render it
more or less valuable than the value opinion rendered, which is based on the property’s readily apparent
condition. Hidden defects are not the responsibility of the appraisers.
Unless otherwise stated in this report, the existence of hazardous material, which may or may not be
present on the property, was not observed by the appraisers. However, the appraisers are not trained or
qualified to detect hazardous waste and/or toxic materials. Any comment by the appraisers suggesting the
possibility of the presence of such substances should not be taken as confirmation of the presence of
hazardous waste and/or toxic materials. The presence, if any, of potentially hazardous materials may affect
the value of the property. The value estimate is predicated on the assumption there is no such material on
or in the subject property which would cause a loss in value. No responsibility is assumed for any such
conditions, or for any expertise or engineering knowledge required to discover them. The appraisers’
descriptions and resulting comments are the result of the routine observations made during the appraisal
process. The appraisers recommend that the client should retain the services of a qualified independent
engineer or contractor to determine the existence and extent of any hazardous materials, if the existence of
hazardous waste substances on the property is a concern.
The writers of the report will not be required to give testimony or appear in court because of having made
this appraisal, with reference to the property in question, unless arrangements have been previously made.
Full compliance with all applicable federal, state, and local environmental regulations and laws, and with
all applicable zoning and use regulations, is assumed unless non-compliance or non-conformity is stated,
defined, and considered in the appraisal report. Responsible ownership and competent management exists
for the property.
The owner of the subject property may be subject to additional financial expenditures in accordance with
the Americans With Disabilities Act (ADA), a federal law codified at 42 USC Section 12101 ET SEQ.
While numerous requirements of the ADA could affect the subject property, Title III of ADA requires
owners and tenants of public accommodations to remove barriers to access by disabled persons and provide
auxiliary aids and services for hearing, vision or speech impaired persons by January 26, 1992. The
regulations under Title III of ADA are codified at 28 CFR Part 36. The appraisers, however, are not
qualified experts as to the subject’s compliance or noncompliance under ADA. In recognition of this laws
recent enactment, some of the requirements may be subject to interpretation by the legal system. The
client/reader is strongly urged to retain the services of a qualified independent expert and, if necessary,
receive legal assistance in understanding its contents and in determining the subject’s compliance, if this is
a cause of concern. The value estimates reported herein are subject to revision should it be determined
additional expenditures are required for conformance to ADA.
This is a Summary Appraisal Report which is intended to comply with the reporting requirements set forth
under Standard Rule 2-2(b) of the Uniform Standards of Professional Appraisal Practice for a Summary
Appraisal Report. As such, it includes full discussions of the data, reasoning, and analyses that were used
in the appraisal process to develop the appraisers’ opinion of value. Supporting documentation concerning
data, reasoning, and analyses is retained in the appraisers’ file.
The information contained in this report is specific to the needs of the client and for the intended use stated
in this report. The appraisers are not responsible for unauthorized use of this report.

HCP Realty Advisors Page 17
San Antonio Regional Overview
San Antonio is the county seat of Bexar County located in the U.S. state of Texas within the
South Texas region. San Antonio, recently the eighth largest city in the United States, has an
MSA population of over 2 million persons. San Antonio has grown 20% since 2000. A factor
contributing to this growth is the lowest cost of living of any major city in Texas. Companies like
the National Security Agency have chosen to relocate their regional headquarters in San Antonio
because of the low business costs and large labor force, as well as state and local incentives. The
manufacturing industry is expected to grow because of Toyota's decision to open its Tundra
manufacturing plant on the south side of the city. The North American Free Trade Agreement
(NAFTA) has positively impacted San Antonio by further strengthening the international trade
activities already in place. The city has a strong military presence and it is home to Fort Sam
Houston, Lackland Air Force Base, Randolph Air Force Base and Brooks City Base.
San Antonio is recognized as one of the country's top tourist destinations, hosting more than 26
million visitors each year. Attractions include The Alamo, Riverwalk, Hemis Fair Plaza,
SeaWorld of Texas, Six Flags Fiesta Texas, and a newly-expanded 1.3 million square foot
Convention Center. The month of April marks the celebration of Fiesta. The 10-day, city-wide,
fun-filled, family-oriented celebration is the biggest party and greatest community benefit in the
State of Texas. Because of San Antonio’s rich and diverse background, demonstrated by events
such as Fiesta, it is said to be the cultural capital of Texas.
San Antonio is a high growth Sunbelt city and is in the 3rd fastest growing metropolitan statistical
area in Texas. San Antonio recently passed San Diego to become the 7th largest city in the United
States, and the second largest city in Texas. The ongoing population growth has sustained healthy
real estate markets in the city for years. It is a center of transportation, particularly that which is
oriented to cross-border trade, as the international land port of Laredo, the next city south of San
Antonio along Interstate 35, is the busiest land port in the world.
DEMOGRAPHICS
The San Antonio–New Braunfels MSA has a population of over 2 million based on the 2010 U.S.
Census estimate, making it the 25th-largest metropolitan area in the U.S and third in Texas. The
metropolitan area is bordered to the northeast by Austin–Round Rock–San Marcos, and the two
metropolitan areas together combine to form a region of almost 3.7 million people. The
population of the San Antonio-New Braunfels MSA is expected to grow an additional 8.47% by
2016.
EDUCATION
Education is a vibrant part of the local economy. San Antonio has a highly educated work force
for a city of its size, as over 23.9% of workers have completed at least some college, 17.5% have
a Bachelor’s degree or higher.
The San Antonio area offers 31 institutes of higher learning, including the main campus of The
University of Texas at San Antonio, San Antonio Community College, St. Mary’s University,
Trinity University, Incarnate Word University, and Our Lady of the Lake University

HCP Realty Advisors Page 18
The University of Texas at San Antonio (“UTSA”), is a state university located in San Antonio,
Texas, United States. With an enrollment of over 30,000 students, it is the second-largest of nine
separate components in the University of Texas System, the eighth-largest in Texas, and the
largest public university in Texas outside of the six flagship universities from the various
systems.
The university serves the San Antonio metropolitan area and the South Texas region through
three campuses: Main Campus, Downtown Campus in Downtown San Antonio, and Hemisfair
Park Campus. The main campus is situated on 600 acres, at the intersection of Interstate 10 and
Loop 1604 near the northern edge of San Antonio, Texas in Bexar County. The University of
Texas at San Antonio offers 135 undergraduate and graduate programs in different fields
including 65 bachelors, 49 masters, and 21 doctoral degree programs. In addition to the
educational advantages UTSA offers, the school had a $1.2 billion economic impact on San
Antonio in 2008. As of 2008 the school directly employs 5,628 people. Proposition 4 was passed
by Texas voters in November 2009. This piece of legislation named 7 emerging research
universities in Texas that could compete for additional state funds in an effort to increase the
number of tier 1 institutions in Texas. Factors such as research expenditure, graduate degrees
awarded, and scholarly productivity all play a part in which schools receive the most funding.
The school spent $56.8 million for research expenditures in 2011. This represents a five-year
increase of 75.8%.
San Antonio Community College (“SAC”), is a community college that is a part of the Alamo
Community College District. It is located on San Pedro Avenue, across from San Pedro Park,
near downtown San Antonio. SAC is the oldest public two-year college in Texas. The college has
an average semester enrollment of 22,028 credit students and an average annual enrollment of
16,000 other-than-credit students. San Antonio College is the largest single-campus community
college in Texas and one of the largest in the United States.
Saint Mary’s, Founded in 1852, St. Mary’s is the oldest Catholic university in Texas and the
southwest. With a diverse student population of nearly 4,000, St. Mary’s is home to five schools:
Humanities and Social Sciences; Science, Engineering and Technology; Bill Greehey School of
Business; Graduate; and Law.
The North East Independent School District (NEISD) is a school district located in Bexar
County, Texas. North East ISD serves the north central and northeast areas of Bexar County,
covering approximately 144 square miles. North East ISD serves the cities of San Antonio, Castle
Hills, Hill Country Village, Hollywood Park, Windcrest, and portions of Balcones Heights and
Terrell Hills EMPLOYMENT
Over the next 10 years, San Antonio is expected to experience a 3.4% growth in employment
each year. The area’s unemployment rate was at only 7.3% in 2011, rising slightly from the
preceding year, but still increasing less than most other metro areas of the country. The following
chart reflects employment growth by industry in San Antonio compared to the State of Texas.
The table below indicates employment statistics for Texas Metropolitan Statistical Areas,
highlighting data for San Antonio and the state of Texas.

HCP Realty Advisors Page 19
The following tables include both the Top Twenty Employers in San Antonio.
ECONOMY Twenty-six million tourists visit the city and its attractions every year, contributing substantially
to the city's economy. The San Antonio Convention Center alone hosts more than 300 events
each year with over 750,000 convention delegates from around the world.
San Antonio's corporate profile includes Valero Energy Corp, USAA, Tesoro Petroleum Corp,
Southwest Research Institute, H-E-B, Clear Channel Communications, Rackspace Managed
Hosting, and NuStar Energy, LP, and, Toyota Motor Corporation. Located northwest of the city is
the South Texas Medical Center, the largest medical research and care provider in South Texas,
which is a conglomerate of numerous major hospitals, clinics, and research and higher
educational institutions. The center is responsible for a $12 Billion biomedical industry. It
employs some 27,000 persons with a combined total budget of $2.8 Billion.
SUMMARY
With the positive economic impact of new development from companies like Toyota, and
government programs, such as Bridge to 550, and continued job growth, San Antonio is poised
for continued growth in the coming years. Forbes notes that San Antonio is expected to see a 2%
job growth by 2012, leading the way along with Austin, Houston, and Dallas compared to several
other US metropolitan areas projected to experience only a 0.2% growth. According to My San
Antonio the city’s economy, even though slowing down, is expected to outperform the country
and even the state over the next several years. Finally, San Antonio was ranked first by the
Milken Institute on its list of Best Performing Cities in 2011. While current economic conditions
are certainly having an impact on the overall real estate markets, the long term outlook for San
Antonio is positive.
Employer
Lackland Airforce base
Fort Sam Houston - U.S. Army
USAA
H-E-B
Northside I.S.D.
Randolph Air Force Base
North East I.S. D.
City of San Antonio
San Antonio I.S.D.
Methodist Healthcare System Health Care Services 7,500
37,097
32,000
14,832
14,588
13,300
11,068
10,522
9,145
7,581
Grocery Chain
School District
Military
School District
City Government
School District
Top Ten Employers - San Antonio
Category Employees
Military
Military
Insurance

HCP Realty Advisors Page 20
Real Estate Market Overview OFFICE MARKET
According to the CoStar Office Market Report,
Second Quarter 2012, The San Antonio Office
market ended the second quarter 2012 with a vacancy rate of 10.6%. The vacancy rate was down
over the previous quarter, with net absorption totaling positive 244,739 square feet in the second
quarter. Vacant sublease space increased in the quarter, ending the quarter at 193,897 square feet.
Rental rates ended the second quarter at $19.29, an increase over the previous quarter. A total of
12 buildings delivered to the market in the quarter totaling 198,391 square feet, with 976,835
square feet still under construction at the end of the quarter.
Absorption
Net absorption for the overall San Antonio office market was positive 244,739 square feet in the
second quarter 2012. That compares to positive 468,477 square feet in the first quarter 2012,
positive 103,847 square feet in the fourth quarter 2011, and positive 163,441 square feet in the
third quarter 2011.
Tenants moving out of large blocks of space in 2012 include: US Dept of Justice moving out of
165,194 square feet at The Pyramid Building; Valero Energy Corporation moving out of 36,666
square feet at one Valero Way; and Afni, Inc. moving out of 31,632 square feet at 151
Technology Center - Building B.
Tenants moving into large blocks of space in 2012 include: Argo Group US, Inc. moving into
77,414 square feet at IBC Centre - Building I; Southwest Airlines moving into 60,000 square feet
at 11711 IH 35 N; and Tesoro Corporation moving into 57,442 square feet at Ridgewood Park -
Building I
The Class-A office market recorded net absorption of positive 93,096 square feet in the second
quarter 2012, compared to positive 388,941 square feet in the first quarter 2012, negative
(34,209) in the fourth quarter 2011, and negative (16,895) in the third quarter 2011.
The Class-B office market recorded net absorption of positive 91,896 square feet in the second
quarter 2012, compared to positive 49,118 square feet in the first quarter 2012, positive 217,540
in the fourth quarter 2011, and positive 200,779 in the third quarter 2011.
The Class-C office market recorded net absorption of positive 59,747 square feet in the second
quarter 2012 compared to positive 30,418 square feet in the first quarter 2012, negative (79,484)
in the fourth quarter 2011, and negative (20,443) in the third quarter 2011.
Net absorption for San Antonio’s central business district was positive 42,876 square feet in the
second quarter 2012. That compares to positive 6,549 square feet in the first quarter 2012,
positive 71,418 in the fourth quarter 2011, and positive 43,933 in the third quarter 2011.
Net absorption for the suburban markets was positive 201,863 square feet in the second quarter
2012. That compares to positive 461,928 square feet in first quarter 2012, positive 32,429 in the
fourth quarter 2011, and positive 119,508 in the third quarter 2011.

HCP Realty Advisors Page 21
Vacancy
The office vacancy rate in the San Antonio market area decreased to 10.6% at the end of the
second quarter 2012. The vacancy rate was 10.7% at the end of the first quarter 2012, 11.0% at
the end of the fourth quarter 2011, and 10.9% at the end of the third quarter 2011.
Class-A projects reported a vacancy rate of 16.0% at the end of the second quarter 2012, 16.4% at
the end of the first quarter 2012, 18.1% at the end of the fourth quarter 2011, and 17.8% at the
end of the third quarter 2011.
Class-B projects reported a vacancy rate of 10.3% at the end of the second quarter 2012, 10.3% at
the end of the first quarter 2012, 10.2% at the end of the fourth quarter 2011, and 10.5% at the
end of the third quarter 2011.
Class-C projects reported a vacancy rate of 7.1% at the end of the second quarter 2012, 7.5% at
the end of first quarter 2012, 7.7% at the end of the fourth quarter 2011, and 7.2% at the end of
the third quarter 2011.
The overall vacancy rate in San Antonio’s central business district at the end of the second
quarter 2012 decreased to 13.9%. The vacancy rate was 14.4% at the end of the first quarter 2012,
14.5% at the end of the fourth quarter 2011, and 15.1% at the end of the third quarter 2011.The
vacancy rate in the suburban markets changed to 10.1% in the second quarter 2012.
The vacancy rate was 10.1% at the end of the first quarter 2012, 10.4% at the end of the fourth
quarter 2011, and 10.3% at the end of the third quarter 2011.
Largest Lease Signings
The largest lease signings occurring in 2012 included: the 60,000-square-foot lease signed by
Southwest Airlines at 11711 IH 35 N in the Northeast market; the 57,442-square-foot deal signed
by Tesoro Corporation at Ridgewood Park - Building I in the North Central market; and the
39,962-square-foot lease signed by Centene at The Forum Office Complex-Phase II in the
Northwest market.

HCP Realty Advisors Page 22
Sublease Vacancy
The amount of vacant sublease space in the San Antonio market increased to 193,897 square feet
by the end of the second quarter 2012, from 190,465 square feet at the end of the first quarter
2012. There was 199,756 square feet vacant at the end of the fourth quarter 2011 and 217,123
square feet at the end of the third quarter 2011.
San Antonio’s Class-A projects reported vacant sublease space of 37,870 square feet at the end of
second quarter 2012, down from the 42,025 square feet reported at the end of the first quarter
2012. There were 92,224 square feet of sublease space vacant at the end of the fourth quarter
2011, and 91,736 square feet at the end of the third quarter 2011.
Class-B projects reported vacant sublease space of 141,775 square feet at the end of the second
quarter 2012, up from the 134,188 square feet reported at the end of the first quarter 2012. At the
end of the fourth quarter 2011 there were 86,940 square feet, and at the end of the third quarter
2011 there were 94,988 square feet vacant.
Class-C projects reported no vacant sublease space from the first quarter 2012 to the second
quarter 2012. Sublease vacancy went from 14,252 square feet to 14,252 square feet during that
time. There was 20,592 square feet at the end of the fourth quarter 2011, and 30,399 square feet
at the end of the third quarter 2011.
Sublease vacancy in San Antonio’s central business district stood at 4,420 square feet at the end
of the second quarter 2012. It was 9,221 square feet at the end of the first quarter 2012, 10,140
square feet at the end of the fourth quarter 2011, and 9,221 square feet at the end of the third
quarter 2011.
Sublease vacancy in the suburban markets ended the second quarter 2012 at 189,477 square feet.
At the end of the first quarter 2012 sublease vacancy was 181,244 square feet, was 189,616
square feet at the end of the fourth quarter 2011, and was 207,902 square feet at the end of the
third quarter 2011.
Rental Rates
The average quoted asking rental rate for available office space, all classes, was $19.29 per
square foot per year at the end of the second quarter 2012 in the San Antonio market area. This
represented a 0.3% increase in quoted rental rates from the end of the first quarter 2012, when
rents were reported at $19.23 per square foot.
The average quoted rate within the Class-A sector was $22.73 at the end of the second quarter
2012, while Class-B rates stood at $18.66, and Class-C rates at $15.22. At the end of the first
quarter 2012, Class-A rates were $23.02 per square foot, Class-B rates were $18.56, and Class-C
rates were $15.30.
The average quoted asking rental rate in San Antonio’s CBD was $18.67 at the end of the second
quarter 2012, and $19.38 in the suburban markets. In the first quarter 2012, quoted rates were
$18.60 in the CBD and $19.33 in the suburbs.

HCP Realty Advisors Page 23
Deliveries and Construction
During the second quarter 2012, 12 buildings totaling 198,391 square feet were completed in the
San Antonio market area. This compares to 15 buildings totaling 299,791 square feet that were
completed in the first quarter 2012, eight buildings totaling 138,937 square feet completed in the
fourth quarter 2011, and 44,240 square feet in seven buildings completed in the third quarter
2011.
There were 976,835 square feet of office space under construction at the end of the second
quarter 2012.
Some of the notable 2012 deliveries include: One Randolph Brooks Parkway, a 120,000-square-
foot facility that delivered in first quarter 2012 and is now 100% occupied, and Broadway Bank
New Administration Building, an 80,000-square-foot building that delivered in first quarter 2012
and is now 100% occupied.
The largest projects underway at the end of second quarter 2012 were NuStar Energy Corporate
Campus, a 300,000-square-foot building with 100% of its space pre-leased, and Nationwide
Westover Hills Center, a 300,000-square-foot facility that is 100% pre-leased.
Inventory
Total office inventory in the San Antonio market area amounted to 67,371,220 square feet in
3,323 buildings as of the end of the second quarter 2012. The Class-A office sector consisted of
11,573,209 square feet in 79 projects. There were 1,355 Class-B buildings totaling 40,211,212
square feet, and the Class-C sector consisted of 15,586,799 square feet in 1,889 buildings. Within
the Office market there were 111 owner-occupied buildings accounting for 5,030,313 square feet
of office space.
Submarket Overview
As noted in this report the subject property is located in the Comal County submarket within the
San Antonio MSA. Currently vacancy rates within this submarket average 5.40% with rents
averaging $15.67 per square foot/year. Additionally, there was one (1) new office building
delivered in the 2Q12 and there is one (1) office building currently under construction that totals
4,000 square feet.

HCP Realty Advisors Page 24
ECONOMIC OVERVIEW
NATIONAL EMPLOYMENT
According to the U.S. Bureau of Labor Statistics, nonfarm payroll employment rose by 163,000
in July, and the unemployment rate was essentially unchanged at 8.3 percent. Employment rates
increased in professional and business services and other major industries such as retail trade,
health care, transportation and warehousing changed little over the month.
Source: Bureau of Labor Statistics (BLS)
ECONOMIC OUTLOOK
According to the Goldman Sachs Outlook for the US Economy 2012 Report, fiscal policy was a
boost in 2009, roughly neutral in 2010, and in 2011, roughly a 1 percentage point drag. In 2012,
the impact depends on upcoming policy decisions. At best from a short-term perspective, if the
Obama administration’s package passed, which seems quite unlikely, fiscal drag would be
neutralized; at worst, if all temporary stimulus expires, a fiscal drag of more than 1 1/2 percentage
points of growth in early 2012 is likely. The more likely, middle ground outcome: the
administration and Congress agree on tax-related proposals and probably extend the one-year
payroll tax cut for one more year. There will be a bigger problem in 2013 with the expiration of
the Bush tax cuts, as well as any fiscal stimulus measures.
In addition to the belt tightening in the domestic US, the turmoil in Europe continues to threaten
stability, particularly within the banking sector. While a number of measures of financial stress
have been elevated in past weeks, there has not been a dramatic impact on real economic data in
the US. In spite of this, America remains concerned that tighter credit conditions could slow
growth over the next few quarters. While recession is not forecasted, the combination of slightly
tighter fiscal policy and potential financial shock from the crisis could result in weaker growth in
the near term.

HCP Realty Advisors Page 25
INFLATION OUTLOOK
Inflation is unlikely to be a significant problem. It has risen significantly by some measures in the
last year, but that trend is unlikely to continue.
The US experienced exceptionally low inflation in 2010, but over the last six months, the nation
witnessed a rate of inflation well above 2%. There are three components of core inflation that
have disproportionally caused the rate to be higher than the Federal Reserve Bank’s long-term
target:
1. Rent: In spite of ample existing home supply, many potential buyers are having trouble
obtaining mortgages, and with some homeowners in foreclosure, both populations are being
pushed into the rental market. This is a genuine cause for concern going forward.
2. Vehicles: Prices have moved higher due to supply chain disruptions from the earthquake in
Japan earlier this year. The tragic events that followed reduced supply and increased pricing
power for manufacturers, but dynamic will gradually be unwound over coming months as
production increases.
3. Apparel prices: A temporary surge in commodity prices and higher wages in Asia where the
majority of clothing is manufactured has led to higher prices, which is expected to ease
somewhat in the coming months.
CONCLUSIONS
- Household finances are gradually getting healthier. Household debt burdens have continued
to improve, with the share of income spent on debt service declining. Percent of disposable
income allocated to debt service has declined (Source: Federal Reserve Board, Department of
Commerce).
- Cyclical sectors have bottomed. While depressed and unlikely to fall much further, these
sectors are more likely to experience growth instead of further decline. Homebuilding in
particular hasn’t kept pace with demographic demands, which position the sector to grow
steadily over time.
- Potential for additional Fed action. The Fed can and will deliver more monetary policy
stimulus at some point in early 2012, likely by expanding the balance sheet further. While
there is skepticism surrounding the Fed’s ability to impact the economy at this stage,
additional quantitative easing and/or changes in communication can affect both growth and
inflation.

HCP Realty Advisors Page 26
TEXAS ECONOMIC OVERVIEW According to the Monthly Review of the Texas Economy, August 2012, by Ali Anari and Mark
G. Dotzour, the Texas economy continues to grow at a rate higher than the national average. The
state gained 226,800 nonagricultural jobs from July 2011 to July 2012, an annual growth rate of
2.2 percent compared with 1.4 percent for the United States. The state’s nongovernment sector
added 260,400 jobs, an annual growth rate of 3 percent compared with 1.8 percent for the
nation’s private sector.
Texas’ seasonally adjusted unemployment rate fell to 7.2 percent in July 2012 from 8.1 percent in
July 2011. The nation’s rate decreased from 9.1 to 8.3 percent. All Texas industries except the
information industry had more jobs in July 2012 than in July 2011, but the state’s government
sector continues to lose jobs. The mining and logging industry ranked first in job creation,
followed by the construction industry, the leisure and hospitality industry, and the professional
and business services industry.
The mining and logging industry gained 22,800 jobs, an annual employment growth rate of 9.5
percent from July 2011 to July 2012. Texas’ construction industry gained 23,000 jobs from July
2011 to July 2012, a 4.1percent growth rate. Job gains consisted of 7,200 jobs in the construction
of buildings industry, 11,500 jobs in the heavy and civil engineering construction industry, and
4,300 jobs in specialty trade contractors.
Leisure and hospitality (arts, entertainment, recreation, accommodations and food services)
gained 40,200 jobs from July 2011 to July 2012, an annual growth rate of 3.7 percent. The
professional and business services industry gained 49,100 jobs from July 2011 to July 2012, an
annual growth rate of 3.7 percent. Job gains consisted of 27,700 jobs in the administrative and
support and waste management and remediation, 20,700 jobs in professional, scientific and
technical services, and 700 jobs in management of companies and enterprises.
The other services industry (repair and maintenance, personal and laundry services, religious,
civic and professional organizations) gained 12,000 jobs over the year, a 3.2 percent increase. The
state’s transportation, warehousing and utilities industry gained 13,200 jobs over the year, a 3.1
percent growth rate. Texas’ education and health services industry added 44,100 jobs from July
2011 to July 2012, an annual growth rate of 3.1 percent. Job gains consisted of 33,500 jobs in the
state’s health services industry and 10,600 jobs in the state’s education industry.
The state’s manufacturing industry gained 19,500 jobs from July 2011 to July 2012, an annual
growth rate of 2.3 percent. Job gains comprised 18,900 jobs in the state’s durable manufacturing
and 600 jobs in the state’s nondurable manufacturing. Major job gains in the state’s durable goods
manufacturing industry were in fabricated metal product manufacturing (9,300 jobs), machinery
manufacturing (7,400), primary metal manufacturing (1,500), transportation equipment
manufacturing (4,900), and electric equipment, appliance and component manufacturing (500).
Major job losses in the state’s durable goods manufacturing industry were in nonmetallic mineral
products (1,500), wood product manufacturing (1,100), and computer and electronic product
manufacturing (1,300). Major job gains in the state’s nondurable manufacturing industry were in
chemical manufacturing (1,100), petroleum and coal products manufacturing (300), and beverage
and tobacco product manufacturing (300). Major job losses in this industry were in food
manufacturing (1,200), printing and related support manufacturing (1,100), and paper
manufacturing (400).

HCP Realty Advisors Page 27
Texas’ financial activities (finance, insurance, real estate, rental and leasing services) added
12,100 jobs from July 2011 to July 2012, an annual growth rate of 1.9 percent. Job gains
consisted of 10,300 jobs in the state’s real estate, rental and leasing industry and 1,800 jobs in the
state’s finance and insurance industry. The trade industry gained 29,100 jobs from July 2011 to
July 2012, a 1.7 percent increase. Job gains consisted of 13,500 in wholesale trade and 15,600
jobs in the retail trade industry. Trade is the state’s largest industry after government, accounting
for 15.9 percent of nonfarm employment. Texas’ information industry (internet service providers,
web search portals, publishing industries, broadcasting and telecommunications) lost 4,700 jobs
from July 2011 to July 2012, a 2.4 percent decline. The state’s government sector lost 33,600 jobs
from July 2011 to July 2012, an annual decline rate of 1.9 percent. Government job losses
consisted of 3,100 in the state’s federal government, 21,900 in the state’s local government and
8,600 in state government.
Texas Metropolitan Statistical Areas
All Texas metro areas except Killeen-Temple-Fort Hood, Wichita Falls, Beaumont-Port Arthur,
Abilene, and Brownsville-Harlingen had more jobs in July 2012 than in July2011. Texarkana
ranked first in job creation followed by Odessa, Corpus Christi, Midland, and Tyler.The Austin-
Round Rock-San Marcos metro area’s annual employment growth rate from July 2011 to July
2012 was 2.9 percent, ranking it 8th.
The Dallas-Plano-Irving metro area and the Fort Worth-Arlington metro area both posted an
annual employment growth rate of 2.1 percent in July 2012. The two metro areas ranked 14thin
employment growth rate. The Houston-Sugar Land-Baytown metro area’s annual employment
growth rate from July 2011 to July 2012 was 3.2 percent ranking it 6thamong Texas metro areas
in employment growth rate. The San Antonio-New Braunfels metro area had a 1.3 percent annual
employment growth rate, ranking it 16th. The state’s actual unemployment rate in July 2012 was
7.5 percent. Midland had the lowest unemployment rate followed by Odessa, Amarillo, San
Angelo and Abilene.

HCP Realty Advisors Page 28
Neighborhood Information
N E I G H B O R H O O D O V E R V I E W
Population Trend:
Range in Improvement Ages:
Public Transportation:
Development Built-up:
Maintenance and Condition:
Property Compatibility:
Appeal and Appearance:
Protection and Adverse Influence:
Development Potential:
Rental Demand:
Neighborhood Access:
Supply and Demand:
Development Trend:
Value Trend:
Employment Stability:
Vacancy Trend:
Change in Land Use:
Relatively Stable to Increasing
Stable with job growth in the MSA
Low vacancy.
Good
Good
Good
Not adversely impacted by factors that would affect property values
New development present
Stable based on current economic trends
New development in subject neighborhood is limited. Change in land
use very unlikely.
The subject is located in City of New Braunfels, Texas, approximately 35 miles northeast of the San Antonio CBD . It
is located within Comal County.
North Market Street
North Seguin Avenue
East Bridge Street
East Zink Street
Residential/Retail/Office Development
Residential/Retail/Office Development
Residential/Retail/Office Development
Residential/Retail/Office Development
Access to the neighborhood is provided by North Seguin Avenue and
East Zink Street.
Schools, fire and police protection are considered good for the market
area. The subject neighborhood is adequately served by all the typical
util ities including water, wastewater service, gas service, electric
service and telephone.
Demand for properties in Comal County has been increasing, and will
l ikely remain stabilized in close in locations
New development is l imited.
Good
Stable to Increasing
New to 50 years
Available
85%+
East:
Public Services:
East:
South:
East:
East:
Access & Transportation:
Neighborhood Boundaries:
North:
Surrounding Land Uses:
North:
South:
HCP Realty Advisors Page 29
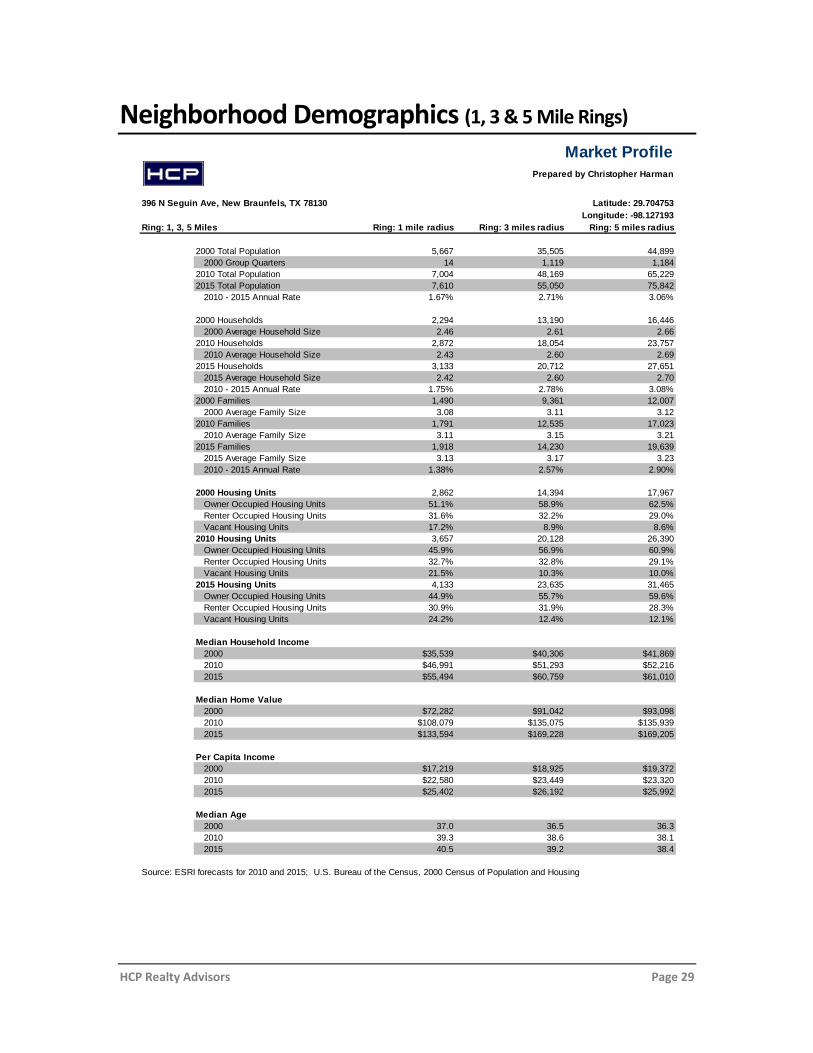
Neighborhood Demographics (1, 3 & 5 Mile Rings)
Market Profile
Prepared by Christopher Harman
396 N Seguin Ave, New Braunfels, TX 78130 Latitude: 29.704753
Longitude: -98.127193
Ring: 1, 3, 5 Miles Ring: 1 mile radius Ring: 3 miles radius Ring: 5 miles radius
2000 Total Population 5,667 35,505 44,899
2000 Group Quarters 14 1,119 1,184
2010 Total Population 7,004 48,169 65,229
2015 Total Population 7,610 55,050 75,842
2010 - 2015 Annual Rate 1.67% 2.71% 3.06%
2000 Households 2,294 13,190 16,446
2000 Average Household Size 2.46 2.61 2.66
2010 Households 2,872 18,054 23,757
2010 Average Household Size 2.43 2.60 2.69
2015 Households 3,133 20,712 27,651
2015 Average Household Size 2.42 2.60 2.70
2010 - 2015 Annual Rate 1.75% 2.78% 3.08%
2000 Families 1,490 9,361 12,007
2000 Average Family Size 3.08 3.11 3.12
2010 Families 1,791 12,535 17,023
2010 Average Family Size 3.11 3.15 3.21
2015 Families 1,918 14,230 19,639
2015 Average Family Size 3.13 3.17 3.23
2010 - 2015 Annual Rate 1.38% 2.57% 2.90%
2000 Housing Units 2,862 14,394 17,967
Owner Occupied Housing Units 51.1% 58.9% 62.5%
Renter Occupied Housing Units 31.6% 32.2% 29.0%
Vacant Housing Units 17.2% 8.9% 8.6%
2010 Housing Units 3,657 20,128 26,390
Owner Occupied Housing Units 45.9% 56.9% 60.9%
Renter Occupied Housing Units 32.7% 32.8% 29.1%
Vacant Housing Units 21.5% 10.3% 10.0%
2015 Housing Units 4,133 23,635 31,465
Owner Occupied Housing Units 44.9% 55.7% 59.6%
Renter Occupied Housing Units 30.9% 31.9% 28.3%
Vacant Housing Units 24.2% 12.4% 12.1%
Median Household Income
2000 $35,539 $40,306 $41,869
2010 $46,991 $51,293 $52,216
2015 $55,494 $60,759 $61,010
Median Home Value
2000 $72,282 $91,042 $93,098
2010 $108,079 $135,075 $135,939
2015 $133,594 $169,228 $169,205
Per Capita Income
2000 $17,219 $18,925 $19,372
2010 $22,580 $23,449 $23,320
2015 $25,402 $26,192 $25,992
Median Age
2000 37.0 36.5 36.3
2010 39.3 38.6 38.1
2015 40.5 39.2 38.4
Source: ESRI forecasts for 2010 and 2015; U.S. Bureau of the Census, 2000 Census of Population and Housing

HCP Realty Advisors Page 30
Neighborhood Demographics (1, 3 & 5 Mile Rings)

HCP Realty Advisors Page 31
Subject Property Identification
L O C A T I O N I N F O R M A T I O N
Large Comal
MSA: San Antonio
Comal County
B U I L D I N G O V E R V I E W ( A S C O M P L E T E )
Office
Source: Building Plans
Z O N I N G O V E R V I E W
Minimum Lot:
The subject property is located at the northeast corner of North Seguin Avenue
and East Zink Street, City of New Braunfels, Comal County, Texas
Source:
396 North Seguin Avenue
0.4210 acres being part of Lots 247 and 248 of New City Block 2013, City of
New Braunfels, Comal County, Texas
County:
Building Plans5,815 Square Feet
Zoning Description:
Conforming Use:
According to information provided to this office, the General Business District,
C-2, is established to provide for residential and non-residential uses set forth
in the Land Use Matrix.
Based on information provided to this office, the property is considered to be a
conforming use.
75 Feet N/A
Zoning Designation:
Height:
C-2, General Business District
Net Rentable Area (RSF):
Property Name/Address:
Market Area Type:
Gross Building Area (SF):
Census Tract:
Submarket:
Location Description:
Legal Description:
Property Type:
BBD/TCOR Office Building
New Braunfels, TX 78130
5,815 RSF
3101.00
HCP Realty Advisors Page 32
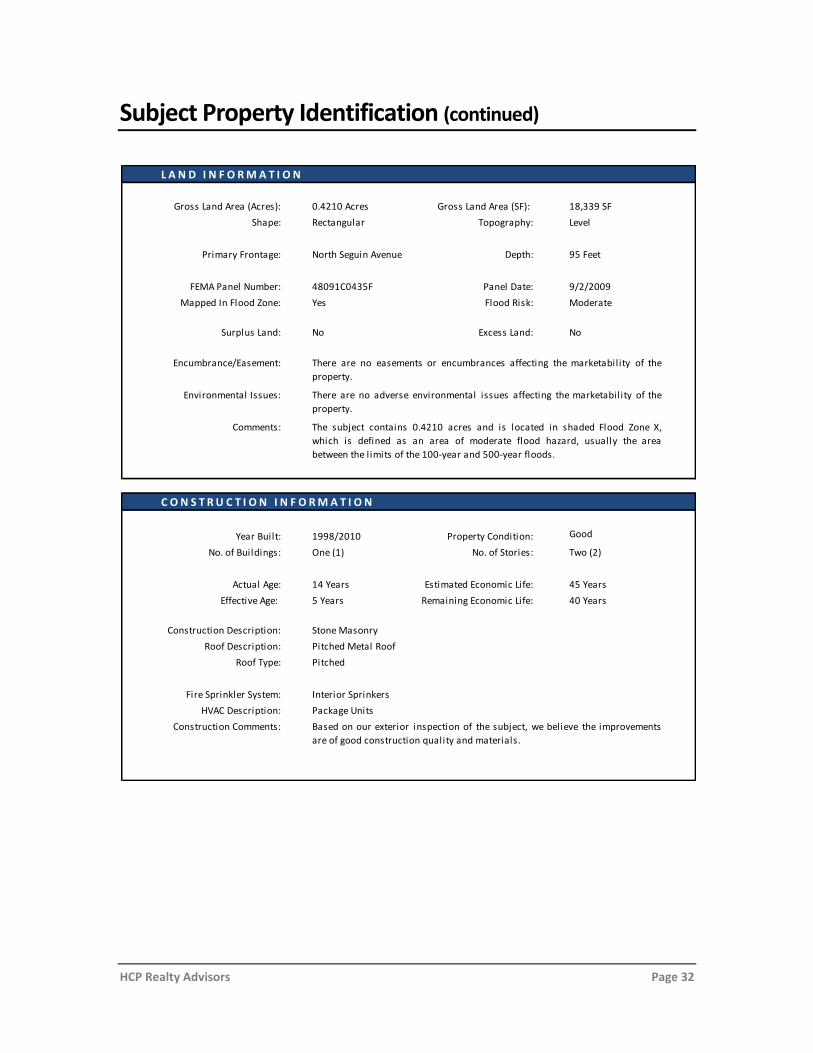
Subject Property Identification (continued)
L A N D I N F O R M A T I O N
C O N S T R U C T I O N I N F O R M A T I O N
1998/2010 Good
Effective Age:
Stone Masonry
Pitched Metal Roof
Pitched
9/2/2009
Surplus Land: No
ModerateYesMapped In Flood Zone:
0.4210 Acres
95 FeetNorth Seguin Avenue
Rectangular
18,339 SF
Level
FEMA Panel Number:
Gross Land Area (Acres):
Shape:
Gross Land Area (SF):
Roof Type:
Fire Sprinkler System: Interior Sprinkers
Construction Description:
HVAC Description:
Construction Comments:
Package Units
Based on our exterior inspection of the subject, we believe the improvements
are of good construction quality and materials.
Topography:
Depth:Primary Frontage:
Panel Date:48091C0435F
Excess Land:
Flood Risk:
No
Roof Description:
Comments: The subject contains 0.4210 acres and is located in shaded Flood Zone X,
which is defined as an area of moderate flood hazard, usually the area
between the limits of the 100-year and 500-year floods.
45 Years14 Years Estimated Economic Life:
Environmental Issues: There are no adverse environmental issues affecting the marketability of the
property.
There are no easements or encumbrances affecting the marketability of the
property.
Encumbrance/Easement:
5 Years Remaining Economic Life:
Year Built:
One (1) Two (2)No. of Buildings:
Actual Age:
No. of Stories:
Property Condition:
40 Years

HCP Realty Advisors Page 33
Subject Property Identification (continued)
O T H E R C O M M E N T S
A T S I T E U T I L I T I E S
City Adequate
Sewer: City Adequate
CenterPoint Energy
Electricity: City
Telephone: AT&T
The subject is currently 100% occupied with three related party (3) tenants in 5815 SF.
According to information provided to this office, the current owner purchased the
property in 2009 and completed approximately $272,000 in renovations through
March 2010.
Gas:
Comments:
Water: Capacity:
Capacity:
O T H E R P E R T I N E N T I N F O R M A T I O N
Quality & Structural Condition:
Functional Util ity:
ADA Compliance:
Environmental Issues:
Economic Life:
The overa l l qual i ty of the proposed faci l i ty is cons idered good
for the neighborhood. After a review of the subject's proposed
bui lding plans , HCP expects the subject's improvements to be of
good qual i ty workmanship and materia ls . However, HCP is not
qual i fied to determine structura l integri ty and it i s
recommended that the cl ient retain the services of a qual i fied,
independent engineer or contractor to determine the structura l
integri ty of the improvements prior to making a bus iness
decis ion.
The overa l l layout of the property as proposed is cons idered
functional in uti l i ty and wi l l provide adequate access ibi l i ty for
i ts proposed use.
The cl ient/reader’s attention is directed to the speci fic l imiting
conditions regarding ADA compl iance.
HCP has not observed, and is not qual i fied to detect, the
exis tence of any potentia l ly hazardous materia ls such as lead
paint, asbestos , urea formaldehyde foam insulation, or other
potentia l ly hazardous construction materia ls on or in the
improvements . The exis tence of such substances may have an
effect on the value of the property. For the purpose of this
ass ignment, we have speci fica l ly assumed that any hazardous
materia ls that would cause a loss in value do not affect the
subject.
We have estimated the economic l i fe of the property based on
estimated provided by Marshal l Valuation Services and our
experience in valuing s imi lar property types . It should be noted
that the effective age of the property as estimated assumes that
the property wi l l be wel l maintained through routine
maintenance.

HCP Realty Advisors Page 34
Property Tax Overview
P R O P E R T Y T A X O V E R V I E W - A S I S
Taxing Entity Name:
T O T A L S
Comal County
City of New Braunfels
Lateral Road
New Braunfels ISD
S U B T O T A L
2008
2009
2010
2011
Yes
Comments:
T A X L I A B I L I T YT A X R A T E S
C O M M E N T S
1.339100$
0.448362$
0.045000$
T A X I D / A P N A S S E S S M E N T
$476,430
I M P R O V E M E N T S
$186,510 $289,920
LAND
971
T O T A L A S S E S S M E N T P S F
$186,510 $289,920 $476,430
SUBJECT PROPERTY'S HISTORICAL ASSESSSMENT
491,060$
500,480$
470,740$
463,690$
To determine the total tax liability we have
utilized the 2012 certified value by the Comal
County Appraisal District with the current Comal
County Tax Rates.
Assessed Value vs. Market Value: Assessed Value is lower than our estimate of
market value on an As Is basis.
County Appraisal District:
Property Taxes Current:
Comal County Appraisal District
BBD Investments, LLC
2.13788$
T A X I N G J U R I S D I C T I O N S
10,185.52$
1,455.12$
214.39$
2,136.13$
6,379.87$
$81.93
0.305421$

HCP Realty Advisors Page 35
Subject Location Map

HCP Realty Advisors Page 36
Subject Property Aerial Map

HCP Realty Advisors Page 37
Subject Property Zoning Map
C-2, General Business District – City of New Braunfels

HCP Realty Advisors Page 38
Subject Property Flood Map

HCP Realty Advisors Page 39
Highest and Best Use Analysis
Four criteria are examined in order to determine the highest and best use of the subject property. The
criteria and their applicability to the subject, both “as vacant” and “as improved” are as follows:
Legally Permissible: a legally permissible use is determined primarily by current
zoning regulations. However, other considerations such as long-term leases,
deed restrictions, and environmental regulations may preclude some possible
highest and best use.
Physically Possible: the size, shape and topography affect the uses to which land
may be developed. The utility of a parcel is dependent on its frontage and depth.
Sites with irregular shapes may be more expensive to develop, and topography or
subsoil conditions may make utilization too costly or restrictive. Highest and best
use as improved also depends on physical characteristics such as condition and
utility.
Financially Feasible: the use of the property is analyzed to make a
determination as to the likelihood that the property is capable of producing a
return which is greater than the combined income needed to satisfy operation
expenses, debt service, and capital amortization. Any use that is expected to
produce a positive return is classified as financially feasible.
Maximally Productive: the use that provides the highest rate of return among
financially feasible uses is the highest and best use. The use of the land must yield
a profitable net return, and the quantity of land devoted to any specific use must
be limited to that quantity which will yield a maximum return to each owner.

HCP Realty Advisors Page 40
Land Size (Acres):
Shape:
Topography:
M A X I M A L L Y P R O D U C T I V E With consideration to the highest legal use as allowed by the
development regulations, consideration must be given to the financial
consequences of building other uses on the site. The returns to the
investor can be tested to establish which would return the most to the
site. The financial return is tested and an analysis is made of a cash-on-
cash return of the legal uses. The cost of operations of the possible
property types is also considered.
Level
Rectangular
C-2, General Business District
0.4210
Financially feasible refers to legal uses which are physically possible
and have a sufficient demand to produce a positive return. Once the
physically possible and legally permissible potential land uses have
been determined, the next step in estimating the highest and best use is
to determine which uses are economically feasible. A majority of office
properties in the subject’s immediate area are stabilized. Based upon
these observations, these uses would reflect one of the highest and best
uses.
H I G H E S T & B E S T U S E A N A L Y S I S - A S V A C A N T
According to information provided to this office, the General Business
District, C-2, is established to provide for residential and non-
residential uses set forth in the Land Use Matrix.
L E G A L L Y P E R M I S S I B L E
The size, shape, and terrain are conducive for many types of
development. The utilities serving the subject site are adequate for
their current use. The property has average visibil ity from roadways.
The subject’s size is sufficient to allow development of most legally
permissible uses. The subject site’s physical aspects do not impose
physical limitations on development for the above legally permissible
uses.
P H Y S I C A L L Y P O S S I B L E
Zoning Designation:
F I N A N C I A L L Y F E A S I B L E

HCP Realty Advisors Page 41
Zoning Designation:
H I G H E S T & B E S T U S E A N A L Y S I S - A S I M P R O V E D
L E G A L L Y P E R M I S S I B L E
Based on information provided to this office, the property is considered
to be a conforming use.
P H Y S I C A L L Y P O S S I B L E The physical characteristics of the subject improvements were
discussed in detail within the Subject Property Identification section of
this report. The overall design and functionality of the improvements
are considered good for their intended use. While it would be
physically possible for the property to handle a wide variety of uses,
based on the design of the improvements, the most functional use of the
property would be for office use.
C-2, General Business District
F I N A N C I A L L Y F E A S I B L E Financially feasible refers to legal uses which are physically possible
and have a sufficient demand to produce a positive return. Once the
physically possible and legally permissible potential uses have been
determined, the next step in estimating the highest and best use is to
determine which uses are economically feasible. The building is
generally considered to have good overall design and quality compared
to competing properties in the subject’s competitive market area. The
design of the improvements and layout of the project are acceptable in
the market and represent maximum utilization of the site as improved.
Therefore, the current use does reflect one of the highest and best uses
of the site as improved.
M A X I M A L L Y P R O D U C T I V E With consideration to the highest legal use as allowed by the
development regulations, consideration must be given to the financial
consequences of building other uses on the site. The returns to the
investor can be tested to establish which would return the most to the
site. The financial return is tested and an analysis is made of a cash-on-
cash return of the legal uses. The cost of operations of the possible
property types is approximately the same on a percentage basis.

HCP Realty Advisors Page 42
Highest and Best Use Analysis - Conclusion
H I G H E S T & B E S T U S E A N A L Y S I S - C O N C L U S I O N
The subject neighborhood is located within New Braunfels in Comal County. The subject is located within an
area where office development is predominant. Additionally, the property size is sufficient for many uses
and it benefits from access to North Seguin Avenue and East Fink Street. Given the subject's location and the
overall performance of office properties in the area, we believe the highest and best use as improved to be
the continued use as an office development.
Highest & Best Use As Vacant: Office Development
Highest & Best Use As Improved: Continued Use as an Office Development

HCP Realty Advisors Page 43
Valuation Procedures and Methodologies
Current appraisal standards recognize three basic approaches to real estate value. These are identified
as the Cost, Income, and Sales Comparison Approaches.
Cost Approach
The Cost Approach to value is developed by two fundamental opinions: the value of the land
and the value of the improvements to the land. Initially, the current fair market value of the
land is estimated as if unimproved and capable of being put to its highest and best use. The
reproduction or replacement cost new of the improvements, less any depreciation, is then
added, along with any contributory value of the site improvements. The validity of the
resulting value estimate is impacted to varying degrees by the accuracy of the cost estimates
and the depreciation estimate. In this instance, the cost approach was not applied.
Income Approach
The Income Approach measures value by capitalization of the net income from the real estate.
The potential gross income is first estimated based on data derived directly from the market.
Deductions are then made for vacancy and collection loss, and normal operating expenses.
The resulting net income figure is then converted to a value estimate by any one of several
capitalization methods. In this instance, the income approach was applied.
Sales Comparison Approach
The Sales Comparison Approach is based on comparison between the subject property and
similar properties which sold within a reasonable period prior to the date of appraisal, and
which are capable of providing insight into the valuation of the subject property. Units of
comparison are examined and developed and after making the appropriate adjustment for
differences such as location and physical characteristics, are then applied to the subject to
derive an indication of value. Critical in this valuation methodology, is the availability of
sufficient market comparables with which to make valid comparisons. In this instance, the
sales comparison approach was applied.

HCP Realty Advisors Page 44
The Income Approach
This approach to value is predicated on the premise that the property is designed to return a flow
of income to the owner when properly developed. The theory of the income approach advocates
that the value of the property is the present worth of the net income it will produce during the
remainder of its economic life. An investor or perspective purchaser should consider the income
producing ability of the property and the expected return on his investment.
The income approach measures market value by determining the price that open market
conditions would justify paying for a particular property's net income stream. This is specifically
accomplished for an appraisal by discounting the property's projected net income into present
value by use of a capitalization rate derived from sales of comparable properties. The property's
net operating income is the key term.
Net operating income is generally arrived at through a process that determines prevailing open
market rents, rates of vacancy and collection loss, and expenses necessary to operate the property
and service the tenants. Prevailing market rates of vacancy and collection loss and operating
expenses are deducted from prevailing market rent to produce the property's projected net
income.
It is important to note that: (1) Vacancy and collection loss is a projection over the entire
economic life of the property, not that which occurs at a given point in time, (2) For appraisal
purposes, income taxes, depreciation, debt service, capital improvements, franchising fees, and
business expenses of the owner are excluded from operating expenses since they are expenses of
the owner and not of the property, (3) The proper rental for the property is that prevailing in the
marketplace as of the appraisal date and not that which is carried over from old lease
arrangements.
Economic net income is converted to a value indication under this approach by application of an
overall capitalization rate, which is derived from market sales occurring during the applicable
period, as well as comparison with prevailing market data. The overall rate includes provisions
for a market rate of return on the investment as well as recapture of the investment.

HCP Realty Advisors Page 45
Comparable Rental Analysis
A survey of economic data for similarly situated properties in the area was conducted to
determine appropriate economic parameters with which to derive a valid conclusion of value
based on the stabilized income generating capabilities of the subject property.
Since the subject is produces a revenue stream based on its existing leases, it is critical to analyze
income-generating characteristics of other similarly situated properties to provide the most
complete portrait of the manner in which the market for the uses represented in the subject sets
rental rates.
The appraisers examined lease rates for properties in the local market as this is determined to be
the sphere of immediate competition for the subject.

HCP Realty Advisors Page 46
2810 Oak Run Parkway Market Type: Large
2810 Oak Run Parkway Tax IDs/APNs: 143290
New Braunfels, TX 78132 Property Type: Office
Gross Rentable Area (SF): 7,250 Occupancy: 55%
Property Condition: Good Year Built: 2012
Number of Stories: One (1) Submarket: Comal County
Zoning: C-2, City of New Braunfels County: Comal
Land Size (Acres): 1.09500 Land to Building Ratio: 6.58 : 1
Effective Rental Rate: $17.40 Rate Monthly or Annual: Annual
Lease Terms: NNN Term of Lease: Negotiable
Confirmed By: Broker
Property Remarks:
CommentsThe property is located along the south line of Oak Run Parkway, between Hunters Trail
and Hunters Village. The rent referenced above is reflective of the current asking rates
for a 1,850 SF and 1,448 SF suite in the building.
Market Rent Comparable 1Location Information
Property Information
Lease Terms

HCP Realty Advisors Page 47
Walnut Place Professional Offices Market Type: Large
1423 North Walnut Avenue Tax IDs/APNs: 28801
New Braunfels, TX 78130 Property Type: Office
Gross Rentable Area (SF): 6,960 Occupancy: 43%
Property Condition: Good Year Built: 2000
Number of Stories: One (1) Submarket: Comal County
Zoning: C-2, City of New Braunfels County: Comal
Land Size (Acres): 1.0000 Land to Building Ratio: 6.26 : 1.00
Effective Rental Rate: $15.60 Rate Monthly or Annual: Annual
Lease Terms: NNN Term of Lease: Negotiable
Confirmed By: Broker
Property Remarks: The property is located along the south line of North Walnut Avenue, between Kerlick
Lane and Walker Circle.The rent referenced above is reflective of the current asking
rates for a 1,500 SF and 2,450 SF suite available in the building.
Market Rent Comparable 2Location Information
Property Information
Comments
Lease Terms

HCP Realty Advisors Page 48
952 Gruene Road Market Type: Large
952 Gruene Road Tax IDs/APNs: 131371
New Braunfels, TX 78130 Property Type: Office
Gross Rentable Area (SF): 1,610 Occupancy: 0%
Property Condition: Good Year Built: 2011
Number of Stories: Two (2) Submarket: Comal County
Zoning: C-2, City of New Braunfels County: Comal
Land Size (Acres): 2.8700 Land to Building Ratio: 77.65 : 1.00
Effective Rental Rate: $18.24 Rate Monthly or Annual: Annual
Lease Terms: NNN Term of Lease: Negotiable
Confirmed By: Broker
Property Remarks: The property is located along the east line of Gruene Road, between Hanz Drive and
Gruene Leaf Drive. The rent referenced above is reflective of the asking rate for the
entire 1,610 SF building.
Market Rent Comparable 3Location Information
Property Information
Lease Terms
Comments

HCP Realty Advisors Page 49
Canyon Vista Office - Suite 902 Market Type: Large
1619 East Common Street Tax IDs/APNs: 151512/151513
New Braunfels, TX 78130 Property Type: Office
Gross Rentable Area (SF): 2,000 Occupancy: 0%
Property Condition: Good Year Built: 2007
Number of Stories: One (1) Submarket: Comal County
Zoning: C-2, City of New
Braunfels
County: Comal
Land Size (Acres): 4.6930 Land to Building Ratio: 102.21 : 1.00
Effective Rental Rate: $15.48 Rate Monthly or Annual: Annual
Lease Terms: NNN Term of Lease: 5 Years
Confirmed By: Broker
Property Remarks: The property is located along the north line of East Common Street, between Village
Way and Gruene Road. The rent referenced above is reflective of the current asking
rates for the 2000 SF suite.
Market Rent Comparable 4Location Information
Property Information
Lease Terms
Comments

HCP Realty Advisors Page 50
251 South Seguin Avenue Market Type: Large
251 South Seguin Avenue Tax IDs/APNs: 91
New Braunfels, TX 78130 Property Type: Office
Gross Rentable Area (SF): 3,500 Occupancy: 77%
Property Condition: Good Year Built: 1890/1988
Number of Stories: One (1) Submarket: Comal County
Zoning: C-2, City of New Braunfels County: Comal
Land Size (Acres): 0.211 Land to Building Ratio: 2.63 : 1
Effective Rental Rate: $15.60 Rate Monthly or Annual: Annual
Lease Terms: NNN Term of Lease: Negotiable
Confirmed By: Broker
Property Remarks: The property is located along the north line of South Seguin Avenue, between Main Plaza
and West Coll Street. The rent referenced above is reflective of the current asking rates
for a 800 SF suite available in the building.
Market Rent Comparable 5Location Information
Property Information
Lease Terms
Comments

HCP Realty Advisors Page 51
C O M P A R A B L E R E N T P H O T O S
2810 Oak Run Parkway Canyon Vista Office - Suite 9021619 East Common Street
Market Rent Comparable 3
1423 North Walnut Avenue
New Braunfels, TX 78130New Braunfels, TX 78132
Market Rent Comparable 4Market Rent Comparable 1
Walnut Place Professional Offices
2810 Oak Run Parkway
Market Rent Comparable 2 Market Rent Comparable 5251 South Seguin Avenue
New Braunfels, TX 78130251 South Seguin AvenueNew Braunfels, TX 78130
952 Gruene Road952 Gruene Road
New Braunfels, TX 78130

HCP Realty Advisors Page 52
Comparable Rental Location Map

HCP Realty Advisors Page 53
Subject Rent 1 Rent 2 Rent 3 Rent 4 Rent 5
Name BBD/TCOR Office
Building
2810 Oak Run
Parkway
Walnut Place
Professional
Offices
952 Gruene
Road
Canyon Vista
Office - Suite
902
251 South
Seguin Avenue
Address 396 North
Seguin Avenue
2810 Oak Run
Parkway
1423 North
Walnut Avenue
952 Gruene
Road
1619 East
Common Street
251 South
Seguin Avenue
City, State, Zip New Braunfels,
TX 78130
New Braunfels,
TX 78132
New Braunfels,
TX 78130
New Braunfels,
TX 78130
New Braunfels,
TX 78130
New Braunfels,
TX 78130
Lease Terms NNN NNN NNN NNN NNN
Rentable Area (SF) 5,815 7,250 6,960 1,610 2,000 3,500
Occupancy 100% 55% 43% 0% 0% 77%
Year Built 1998/2010 2012 2000 2011 2007 1890/1988
Condition Good Good Good Good Good Good
Land Area (Acres) 0.4210 1.0950 1.0000 2.8700 4.6930 0.211
$ 17.40 $ 15.60 $ 18.24 $ 15.48 $ 15.60
Comparable Comparable Comparable Comparable Comparable
0.0% 0.0% 0.0% 0.0% 0.0%
$ - $ - $ - $ - $ -
$ 17.40 $ 15.60 $ 18.24 $ 15.48 $ 15.60
Comparable Comparable Comparable Comparable Comparable
0.0% 0.0% 0.0% 0.0% 0.0%
$ - $ - $ - $ - $ -
$ 17.40 $ 15.60 $ 18.24 $ 15.48 $ 15.60
Comparable Comparable Comparable Comparable Comparable
0.0% 0.0% 0.0% 0.0% 0.0%
$ - $ - $ - $ - $ -
$ 17.40 $ 15.60 $ 18.24 $ 15.48 $ 15.60
Comparable Inferior Comparable Comparable Inferior
0.0% 10.0% 0.0% 0.0% 15.0%
$ - $ 1.56 $ - $ - $ 2.34
$ 17.40 $ 17.16 $ 18.24 $ 15.48 $ 17.94
Comparable Comparable Superior Inferior Comparable
0.0% 0.0% -5.0% 10.0% 0.0%
$ - $ - $ (0.91) $ 1.55 $ -
$ 17.40 $ 17.16 $ 17.33 $ 17.03 $ 17.94
Net Percent Adjustment 0.0% 10.0% -5.0% 10.0% 15.0%
Net Percent Adjustment -$ 1.56$ (0.91)$ 1.55$ 2.34$
Adjusted Price Per SF 17.40$ 17.16$ 17.33$ 17.03$ 17.94$
Location
Percent Adjustment
Dollar Adjustment
Percent Adjustment
Dollar Adjustment
Property Size
Adjusted Price
Condition/Market Appeal
Percent Adjustment
Year Built
Percent Adjustment
Dollar Adjustment
Dollar Adjustment
Adjusted Price
Dollar Adjustment
Percent Adjustment
Adjusted Price
Adjusted Price
Lease Terms
Adjusted Price
Rental Rate Per SF:
Rental Comp Analysis with Adjustments

HCP Realty Advisors Page 54
Discussion and Analysis
Potential Gross Income
In order to estimate the Potential Gross Income (PGI) of the subject we have surveyed and
analyzed a number of competing properties throughout the subjects market. The comparable
rentals were selected based on their similarity to the subject in location and physical
characteristics, particularly with respect to their age/condition, quality of construction, size, and
general location. All comparisons were based on annual rent per square foot. Adjustments were
then made to the comparables to account for differences in location characteristics and physical
characteristics.
According to market participant interviews, typical leases in the subject’s submarket are NNN
where the tenant pays their pro rata share of property taxes, insurance, common area
maintenance, and management. The competing properties ranged from $17.03 to $17.94 per
square foot after adjustments. Based on competing projects, our estimate of market rent for the
subject is $17.00 per square foot. Please note this conclusion is consistent with information
provided by market participants.
SUBJECT PROPERTY – PRESENTATION RENT ROLL
Gross Potential Rent The above table reflects the gross potential rent for the subject property at market rates. This
equates to an annual potential income of $98,855.
Vacancy and Collection Loss
Our survey of the market indicates that occupancy rates ranging from 0% to 77% in the properties
that we surveyed. Given this information and data taken from the market analysis, we have
estimated a 5% vacancy and collection loss factor in our analysis. Our estimate above includes
an allocation for collection loss of 2%. Please note our estimate of vacancy also takes into
consideration the Comal County Submarket currently has an average vacancy rate of 5.40%.
Premises
(RSF)
Pro-Rata
Share
Annual Base
Rent
Base
Rent Per
RSF
5,815 100.0% 98,855$ $17.00
Subtotal 5,815 100.0% 98,855$ 17.00$
Tenant Name
Subject Property

HCP Realty Advisors Page 55
Operating Expenses
The market lease structure for the subject represents a NNN expense structure whereby the
tenant pays their pro rata share of property taxes, insurance, common area maintenance, and
management.
Reimbursable Operating Expenses
Property Taxes
As noted previously in the report, property taxes are calculated based on the assessed valuation of
the property given the corresponding ad valorem tax rates for the various taxing jurisdictions
where the property is located. As noted in the property tax overview section of this report we
have estimated the tax liability to equate to $10,186. This number has been utilized for the
purpose of our analysis.
Insurance
This expense covers fire, liability and replacement coverage if the improvements are destroyed.
We have estimated insurance for the subject at $0.30 per square foot, or $1,745. This estimate is
consistent with industry averages for this category.
Common Area Maintenance
This expense covers utilities and interior and exterior repairs of the subject. We have estimated
common area maintenance for the subject at $1.50 per square foot, or $8,723. This estimate is
consistent with industry averages for this category.
Management
This expense covers costs associated with third party management for the subject. For the
purposes of our analysis, we have utilized a management expense of 5%. Please note that this is
consistent with management rates in the subject properties market area.
Non - Reimbursable Operating Expenses
General & Administrative
This expense covers office supplies and other fees related to the business. We have estimated
general & administrative for the subject at $0.20 per square foot, or $1,163. This estimate is
consistent with industry averages for this category.
Reserves for Replacement
This expense typically includes non-recurring items in need of repair or replacement that may be
capitalized including appliances, air conditioning units, roof replacement and hot water heaters.
This reserve account establishes an account to fund these items that need to be addressed during
the investment holding period. We have estimated reserves for replacement for the subject of
$0.20 per square foot consistent with industry averages for this category.

HCP Realty Advisors Page 56
Net Operating Income
The net operating income is calculated by determining market rents for the vacant space, the
actual in-place rents for occupied space and subtracting vacancy, and operating expenses as
outlined herein.
Direct Capitalization Analysis
POTENTIAL GROSS INCOME
Expense Reimbursements
Total Potential Gross Income
Less: Vacancy 5.0%
TOTAL EFFECTIVE GROSS INCOME
OPERATING EXPENSES
Property Taxes
Insurance 0.30
CAM 1.50
Management 5.0% 5,960 1.02
General & Administrative 1,163 0.20
Reserves for Replacement
Total Operating Expenses
NET OPERATING INCOME (After Reserves)
Annual Per SF98,855$ 17.00$
26,612 4.58
125,467$
(6,273)
21.58$
(1.08)
1,745
119,194$ 20.50$
Annual Per SF
10,186$ 1.75$
8,723
1,163 0.20
28,938$ 4.98
90,256$ 15.52$

HCP Realty Advisors Page 57
Overall Rate Derivation – Mortgage/Equity Technique
The appraiser has considered the mortgage/equity technique to arrive at an estimate of value by
the Income Approach, since it permits a consideration of all of the factors that comprise an
appropriate discount rate (i.e., annual return on equity investment, equity build-up from mortgage
amortization, and recognition of possible appreciation or decline in value). The overall
capitalization rate is simply the ratio of net annual income (before recapture and debt service) to
value. It is that fraction of the total investment which must be collected each year, on the
average, to service the debt (principal and interest), yield the required dividends (cash flow and
equity build-up), and compensate for appreciation or depreciation.
The equity dividend rate can be calculated using the build-up method. We must consider that real
estate, as a commodity, must compete in the marketplace along with other interest-earning
investments, including bonds, CDs, money market accounts, stocks and a myriad of other
investments. The very nature of real estate indicates that it does not have the liquidity of cash and
therefore entails risk. The build-up process is calculated by adding the components of an interest
rate to a “safe” rate, which is the rate obtainable on a comparable term Treasury bill or on other
relatively safe investments. Allocations are then made for risk, non-liquidity, and other factors,
including management of money or entrepreneurial profit return. The equity return rate used in
the analysis is calculated after comparing alternative investments. We have the opportunity to
interview equity investors throughout the year. Based on these discussions, the equity dividend
rate seems to vary widely among investors. An institutional investor may provide a lower cash
on cash return based on the quality of the asset, credit profile, etc. while a private equity fund
may expect equity returns closer to 18-20%. So we will typically conclude a equity yield rate in
the 14% to 16% range based on the quality of the asset depending on the perceived risk of the
investment.
In discussions with local lenders and mortgage brokers, we were led to believe that an investor
and/or on-the-premises owner with a good credit rating should be able to secure a mortgage with
a 20 to 25 year payout at 0.5% to 1.5% over the prime interest rate (as of the date of valuation) in
an amount equal to 65% to 75% of the appraised value of the property. The equity dividend rate
is a rate required to satisfy an equity investment in the property. We were unable to derive equity
dividend rates from the comparable sales, for the reasons cited above.
For this analysis, the appraisers contemplated the following criteria utilized in the Band of
Investment summary. The return to the mortgage position is calculated by multiplying the
percent of the mortgage position by the mortgage constant for the mortgage rate and amortization
period. The return to the equity is calculated by multiplying the percent to the equity position by
the yield rate.
75%
6.00%
Amoritization Period (Years): 25
14%
2%Project Appreciation:
M O R T G A G E E Q U I T Y B A N D OF I N V E S T M E N T A S S U M P T I O N S
Loan To Value Ratio:
Interest Rate:
Equity Dividend Rate:

HCP Realty Advisors Page 58
The Debt Coverage Method and the Band of Investment Technique ranged from 6.96% to
8.30%. The Improved Sales included herein represent capitalization rates of 7.66% to 8.56%.
Mortgage Ratio (LTV) Present Value
Interest Rate Number of Payments
Typical Market Points Monthly Interest
Term (Years) Monthly Payment
Debt Coverage Ratio
Equity Yield Rate
Projection Period (Years) x 12 =
Projected Appreciation x 12 = 7.73%
7.73%
5.17%
8.38%
8.30%
1.43
=
÷ + x -(1)
÷ = =
Mortgage Ratio x Annual Constant
x
Equity Ratio x Equity Ratio
x
LESS: MORTGAGE PAID OFF (EQUITY BUILD UP)
x x
x x
STEP 3 LESS: APPRECIATION
Projected Appreciation x
x =
Debt Coverage x x =
x x
x x
x x
x x
23.65%
Annual Constant
Mortgage Paid Off
MORTGAGE EQUITY BAND OF INVESTMENT ANALYSIS
Input Variables & Summary Annual Constant
Mortgage Paid Off at End of Holding Period
25
14.00%
10
2%
-1
300
0.0050
$0.006443
Monthly Payment
75%
6.00%
1.00
0.0773162$0.006443
0.13322460
-6.00%
+
STEP 1
Debt Coverage Ratio Method
* Sinking Fund Factor @ Equity Yield Rate, Annually
for Projection Period Weighted Rate
75.00% 23.65%
0.07731617
25.00%
75.00% 7.73%
1.35
7.73%
7.73%
Overall Rate:
Rounded To:
LTV
1.30 7.73% 75.00%
Annual Constant
1.20
STEP 2
Mortgage Ratio MPO
Sinking Fund Factor (SFF)*
Basic Rate
Overall Rate
Implied Debt Coverage Ratio
Equity Yield Rate Divided By (Equity Yield Rate +1) x (-1)
5.17%
14.00%
14.00%
(14.00%
2.70722
1.00%)
0.051713541
Sinking Fund Factor
0.0732246
3.50%
9.30%
=
=
=
1.20
1.25 7.73% 75.00%
2.00% -0.10%
SFF
5.17% -0.92%
Basic Rate: =
75.00% 6.96%
8.38%
Cap. Rate
7.25%
8.28%
8.30%
SFF
5.17%
+
-6.00%
0.0173162
0.236480194 23.65%
14.00%
Weighted Rate:
5.80%
75.00%
Annual Constant
7.83%
7.54%

HCP Realty Advisors Page 59
Conclusion Consideration has been given to the relative risk that the subject property represents to a potential
investor, and a final capitalization rate of 8.00% is selected as most appropriate, considering all
relevant aspects of the subject's economic environment and the relative age of the subject. The
8.00% rate is consistent with the comparable sales.
The total value estimate is as follows:
Direct Capitalization Approach
Net Operating Income $ 90,256 Overall Capitalization Rate 8.00%
Income Approach Valuation $ 1,128,195
Income Approach Valuation – As Is $ 1,130,000
Income Approach
Value via the Income Approach (“As Is”) $ 1,130,000

HCP Realty Advisors Page 60
The Sales Comparison Approach
The Sales Comparison Approach to value compares the subject to similar properties that have
sold or are under contract in the same or similar market. This approach is based on the principle
of substitution, which states that no commodity has a value greater than a similar commodity
offering similar uses, similar utility, and similar function that can be purchased within a
reasonable time frame. In other words, the market value of a property is set by the price of
acquiring a substitute property, which could provide the owner with similar utility. The principle
of substitution also is crucial in reconciling all three approaches to value, as it provides linkage in
the underlying determination the subject’s market value.
Units of Comparison
Using a common unit of comparison is an effective device to adjust for differences in physical
characteristics while controlling for scale or some other factor. This control allows the appraisers
to determine the impact of differences in attributes between the subject and comparable sale
properties.
As for the subject, the appraisers discussed recent market transactions with area brokers, as well
as evaluating the physical attributes of the subject’s use type. In both instances, the predominant
unit of comparison was sale price per rentable square foot. The following analysis will use this
unit.
Elements of Comparison
There are eight major comparison categories that must be considered in the direct sales
comparison approach. These include the following:
┌ 1. Property rights conveyed
│
Date of Sale ┤ 2. Financing
│
│ 3. Conditions of Sale
│
└ 4. Expenditures made after sale
Trend Forward 5. Market Trends
┌ 6. Location of Sale Property
│
Appraisal Effective Date ┤ 7. Physical Attributes
│
└ 8. Economic Attributes
Each of these categories will be addressed in the subsequent analysis, as it relates to the subject.

HCP Realty Advisors Page 61
Sale Selection Criteria
The following selection criteria were used:
Sale Period: A sale period of January 2010 to the effective date of this
appraisal was examined.
Location / Neighborhood: Sales were taken from the Austin and San Antonio MSA with
similar location characteristics as the subject focusing on office
properties with similar conditions.
Physical Attributes: The survey of comparable sales was limited to properties of
similar condition and appeal.
Highest and Best Use: All of the sales were similar buildings with similar zoning uses.
Comparable Sales Analysis
Of the sales reviewed, based on the above criteria, the following sales represent the best available
from the market to determine the subject’s market potential under this valuation approach. While
some are more ideal than others, the appraisers believe that they represent a sufficient sample of
the data reviewed to illustrate a sound market-based conclusion for the subject.
The selected comparable sales are presented on the following pages.

HCP Realty Advisors Page 62
21708 Hardy Oak Boulevard Market Type: Large - Urban
21708 Hardy Oak Boulevard Tax IDs/APNs: 737918
San Antonio, TX 78258 Property Type: Office
Sale Price: $1,240,000 Sale Price/SF Rentable: $204.12
Sale Status: Closed Document No.: 20100180397
Recording Date: November-10
Rights Conveyed:
Grantee:
Grantor:
Financing Description: Cash To Selller
Rentable Building Area (SF): 6,075 Year Built: 2000
Occupancy: 0% Property Condition: Good
Land to Building Ratio: 6.03 : 1.00 No. of Stories: One (1)
Gross Land Area (Acres): 0.8410 Gross Land Area (SF): 36,634
Per SF
Gross Potential Income: $ 109,350 $18.00
Vacancy Allowance: (5,468) ($0.90)
Effective Gross Income: 103,883 $17.10
Operating Expenses: (3,038) ($0.50)
Net Operating Income: 100,845 $16.60
Expense Ratio: 2.92% Monthly Rent PSF: $18.00
Gross Income Multiplier: 11.34
Overall Capitalization Rate: 8.13%
Sale Comment:
Kathleen K. Tate
Property Information
Income & Expense Proforma
CommentsThe property is located along the north line of Hardy Oak Boulevard, between
Crescent Oaks and Stone Oak Parkway. Income and Expenses are based on proforma
estimates.
C O M P A R A B L E S A L E 1 Location Information
Sale Information
Fee Simple
Hardy Oak Holdings, LLC

HCP Realty Advisors Page 63
180 West Mill Street Market Type: Large
180 West Mill Street Tax IDs/APNs: 912
New Braunfels, TX 78130 Property Type: Office
Sale Price: 495000 Sale Price/SF Rentable: $141.43
Sale Status: Closed Document No.: 201106023671
Recording Date: July-11
Rights Conveyed:
Grantee:
Grantor:
Financing Description: Cash to Seller
Rentable Building Area (SF): 3,500 Year Built: 1962
Occupancy: 0% Property Condition: Good
Land to Building Ratio: 2.58 : 1.00 No. of Stories: One (1)
Gross Land Area (Acres): 0.2070 Gross Land Area (SF): 9,017
Per SF
Gross Potential Income: $ 45,500 $13.00
Vacancy Allowance: (2,275) ($0.65)
Effective Gross Income: 43,225 $12.35
Operating Expenses: (875) ($0.25)
Net Operating Income: 42,350 $12.10
Expense Ratio: 2.02% Monthly Rent PSF: $13.00
Gross Income Multiplier: 10.88
Overall Capitalization Rate: 8.56%
Sale Comment:
C O M P A R A B L E S A L E 2 Location Information
Sale Information
Fee Simple
180 West Mill Street, LLC
This property is located at the northwest corner of West Mill Street and West Castell
Avenue. Income and Expenses are based on proforma estimates.
Comal County Mental Health
Property Information
Income & Expense Proforma
Comments

HCP Realty Advisors Page 64
5524 Highway 290 West Market Type: Large - Urban
5524 Highway 290 West Tax IDs/APNs: 553375
Austin, TX 78735 Property Type: Office
Sale Price: $930,000 Sale Price/SF Rentable: $200.91
Sale Status: Closed Document No.: 2011175052
Recording Date: November-11
Rights Conveyed:
Grantee:
Grantor:
Financing Description: Cash to Seller
Rentable Building Area (SF): 4,629 Year Built: 2008
Occupancy: 0% Property Condition: Good
Land to Building Ratio: 15.99 : 1.00 No of Stories: One (1)
Gross Land Area (Acres): 1.6990 Gross Land Area (SF): 74,008
Per SF
Gross Potential Income: $ 83,322 $18.00
Vacancy Allowance: (4,166) ($0.90)
Effective Gross Income: 79,156 $17.10
Operating Expenses: (3,009) ($0.65)
Net Operating Income: 76,147 $16.45
Expense Ratio: 3.80% Monthly Rent PSF: $18.00
Gross Income Multiplier: 11.16
Overall Capitalization Rate: 8.19%
Sale Comment:
KKE Building, LLC
Property Information
Income & Expense Proforma
CommentsThe property is located along the north line of Highway 290 West, between Monterey
Oaks Boulevard and West William Cannon Drive. Income and Expenses are based on
proforma estimates.
C O M P A R A B L E S A L E 3Location Information
Sale Information
Fee Simple
House of 8, LLC

HCP Realty Advisors Page 65
205 Wild Basin Road Market Type: Large - Urban
205 Wild Basin Road Tax IDs/APNs: 120038
Austin, TX 78746 Property Type: Office
Sale Price: $1,695,000 Sale Price/SF Rentable: $166.47
Sale Status: Closed Document No.: 2012041690
Recording Date: March-12
Rights Conveyed:
Grantee:
Grantor:
Financing Description: Cash to Seller
Rentable Building Area (SF): 10,182 Year Built: 1980/2003
Occupancy: 0% Property Condition: Good
Land to Building Ratio: 39.74 : 1.00 No of Stories: One (1)
Gross Land Area (Acres): 9.2900 Gross Land Area (SF): 404,672
Per SF
Gross Potential Income: $ 155,276 $15.25
Vacancy Allowance: (7,764) ($0.76)
Effective Gross Income: 147,512 $14.49
Operating Expenses: (7,637) ($0.75)
Net Operating Income: 139,875 $13.74
Expense Ratio: 5.18% Monthly Rent PSF: $15.25
Gross Income Multiplier: 10.92
Overall Capitalization Rate: 8.25%
Sale Comment: The property is located along the south line of Wild Basin Road, between South
Capital of Texas Highway and Bee Cave Road. Income and Expenses are based on
proforma estimates. Please note this transaction represents a purchase of three (3)
buildings.
C O M P A R A B L E S A L E 4Location Information
Sale Information
Fee Simple
Tanya Chika Otti
205 Wild Basin, Inc
Property Information
Income & Expense Proforma
Comments

HCP Realty Advisors Page 66
Bohl's Plaza Market Type: Large - Urban
3809 Juniper Trace Tax IDs/APNs: 455403
Bee Cave, TX 78738 Property Type: Office
Sale Price: $2,300,000 Sale Price/SF Rentable: $174.24
Sale Status: Closed Document No.: 2012078999
Recording Date: May-12
Rights Conveyed:
Grantee:
Grantor:
Financing Description: Cash to Seller
Rentable Building Area (SF): 13,200 Year Built: 2003
Occupancy: 0% Property Condition: Good
Land to Building Ratio: 3.30 : 1.00 No of Stories: Two (2)
Gross Land Area (Acres): 1.0000 Gross Land Area (SF): 404,672
Per SF
Gross Potential Income: $ 198,000 $15.00
Vacancy Allowance: (9,900) ($0.75)
Effective Gross Income: 188,100 $14.25
Operating Expenses: (6,600) ($0.50)
Net Operating Income: 181,500 $13.75
Expense Ratio: 3.51% Monthly Rent PSF: $15.00
Gross Income Multiplier: 11.62
Overall Capitalization Rate: 7.89%
Sale Comment: The property is located along the north line of Juniper Trace, between Bee Cave
Parkway and Bee Cave Road. Income and expenses are based on proforma estimates.
.
C O M P A R A B L E S A L E 5 Location Information
Sale Information
Fee Simple
Mosak Marketing Group, Inc
Trinity 162 Hc, LTD
Property Information
Income & Expense Proforma
Comments

HCP Realty Advisors Page 67
21222 Gathering Oak Market Type: Large - Urban
21222 Gathering Oak Tax IDs/APNs: 1101426
San Antonio, TX 78260 Property Type: Office
Sale Price: $1,300,000 Sale Price/SF Rentable: $216.67
Sale Status: Current Listing Document No.: N/A
Recording Date: N/A
Rights Conveyed:
Grantee:
Grantor:
Financing Description: Cash to Seller
Rentable Building Area (SF): 6,000 Year Built: 2007
Occupancy: 0% Property Condition: Good
Land to Building Ratio: 3.82 : 1.00 No of Stories: One (1)
Gross Land Area (Acres): 0.5261 Gross Land Area (SF): 115,870
Per SF
Gross Potential Income: $ 108,000 $18.00
Vacancy Allowance: (5,400) ($0.90)
Effective Gross Income: 102,600 $17.10
Operating Expenses: (3,000) ($0.50)
Net Operating Income: 99,600 $16.60
Expense Ratio: 2.92% Monthly Rent PSF: $18.00
Gross Income Multiplier: 12.04
Overall Capitalization Rate: 7.66%
Sale Comment:
CommentsThe property is located along the east line of Gathering Oak, between Blanco Road
and Ranch Oak. Income and Expenses are based on proforma estimates.
C O M P A R A B L E S A L E 6 - CURRENT LISTINGLocation Information
Sale Information
Fee Simple
N/A
Bomgaars Enterprises, LLC
Property Information
Income & Expense Proforma

HCP Realty Advisors Page 68
Comparable Sales Location Map

HCP Realty Advisors Page 69
21222 Gathering Oak
San Antonio, TX 78260
C O M P A R A B L E S A L E P H O T O S
C O M P A R A B L E S A L E 1 C O M P A R A B L E S A L E 4
21708 Hardy Oak Boulevard 205 Wild Basin Road
5524 Highway 290 West
Austin, TX 78735
21708 Hardy Oak Boulevard
New Braunfels, TX 78130
C O M P A R A B L E S A L E 5
180 West Mill Street 3809 Juniper Trace
205 Wild Basin Road
San Antonio, TX 78258
C O M P A R A B L E S A L E 2
C O M P A R A B L E S A L E 3
5524 Highway 290 West
Bee Cave, TX 78738
Austin, TX 78746
180 West Mill Street Bohl's Plaza
C O M P A R A B L E S A L E 6 - CURRENT LISTING
21222 Gathering Oak

HCP Realty Advisors Page 70
Discussion and Analysis The following categories were considered and evaluated for the purposes of determining the value of the subject improvements.
TRANSACTIONAL ADJUSTMENTS Property Rights Conveyed Adjustments are only necessary if property rights are leased fee ownership. An upward
adjustment to a sale is applicable if the subject was not transferred as a fee simple estate,
downward adjustments are necessary when a sale was subject to retentions of certain property
rights by the seller.
Financing Terms The transaction price of one property may differ from that of an identical property due to different
financial arrangements. In some cases buyers pay higher prices for properties to obtain below
market financing. Conversely, interest rates at above-market levels often result in lower sales
prices. A condition of sale adjustment recognizes that some sales are transacted by parties under
duress, who are at a disadvantage. A combined adjustment results when favorable financing is a
function of the sellers' need to sell the property quickly. Most sales involved terms by which the
seller received cash or its equivalent at a typical market interest rate and term mortgage.
Conditions of Sale Adjustments for conditions of sale usually reflect the motivations of the buyer and seller. When
non-market conditions of sale are detected in a transaction, the sale must be thoroughly
researched before an adjustment is made, and the conditions must be adequately disclosed.
Conditions of sale adjustments are rare.
Time/Market Conditions Comparable sales that occurred under different market conditions than those applicable to the
subject on the effective date of value estimate require adjustment for any differences that affect
their values. An adjustment for market conditions is made if, since the time the comparable sales
were transacted, general property values have appreciated or depreciated due to inflation or
deflation or investors’ perceptions of the market have changed.

HCP Realty Advisors Page 71
PROPERTY ADJUSTMENTS Location A property’s location is analyzed in the relation to the location of other properties. Although no
location is inherently desirable or undesirable, an appraiser can conclude that the market
recognizes that one location is superior than, or inferior than or similar to another. The sales were
adjusted accordingly for their location characteristics.
Physical Characteristics The physical characteristics of a comparable property and the subject property differ in many ways; each of these differences may require comparison and adjustment. Physical differences
include differences in quality of construction, architectural style, building materials, age,
condition, functional utility, site size, attractiveness, and amenities. On-site environmental
conditions may also be considered. Additionally, sales are adjusted for size as compared to the
subject with smaller sites requiring a downward adjustment and larger sites requiring an upward
adjustment.
Economic Characteristics Economic characteristics include all the attributes of a property that affect its income. This
element of comparison is usually applied to income-producing properties. Characteristics that
affect a property’s income include operating expenses, quality of management, tenant mix, rent
concessions, lease terms, lease expiration dates, renewal options, and lease provisions such as
expense recovery clauses. Investigation of these characteristics is critical to proper analysis of the
comparables and development of a final value estimate.
Appraisers must take care not to attribute differences in real property rights conveyed or changes
in market conditions to different economic characteristics. Caution must also be exercised in
regard to units of comparison such as net operating income per unit. NOI’s per unit reflect a mix
of interactive economic’ attributes, many of which should only be analyzed in the income
capitalization approach. Sales comparison analysis must not be presented simply as a variation of
the income capitalization approach, applying the same techniques to reach an identical value
indication.
Use To qualify as comparables properties, the highest and best use of the properties should be similar.
Additionally factors such as water and riparian rights, environmental conditions, building codes,
and flood zones must also be considered.
Non Realty Components of Value Non realty components of value include chattel, business concerns, and other items that do not
constitute real property but are included in either the sales price of the comparable property of the
ownership interest in the subject property.
The following table summarizes our adjustments for each of the comparable sales.
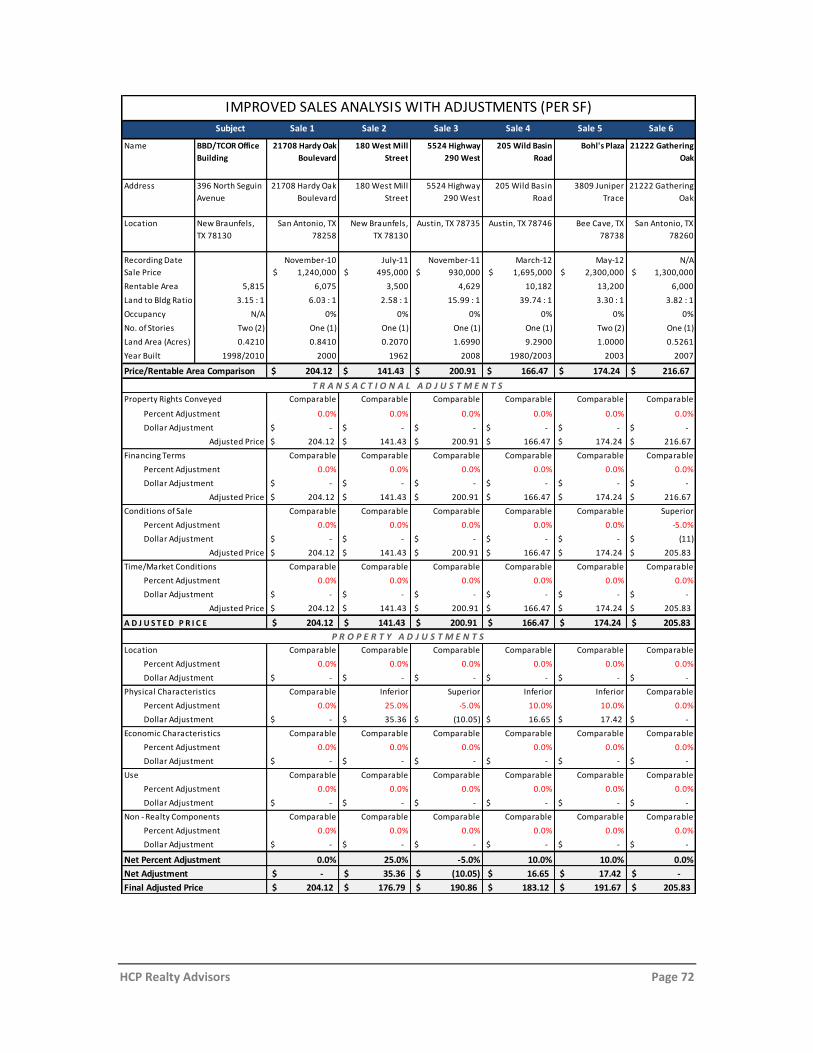
HCP Realty Advisors Page 72
Subject Sale 1 Sale 2 Sale 3 Sale 4 Sale 5 Sale 6
Name BBD/TCOR Office
Building
21708 Hardy Oak
Boulevard
180 West Mill
Street
5524 Highway
290 West
205 Wild Basin
Road
Bohl's Plaza 21222 Gathering
Oak
Address 396 North Seguin
Avenue
21708 Hardy Oak
Boulevard
180 West Mill
Street
5524 Highway
290 West
205 Wild Basin
Road
3809 Juniper
Trace
21222 Gathering
Oak
Location New Braunfels,
TX 78130
San Antonio, TX
78258
New Braunfels,
TX 78130
Austin, TX 78735 Austin, TX 78746 Bee Cave, TX
78738
San Antonio, TX
78260
Recording Date November-10 July-11 November-11 March-12 May-12 N/A
Sale Price $ 1,240,000 $ 495,000 $ 930,000 $ 1,695,000 $ 2,300,000 $ 1,300,000
Rentable Area 5,815 6,075 3,500 4,629 10,182 13,200 6,000
Land to Bldg Ratio 3.15 : 1 6.03 : 1 2.58 : 1 15.99 : 1 39.74 : 1 3.30 : 1 3.82 : 1
Occupancy N/A 0% 0% 0% 0% 0% 0%
No. of Stories Two (2) One (1) One (1) One (1) One (1) Two (2) One (1)
Land Area (Acres) 0.4210 0.8410 0.2070 1.6990 9.2900 1.0000 0.5261
Year Built 1998/2010 2000 1962 2008 1980/2003 2003 2007
$ 204.12 $ 141.43 $ 200.91 $ 166.47 $ 174.24 $ 216.67
Comparable Comparable Comparable Comparable Comparable Comparable
0.0% 0.0% 0.0% 0.0% 0.0% 0.0%
$ - $ - $ - $ - $ - $ -
$ 204.12 $ 141.43 $ 200.91 $ 166.47 $ 174.24 $ 216.67
Comparable Comparable Comparable Comparable Comparable Comparable
0.0% 0.0% 0.0% 0.0% 0.0% 0.0%
$ - $ - $ - $ - $ - $ -
$ 204.12 $ 141.43 $ 200.91 $ 166.47 $ 174.24 $ 216.67
Comparable Comparable Comparable Comparable Comparable Superior
0.0% 0.0% 0.0% 0.0% 0.0% -5.0%
$ - $ - $ - $ - $ - $ (11)
$ 204.12 $ 141.43 $ 200.91 $ 166.47 $ 174.24 $ 205.83
Comparable Comparable Comparable Comparable Comparable Comparable
0.0% 0.0% 0.0% 0.0% 0.0% 0.0%
$ - $ - $ - $ - $ - $ -
$ 204.12 $ 141.43 $ 200.91 $ 166.47 $ 174.24 $ 205.83
A D J U S T E D P R I C E 204.12$ 141.43$ 200.91$ 166.47$ 174.24$ 205.83$
Comparable Comparable Comparable Comparable Comparable Comparable
0.0% 0.0% 0.0% 0.0% 0.0% 0.0%
$ - $ - $ - $ - $ - $ -
Comparable Inferior Superior Inferior Inferior Comparable
0.0% 25.0% -5.0% 10.0% 10.0% 0.0%
$ - $ 35.36 $ (10.05) $ 16.65 $ 17.42 $ -
Comparable Comparable Comparable Comparable Comparable Comparable
0.0% 0.0% 0.0% 0.0% 0.0% 0.0%
$ - $ - $ - $ - $ - $ -
Comparable Comparable Comparable Comparable Comparable Comparable
0.0% 0.0% 0.0% 0.0% 0.0% 0.0%
$ - $ - $ - $ - $ - $ -
Comparable Comparable Comparable Comparable Comparable Comparable
0.0% 0.0% 0.0% 0.0% 0.0% 0.0%
$ - $ - $ - $ - $ - $ -
0.0% 25.0% -5.0% 10.0% 10.0% 0.0%
-$ 35.36$ (10.05)$ 16.65$ 17.42$ -$
204.12$ 176.79$ 190.86$ 183.12$ 191.67$ 205.83$
Percent Adjustment
Non - Realty Components
Percent Adjustment
Dollar Adjustment
Dollar Adjustment
Dollar Adjustment
Economic Characteristics
Percent Adjustment
Dollar Adjustment
IMPROVED SALES ANALYSIS WITH ADJUSTMENTS (PER SF)
Financing Terms
Percent Adjustment
Adjusted Price
Conditions of Sale
Price/Rentable Area Comparison
Property Rights Conveyed
Adjusted Price
Dollar Adjustment
Percent Adjustment
Dollar Adjustment
Percent Adjustment
Percent Adjustment
Dollar Adjustment
T R A N S A C T I O N A L A D J U S T M E N T S
P R O P E R T Y A D J U S T M E N T S
Net Percent Adjustment
Net Adjustment
Final Adjusted Price
Adjusted Price
Percent Adjustment
Location
Time/Market Conditions
Dollar Adjustment
Adjusted Price
Dollar Adjustment
Use
Percent Adjustment
Physical Characteristics

HCP Realty Advisors Page 73
IMPROVEMENT VALUATION SUMMARY
Conclusion
The subject property as improved was compared to six (6) sales of office properties having
similar characteristics and located in comparable alternative locations as the subject. The sales
were chosen based upon similarity of use, timeliness of sales activity and location issues. Based
on the prior analysis, our conclusion of value per the Sales Comparison Approach is as follows:
MARKET VALUE CONCLUSION
$ 1,130,000
Number of Comparable Sales 6
Maximum 205.83$
Mean (Average) 192.06$
Minimum 176.79$
Rentable Area 5,815
Indicated Subject Value Per Unit SF 195.00$
Indicated Subject Value 1,133,925$
Indicated Value ROUNDED 1,130,000$
PRICE PER SQUARE FOOT COMPARISON
INDICATED SUBJECT VALUE

HCP Realty Advisors Page 74
Reconciliation and Final Concluded Value
The pertinent approaches to value have been summarized in this appraisal analysis. A summary of the
value conclusions of each of these individual approaches indicates the following:
Cost Approach - The cost of reproducing or replacing the
subject property, less depreciation from all sources, plus
the land value as determined through market comparison.
N/A
Income Approach - The value which can be supported by
the property's net earning capacity, based upon
capitalization of the net income imputable to the property.
$ 1,130,000 – As Is
Direct Sales Comparison Approach - The value as
indicated by recent sales of comparable properties, as
adjusted to account for all differences in physical, location
and economic characteristics.
$ 1,130,000 – As Is
For the purpose of this analysis we have placed emphasis on the Income and Sales approaches to value.
Therefore, the market value of the subject has been concluded as follows:
MARKET VALUE CONCLUSION – AS IS
Appraisal Premise Interest Appraised Effective Date Value Conclusion
As Is Fee Simple September 5, 2012 $ 1,130,000
INSURABLE VALUE – AS IS
Appraisal Premise Interest Appraised Effective Date Value Conclusion
As Is N/A September 5, 2012 $ 610,000
HCP Realty Advisors Page 75
ADDENDA ITEMS
Qualifications
Subject Photos
Plat Map
Engagement Letter
Floor Plan
Insurable Value Analysis
Survey

HCP Realty Advisors Page 76
Christopher T. Harman, MAI, CCIM Qualifications
EXPERIENCE
2001 - CURRENT Principal of HCP Realty Advisors with offices in Houston, Dallas and Austin, Texas specializing in commercial real estate advisory services including valuation, corporate services and transacti onal services.
1995 – 2001 Mr. Harman was in charge of global real estate for Enron Corporation based in Houston, Texas.
1989 – 1995 Mr. Harman was a senior real estate consultant with Lewis & Howard, a boutique valuation and advisory firm based in Houston, Texas.
EDUCATION
Southern Methodist University – Dallas, Texas Bachelor of Science – Economics with Finance Applications (1989)
PROPERTY TYPES APPRAISED
Office Buildings (CBD, Suburban, Single Tenant) Office Condominiums Limited Service & Full Service Hotels Multi-Family (Mid-Rise, High-Rise & Garden Style) Proposed Development Data Centers Convenience Stores Vacant Land Assisted Living Seniors Housing LIHTC (Section 42) – Affordable Housing Specialty Subdivisions Industrial Properties Car washes Self Storage Facilities Automobile dealerships Complex Mixed Use Projects Excess & Surplus Land Scenarios Historic properties Retail Pad Sites Restaurants Market/Feasibility Studies Special Use Properties
ORGANIZATIONS & MEMBERSHIPS
MAI Designation – Appraisal Institute State of Texas Certified General Real Estate Appraiser – TX-1325053-G CCIM Designation – Certified Commercial Investment Member Member ICSC – International Council of Shopping Centers Licensed Property Tax Consultant – State of Texas Licensed Texas Broker – TREC 404200 Former Board Member – CoreNet, Treasurer – Houston Chapter President & Co-Founder - CoreNet Houston Foundation Real Estate Council of Austin – Active Member

HCP Realty Advisors Page 77
Christopher T. Harman, TX-1325053-G

HCP Realty Advisors Page 78
Kirk A. Garza Qualifications
EXPERIENCE
2008 - CURRENT
Senior Director of HCP Realty Advisors with offices in Houston, Dallas and Austin, Texas specializing in commercial real estate advisory services including valuation, corporate services and transactional services.
2007 - 2008
Mr. Garza was responsible for nationwide multifamily research and underwriting for Beckendorf Investments based in College Station, Texas.
EDUCATION
Texas A&M University – College Station, Texas Master of Real Estate – Land Economics and Real Estate (2007)
Texas A&M University – College Station, Texas Bachelor of Science – Economics (2006)
ORGANIZATIONS & MEMBERSHIPS
Associate Member– Appraisal Institute State of Texas Certified General Real Estate Appraiser – TX-1380039-G
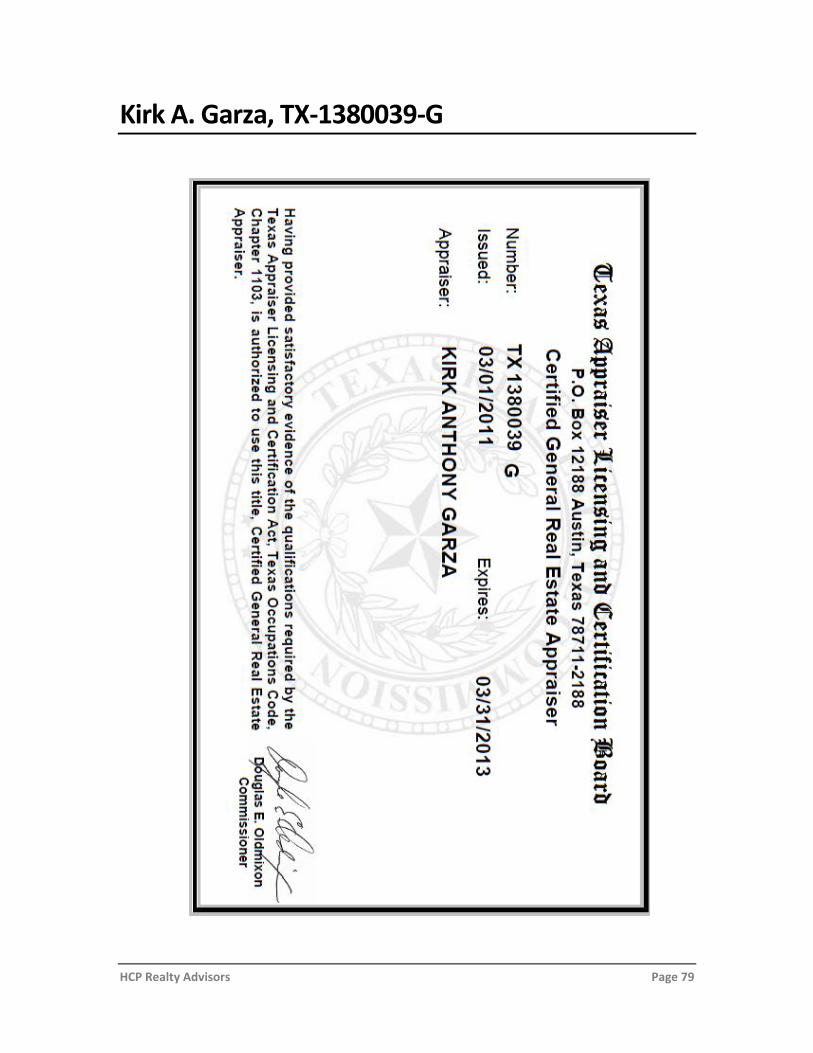
HCP Realty Advisors Page 79
Kirk A. Garza, TX-1380039-G

Subject Photographs
HCP Realty Advisors Page 80

Subject Photographs
HCP Realty Advisors Page 81

Subject Photographs
HCP Realty Advisors Page 82

Subject Photographs
HCP Realty Advisors Page 83

Subject Photographs
HCP Realty Advisors Page 84

Subject Photographs
HCP Realty Advisors Page 85

Subject Photographs
HCP Realty Advisors Page 86

Subject Photographs
HCP Realty Advisors Page 87

Plat Map
HCP Realty Advisors Page 88

Engagement Letter
HCP Realty Advisors Page 89

Engagement Letter
HCP Realty Advisors Page 90
Subject Property

Floor Plan
HCP Realty Advisors Page 91

Insurable Value Analysis
HCP Realty Advisors Page 92
Office Building Office Building
Section: 15 15
Page: 17 17
Building SF: 5,815 5,815
Building Type: Good Good
Building Class: D D
Average Story Height (Feet): 12 12
Average Ceiling Height (Feet): 12 12
Base Square Foot Cost $117.07 $117.07
Additional Costs/Add Ons
Tenant Improvements $0.00 $0.00
TBD $0.00 $0.00
TBD
Other
Subtotal Base Cost $117.07 $117.07
Number of Stories Multiplier 1.00 1.00
Story Height Multiplier 1.00 1.00
Area/Perimeter Multiplier 1.00 1.00
Combined height and size multiplier 1.00 1.00
Adjusted Base Cost: $117.07 $117.07
Current Cost Multiplier: 1.00 1.00
Local Cost Multiplier: 1.00 1.00
Final Base Cost: $117.07 $117.07
Non-Perishable Items: 0.90 0.90
Plus/Minus Additional Factor 1 1.00 1.00
Adjusted Replacement Cost $105.36 $105.36
Insurable Value By Building (s)
Total Insurable Value $610,000
INSURABLE VALUE ANALYSISBBD/TCOR Office Building
Source: Marshall Valuation Service
396 North Seguin Avenue
New Braunfels, TX 78130
$612,668
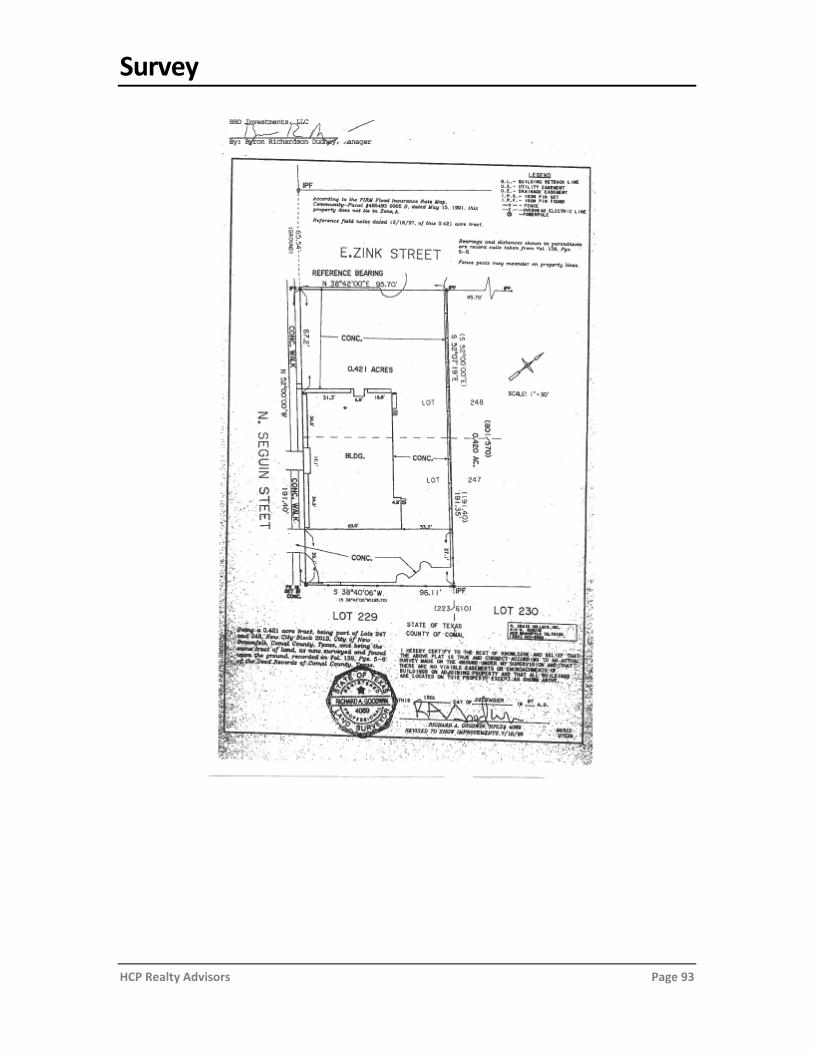
Survey
HCP Realty Advisors Page 93